Report on Galeras (Colombia) — April 2012
Bulletin of the Global Volcanism Network, vol. 37, no. 4 (April 2012)
Managing Editor: Richard Wunderman.
Edited by Julie A. Herrick.
Galeras (Colombia) Frequent seismic swarms, elevated SO2; ash explosions begin in May 2012
Please cite this report as:
Global Volcanism Program, 2012. Report on Galeras (Colombia) (Herrick, J.A., and Wunderman, R., eds.). Bulletin of the Global Volcanism Network, 37:4. Smithsonian Institution. https://doi.org/10.5479/si.GVP.BGVN201204-351080
Galeras
Colombia
1.22°N, 77.37°W; summit elev. 4276 m
All times are local (unless otherwise noted)
Our last report focused on the VEI 2 eruption of August 2010 as well as results from regular monitoring through May 2011 by the Instituto Colombiano de Geología y Minería (INGEOMINAS) based in Pasto, the provincial capital located ~10 km E of Galeras. Here we discuss the continuing efforts to monitor Galeras from June 2011 through April 2012. We highlight regular measurements from telemetered tiltmeter data, SO2 flux values, and earthquake cataloging and analysis. Additional monitoring activities, including radon gas assessments and thermal measurements, were conducted by INGEOMINAS and reported in weekly and monthly reports online. We briefly mention ash explosions that began on 13 May 2012.
April 2011-April 2012 Seismicity. During this reporting period, INGEOMINAS characterized five types of earthquake events: volcano-tectonic (VT), long-period (LP), tremor (TRE), hybrid (HYB), and tornillo (TOR). This data is available in online reports on the INGEOMINAS website for various years.
Earthquakes during this time were rarely deeper than 20 km and clustered ~2 km below the summit, and at times, ranging 5-8 km (table 13). Seismicity was dominated by hybrid events, signals characterizing fracturing and fluid movement. Tremor frequently occurred from May-July 2011 and December 2011-January 2012. From January-March 2012, the duration of tremor was longer than 800 minutes/month (table 13). LP events occurred most frequently in April 2011 and February 2012; VT events primarily appeared in March and April 2012. Tornillo events had been rare in 2011 but were the cause for alarm in November 2011 when INGEOMINAS detected 18 events. The seismic pattern of "tornillo-type" earthquakes has been associated with pre-eruptive conditions - in particular, explosive activity in 1992 and 2010 was preceded by episodes of tornillos (BGVN 34:12). The Alert Level was raised in November (to Orange, on a four-color scale) but lowered again in December (to Yellow) when these signals disappeared from the records; only two events were recorded in December 2011, then again in February 2012.
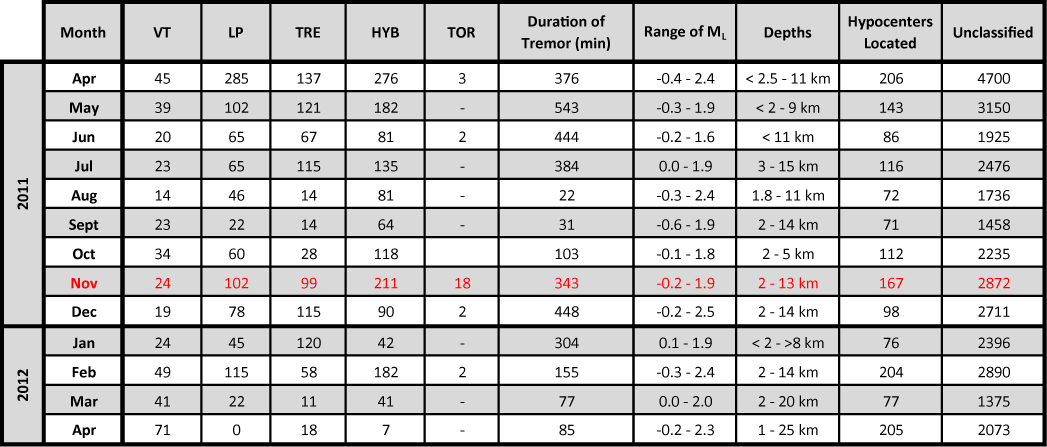 |
Table 13. Seismicity at Galeras from April 2011 through April 2012. Earthquake counts for five types of events: volcano-tectonic (VT), long-period (LP), tremor (TRE), hybrid (HYB), and tornillos (TOR). The Alert Level was raised to Orange in November (highlighted in red). Tornillos occurred rarely during this reporting period; "-" indicates events were not reported. Courtesy of INGEOMINAS. |
June 2011. INGEOMINAS reported that seismic energy was relatively low this month compared to May 2011. Inflation and deformation events were recorded by two tilt stations (Cráter and Calabazo); other stations, however, were stable (see figure 116 for monitoring station locations). The most proximal tilt station, Cráter, recorded the largest changes in deformation, and especially the radial component (often an order of magnitude larger than the tangential component). During this reporting period, INGEOMINAS frequently included data from the two component tiltmeters and calculated the vectors for Cráter (see INGEOMINAS online reports).
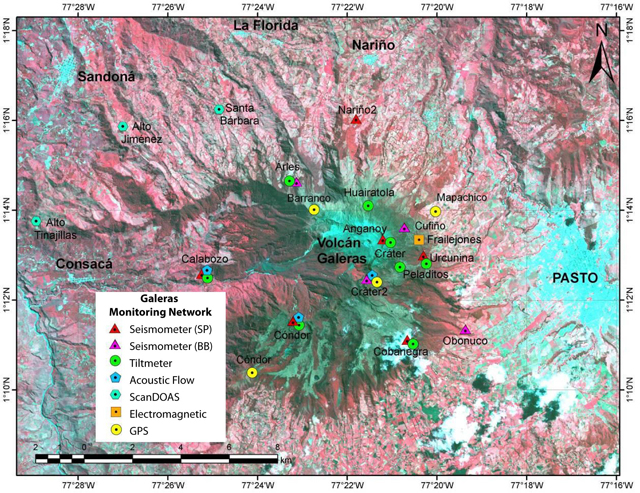 |
Figure 116. Map of station locations for the INGEOMINAS Pasto monitoring network (from the April 2012 online monthly report). Instrumentation includes: seismometers (SP = short period, BB = broadband), tiltmeters, acoustic flow, ScanDOAS, electromagnetic potential, and Global Positioning System (GPS) stations, as indicated in the legend. This map does not include all monitoring sites, for example fixed stations for Radon and EDM are also part of the network with results posted online. Courtesy of INGEOMINAS. |
Large amounts of steam and gas rose from Galeras' crater in June; a plume was frequently observed with a height up to 400 m above the crater. The plume was primarily water vapor, and measurements of SO2 flux showed high variability. INGEOMINAS reported values from ScanDOAS and MobileDOAS ranging from 41-1,455 tons/day; a total of 22 measurements with wind direction and velocity were taken between 1-30 June. The maximum measurement of SO2 flux was made by ScanDOAS from the Santa Bárbara station located 7.0 km NNW from the summit. The minimum value was measured along a traverse with MobileDOAS between the towns La Buitrera and Sandoná (see figure 116 for locations, La Buitera is beyond the map).
July 2011. Seismic energy was 75% higher in July compared with calculations in June. A low-energy seismic swarm of LP events was recorded during 18-19 July. Seismic swarms have occurred periodically at Galeras, the last episode was recorded in early April 2011; this was also the last time tornillo earthquakes were detected (table 13). Deformation continued with fluctuations, however, fieldwork was necessary to reinstall the Cráter tiltmeter (located 0.8 km E of the main crater and at 4,060 m above sea level) when it was disrupted by electric storms on 11 July 2011; the tiltmeter was back online on 20 July.
During clear conditions, a steam plume was visible from Galeras which reached a maximum of 1.5 km above the crater. The maximum SO2 flux for July was 1,080 tons/day which was obtained on 11 July at the Santa Bárbara station with ScanDOAS. A total of 15 measurements with wind direction and velocity were taken between 6 and 23 July. The minimum measurement of SO2 flux was made on 19 July by ScanDOAS, also from the Santa Bárbara station (stations Alto Jiménez and Alto Tinajillas were also recording values).
August 2011. An hour-long seismic swarm was recorded starting at 1800 on 24 August. INGEOMINAS classified these earthquakes as primarily long-period, suggesting that hydrothermal processes were active beneath Galeras. Three of the tiltmeters (Cráter, Huairatola, and Calabozo) indicated deformation and two stations (Peladitos and Cobanegra) showed no change.
Emissions continued to be visible from the crater; a white plume was frequently observed that rose 800 m above the crater rim. SO2 levels were significantly low in August; INGEOMINAS calculated the maximum SO2 flux as 185 tons/day from the Santa Bárbara station on 3 August. A total of 26 measurements were recorded from 1 to 31 August. The lowest value, 25 tons/day, was recorded during a traverse along the northeastern route (between the towns of Genoy and Nariño) on 9 August with MobileDOAS.
September 2011. Seismicity continued at low levels and few earthquakes were large enough to locate (table 13). On 6 September a swarm of hybrid earthquakes was recorded; this was a small episode that occurred between 0600 and 0800. Tilt stations Cráter and Huairatola recorded fluctuations while Calabozo, Peladitos, and Cobanegra showed no significant changes.
The summit was visible for much of September; the plume rose typically less than 500 m above the crater. According to INGEOMINAS, SO2 levels were low in September. A total of 16 measurements were recorded by ScanDOAS from one fixed station (Santa Bárbara station), flux ranged from 51-225 tons/day.
October 2011. INGEOMINAS reported that an earthquake swarm occurred during 25-30 October. Events were characterized as hybrids, suggesting fluid movement and hydrothermal processes; hypocenters were very shallow, less than 2 km beneath the crater. Tilt stations Cráter, Huairatola, and Calabozo recorded fluctuations while Peladitos and Urcunina showed no significant changes.
In October, conditions were favorable for observing the summit area of Galeras. A column of white vapor was visible during most of the month; the plume rose to a height of 800 m above the rim. SO2 flux was relatively low; 19 values were recorded between 1-31 October. The maximum value was 340 tons/day as recorded on 1 October by the Alto Jiménez station (located 10.8 km NW of the summit). The lowest value, 32 tons/day, was recorded at the Santa Bárbara station on 10 October.
November 2011.INGEOMINAS continued registering swarms of shallow VT earthquakes. These events were primarily located at depths less than 1 km from the crater with magnitudes
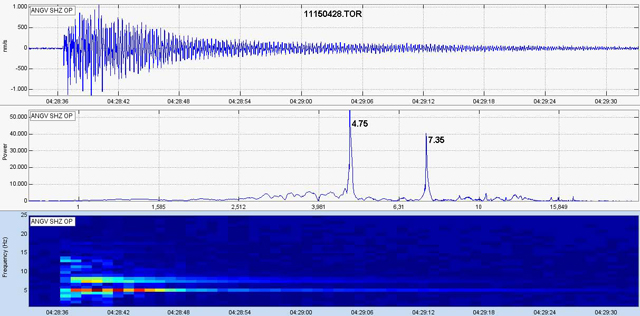 |
Figure 117. Seismogram, energy peaks, and spectrogram of the frequency of a tornillo event recorded on 14 November 2011 at 2328 from Galeras. Courtesy of INGEOMINAS. |
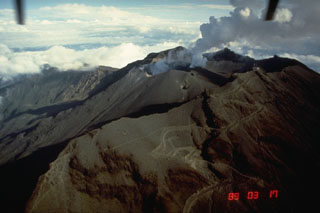
Several overflights of the crater were conducted in November by INGEOMINAS along with the Colombian Air Force (figure 118). During these flights, staff observed conditions within the crater and noted a strong sulfur odor. Thermal anomalies were detected with a forward-looking infrared (FLIR) camera; on 2 and 26 November, investigators recorded maximum temperatures around 200°C.
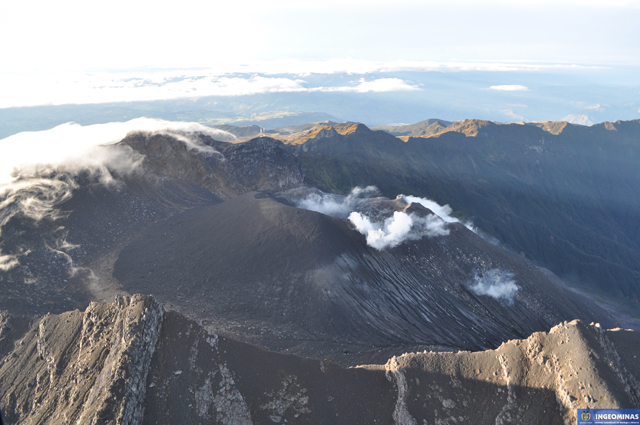 |
Figure 118. An aerial view of Galeras looking S toward a police station and towers on the crater rim. Photo taken during reconnaissance by INGEOMINAS on 2 November 2011. |
INGEOMINAS reported significant changes in tilt from the Cráter station (figure 119). Between 7 September and 30 November, there were variations between 3,720 and 920 µrad with increasing and decreasing trends for tangential and radial components, respectively. Trends were also recorded from stations: Peladitos, Huairatola, and Cobanegra. Stations Calabozo and Urcunina showed small fluctuations and were considered stable.
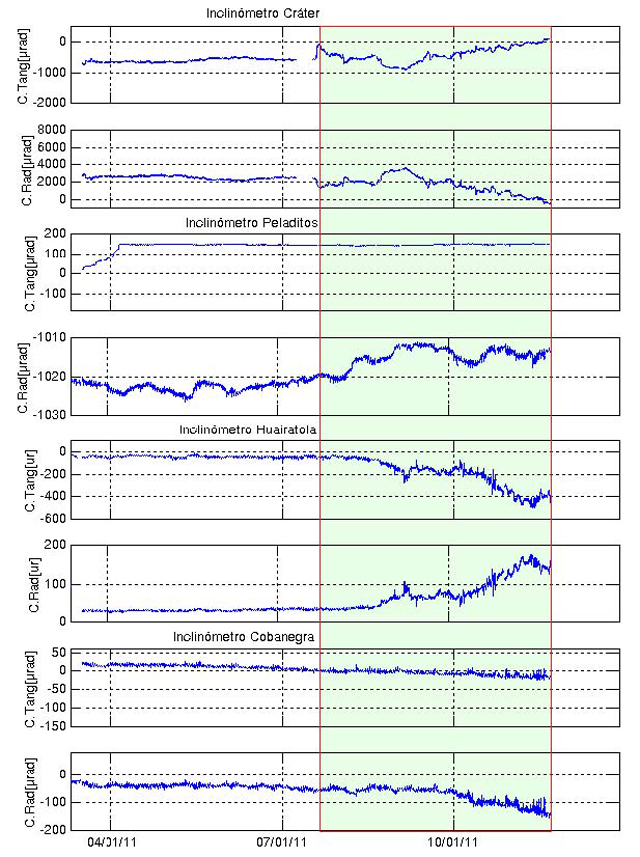 |
Figure 119. Galeras tiltmeter data (Radial and Tangential components are 'C.Rad' and 'C.Tang', respectively) from stations Cráter, Peladitos, Huairatola, and Cobanegra from April through November 2011. Courtesy of INGEOMINAS. |
INGEOMINAS reported that SO2 flux in November ranged from 5 to 178 tons/day. The highest values were recorded by stations implementing ScanDOAS; the Alto Jiménez station recorded the maximum on 5 November. The lowest value was from a MobileDOAS traverse along the Sandoná route on 30 November.
December 2011. The Alert Level was lowered from Orange to Yellow on 6 December due to reduced seismicity; tornillo events were no longer recorded. The tilt station Cráter continued to register changes. INGEOMINAS determined that the NE sector of the volcano exhibited deflation from 7 September to 24 November (figure 119) and beginning on 24 November a change occurred and inflation began. The records suggested that the Huairatola station was detecting deflation of the NE sector from 6 August to 31 December. Data from Cobanegra, from 28 February to 31 December, was also consistent with showing changes in the NE. The Peladitos, Urcunina, and Cóndor stations showed small variations and were considered stable.
In collaboration with the Colombian Air Force, INGEOMINAS conducted an overflight of the crater on 6 December. Several thermal images were taken with a FLIR camera (figure 120). The highest temperature recorded was 200°C.
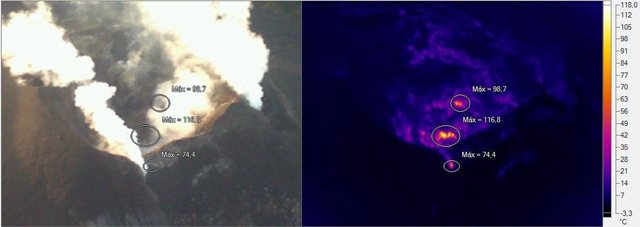 |
Figure 120. On 6 December 2012 INGEOMINAS retrieved thermal images of Galeras. In the FLIR image on the right, three maximum temperatures were captured: 116.8°C, 98.7°C, and 74.4°C. Courtesy of INGEOMINAS. |
Increased degassing was noted from two sites on the N edge of the crater, Paisita and Chavas (for a crater location map, see figure 87 in BGVN 23:01). SO2 flux was measured by three fixed ScanDOAS stations; a total of 12 measurements were recorded during 1-22 December. Emissions were low and ranging from 21 to 310 tons/day. INGEOMINAS recorded the maximum value from Alto Tinajillas (located 13.3 km W of the crater, figure 116) on 14 December; the minimum was from Santa Bárbara on 9 December.
January 2012. On 31 January, INGEOMINAS reported that a seismic swarm dominated by short-period VT events was recorded. Deformation detected by the Cráter station suggested three unique episodes where radial tilt was increasing, stabilized, and decreased. The tangential component exhibited an inversion of this trend: decreasing, stabilization, and increasing. INGEOMINAS calculated 657 µrad of inflation within the central crater, followed by stabilization and later, deflation measured as 264 µrad.
Steam continued to rise from Paisita and Chavas craters. A white plume was typically visible low over the crater however, on 5, 11, and 21 January, the plume height varied between 500 and 800 m. INGEOMINAS reported that SO2 flux continued at low levels, ranging from 32-259 tons/day. A total of 12 values were obtained from fixed ScanDOAS stations. The maximum value was recorded at the Santa Bárbara station on 27 January.
February 2012. Seismic swarms occurred in February consisting primarily of small, shallow events. At 2148 on 27 February the short-period seismic station Anganoy (located 0.8 km E of the crater, figure 116) recorded an event INGEOMINAS characterized as a 'pseudo-Tornillo'; this event had a dominant frequency of 4.1 Hz and a duration of 36 seconds.
Pseudo-tornillos appeared to be rare events and had occurred previously in November 2011. These have much shorter codas (tails) compared to those of the tornillo signals. The latter last up to several minutes, have small amplitudes compared to duration, and generally decay progressively so their seismic traces appear screw-like in appearance (tornillos is Spanish for screw). These features and various other subtypes and their diagnostic signal characteristics and names are discussed in Narváez and others (1997).
Deformation measured by the Cráter station recorded 774 µrad of deflation in the central crater. The Cobanegra station registered decreasing trends; the stations Peladitos, Urcunina, and Cóndor were considered stable.
A white plume from the crater was visible by webcameras and reached heights less than 800 m above the rim. SO2 flux in February remained low and ranged from 8 to 498 tons/day. A total of 27 values were recorded from fixed ScanDOAS and MobileDOAS measurements. The maximum flux was recorded on 22 February at the Alto Jiménez station.
March 2012. In March, seismic energy decreased by 89.1% compared to February, and few earthquakes were located. However, tremor continued (table 13). The Cráter tiltmeter recorded variability in early March, and from 22 to 31 March, 1,440 µrad of inflation was recorded within the central crater. The Cobanegra station recorded decreasing trends with both components while the stations Peladitos, Urcunina, Cóndor, Calabozo, and Arlés were considered stable.
A white plume was visible during most of the month except for four days. Plume height was maintained below 1.9 km. On 2 March, the National Park reported strong sulfur odors and also received alerts from the municipal committee of Sandoná that gas was noticeable.
Based on fixed and mobile detectors, INGEOMINAS reported that SO2 flux increased dramatically in March. A maximum of 3,390 tons/day was recorded by the Alto Jiménez station on 15 March. The lowest value recorded was 305 tons/day during a traverse along the Consaca-Sandoná route on 30 March. A total of 33 measurements were collected from 1 to 31 March.
April 2012. INGEOMINAS reported that seismic swarms occurred during 5-8 and 11-16 April consisting primarily of small, shallow VT events. The Cráter and Huairatola tilt stations registered variability suggesting inflation in the W sector of Galeras, an area known for high seismicity. The Cobanegra station recorded decreasing trends from both components between 85 and 430 µrad. The other stations were considered stable.
A white plume was frequently visible above the crater in April. Webcameras and observers recorded a maximum height of 2,000 m. On 16 April, the local committee for the prevention of disasters (CLOPAD) of the provincial capital, Pasto, received reports from inhabitants near the N flank of Galeras; gas emissions were visible and people could hear noises from the crater.
SO2 flux continued at elevated levels in April. INGEOMINAS recorded 33 measurements during April. A maximum of 1,477 tons/day was recorded at the Alto Jiménez station on 2 April. The highest levels of SO2 emissions were recorded within the first week of April, averaging 1,012 tons/day. The lowest value was recorded on 13 April, 10 tons/day, along the La Florida-Sandoná route with MobileDOAS.
Editor's Note: INGEOMINAS and the Washington Volcanic Ash Advisory Center (VAAC) reported that ash emissions were detected in early May 2012 (figure 121) and continued into early June.
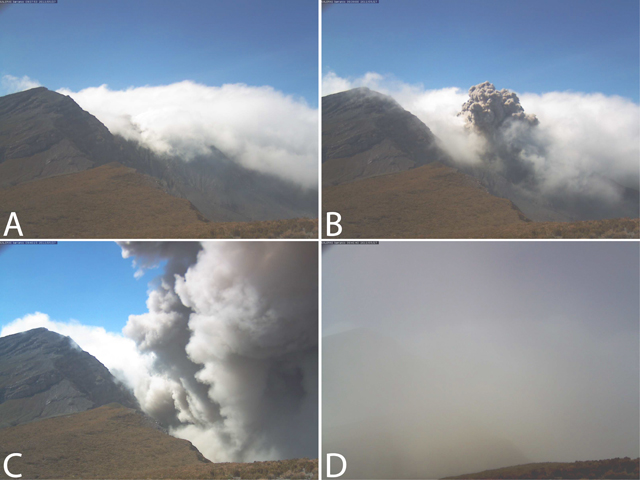 |
Figure 121. An ash explosion from Galeras was captured by the "Barranco" webcamera on 27 May 2012. This high-resolution camera was located on the NW rim of the crater. Timing of photo sequence: A. 09:37:53; B. 09:39:08; C. 09:40:15; D. 09:41:40. Courtesy of INGEOMINAS. |
Reference. Narváez, L.M., Torres, R.A., Gómez, D.M., Cortez, G.P., Cepeda, H.V., and Stix, J., 1997. 'Tornillo'-type seismic signals at Galeras volcano, Colombia, 1992-1993, Journal of Volcanology and Geothermal Research, 77: 159-171.
Geological Summary. Galeras, a stratovolcano with a large breached caldera located immediately west of the city of Pasto, is one of Colombia's most frequently active volcanoes. The dominantly andesitic complex has been active for more than 1 million years, and two major caldera collapse eruptions took place during the late Pleistocene. Long-term extensive hydrothermal alteration has contributed to large-scale edifice collapse on at least three occasions, producing debris avalanches that swept to the west and left a large open caldera inside which the modern cone has been constructed. Major explosive eruptions since the mid-Holocene have produced widespread tephra deposits and pyroclastic flows that swept all but the southern flanks. A central cone slightly lower than the caldera rim has been the site of numerous small-to-moderate eruptions since the time of the Spanish conquistadors.
Information Contacts: Instituto Colombiano de Geologia y Mineria (INGEOMINAS), Observatorio Vulcanológico y Sismológico de Pasto, Pasto, Colombia (URL: https://www2.sgc.gov.co/volcanes/index.html); Washington Volcanic Ash Advisory Center (VAAC), Satellite Analysis Branch (SAB), NOAA/NESDIS E/SP23, NOAA Science Center Room 401, 5200 Auth Rd, Camp Springs, MD 20746, USA (URL: http://www.ospo.noaa.gov/Products/atmosphere/vaac/).