Report on Nevado del Ruiz (Colombia) — July 2012
Bulletin of the Global Volcanism Network, vol. 37, no. 7 (July 2012)
Managing Editor: Richard Wunderman.
Edited by Julie A. Herrick.
Nevado del Ruiz (Colombia) 1988-2006 monitoring captures seismic swarms, deformation, and radon emissions
Please cite this report as:
Global Volcanism Program, 2012. Report on Nevado del Ruiz (Colombia) (Herrick, J.A., and Wunderman, R., eds.). Bulletin of the Global Volcanism Network, 37:7. Smithsonian Institution. https://doi.org/10.5479/si.GVP.BGVN201207-351020
Nevado del Ruiz
Colombia
4.892°N, 75.324°W; summit elev. 5279 m
All times are local (unless otherwise noted)
Our last report on Nevado del Ruiz (BGVN 27:05) focused on a swarm of earthquakes that occurred in June 2002, when the Instituto Colombiano de Geología y Minería (INGEOMINAS) raised the Alert Level to II ("Orange", on a scale from I-IV, where the highest Alert Level is I, "Red"). Monthly reports from the INGEOMINAS Manizales Observatory became available online beginning in March 2006 and continued through the time period covered in this report, March-December 2006. We also include the long-term datasets of deformation recorded from 1988 to 2006 and radon-gas monitoring from 2002 to 2006.
INGEOMINAS characterized overall activity at Nevado del Ruiz from March to December 2006 as limited to small earthquakes, minor rockfalls, and intermittent vapor plumes. They measured continuous deformation trends (primarily from 3 tilt stations), and low levels of radon-gas emissions with a peak in March 2006 at two stations. No Alert Level was defined for this time period.
Seismicity during 2006. INGEOMINAS reported that low seismicity generally prevailed from March through December 2006; 217-673 events occurred per month at depths of 6-10 km below the summit with maximum local magnitudes of 0.95-2.3. Long period (LP) events occurred slightly more often than volcano-tectonic (VT) events; 1-5 hybrid events were detected each month except in December when these events were absent. Tremor was recorded only once in September and twice in October.
Two small VT earthquake swarms were recorded, one in March and the other in May. The swarm on 9 March occurred as a cluster of events 2-4 km deep centered to the SE of the crater (figure 49). The swarm on 29 May was characterized by ~20 events located SE of the crater with magnitudes less than 1.02.
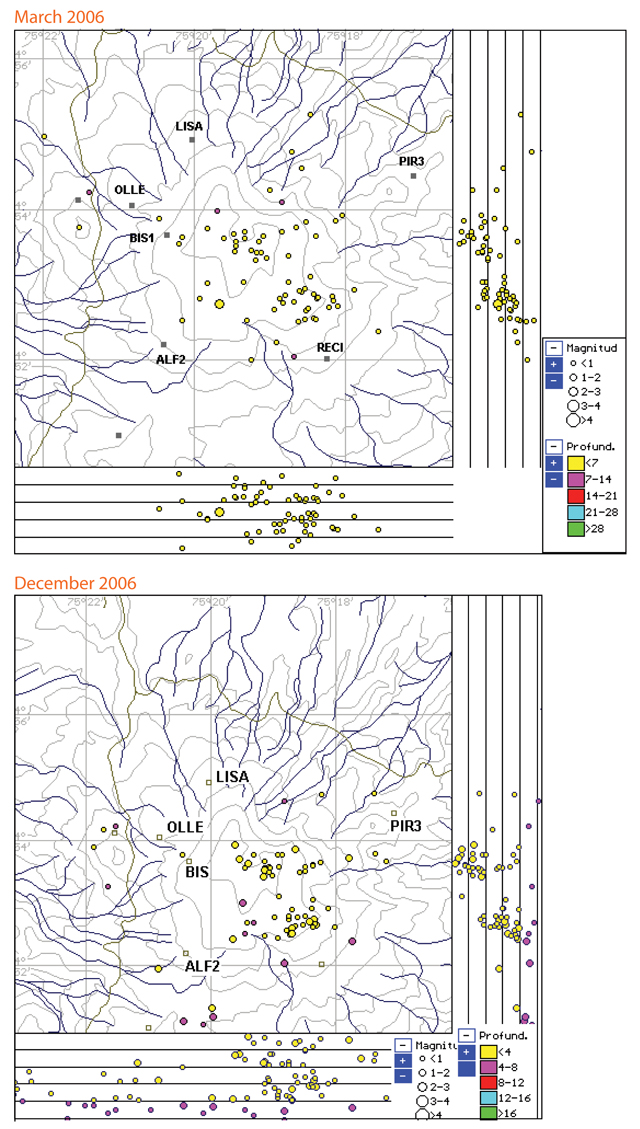 |
Figure 49. Maps and cross-sections showing epicenters and hypocenters for VT events detected at Nevado del Ruiz for March (top) and December (bottom) 2006. Note that the colored depth scales are different for the two months (labeled as "Profund." in each frame). The bottom and right-hand edges of the maps show vertical cross sections with horizontal lines at 2 km depth intervals. More earthquakes were located in March (647) than December 2006 (290), however, events as deep as 8 km were located in December. Courtesy of INGEOMINAS. |
Rockfalls, ice movement, and debris flows were also detected by the seismic network from March to December 2006. For these kinds of events, typically more than 250-600 per month were detected; however, fewer events were detected in April and June, 61 and 47 events respectively.
Vapor plumes in 2006. During most of 2006 vapor plumes were visible from the summit area of Nevado del Ruiz. Often appearing intermittently, these plumes were white or white-to-gray colored and reached 100-600 m over the crater rim. Plume emissions have been associated with the fumaroles within the summit crater.
Deformation summary. The deformation network at Nevado del Ruiz in March 2006 contained 12 dry tiltmeter stations (Piraña, Rubí, Bis, Molinos, Tumbas, Refugio, Nereidas, Pequeño, Pijao, Arenales, Alfombrales, and Recio) and four stations for leveling campaigns (Piraña, Bis, Tumbas, and Nereidas; figure 50). This network was developed to cover the W and N flanks; the S and E flanks did not have network coverage during this reporting period. Fieldwork was planned to include leveling at sites Arenales, Alfombrales, and Recio since they had not been occupied for several years. Four tilt stations showed inflation and deflation trends (Bis, Nereidas, Refugio, and Tumbas) and are discussed in the text below.
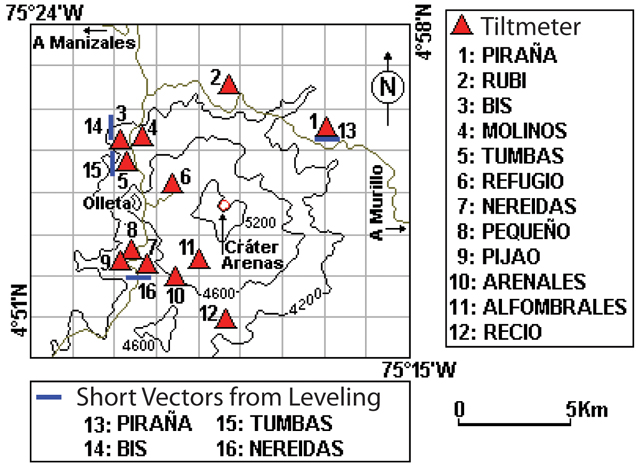 |
Figure 50. Map of station locations for deformation monitoring at Nevado del Ruiz. Tiltmeter stations (red triangles) are marked 1-12 while line-leveling stations (short blue lines indicating line orientation) are 13-16. Courtesy of INGEOMINAS. |
Tilt station Bis was established in late 1988 on the NW flank ~5.7 km NW of the active crater (figure 50). As seen on figure 51, inflation had been recorded at Bis from 1988 through 1999 with a cumulative tilt increase of as much as 40-60 microradians (µrad; figure 51). Since the beginning of 2000 until the end of 2004, this station recorded stable conditions with a small amount (4 µrad) of inflation. From 2004 through March 2006 there was another significant increase in the inflation trend; a cumulative 22 µrad N component and 15 µrad E component inflation.
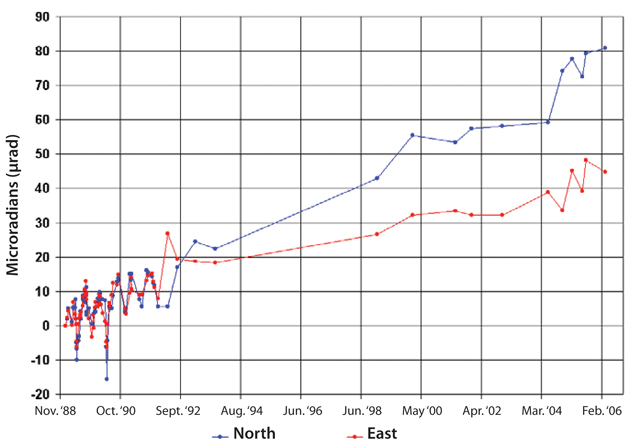 |
Figure 51. Deformation trends measured by the dry tilt station "Bis" (on the NW flank of Nevado del Ruiz) from 1988 to March 2006. N and E components are shown in blue and red, respectively. Courtesy of INGEOMINAS. |
Tilt station Nereidas was installed 4.6 km SW of the active crater and measured significant changes primarily from late March 1993 to March 2006. Inflation and deflation trends were recorded, 13 µrad N and 11 µrad E, respectively.
Station Refugio, located 2.6 km NW of the active crater, has primarily recorded stable conditions since 1990.
Station Tumbas was located on the NW flank of the volcano ~4.8 km from the crater. This station has shown deflation from both components since 2000. Since February 2005 the cumulative deflation of the N component was 7 µrad and 13 µrad in the E component. From 2005 to March 2006 there were fluctuations from this station within the measurable range of the tiltmeters.
Long-term radon gas measurements. Radon monitoring at Nevado del Ruiz has been based on six stations. In particular, INGEOMINAS has long records from stations Gualí and Hotel Termales since 2002 and 2003, respectively (figure 52). The locations of the radon gas sampling stations were not disclosed, however a 1986 map of instrumentation places the Hotel Termales (labeled "Termales" with a square and "X")and Río Gualí (marked with a circle near the river) stations within 12 km to the NW of the summit crater (figure 53). In March 2006, results from three radon monitoring sites suggested to INGEOMINAS that there was a possible correlation with the earthquake swarms detected on 9 March 2006. Stations Río Gualí, Gualí, and Rubí recorded an increase in radon emission on 5 March while stations Condor and Cajones maintained low levels (55 pico Curies per Liter, pCi/L). From April through December 2006, no major changes were noted in radon gas emissions.
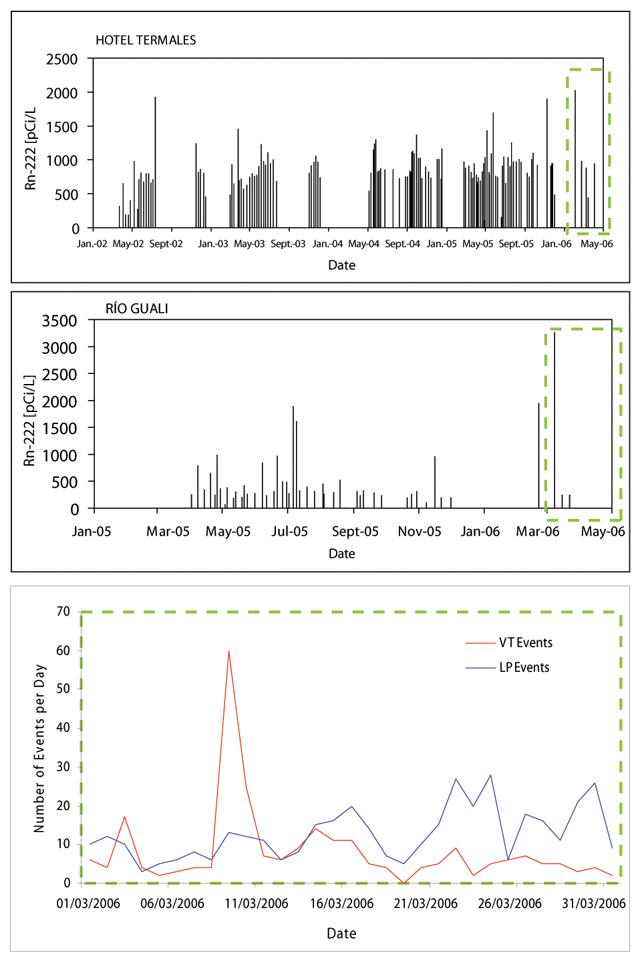 |
Figure 52. Nevado del Ruiz radon gas emission measurements (pico Curies per Liter, pCi/L) from stations Hotel Termales (January 2002-May 2006, top frame) and Río Gualí (January 2005-May 2006, middle frame) and daily earthquake counts for both VT and LP events for March 2006 (bottom frame). The green dashed squares indicate correlated time periods for each plot. Courtesy of INGEOMINAS. |
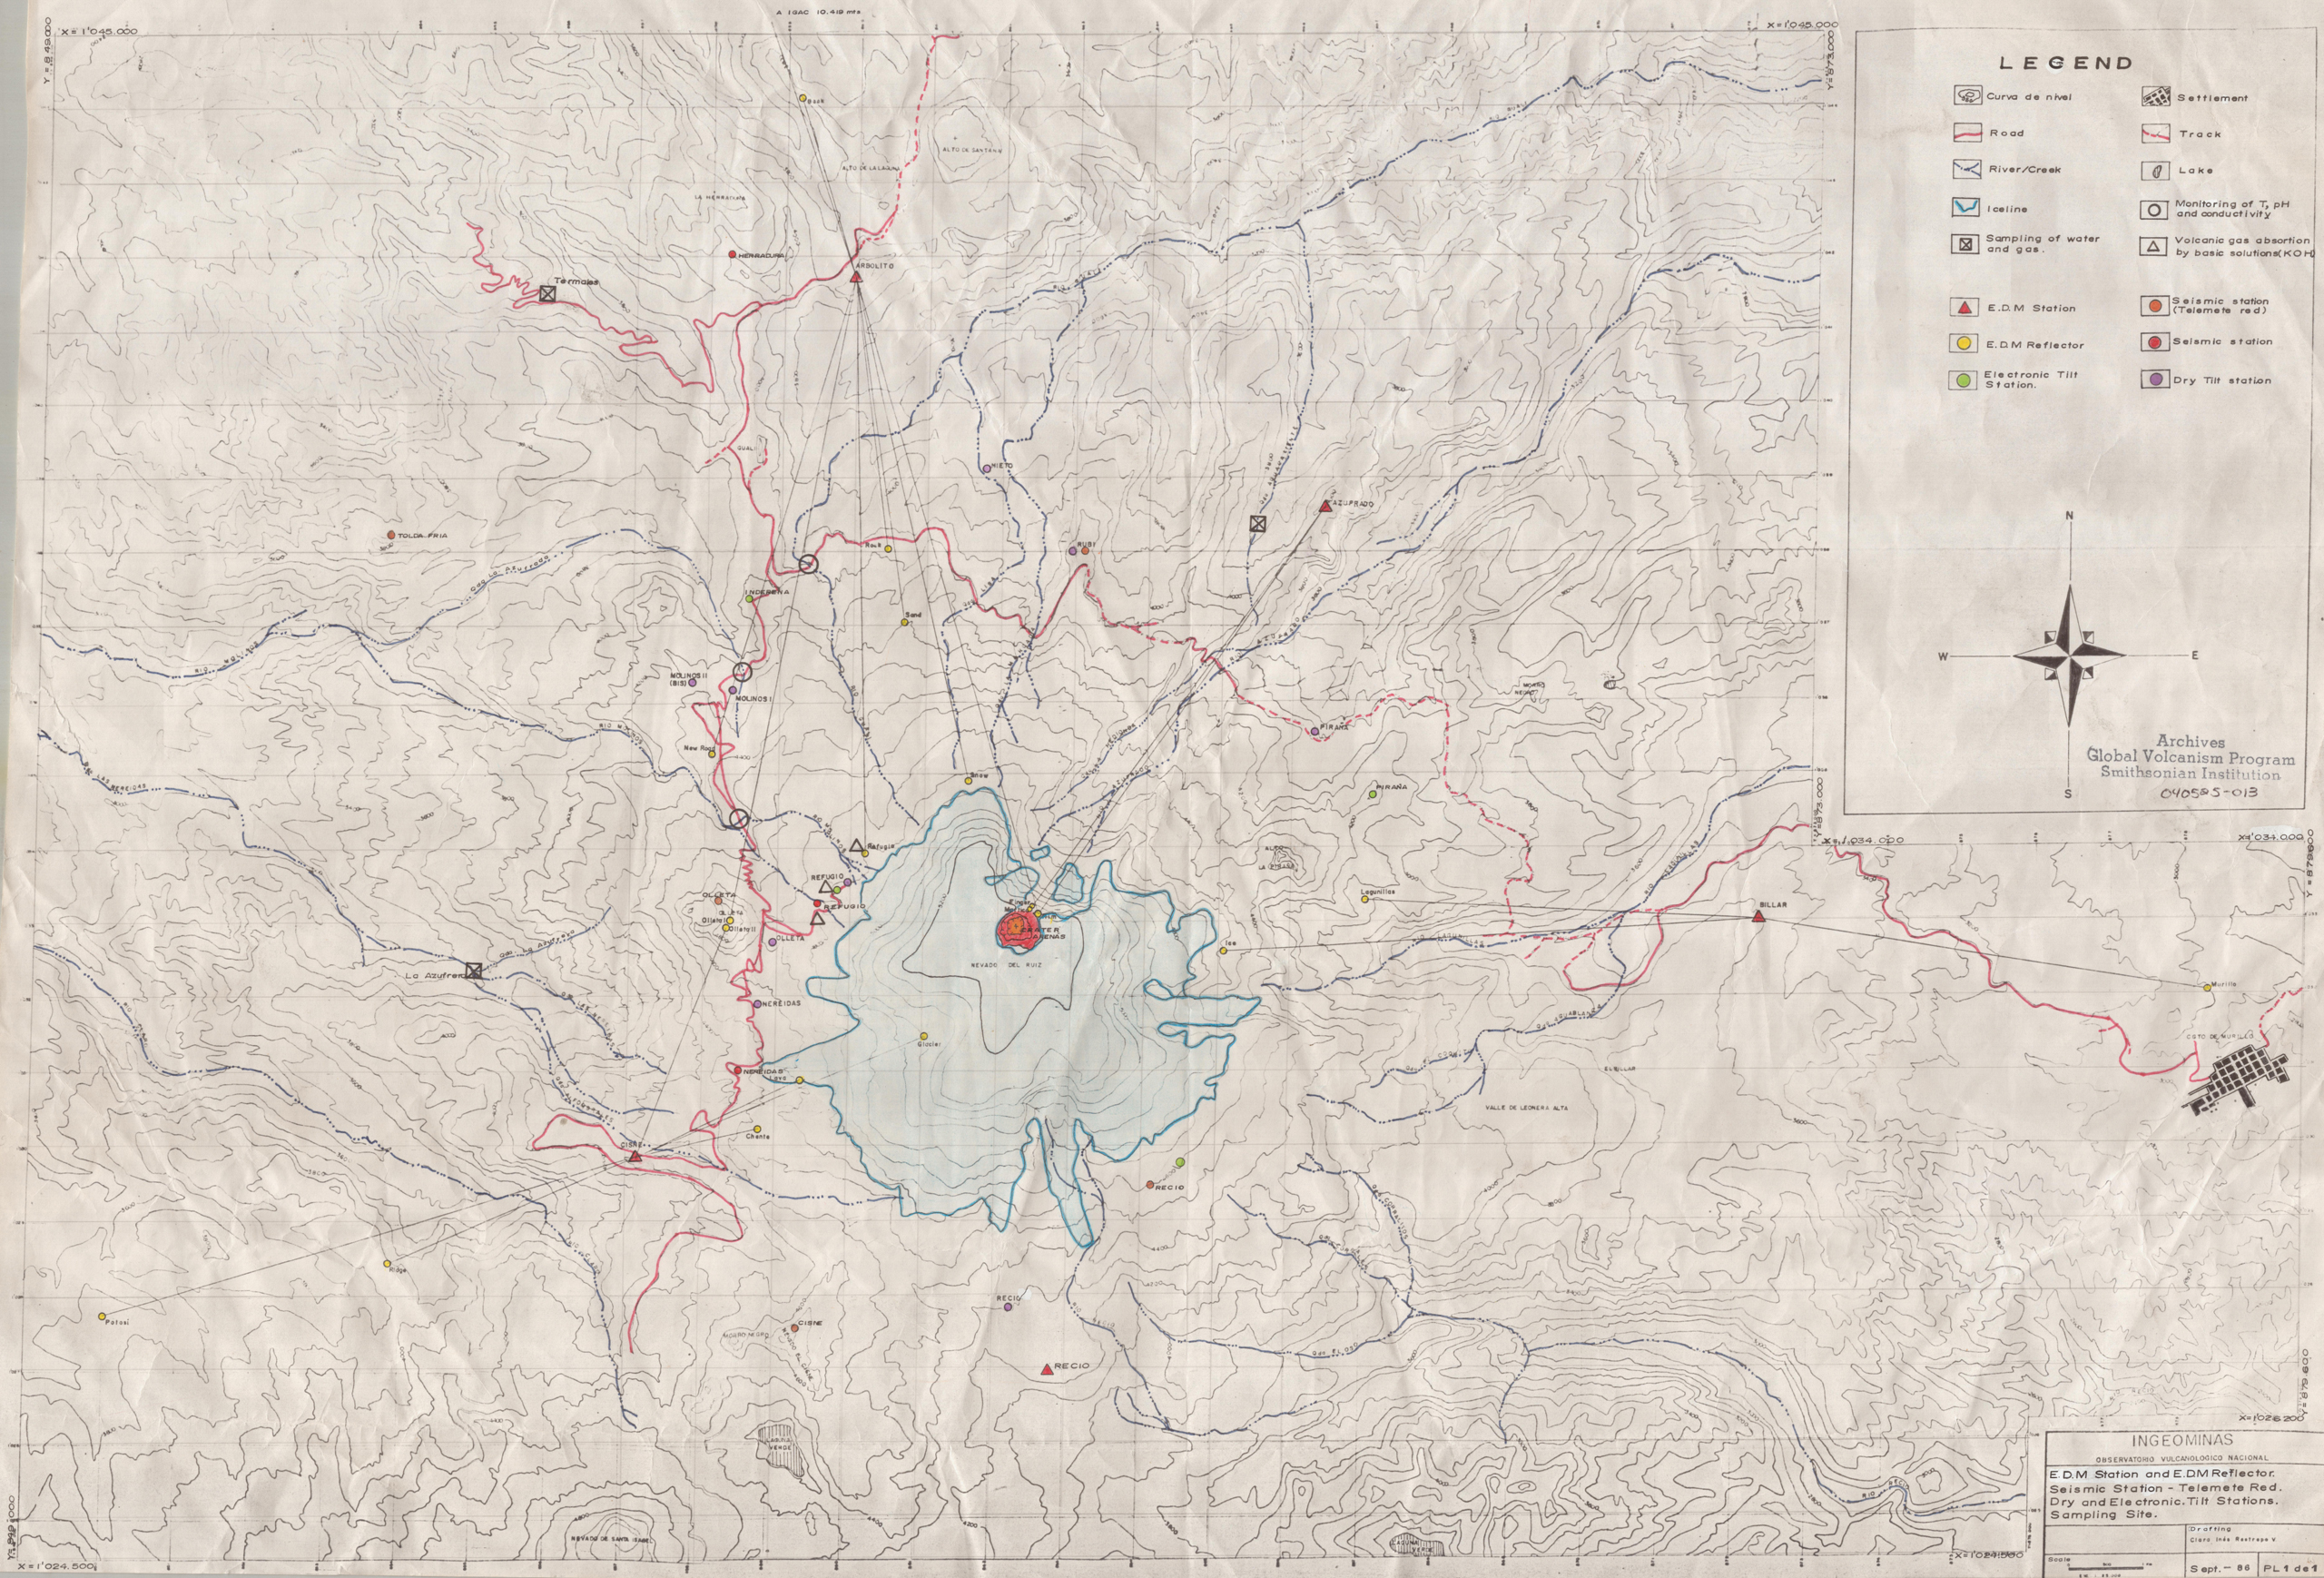 |
Figure 53. A 1986 map of monitoring networks at Nevado del Ruiz including temperature (open circles), geochemistry (open triangles), electronic distance measurement (EDM) stations and reflectors (red filled triangles and yellow filled circles, respectively), dry tilt (purple filled circles), electronic tilt (green filled cirles), and seismometers (orange and red filled circles). Major features are also highlighted including the summit crater (the area concentrically colored red around orange in the center), the extent of persistent ice on the edifice (blue shaded areas), neighboring peaks, lakes (areas filled with vertical lines), rivers (dark blue lines), roads (red lines), and the town Murillo (the most proximal settlement to the volcano, shown at the far right). Courtesy of INGEOMINAS. |
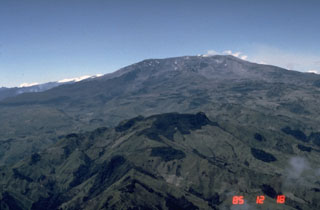
Geological Summary. Nevado del Ruiz is a broad, glacier-covered volcano in central Colombia that covers more than 200 km2. Three major edifices, composed of andesitic and dacitic lavas and andesitic pyroclastics, have been constructed since the beginning of the Pleistocene. The modern cone consists of a broad cluster of lava domes built within the caldera of an older edifice. The 1-km-wide, 240-m-deep Arenas crater occupies the summit. The prominent La Olleta pyroclastic cone located on the SW flank may also have been active in historical time. Steep headwalls of massive landslides cut the flanks. Melting of its summit icecap during historical eruptions, which date back to the 16th century, has resulted in devastating lahars, including one in 1985 that was South America's deadliest eruption.
Information Contacts: Instituto Colombiano de Geología y Minería (INGEOMINAS), Volcanological and Seismological Observatory, Avenida 12 Octubre 15-47, Manizales, Colombia (URL: https://www2.sgc.gov.co/volcanes/index.html).