Report on Pagan (United States) — December 2012
Bulletin of the Global Volcanism Network, vol. 37, no. 12 (December 2012)
Managing Editor: Richard Wunderman.
Edited by Julie A. Herrick.
Pagan (United States) Ash, gas, and thermal emissions during 2011-2012
Please cite this report as:
Global Volcanism Program, 2012. Report on Pagan (United States) (Herrick, J.A., and Wunderman, R., eds.). Bulletin of the Global Volcanism Network, 37:12. Smithsonian Institution. https://doi.org/10.5479/si.GVP.BGVN201212-284170
Pagan
United States
18.13°N, 145.8°E; summit elev. 570 m
All times are local (unless otherwise noted)
Our last report described gas-and-steam plumes in October and November 2010 that rose from Pagan's active cone located on the N side of the island (BGVN 35:12). After that, the Volcanic Alert Level and Aviation Color Code were reduced from Advisory (Yellow) to Unassigned on 22 February 2011. The Alert was raised again to Advisory ("Volcano is exhibiting signs of elevated unrest above known background level") on 23 April 2011 where it remained level through the end of 2012.
In this report, we tabulate and briefly comment on advisories from the Washington Volcanic Ash Advisory Center (VAAC) that reported Pagan's gas emissions, occasional ash plumes, and thermal anomalies. Reports of activity were also contributed by observers from other islands and a passing research vessel. We also share the results from the ash transport and dispersion model, PUFF, for the 30 January 2012 ash emission. MODVOLC thermal alerts were triggered several times during this reporting period, mainly in late 2012. Clear images from satellites and the International Space Station are also included in this report.
The primary methods of monitoring Pagan are satellite remote sensing and visual observations from the Emergency Management office (based in Saipan), local residents of the islands, and mariners. Pagan lacks ground-based geophysical instrumentation dedicated to volcano monitoring. During this reporting period, the closest operating seismometers were located over 155 km away on the islands of Sarigan, Anatahan, Rota, and Saipan (figure 11).
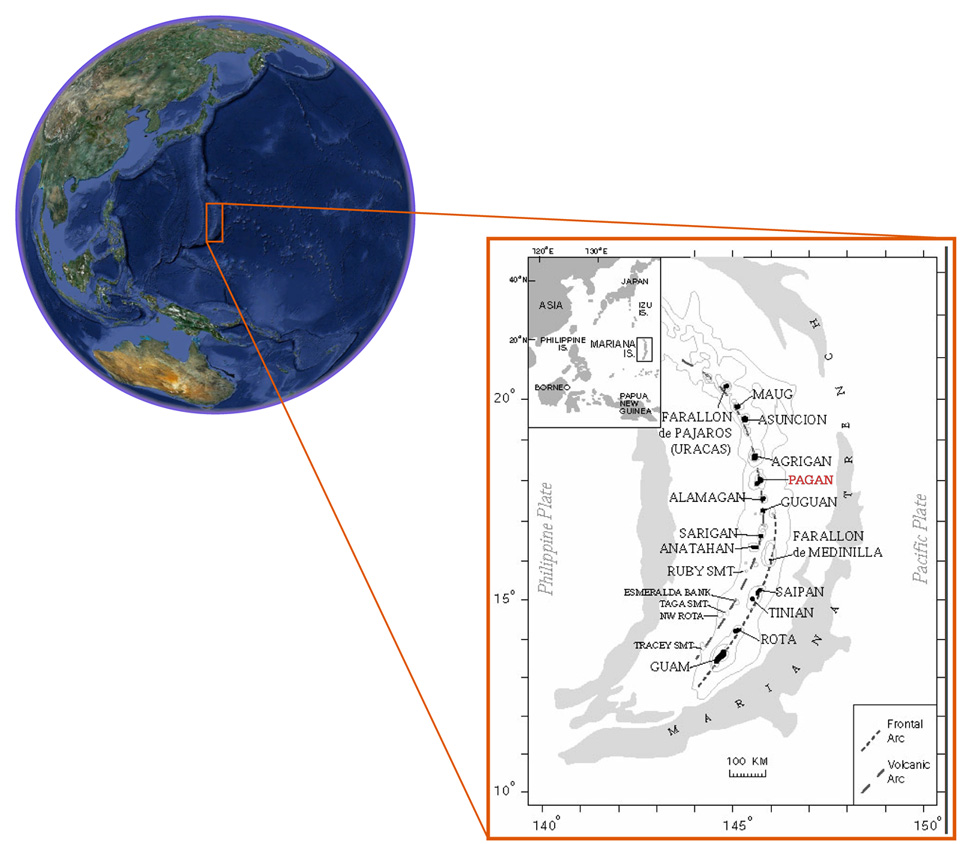 |
Figure 11. Pagan is one of the 15 volcanic islands within the Commonwealth of the Northern Marianas Islands. This region of the volcanic arc (Mariana Arc) is the N half of a ridge which extends about 2-4 km above the ocean floor; to the E of the arc lies the Mariana Trench where depths reach greater than 6 km (Trusdell and others, 2006). This map also labels the five submarine features Esmeralda Bank, NW Rota, and the seamounts (SMT) Tracey, Taga, and Ruby. Courtesy of Trusdell and others (2006) and Google Earth (Terra Metrics Image IBCAO, 2013; Cnes/Spot Image, 2013). |
Activity during 2011. With the exception of a diffuse steam-and-gas plume observed on 24 January 2011, no unusual activity at Pagan volcano had been detected in satellite imagery during January-March.
On 23 April, a Northern Mariana Islands status report noted that a NOAA research vessel in the vicinity of Pagan reported incandescence at the summit of the volcano at night. Satellite image observations were obscured by clouds during that time.
Between 27 June and 1 September, the Washington VAAC reported that emissions were visible from Pagan (table 3). Gas and possible ash were noted based on satellite imagery from MTSAT (Multifunctional Transport Satellites), meteorological centers, and Global Forecast System (GFS) Winds. GFS is a model developed by NOAA's National Centers for Environmental Prediction. Ash emissions appeared in satellite imagery on 1 September during an event that produced a plume that rose 2.4 km above sea level (a.s.l.). That day, the Saipan Emergency Management Center also reported that gases and ash were visible.
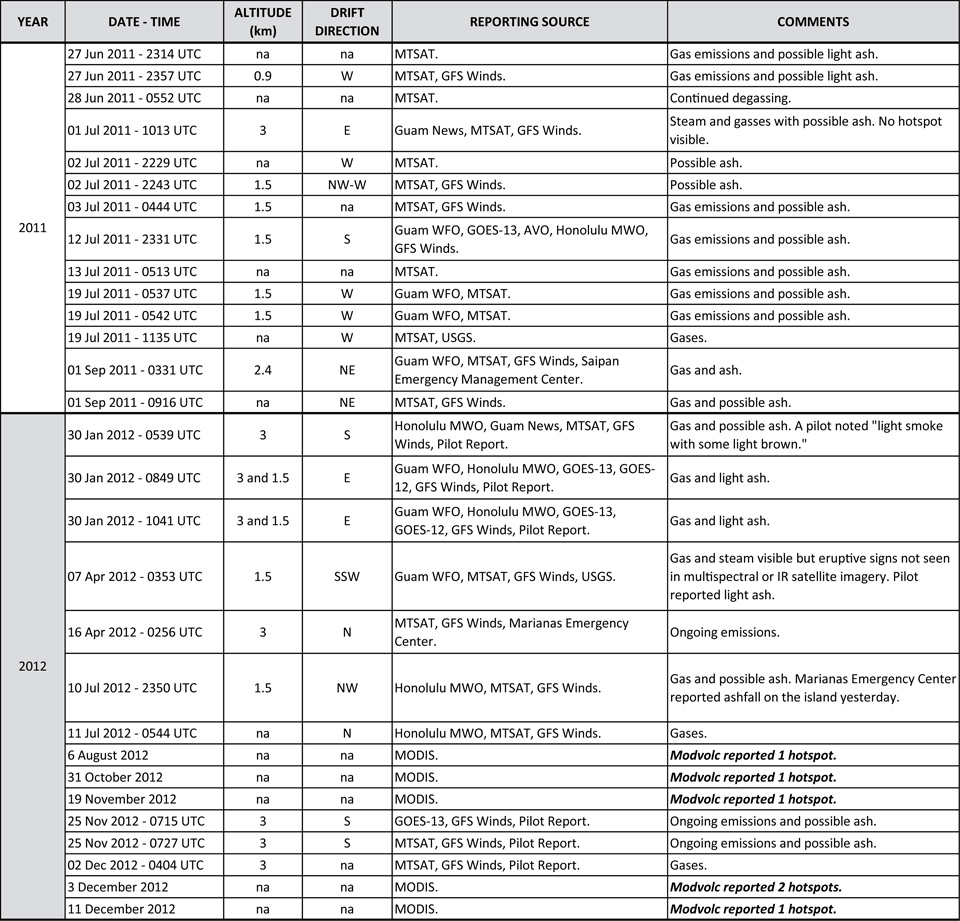 |
Table 3. Summit activity from Pagan included ash plumes during 27 June 2011-2 December 2012 as reported by the Washington VAAC and hotspot notifications from MODVOLC. The VAAC frequently incorporated data from several sources as noted in the "Reporting Source" column. Note that "Altitude" values are approximate from the flight levels provided in the original online reports. Courtesy of the Washington VAAC and Hawai`i Institute of Geophysics and Planetology (HIGP) Thermal Alerts System. |
Northern Mariana Islands status reports noted that low-level gas-and-steam plumes with possible fine ash were detected in satellite imagery (as well as noted by observers on the island) on 7 July and during 26 August-2 September 2011. From 28 October to 2 December, status reports noted satellite observations of a persistent gas-and-steam plume drifting from the island.
Activity during 2012. During 2012, the Washington VAAC released periodic notices describing emissions from Pagan; these reports were primarily during January, April, July, November, and December (table 3). The tallest plumes rose 3 km a.s.l. with various drift directions (S, E, SSW, N, and NW). The Marianas Emergency Management Center reported local observations of ashfall on the island on 9 July 2012.
PUFF volcanic ash transport and dispersion simulations. The results from a volcanic ash tracking model were available for the 30 January 2012 ash event (figure 12). Simulations from the PUFF model provided the extent of ash for a plume with starting conditions determined by the Washington VAAC; the time of the eruption, reported plume heights, drift direction and speed were required for the model. "The intent of PUFF is to show the position of eruption clouds when satellite image observations are not available, and to use satellite observations, when available, to validate or improve simulations (Searcy and others, 1998)." The model is frequently used for ash events within the N Pacific air traffic region and assists the Alaska Volcano Observatory (AVO, a joint program of the United States Geological Survey, USGS, the Geophysical Institute of the University of Alaska Fairbanks, UAFGI, and the State of Alaska Division of Geological and Geophysical Surveys, ADGGS) and other agencies.
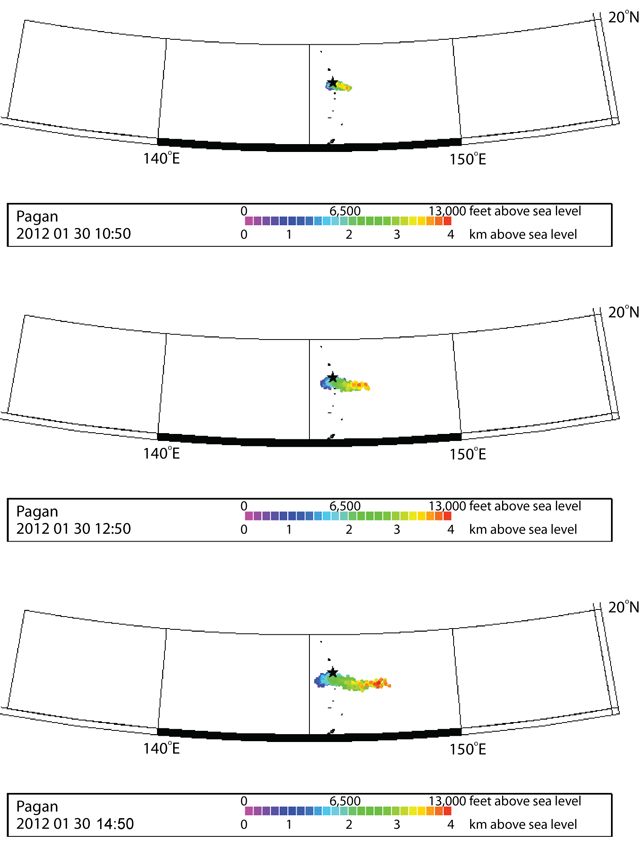 |
Figure 12. Three simulations of ash dispersal based on Pagan's 30 January 2012 event were available from the PUFF volcanic ash dispersion model. At 1050, 1250, and 1450, the three-dimensional model forecasted ash distribution drifting in a narrow band E of the island. Initial drift parameters were determined by the Washington VAAC (start time = 0849 UTC on 30 January 2012, plume heights = 1.5 km and 3 km, drift = E at 5-10 knots). The plume top reached a calculated maximum of 3.048 km a.s.l. The location of Pagan is indicated with the star; the northernmost island in view is Asuncion Island (~177 km NNW) and the southernmost island is Saipan (~315 km S). The PUFF volcanic ash dispersion and transport model was developed by the University of Alaska Fairbanks Geophysical Institute (UAF-GI). Courtesy of Peter Webley, UAF-GI. |
The simulation for the 30 January 2012 ash event began at 1050 UTC and showed that, by 1450 UTC, ash had drifted E in a narrow band with a maximum altitude of 3.048 km. This result correlates well with satellite observations reported by the Washington VAAC at 1041 (table 3); after that time, the Washington VAAC reported that ash was possible but not detectable during the time period that the Puff model forecasted ash extending further E.
The PUFF model was recently expanded to include an interface with Google Earth. Ash dispersion results can be viewed in Google Earth including the plume start time, altitude and simulation length, two-dimensional maps of ash with time stamps (color coded by altitude), and the three-dimensional ash cloud. This interface also allows selection by ash particle so the user can view its location, its volcanic origin, the elapsed time since the eruption began, and altitude (in km and feet a.s.l.) (Webley and others, 2008).
Thermal anomaly detection in 2012. Hotspots from the summit region were detected by the MODIS instrument (onboard the Terra and Aqua satellites) during 2012. The MODVOLC hotspot alerting system recorded six significant thermal anomalies between 6 August and 11 December (figure 13). Thermal anomalies appeared at least once per month between October and December 2012 suggesting clear viewing conditions during times of elevated activity (table 3).
|
Figure 13. During 2012, the MODVOLC system detected elevated temperatures in the area of Pagan's summit, located at the N end of the island. This image includes hotspots detected during the year and listed in table 3. Courtesy of the Hawai`i Institute of Geophysics and Planetology (HIGP) Thermal Alerts System. |
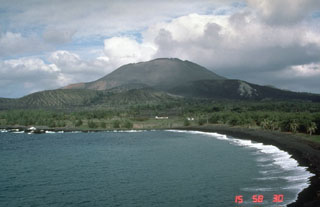
A view of Pagan from the International Space Station. On 6 March 2012, an astronaut on the International Space Station photographed Pagan Island during spectacular viewing conditions (figure 14). With a digital camera, the entire extent of the island was captured as well as a persistent white plume drifting from the summit area. Some clouds had gathered around the southern region of the island (a narrow peninsula of older volcanic centers), but the main features of the island were easy to distinguish. Historical lava flows appeared dark brown and black within the large (5.5 km wide), circular caldera (a feature that dominates the N end of the island) (Trusdell and others, 2006). The youngest lava flows date from 1981, however, lavas from an eruption during 1872-1873 reached the N shoreline; note the black region in contrast with the vegetated shoreline at the right-hand side of the photo.
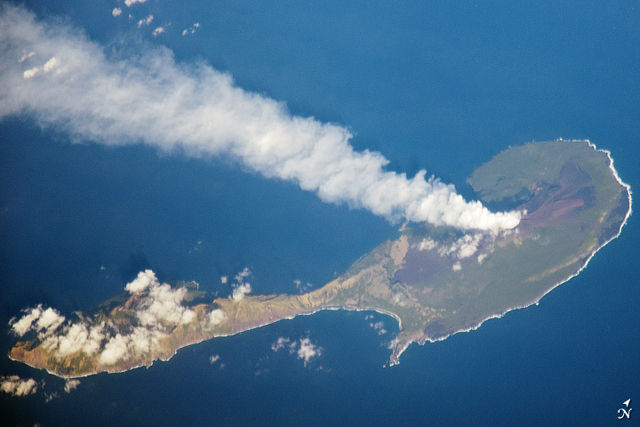 |
Figure 14. On 6 March 2012, a steam plume was drifting WSW from Pagan Island's northernmost peak, Mount Pagan, the highest point on the island. This photo was taken by an astronaut with the Expedition 30 crew on the International Space Station while orbiting ~480 km above the Pacific Ocean. The viewing angle and distance from the station caused some skewing of the image; the image was cropped and enhanced, improving contrast and removing lens artifacts. Astronaut photograph ISS030-E-122047. Courtesy of NASA-JSC. |
MODIS satellite images: May and October 2012. On 7 May, the MODIS instrument on the Terra satellite acquired a clear image of Pagan Island with a conspicuous plume of gas and steam drifting W (figure 15). The plume's blue tint suggested the presence of sulfur dioxide. According to NASA's Earth Observatory, the Ozone Monitoring Instrument (OMI) on the Aura satellite detected elevated levels of SO2 just W of the volcano several hours after this image was acquired. The USGS reported that minor steam-and-gas plumes were observed in partly cloudy satellite images during 4-11 May.
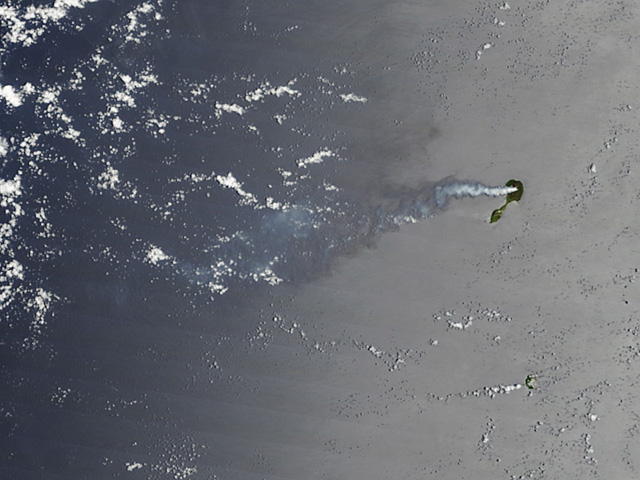 |
Figure 15. This satellite image of Pagan Island is a natural-color view of emissions drifting W on 7 May 2012. The small volcanic island of Alamagan is in view ~55 km S of Pagan. NASA's Earth Observatory noted that, for three years, North Pagan had emitted intermittent volcanic plumes. By mid-2011, Pagan's activity was nearly continuous, and NASA's MODIS instrument detected a plume almost every time there was a clear view. Courtesy of NASA and Jeff Schmaltz, LANCE/EOSDIS MODIS Rapid Response Team, GSFC. |
According to NASA's Earth Observatory, a satellite image acquired on 16 October showed a steam-and-gas plume drifting WNW (figure 16). Scattered clouds filled much of the view but the island was mostly cloud-free with a plume trailing into the denser bands of clouds.
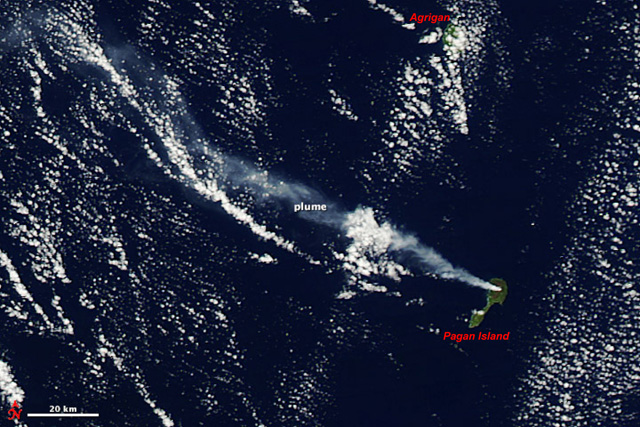 |
Figure 16. This image of Pagan Island shows a gas plume drifting WNW on 16 October 2012. The MODIS instrument on board the Aqua satellite captured this natural-color image. Note that the blue-tinted plume becomes more diffuse with distance but remains visible up to ~160 km from the island (extending to the upper left-hand corner of the image). The green outline of Agrigan island is partly obscured by cloud-cover, but is visible ~70 km N of Pagan island. Courtesy of NASA and Jeff Schmaltz, LANCE/EOSDIS MODIS Rapid Response Team, GSFC. |
References. Searcy, C., Dean, K., and Stringer, W., 1998. PUFF: A high-resolution volcanic ash tracking model, Journal of Volcanology and Geothermal Research, 80, pp. 1-16.
Trusdell, F.A., Moore, R.B., and Sako, M.K., 2006. Preliminary Geologic Map of Mount Pagan Volcano, Pagan Island, Commonwealth of the Northern Mariana Islands, U.S. Geological Survey Open-File Report 2006-1386 (URL: http://pubs.usgs.gov/of/2006/1386/).
Webley, P.W., Dean, K., Bailey, J.E., Dehn, J., and Peterson, R., 2008. Automated forecasting of volcanic ash dispersion utilizing Virtual Globes, Natural Hazards, 51, 2, pp. 345-361.
Geological Summary. Pagan Island, the largest and one of the most active of the Mariana Islands volcanoes, consists of two stratovolcanoes connected by a narrow isthmus. Both North and South Pagan stratovolcanoes were constructed within calderas, 7 and 4 km in diameter, respectively. North Pagan at the NE end of the island rises above the flat floor of the northern caldera, which may have formed less than 1,000 years ago. South Pagan is a stratovolcano with an elongated summit containing four distinct craters. Almost all of the recorded eruptions, which date back to the 17th century, have originated from North Pagan. The largest eruption during historical time took place in 1981 and prompted the evacuation of the sparsely populated island.
Information Contacts: Emergency Management Office of the Commonwealth of the Northern Mariana Islands (EMO-CNMI) and USGS Volcano Hazards Program, PO Box 100007, Saipan, MP 96950, USA (URL: http://www.cnmihsem.gov.mp/, http://volcanoes.usgs.gov/nmi/activity/); Frank Trusdell, Hawaiian Volcano Observatory, PO Box 51, Hawaii National Park, HI, 96718-0051; Washington Volcanic Ash Advisory Center (VAAC), Satellite Analysis Branch (SAB), NOAA/NESDIS E/SP23, NOAA Science Center Room 401, 5200 Auth Rd, Camp Springs, MD 20746, USA (URL: http://www.ospo.noaa.gov/Products/atmosphere/vaac/); Hawai`i Institute of Geophysics and Planetology (HIGP) Thermal Alerts System (MODVOLC), School of Ocean and Earth Science and Technology (SOEST), Univ. of Hawai`i, 2525 Correa Road, Honolulu, HI 96822, USA (URL: http://modis.higp.hawaii.edu/); Peter Webley, University of Alaska Fairbanks Geophysical Institute, 909 Koyukuk Drive, Fairbanks, AK, 99775, USA (URL: http://www.gi.alaska.edu/); NASA Earth Observatory, NASA Goddard Space Flight Center (URL: http://earthobservatory.nasa.gov/).