Report on Galeras (Colombia) — March 2013
Bulletin of the Global Volcanism Network, vol. 38, no. 3 (March 2013)
Managing Editor: Richard Wunderman.
Edited by Julie A. Herrick.
Galeras (Colombia) Ash emissions and elevated seismicity during May 2012-March 2013
Please cite this report as:
Global Volcanism Program, 2013. Report on Galeras (Colombia) (Herrick, J.A., and Wunderman, R., eds.). Bulletin of the Global Volcanism Network, 38:3. Smithsonian Institution. https://doi.org/10.5479/si.GVP.BGVN201303-351080
Galeras
Colombia
1.22°N, 77.37°W; summit elev. 4276 m
All times are local (unless otherwise noted)
The elevated activity previously covered in May 2012 (BGVN 37:04) continued through March 2013. This report describes the ash events and monitoring efforts during that time as well as trends in seismic, gas, and geodetic data. The Servicio Geológico Colombiano (SGC) maintained Alert Level III (Yellow; "changes in the behavior of volcanic activity") during this 11-month reporting period.
From the observatory based in Pasto (~10 km E of Galeras's summit), the SGC (formerly known as Instituto Colombiano de Geología y Minería "INGEOMINAS") maintained an extensive monitoring network (table 11). During May 2012-March 2013, they highlighted the following events in their monthly activity reports (available online): ash plumes, ashfall, elevated seismicity (including swarms), SO2 emissions, and sulfur odors detected by observers near the volcano.
Table 11. The SGC network for monitoring Galeras included more than 50 instruments during May 2012-March 2013; the newest station, added in March 2013, is an additional magnetic and self-potential monitoring station. Courtesy of SGC.
| Instrument Description | Quantity | Instrument Location(s) |
| Radon gas sensors (diffuse soil emissions) | 20 | Two transects covering the E (Galeras Line) and N (Barranco Line) sectors |
| Seismic stations (seven short period and five broadband; telemetered) | 12 | See Figure 116 in BGVN 37:04 |
| Electronic tilt stations (telemetered) | 8 | See Figure 116 in BGVN 37:04 and figure 9 |
| DOAS stations; three ScanDOAS (telemetered) and one portable MiniDOAS (NOVAC Program) | 4 | Santa Bá, Alto Jimenez, Alto Tinajillas (figure 116 in BGVN 37:04 and figure 6) |
| GPS stations (telemetered) | 4 | Cráter, Cóndor, Barranco, (Mapachio stopped in Aug. 2012), San Cavetano (figure 116 in BGVN 37:04 and figure 9) |
| Infrasound stations | 3 | Seismic stations Cráter-2, Cóndor, and Calabozo (figure 116 in BGVN 37:04) |
| Video cameras | 3 | Two in towns (Pasto and Consacá in figure 6) and one at seismic station Barranco Alto (figure 116 in BGVN 37:04) |
| Flood monitoring stations | 2 | Watershed of Mijitayo (figure 6) (including geophone and flood gauges; telemetered) |
| Magnetic and self-potential systems | 2 | Stations Frailejónes and Barranco (added in March 2013; figure 116 in BGVN 37:04) |
| Wind station (speed and direction; telemetered) | 1 | Seismic station Cráter-2 (figure 116 in BGVN 37:04) |
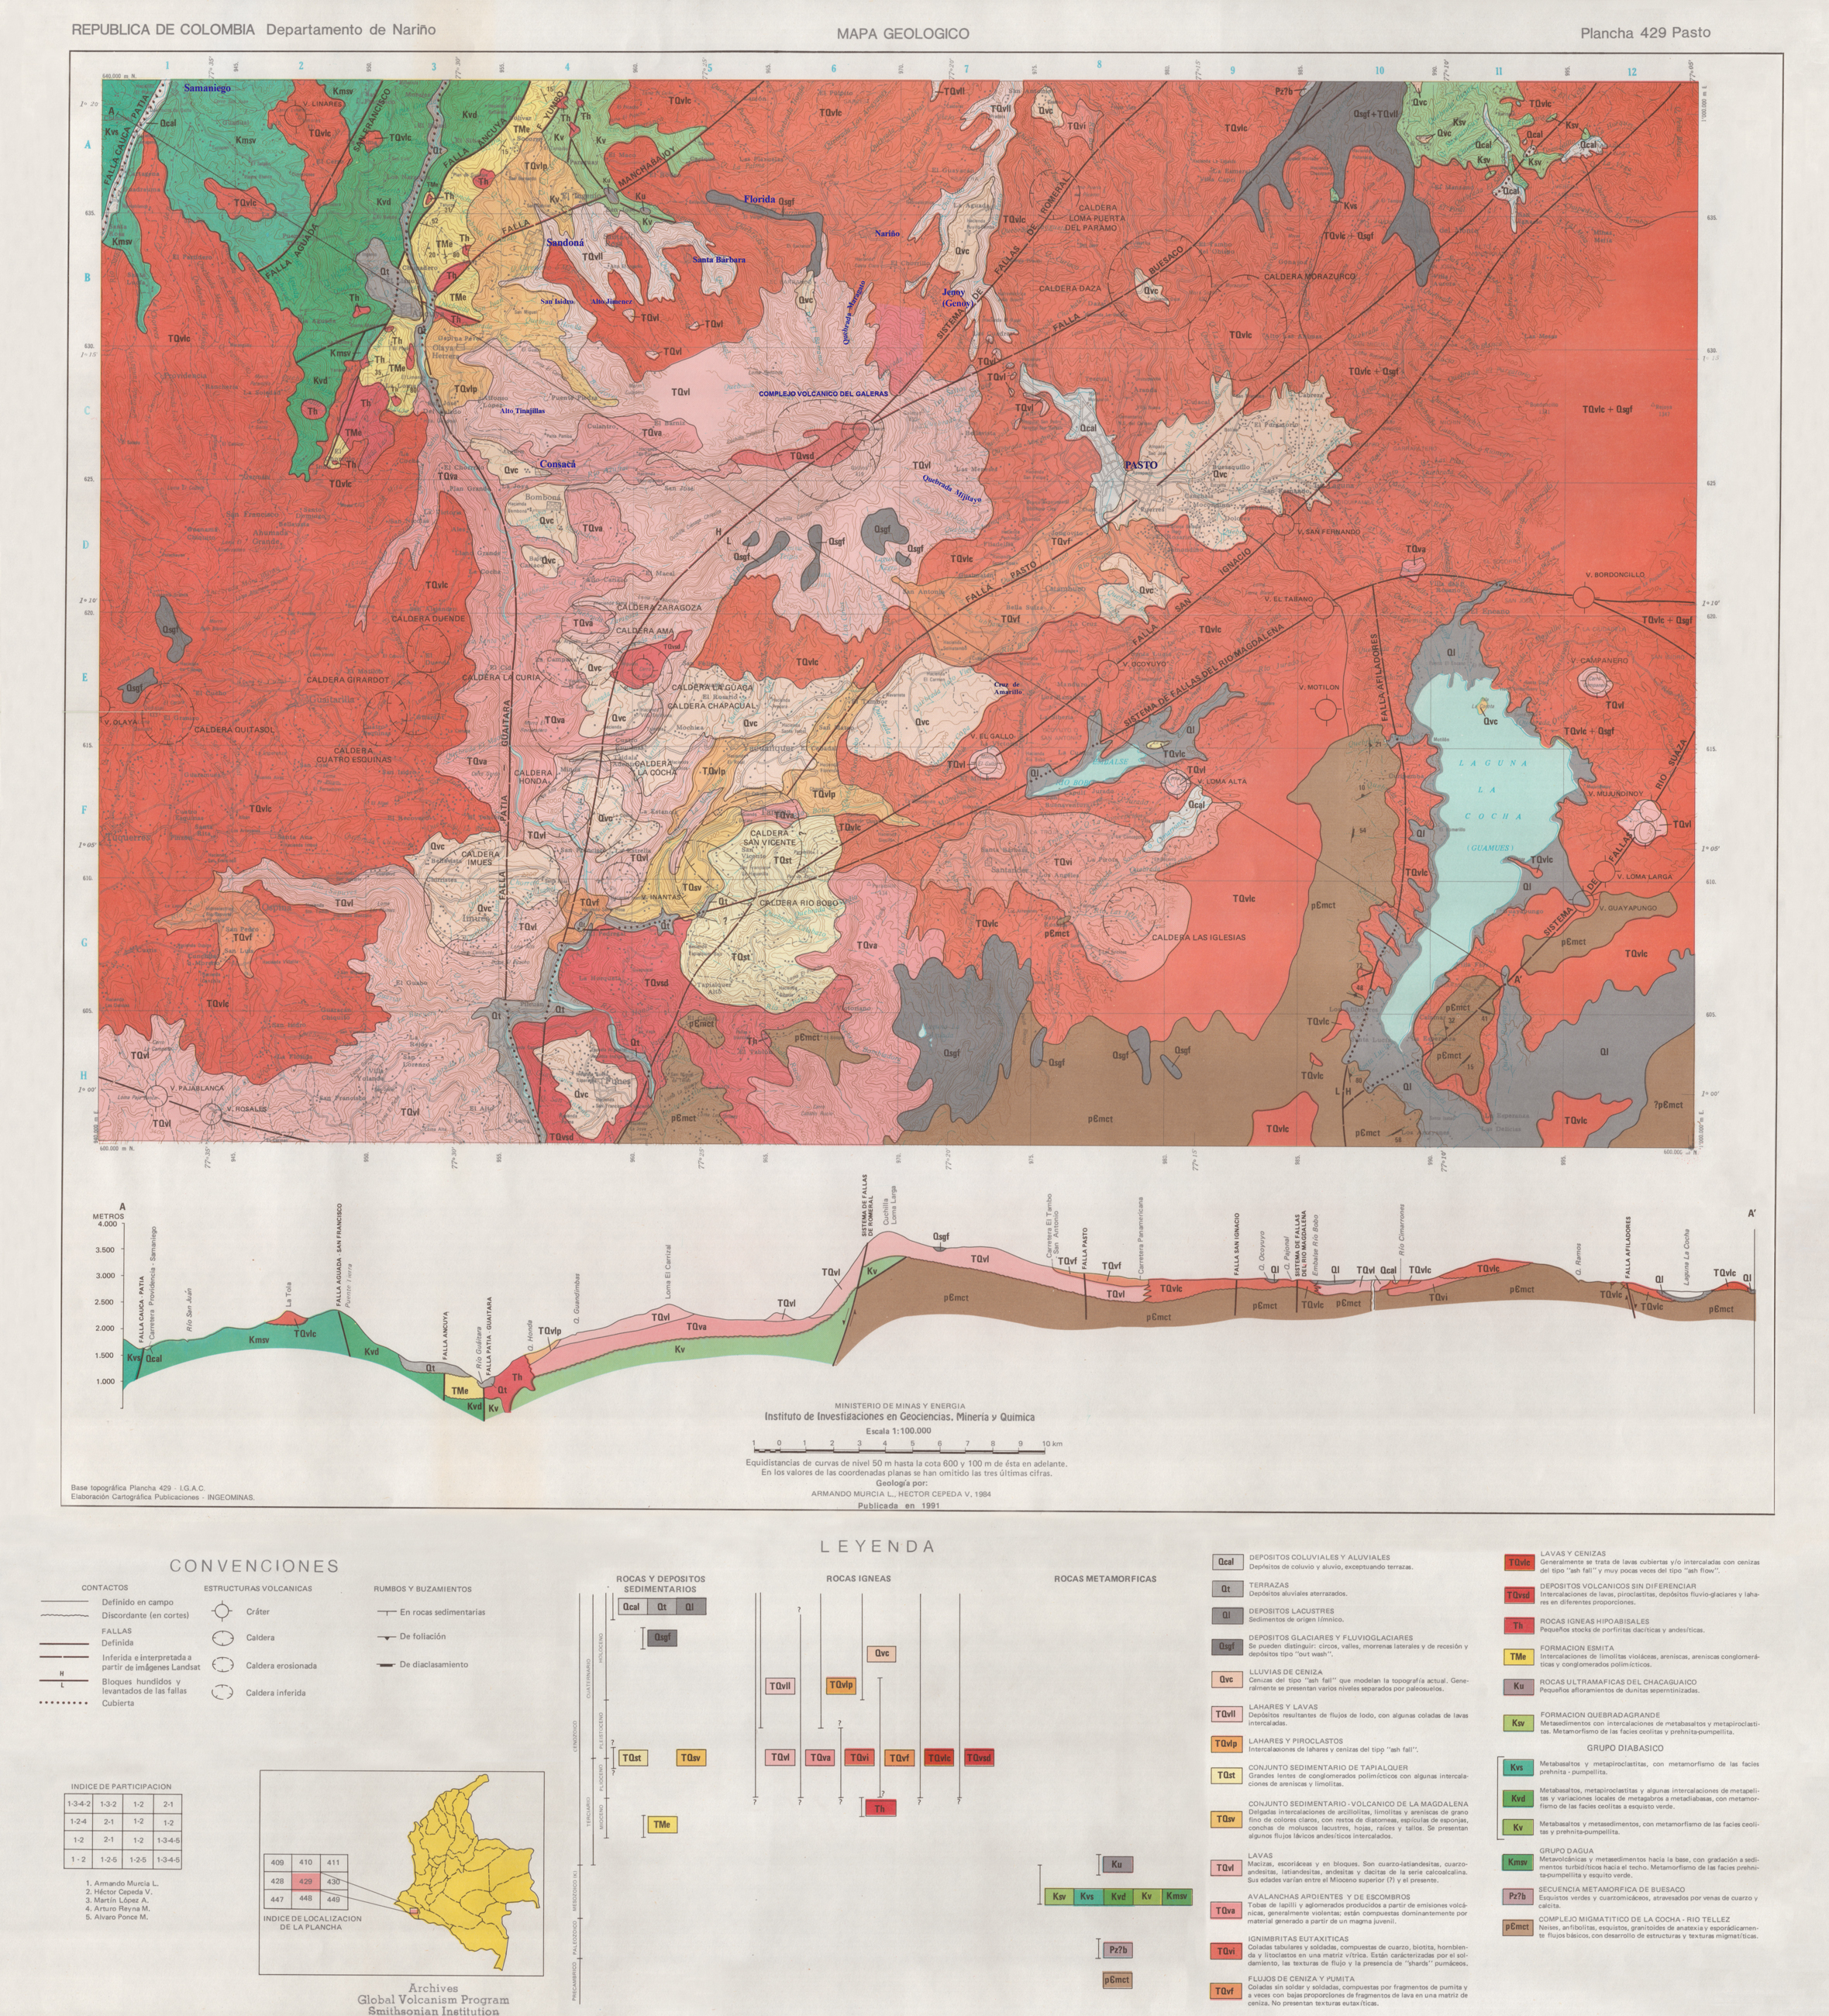 |
Figure 122. This geologic map of Galeras includes regional geology and a detailed stratigraphic column. Heavy blue lettering was added to emphasize those names in this report. The geology of Galeras was mapped by Armando Murcia L. and Hector Cepeda V. in 1984 and published by the Instituto Colombiano de Geología y Minería, now known as the Servicio Geológico Colombiano (SGC), in 1991. |
May 2012 seismicity and ash emissions. Compared with previous activity (see table 13 in BGVN 37:04), seismicity at Galeras increased in May in terms of energy released as well as the number of events and tremor duration (table 12). During 9-10 May, a swarm of 49 volcano-tectonic (VT) earthquakes was detected.
Table 12. Seismicity at Galeras during May 2012-March 2013. Earthquake counts for four types of events: volcano-tectonic (VT), long-period (LP), tremor (TRE), and hybrid (HYB); events labeled "Unclassified" were described by SGC as earthquakes that did not correspond to the current categories. Tornillos did not occur during this reporting period. Courtesy of SGC.
| Month | VT | LP | TRE | HYB | Tremor Duration (min) | Range ML (VT) | Depths (km) | Hypocenters Located | Unclassified |
| May 2012 | 29 | 67 | 347 | 5 | 1944 | -0.2-2 | 0-14.5 | 95 | 2343 |
| Jun 2012 | 21 | 285 | 353 | 3 | 1746 | -0.2-1.8 | 1.4-13 | 70 | 1621 |
| Jul 2012 | 17 | 276 | 233 | 1 | 986 | 0-2.5 | 0-15 | 43 | 1808 |
| Aug 2012 | 8 | 163 | 181 | 2 | 525 | -0.4-2.5 | 0.1-18 | 36 | 1413 |
| Sep 2012 | 10 | 225 | 188 | 8 | 575 | -0.1-2.2 | 1.8-10.8 | 30 | 1574 |
| Oct 2012 | 17 | 149 | 310 | 6 | 1113 | -0.2-2.3 | 0.2-13.7 | 58 | 2323 |
| Nov 2012 | 6 | 64 | 246 | 9 | 931 | -0.5-1.6 | 0-13.2 | 33 | 2335 |
| Dec 2012 | 22 | 54 | 202 | 3 | 2828 | -0.2-1.7 | 0.2-16 | 48 | 1771 |
| Jan 2013 | 18 | 101 | 292 | 12 | 4223 | -0.5-1.7 | 0-16 | 53 | 1827 |
| Feb 2013 | 13 | 91 | 282 | 4 | 6131 | -0.1-1.5 | 0.8-15 | 35 | 1775 |
| Mar 2013 | 16 | 84 | 231 | 15 | 705 | -0.1-3.1 | 0-11 | 44 | 2300 |
Figure 123 plots 95 VT and hybrid earthquakes and reveals two primary clusters of epicenters, close to the crater and a deeper one ~14 km SW of the active cone. The most distant earthquakes were dispersed in the region and had depths between 4-14.5 km (measured relative to the summit).
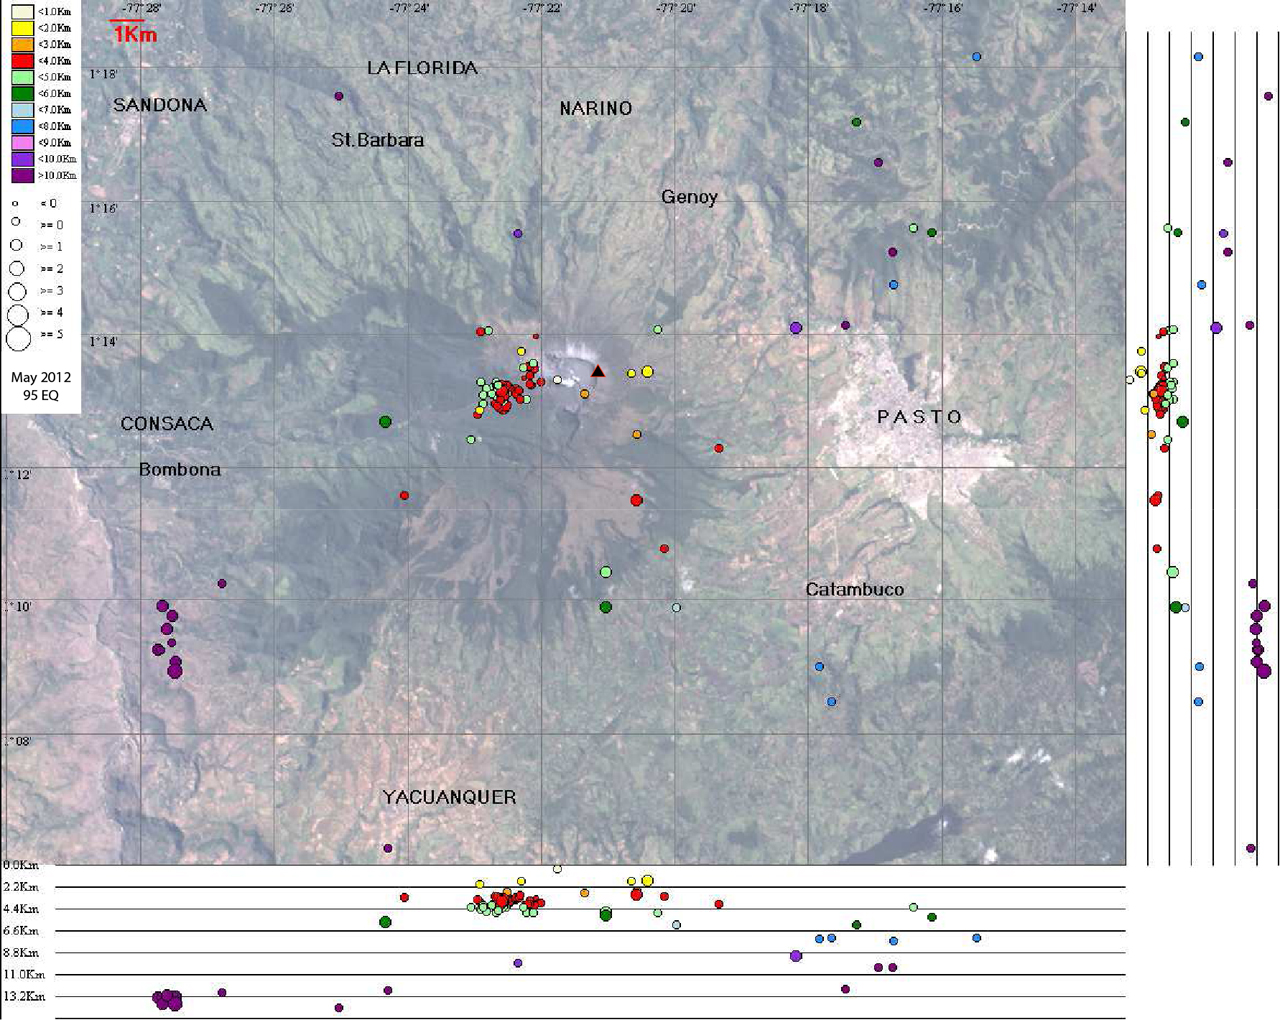 |
Figure 123. Map and cross sections plotting 95 epicenters and hypocenters of volcano-tectonic and hybrid earthquakes that occurred during 1-31 May 2012 at Galeras (scale bar, upper left). In the N-S section (right) and the E-W section (bottom), each line represents 1.2 km of depth with respect to the summit (elevation, ~4,200 m). Magnitudes of seismic events are indicated by circle size. Colors indicate depths, which ranged from |
On 13 May 2012, SGC noted a change in volcanic activity when tremor occurred associated with gas and ash emissions. Ash rose in small pulses and was deposited at high elevations on the edifice and toward the NW in prevailing winds. During clear conditions on 17 May, an ash plume was observed rising from the crater to ~200 m above the summit.
Clouds obscured visibility on 28 May, but on other days during 22-29 May SGC observers saw ash plumes rising 800 m above the crater. According to the Cruz Roja Departamento Nariño, ashfall was reported in Santa Bárbara (~8 km NNW) during the week of 22 May.
June-July 2012 seismicity and plume activity. Elevated seismicity continued through June, primarily comprised of tremor and long-period (LP) events. In July, seismicity decreased (both in the number of events, table 12, and the energy released) although a swarm of LP events occurred on 15 July.
Gas emissions were frequently observed during the first week of June in images captured by the network of video cameras. Ash emissions rose from the central crater on 2 June, and on 5 June plumes rose 1 km and drifted W. The Washington Volcanic Ash Advisory Center (VAAC) released advisories during 5-6 June, but no volcanic ash or hotspots were detected by satellite instruments.
During 5, 6, and 12-19 June, cameras recorded gas-and-ash emissions; an ash plume rose 1.4 and 2.4 km above the crater on 14 and 17 June, respectively. Ashfall was reported in the towns of Sandoná, Samaniego, Mapachico (this location does not appear on all maps, see figure 116 in BGVN 37:04), and Genoy. During 19-22 and 24 June cameras recorded gas-and-ash emissions that drifted NW.
The SGC noted gas-and-ash emissions via the network of video cameras during 4-5 July. On 18 July, ashfall was also reported to the N in the Quebrada Maragato area (figure 122).
August-September 2012 seismicity and plume activity.Seismicity continued to decrease in August. In September, there were two seismic swarms but the seismic energy released for the month had decreased compared with August. The swarms (on 25 and 28 September) were shallow VT events, M
Ash plumes were frequently observed in August and SGC correlated many episodes of tremor with pulses of ash (figure 124). On 3 August a steam plume rose 1.1 km above the crater. On 4 August ash emissions were observed in the morning, and at 1519 a seven-minute-long episode of tremor was accompanied by a gas-and-ash plume that rose 1.4 km above the crater and drifted N. Ashfall was reported in Genoy. During 7-9 and 11 August gas-and-ash plumes rose 0.9-1.3 km above the crater and drifted W and S. White plumes were observed during 16 (and ash that day) and 18-21 August. Cameras around the volcano recorded emissions during 21-26 August; the emissions contained ash on 26 August.
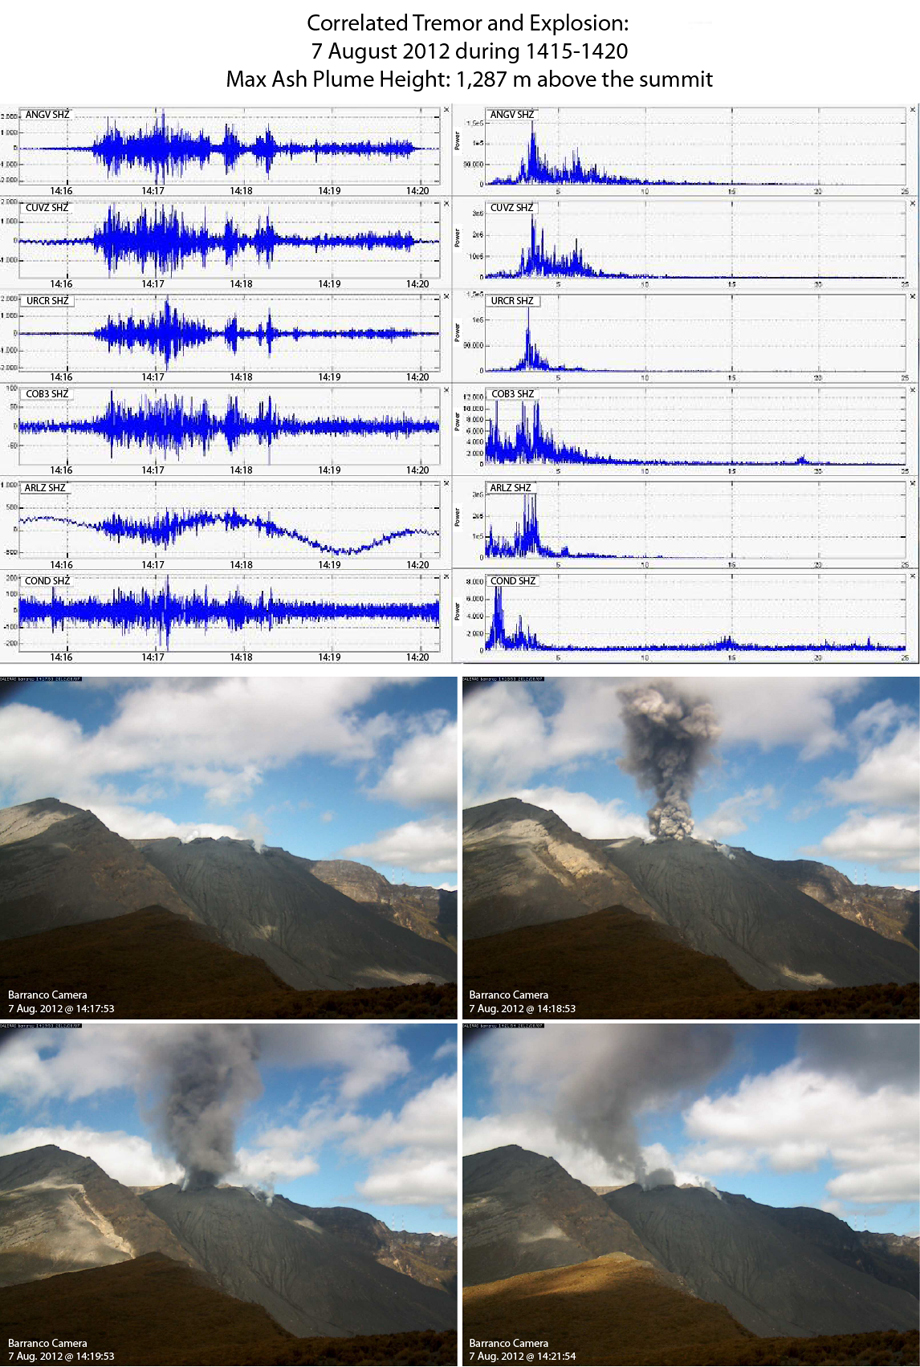 |
Figure 124. The SGC correlated tremor from Galeras with an explosion of ash on 7 August 2012. (Top) Tremor signals were detected between 1415 and 1420 at six stations (Anganoy, Cufiño, Urcunina, Cobanegra-3, Arlés, and Cóndor). (Bottom) The video camera located at Barranco station captured an impulsive ash plume emitted between 1417 and 1421 that day; see locations in figure 116 in BGVN 37:04. The look direction is SE. Courtesy of SGC. |
SGC reported that, during 18-22 and 24-25 September, cameras around Galeras recorded emissions that were mostly water vapor. On 18 and 24 September the emissions contained some ash. Plumes rose to 2 km above the summit and ashfall primarily affected the summit region. A seismic swarm occurred on 28 September.
October-November 2012 seismicity and plume activity. SGC reported that seismicity increased in October and gas-and-ash emissions (up to 1.8 km above the summit) were visible during clear viewing conditions throughout the month. The duration of tremor had doubled compared to the two previous months (table 11).
Episodes of tremor associated with gas-and-ash emissions were frequently detected in October. In particular, on 19 October tremor and a significant ash plume occurred (figure 125); ash covered the NE sector of the edifice where observatory staff conducted fieldwork.
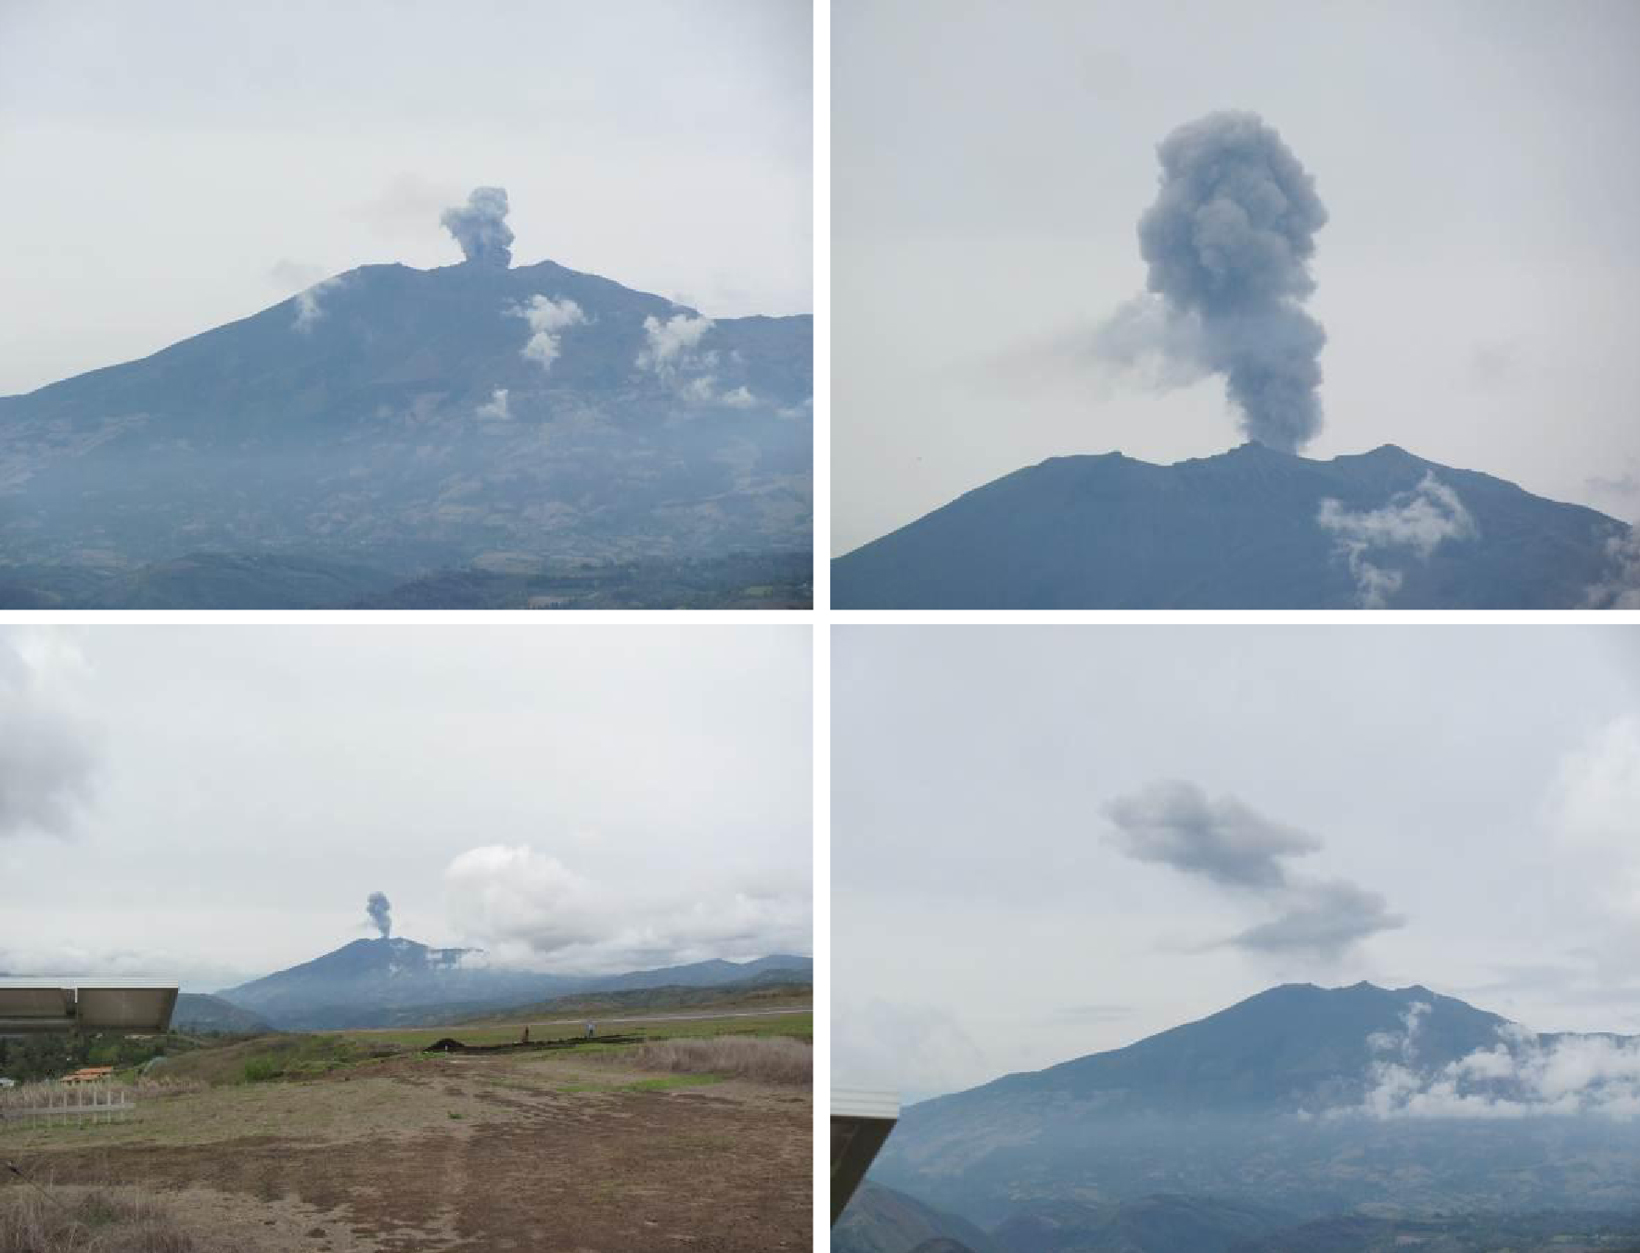 |
Figure 125. Images of Galeras captured from a camera located at the Antonio Nariño airport (~20 km NE of the summit) on 19 October 2012 beginning at 1036. These images show an ash plume rising from the summit and quickly dissipating. Tremor was concurrently detected by the local network. Courtesy of SGC. |
In October, epicenters of VT and HYB earthquakes were widely distributed throughout the area, up to 15 km from the edifice. Low energy and very shallow seismic swarms were detected on 25 and 26 October; there were 130 events in total. In November, seismic energy decreased but seismic swarms were detected during 8, 13-15, 19, and 28 November. These events were low-energy VT earthquakes (M less than 0.9), very shallow, and clustered beneath the central crater. Gas-and-ash emissions were recorded by the network of video cameras during 1, 7, 14, 22-23, and 29-30 November. Plumes rose to less than 1 km above the summit and ash was deposited at the highest elevations, primarily within the N and W sectors.
December 2012-March 2013 seismicity and plume activity. Tremor duration per month increased significantly during December 2012-February 2013 (2,828 to 6,131 minutes) (table 12). Seismic swarms frequently occurred in the months of December (more than 100 earthquakes), January, and March.
Six gas-and-ash emissions were observed between 17-29 December with plume heights less than 1.3 km. Ashfall occurred on the N and W sectors of the edifice.
In January 2013, nine gas-and-ash plumes were detected with the video monitoring system. Those plumes rose less than 1 km above the summit and deposited ash at the highest elevations within the N and W sectors of the edifice. On 22 January, Civil Defense reported ashfall in the area of Sandoná; the timing of that ashfall event suggested a correlation with an episode of tremor detected at 1309.
Gas-and-ash plumes occurred throughout February 2013. During more than 10 of these events, plumes rose to less than 1.5 km above the summit. A significant ash event occurred on the morning of 24 February; Civil Defense reported ashfall in the region of San Isidro (~14 km NW, figure 122).
The SGC reported gas-and-ash plumes throughout March; on five separate days (6, 7, 11, 22 and 25), the tallest plumes reached 1 km above the summit.
An M 3.1 earthquake was felt by residents on 14 March 2013 with a maximum intensity of II on the Modified Mercalli scale. The hypocenter was 5.6 km WNW from the crater at a depth of 7.78 km. Shaking was felt in the towns of Sandoná, Florida, and Consacá (figure 122).
SO2 flux during February 2012-March 2013. The SGC monitored sulfur dioxide gas emissions with a MobileDOAS and three ScanDOAS instruments. The MobileDOAS was acquired through the Network for Observation of Volcanic and Atmospheric Change (NOVAC), an international effort developed by the European Union to monitor SO2 emissions. SGC conducted 2-5 traverses each month with this instrument primarily along roads that circumnavigate the volcano.
The three ScanDOAS installations were telemetered systems located within 12 km WNW of the edifice (figure 116 in BGVN 37:04). These instruments each took measurements on a near-daily basis allowing for regular coverage when all three stations were operating.
The SGC monthly Technical Bulletins reduced these four sources of gas data in units of tons per day (figure 126) after incorporating wind speed and direction based on a local anemometer located at the Cráter station ~1 km E of the summit.
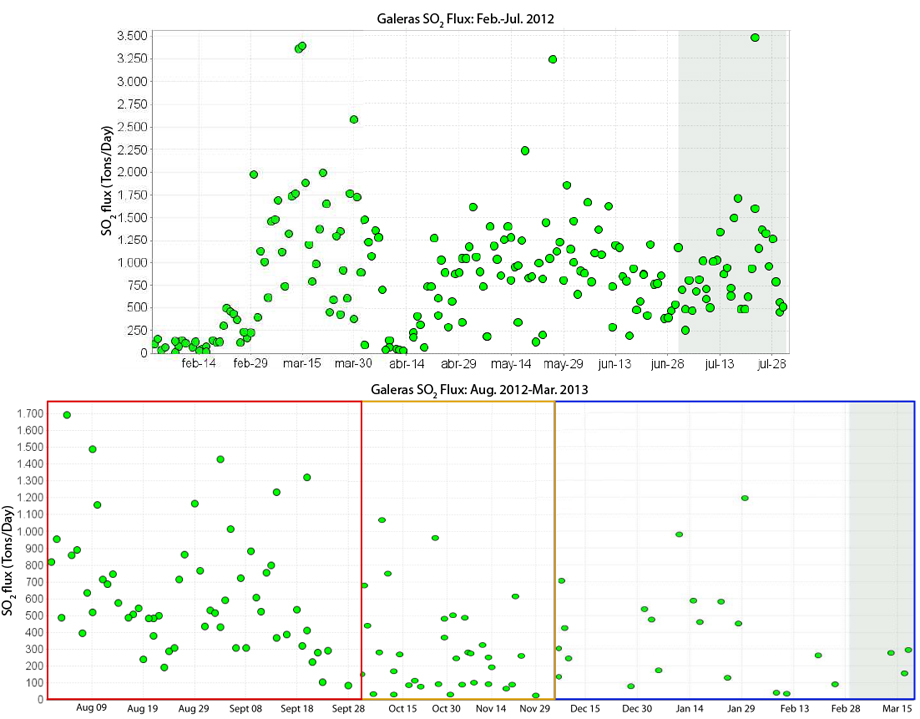 |
Figure 126. Galeras SO2 flux measured during February 2012-March 2013 from four instruments (three ScanDOAS and one MobileDOAS). For the time interval August 2012-March 2013, three plots were merged (boundaries are marked in red, orange, blue); the vertical scale is consistent for all three time intervals but the horizontal scale has been skewed. On both plots, the gray regions signify the reporting period in which the plots appeared in SGC Technical Bulletins. Courtesy of SGC. |
Very high SO2 was detected in March, May, and July of 2012 (up to 3,467 tons per day); relatively high levels were detected during August-October. The SGC established the following criteria for describing SO2 flux at Galeras: Low (under 500 t/d); Moderate (500-1,000 t/d); High (1,000-3,000 t/d); Very High (over 3,000 t/d). In these terms, SO2 detected during November 2012-March 2013 stood at moderate to low levels. The highest values during that time period were recorded in mid to late January (up to 1,194 t/d).
People noticed strong sulfur odors on 18 July; 1 and 6 August; 12 and 19 October; 30 November; 5 December; 25 and 28 February; and 1, 5, and 11 March. Reports were primarily from SGC staff working near the crater, but on 12 October, the staff at Galeras National Park Wildlife Sanctuary noted sulfur odors on the E side of the volcano. On 19 October the odor was present in the towns of Consacá (~13 km W) and Sandoná (~15 km NW).
May 2012-March 2013 deformation monitoring. In May, deformation recorded by most of the tilt stations was dominated by inflation in the W sector of the volcano; a zone that coincided with a cluster of earthquake epicenters during 9-10 May. Inflation continued to register in that region through March 2013. The four permanent GPS stations (Cráter, Cóndor, Barranco, and Mapachico) were operating during this time period (figure 116, BGVN 37:04). Unfortunately, the Mapachico site was vandalized on 27 August 2012 and thereafter its signal was lost.
On 31 October 2012, a new GPS station was brought online, San Cayetano, located ~4 km E (figure 127). The testing period for the new instrument continued through November. SGC did not highlight any deformation trends during December 2012-March 2013.
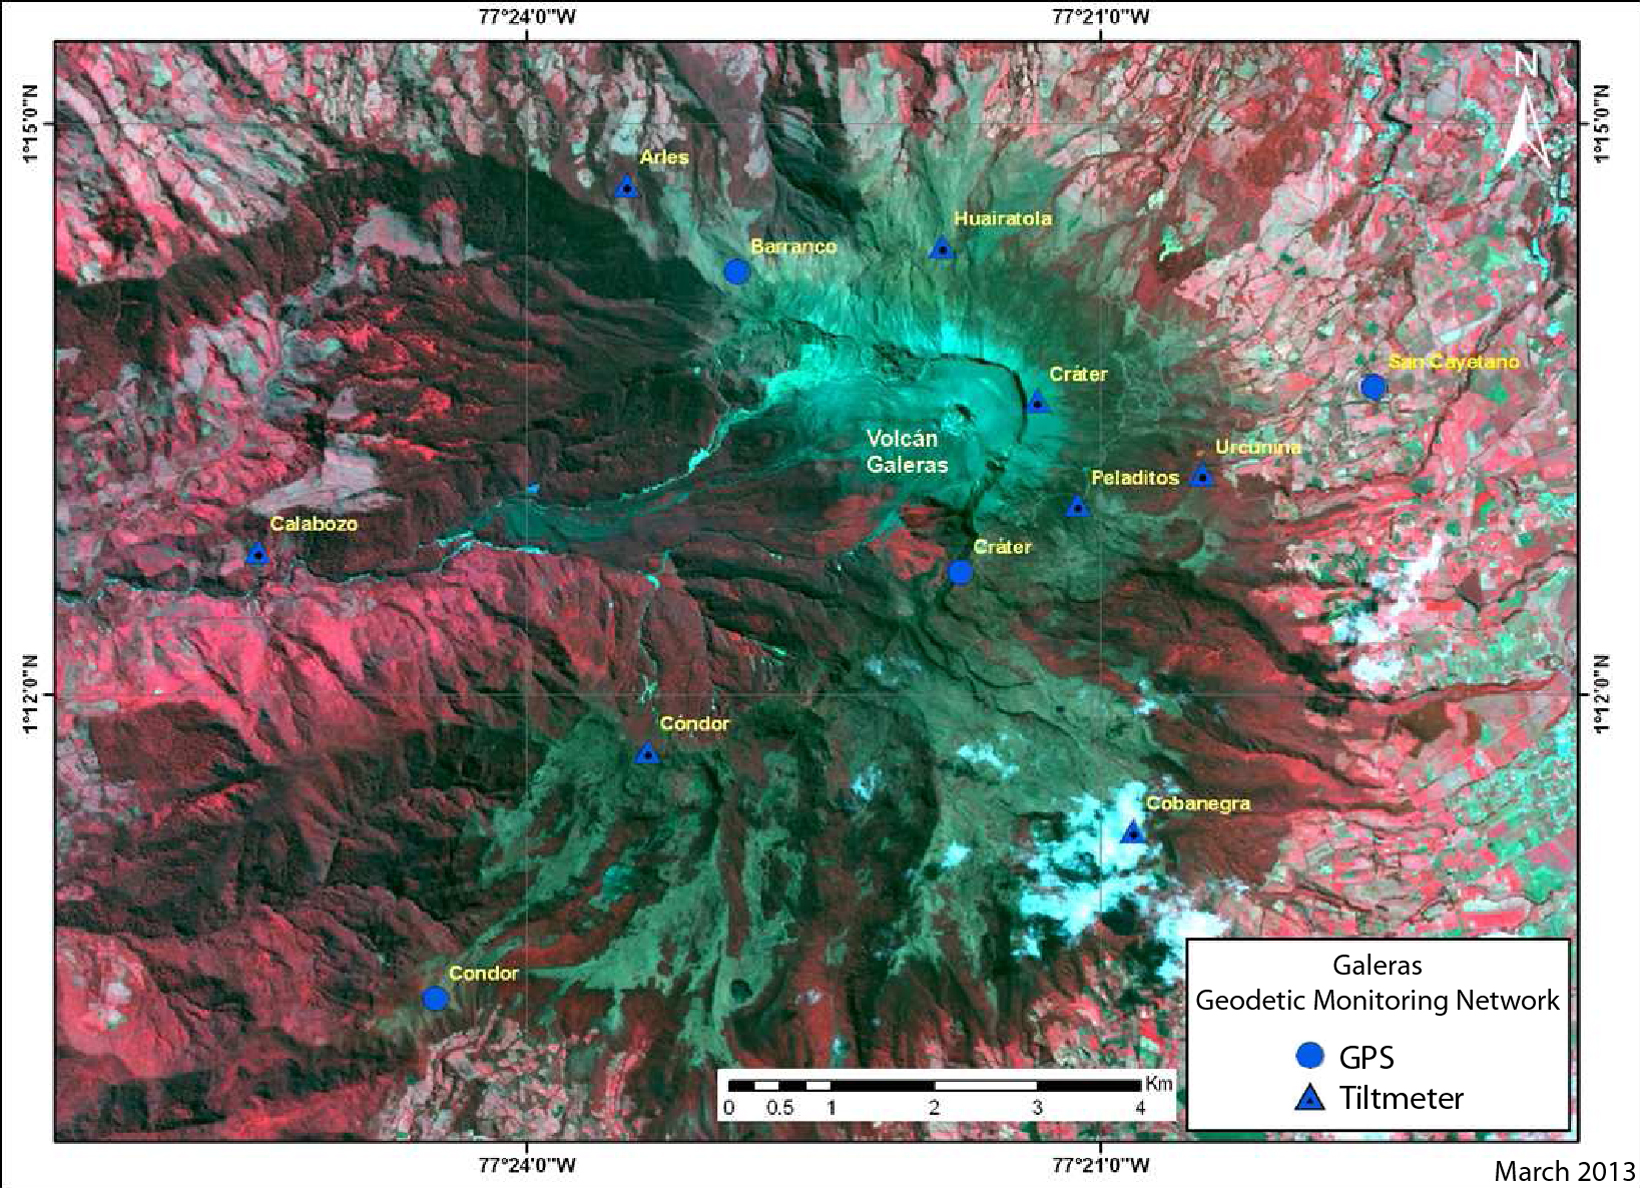 |
Figure 127. Map of the Galeras geodetic monitoring network from the March 2013 online Technical Bulletin. GPS and tiltmeter station locations are marked with symbols including the newest station, San Cayetano (within 4 km E of the active cone). Courtesy of SGC. |
Geological Summary. Galeras, a stratovolcano with a large breached caldera located immediately west of the city of Pasto, is one of Colombia's most frequently active volcanoes. The dominantly andesitic complex has been active for more than 1 million years, and two major caldera collapse eruptions took place during the late Pleistocene. Long-term extensive hydrothermal alteration has contributed to large-scale edifice collapse on at least three occasions, producing debris avalanches that swept to the west and left a large open caldera inside which the modern cone has been constructed. Major explosive eruptions since the mid-Holocene have produced widespread tephra deposits and pyroclastic flows that swept all but the southern flanks. A central cone slightly lower than the caldera rim has been the site of numerous small-to-moderate eruptions since the time of the Spanish conquistadors.
Information Contacts: Servicio Geológico Colombiano (SGC), Observatorio Vulcanológico y Sismológico de Pasto, Pasto, Colombia (URL: http://www.SGC.gov.co/Pasto.aspx); Washington Volcanic Ash Advisory Center (VAAC), Satellite Analysis Branch (SAB), NOAA/NESDIS E/SP23, NOAA Science Center Room 401, 5200 Auth Rd, Camp Springs, MD 20746, USA (URL: http://www.ospo.noaa.gov/Products/atmosphere/vaac/).