Report on Ahyi (United States) — February 2014
Bulletin of the Global Volcanism Network, vol. 39, no. 2 (February 2014)
Managing Editor: Richard Wunderman.
Ahyi (United States) Seismic/acoustic signals and bathymetric data validate April-May 2014 eruption
Please cite this report as:
Global Volcanism Program, 2014. Report on Ahyi (United States) (Wunderman, R., ed.). Bulletin of the Global Volcanism Network, 39:2. Smithsonian Institution. https://doi.org/10.5479/si.GVP.BGVN201402-284141
Ahyi
United States
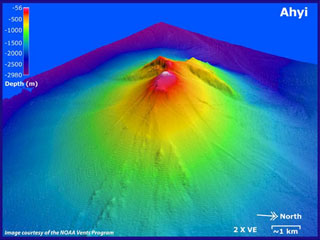
20.42°N, 145.03°E; summit elev. -75 m
All times are local (unless otherwise noted)
Ahyi seamount is located ~20 km SE of Farallon de Pajaros and was discussed in the Bulletin associated with volcanic unrest in 1979 (SEAN 04:01) and in 2001 (BGVN 26:05). The evidence for a 2014 eruption at Ahyi seamount includes seismicity, noises heard by divers and felt aboard a vessel in the area, and a follow-up research cruise to Ahyi that measured a hydrothermal plume and significant bathymetric changes since the last survey in 2003. This report is revised from an earlier version.
The U.S. Geological Survey (USGS) reported that, beginning about 0635 local time on 24 April 2014 (2035 on 23 April 2014, UTC), seismometers in various locations in the Mariana Islands began recording T-phase signals interpreted as stemming from an undersea eruption in an area to the N of Pagan island near the island of Uracas (also known as Farallon de Pajaros). Note that throughout this report, at the suggestion of William Chadwick of NOAA, 'T-phase signals' have been used in lieu of 'earthquakes' since all the eruption-related signals were hydroacoustic (from underwater explosions) rather than seismic body-waves. See the final section of this report for a brief definition of T-phase waves. The eruption was ultimately tracked to Ahyi seamount (figures 2 and 3).
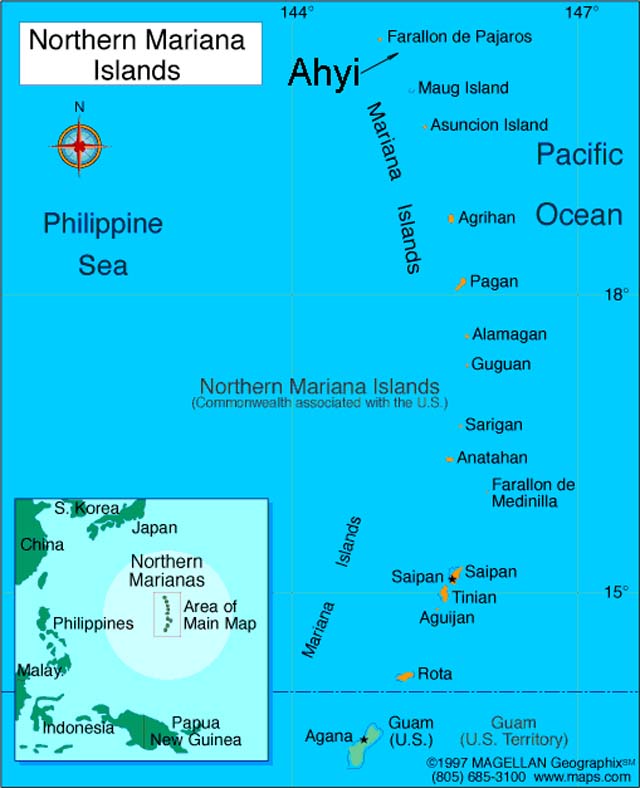 |
Figure 2. Map of the western Pacific margin showing the Northern Mariana Islands with the location of Ahyi volcano added. Original map from Magellan Graphix (1957). |
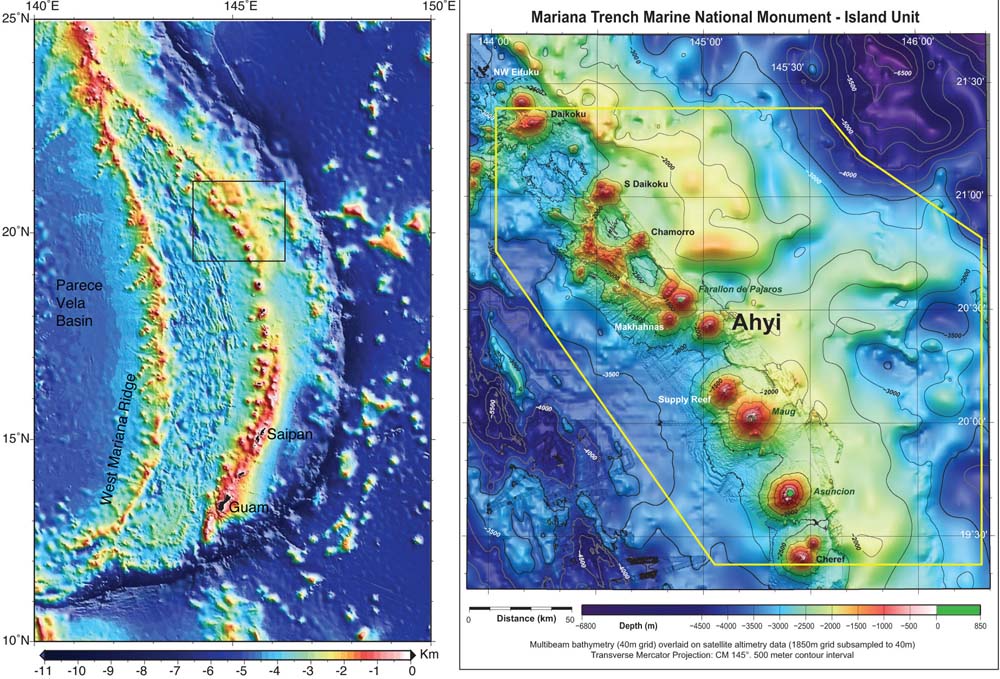 |
Figure 3. (left) A bathymetric map showing the islands and seamounts making up the Mariana island arc. The rectangular box on that map delineates the N part of the arc that is shown on the map at right. (right) A larger scale bathymetric map that highlights features in the vicinity of Ahyi seamount; within the yellow-lined box is the islands unit of the Mariana Trench Marine National Monument. Maps courtesy of Susan Merle, Oregon State University and NOAA-PMEL. |
Seismometers that recorded the 2014 T-phase signals included those on Saipan, Pagan, Sarigan, and Anatahan islands (figure 2). The USGS reported recording T-phases during 24 April through 8 May 2014. During this same period, hydroacoustic sensors on Wake Island (~2,300 km ENE from Ahyi) also received signals. The recorded events all indicated that the source of the hydroacoustic signals was at or near Ahyi seamount, but the accuracy of the initially determined locations remained uncertain because there are other active volcanic seamounts in the area.
On 25 April 2014 the Aviation Color Code was raised by the USGS from Unassigned (Volcanic Alert Level: Unassigned) to Yellow (Volcanic Alert Level: Advisory). As of 29 May, USGS had received no reports of an eruption plume or any evidence that eruptive products had reached the surface. Satellite images showed nothing indicative of a volcanic eruption. On 29 May the Aviation Color Code was lowered by the USGS to Unassigned (Volcanic Alert Level: Unassigned).
At the time of the T-phase signals in April 2014, submarine explosions were heard and felt by scuba divers conducting coral reef research in the area. Chip Young, leader of the Hi'ialakai expedition working in the area as part of a coral reef survey by the NOAA Pacific Islands Fisheries Science Center (PIFSC), provided the following information on 28-29 April 2014. At this stage, the source of the signals was still a mystery.
"While we were diving [on 26 April at Farallon de Pajaros (FDP)] we could hear eruptions underwater. It wasn't casual, in fact, it sounded like bombs exploding with the concussion felt through your body. I don't know how close we were to the event, none of the…divers saw volcanic activity, but at least one explosion was so powerful, that it reverberated through the hull of the ship and the crew onboard thought that something had happened to the ship (at the time they didn't realized we too were hearing these explosions under water)."
"The first divers' comments about hearing something underwater started at Asuncion (4/24-4/25). We were at FDP on [26 April] and to my best guess, the massive explosion that I previously wrote about occurred 0100-0230 26 APR 14 UTC on the SE side of FDP. There were plenty of other explosions throughout the day, but that was the largest one I experienced. There were conglomerates/mats of orange+yellow bubbles on the surface of the water on the SE coastline of FDP as well. We had a very calm day at FDP, so the mats/sludge stretched on for 20-30 ft [~7-9 m] or more. These could have been from Ahyi, but visual disturbances near Ahyi weren't specifically made because we passed there in the early [morning] on the way to FDP and then in the evening on the way to Maug. We did hear explosions underwater at Maug too. I heard distant explosions, which I assumed were from FDP, but there were closer ones too. Not as violent as the sounds we heard at FDP, but 'cracks' for sure."
During the height of the T-phase swarm, explosive signals from the underwater eruption source in the vicinity of Ahyi were occurring at a rate of ~20 per hour. On 16 May 2014, the USGS reported that over the preceding week, T-phase signals had greatly diminished.
Verification of 2014 Ahyi eruption. A subsequent expedition took place during 12-18 May, after the eruption T-phases had stopped. This expedition, led by Chip Young and Dave Butterfield aboard the R/V Hi'ialakai, was working at Maug island (~50 km SSE of Ahyi) and conducted several water-column CTD (conductivity-temperature-depth) casts in the area. They found a hydrothermal plume coming from Ahyi. In addition, they collected new bathymetric data over the summit of Ahyi, which showed the depth changes that confirmed that Ahyi was indeed the source of the 2014 eruption.
According to William Chadwick, NOAA surveyed Ahyi in 2003, measuring a summit depth of 60 m. After the T-phase signals declined in mid-May 2014, the NOAA ship Hi'ialakai went over the summit and the new minimum depth was found to be 75 m. In addition, a new summit crater is evident in the 2014 bathymetry that is ~95 m deep. Bloomer and others (1989) noted a value of 137 m as Ahyi's summit depth, based on U.S. Navy Sonar Array Sounding System (SASS), an early form of multibeam sonar. This pre-2003 summit depth value is probably less accurate and therefore does not necessarily represent a true depth change between the SASS survey and 2003.
Figure 4B shows the results of multibeam sonar bathymetry over Ahyi's summit collected by the Hi'ialakai in 2014. This map was compared to their previous survey in 2003 (figure 4A) and used to compose a third map (figure 4C) showing depth differences between the two surveys. In essence, the summit elevation dropped by 25 m; a crater had developed with a floor at a depth of 195 m; and a conspicuous landslide chute descended to at least 2,300 m depth along the SE slope. Up to 125 m of material was removed from the head of the landslide chute, and constructional deposits downslope were up to 40 m thick. The map analysts noted that even though the 2014 re-survey was limited and produced an incomplete look at the entire Ahyi edifice, the changes were very clear and indicated recent eruptive activity at Ahyi.
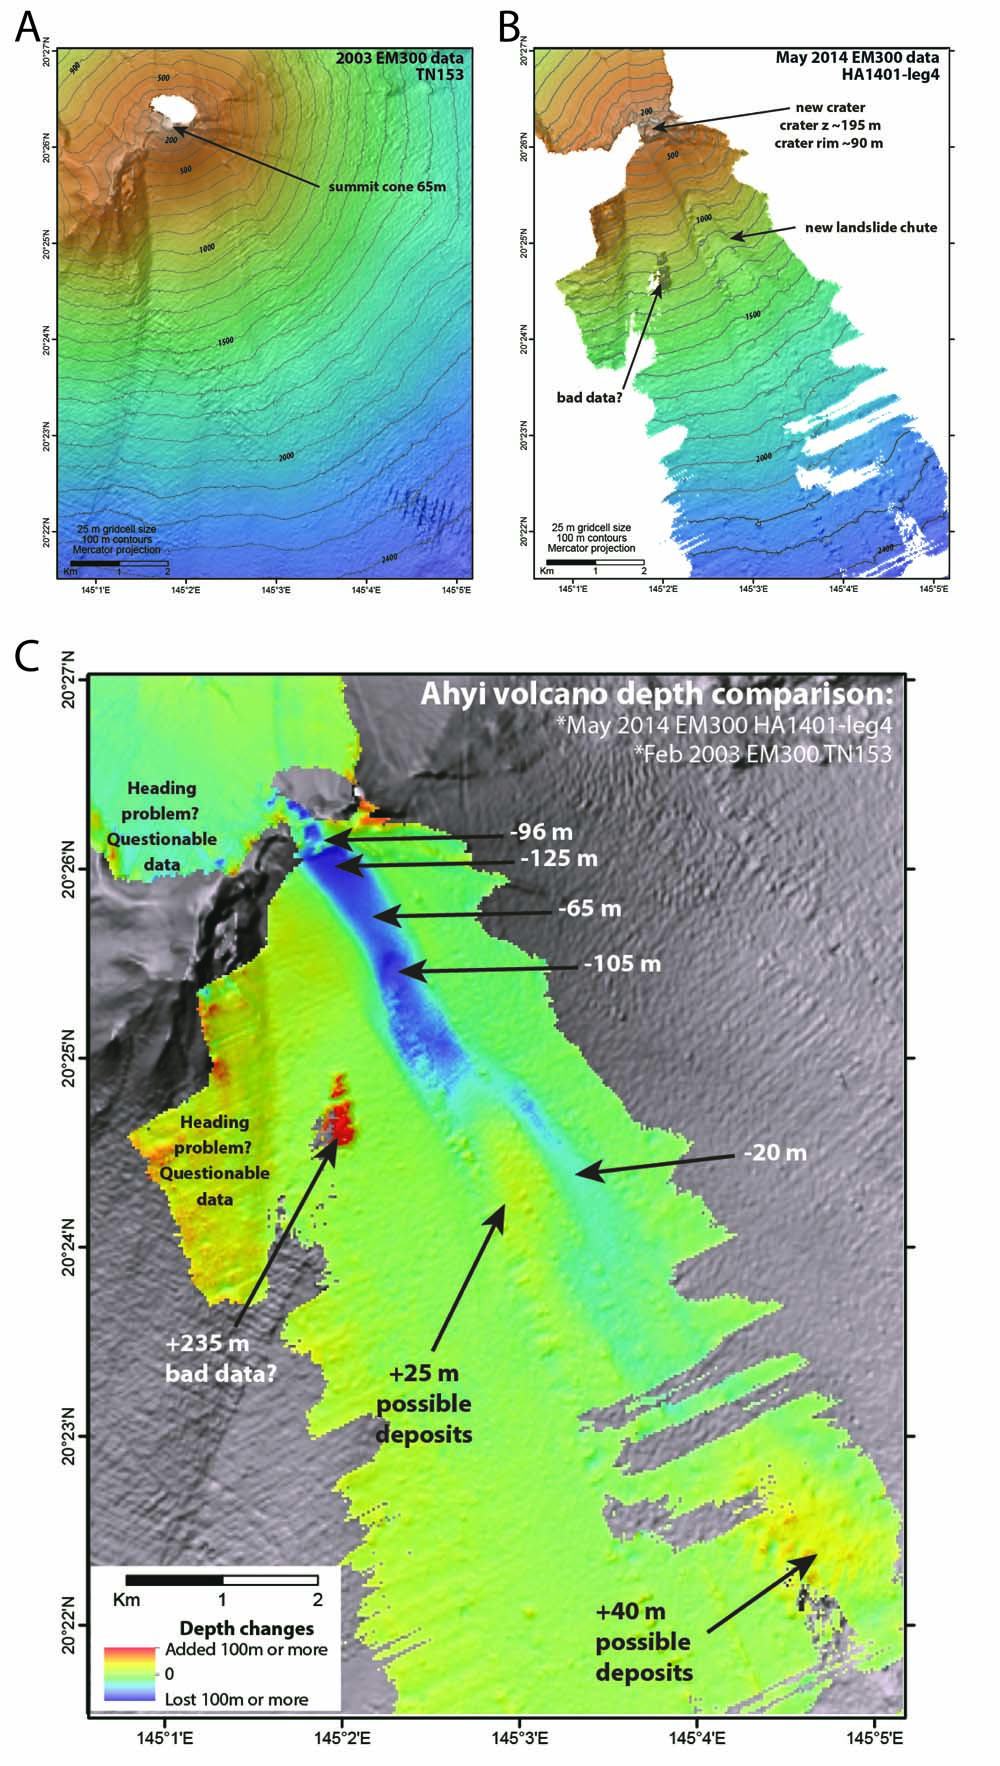 |
Figure 4. Three maps (frames A, B, C) showing multibeam bathymetry and analyses of bathymetric changes between surveys of 2003 and May 2014 of Ahyi volcano (white areas signify lack of data). (A) Bathymetry of Ahyi volcano conducted 2003 showing a cone with summit at a depth of 65 m (Merle and others, 2003). (B) Ahyi map from survey conducted May 2014. The cone was gone and was replaced by a new crater with a rim at 90 m depth and a floor at 195 m depth. The current minimum summit depth for the volcano at 75 m resides near the location on figure 4B labeled "crater rim ~90 m." Extending SSE from the new crater, the research disclosed a new landslide chute descending to at least 2,300 m depth. (C) Depth changes comparing 2003 and 2014 maps. As defined on key at lower left, the cool colors signify material removed; green, no change; and warm colors, material added. Labels indicate elevation changes disclosed in the comparison (e.g. -20 m means this area is 20 m lower on the 2014 map than on the 2003 map). Map courtesy of Susan Merle, Oregon State University and NOAA/PMEL. |
T-phase waves: According to Okal (2011) "T phases are defined as seismic recordings of signals having traveled an extended path as acoustic waves in the water body of the oceans. This is made possible by the 'Sound Fixing and Ranging' (SOFAR) channel, a layer of minimum sound velocity acting as a wave guide at average depths of 1,000 m. It allows the efficient propagation of extremely small signals over extremely long distances, in practice limited only by the finite size of the ocean basins."
The use of T-waves has led to much improved diagnosis of submarine vent locations. For example, Fox and Dziak (1998) described the detection of intense seismicity the NE Pacific Ocean using the T-phase Monitoring System developed by NOAA/PMEL to access the U.S. Navy's SOund SUrveillance System (SOSUS) in the North Pacific. Dziak and Fox (2002) discussed monitoring of hydroacoustic signals from the Volcano Islands arc, S of Japan (just N of the N Mariana Islands shown in figure 2), a region with frequent submarine eruptions. The signals are characterized by a narrowband, long-duration, high-amplitude fundamental centered at 10 Hz with three harmonics at 20, 30, and 40 Hz. The hydroacoustic (T-wave) signals are consistent with harmonic tremor signals observed using traditional seismic methods at active subaerial volcanoes throughout the world.
References. Bloomer, S.H., Stern, R.J., and Smoot, N.C., 1989, Physical volcanology of the submarine Mariana and Volcano Arcs, Bulletin of Volcanology, v. 51, pp. 210-224.
Bloomer, S.H., Stern, R.J., Fisk, E., and Geschwind, C.H., 1989, Shoshonitic Volcanism in the Northern Mariana Arc 1. Mineralogic and Major and Trace Element Characteristics, Journal of Geophysical Research, v. 94, no. B4, pp. 4469-4496.
Dziak, R.P., and Fox, C.G., 2002, Evidence of harmonic tremor from a submarine volcano detected across the Pacific Ocean basin, Journal of Geophysical Research, v. 107, no. B5, p. 2085.
Fox, C.G., and Dziak, R.P., 1998 (December), Hydroacoustic detection of volcanic activity on the Gorda Ridge, February-March 1996, Deep Sea Research Part II: Topical Studies in Oceanography, v. 45, no. 12, pp. 2513-2530 (DOI: 10.1016/S0967-0645(98)00081-2).
Magellan Graphix, 1997, Map: Northern Mariana Islands (territory of US) (URL: http://www.infoplease.com/atlas/state/northernmarianaislands.html).
Merle, S., Embley, R., Baker, E., and Chadwick, B., 2003, Submarine Ring of Fire 2003 - Mariana Arc R/V T.G. Thompson Cruise TN-153, February 9-March 5, 2003, Guam to Guam, Cruise Report, NOAA-PMEL (URL: http://www.pmel.noaa.gov/eoi/marianas/marianas-crrpt-03.pdf).
Okal, E.A., 2011, T Waves, in Gupta, H.K. (ed), Encyclopedia of Solid Earth Geophysics, pp. 1421-1423, Springer Netherlands (DOI: 10.1007/978-90-481-8702-7_165).
USGS, 2014 (30 April), Northern Mariana Islands Information Statement, Wednesday, April 30, 2014 5:36 AM ChST (Tuesday, April 29, 2014 19:36 UTC) (URL: http://volcanoes.usgs.gov/activity/archiveupdate.php?noticeid=10031).
USGS, 2014 (1 May), A new submarine eruption in the Northern Mariana Islands: could it happen here?, Hawaii Volcano Observatory (URL: http://hvo.wr.usgs.gov/volcanowatch/view.php?id=226).
USGS, 2014 (16 May), Current Alerts for U.S. Volcanoes, Northern Mariana Islands Weekly Update, 16 May (URL: http://volcanoes.usgs.gov/nmi/activity//status.php).
USGS, 2014 (23 May), Northern Mariana islands Weekly Update, 23 May 2014 (URL: http://volcanoes.usgs.gov/nmi/activity/index.php).
Geological Summary. Ahyi seamount is a large conical submarine volcano that rises to within 75 m of the ocean surface ~18 km SE of the island of Farallon de Pajaros in the northern Marianas. Water discoloration has been observed there, and in 1979 the crew of a fishing boat felt shocks over the summit area, followed by upwelling of sulfur-bearing water. On 24-25 April 2001 an explosive eruption was detected seismically by a station on Rangiroa Atoll, Tuamotu Archipelago. The event was well constrained (+/- 15 km) at a location near the southern base of Ahyi. An eruption in April-May 2014 was detected by NOAA divers, hydroacoustic sensors, and seismic stations.
Information Contacts: NOAA Pacific Marine Environmental Laboratory (NOAA-PMEL), 7600 Sand Point Way NE, Bldg #3, Seattle, WA 98115 (URL: http://www.pmel.noaa.gov/); William W. Chadwick and Susan Merle, NOAA-PMEL Earth-Ocean Interactions Program and Oregon State University; David A. Butterfield, University of Washington and NOAA-PMEL; Charles (Chip) Young, NOAA Fisheries, Pacific Islands Fisheries Science Center (PIFSC); Matt Haney, U.S. Geological Survey (USGS), Alaska Volcano Observatory (AVO), Anchorage, AK 99508; USGS Volcano Hazards Program (URL: http://volcanoes.usgs.gov/nmi/activity/); and CNMI Emergency Management Office (URL: http://www.cnmihomelandsecurity.gov.mp/).