Report on Kilauea (United States) — May 2014
Bulletin of the Global Volcanism Network, vol. 39, no. 5 (May 2014)
Managing Editor: Richard Wunderman.
Edited by Julie A. Herrick.
Kilauea (United States) During 2013, a summit lava lake and lava flows on slopes and into ocean
Please cite this report as:
Global Volcanism Program, 2014. Report on Kilauea (United States) (Herrick, J.A., and Wunderman, R., eds.). Bulletin of the Global Volcanism Network, 39:5. Smithsonian Institution. https://doi.org/10.5479/si.GVP.BGVN201405-332010
Kilauea
United States
19.421°N, 155.287°W; summit elev. 1222 m
All times are local (unless otherwise noted)
This report summarizes observations and monitoring data from Kīlauea during January-December 2013; activity during 2010-12 was covered in BGVN 38:05. The primary reporting source was the U.S. Geological Survey-Hawaiian Volcano Observatory (HVO) which provided monitoring and communication resources for the Hawaiian volcanoes, namely Kīlauea, Mauna Loa, Mauna Kea, Hualalai, and Lo`ihi.
2013 Overview. During 2013, Kīlauea's summit lava lake persisted , and lava flows erupted from Pu'u 'O'o. Two minor ocean entries were visible during the year until mid-July; both were branches of the Peace Day flow while, later in the year, two lava flows (Kahauale'a 1 and Kahauale'a 2) extended N-NE from Pu'u 'O'o. Both lava flows crossed into the nearby forest, causing fires and significant smoke along their margins. Petrology of the summit tephra and East Rift Zone (ERZ) did not show significant changes during the year. SO2 emissions from both, the summit and the active ERZ were closely monitored by HVO and those observations led to new innovations in quantifying the flux. HVO reported that SO2 and also CO2 fluxes were relatively low but still above safe levels as established by the Centers for Disease Control and Prevention. Flank deformation and seismic monitoring determined that, although variable conditions were detected, very little accumulated change had occurred at Kīlauea.
Due to the Federal shutdown during 1-16 October 2013, HVO focused on only the most critical operations. Activities that were not directly related to critical operations were postponed, including research and outreach.
One such outreach opportunity that became curtailed was the first Great ShakeOut for Hawai`i which took place on 17 October 2013 and included almost 16,000 participants across all of the islands. This was a large-scale earthquake drill that followed in the tradition of The Great Southern California ShakeOut, which took place in 2008. HVO partnered with the State and County Civil Defense, Center for the Study of Active Volcanoes (CSAV), National Oceanic and Atmospheric Administration (NOAA), University of Hawai`i (UH-Hilo), American Red Cross, and FEMA. HVO staff generated a significant amount of information for the media including several press releases and web content; they also attended preparedness fairs and gave public talks.
Persistent thermal anomalies during 2013. More than 200 alerts per month were released by the MODVOLC program during 2013 for the Big Island of Hawai`i (figure 211). These alerts came from sites around the island that exhibited elevated radiance and were dominated by Pu'u 'O'o and the Kīlauea summit. One exceptional thermal anomaly was a site along the Mamalahoa Highway (Highway 190) in the NW sector of the island. News sources reported that, during 25-26 November 2013, a significant brushfire burned 300 acres in South Kohala. The burn site was near the highway mile marker 14 and caused segments of the highway to close while emergency crews contained the fire.
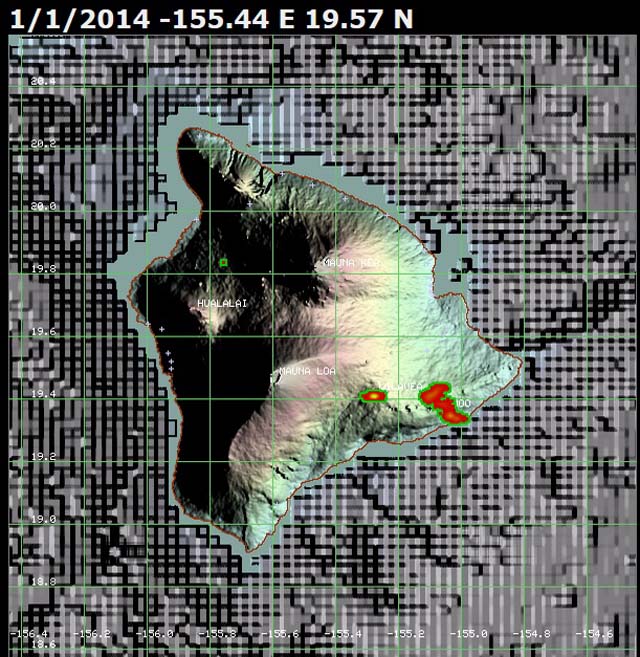 |
Figure 211. More than 200 thermal alerts were posted each month in 2013 by the MODVOLC program for the island of Hawai`i. This image captures the thermal alerts registered during January-December 2013. Note the concentration of red-to-yellow thermal alert pixels at the summit of Kīlauea and at the Pu'u 'O'o vent along the E rift that also reached the sea. The anomalous pixel located N of Hualalai (green box) was attributed to a fire that burned near Highway 190 during 25-26 November 2013. Courtesy of MODVOLC. |
Summit lava lake activity. "Now in its sixth year, the current summit eruption harks back to the persistent lava lake in Halema`uma`u during the 1800s and early 1900s, suggesting that it has the potential to last for many years" (Patrick and others, 2013). Based on Hawai`i's written record, one earlier summit lava lake occupied Halema`uma`u during 1823-1924.
During 2013, the summit lava lake within the Overlook crater, a nested crater within Halema`uma`u, fluctuated in height, by tens of meters, resulting in perched lava deposits (bathtub rings) and collapse of the crater walls. The crater englarged slightly as a result.
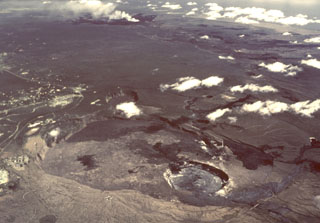
Also, observers frequently noted nighttime incandescence (figure 212). Local webcameras (infrared and visible-light) captured images of the lava lake from the Halema`uma`u Overlook site as well as from the highest point of the HVO facility.
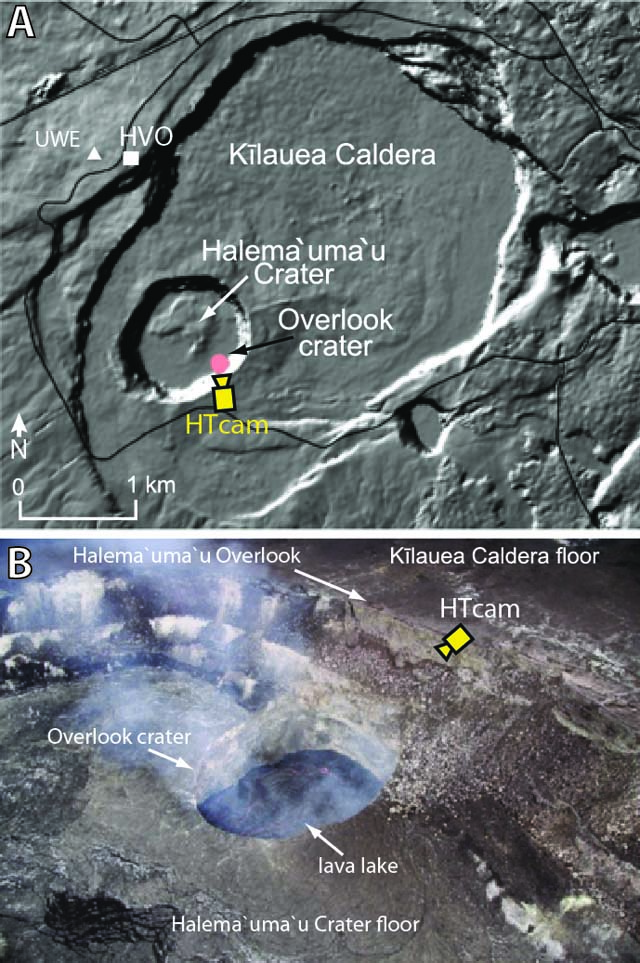 |
Figure 212. During 2008-2013, an active lava lake resided within the Overlook crater, a feature within Halema`uma`u crater at Kīlauea's summit. A) This shaded relief map indicates where HVO installed a thermal camera (HT cam) to view the entire surface of the lava lake. HVO and the summit tiltmeter (UWE) are 1.9-2.0 km from the lava lake. B) This oblique view is an aerial photo of the SE crater rim of Halema`uma`u. Modified from Patrick and others (2014). |
The HT infrared camera occasionally documented crater rim collapse events in 2013. These events were relatively small-sized and tended to occur more frequently when the lava lake level was relatively deep within the Overlook crater (for example, a small collapse occurred when the lava lake was at a depth of ~75 m during 25-26 July 2013). When the lava lake was high, however, the interior walls were subjected to heating and cracking and HVO scientists concluded that collapse events could be triggered during these conditions as well. One collapse event, on 15 November 2013, was likely triggered by slumping due to heavy rain; several Park Rangers observed the event and the collapse was heard by an HVO scientist standing at the Jaggar Overlook (the same location shared with HVO on the crater rim).
A crust of lava had formed an inner rim within the Overlook crater and, on 25 July at 2033, a portion of that rim collapsed into the lava lake (figure 213). The main event was followed by smaller collapses of the deep inner ledge during the following day. Based on webcamera images, explosive events were not triggered by the collapse. HVO reported that, since the formation of the lava lake (March 2008), the largest gas-and-ash emissions from the summit were triggered by gravitational collapses along the crater rim; when rockfalls hit the convecting lava's surface, violent gas release could occur.
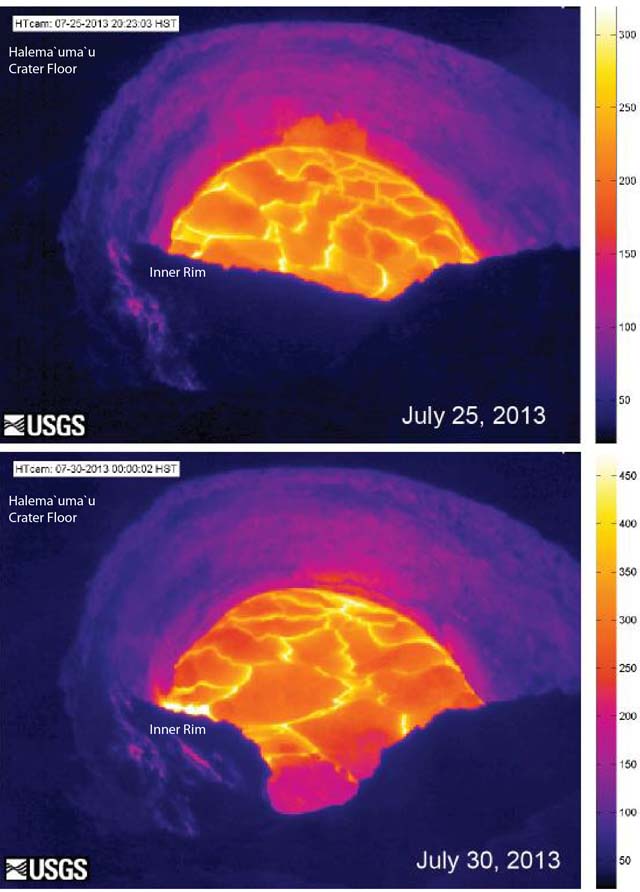 |
Figure 213. These two thermal images were taken before (25 July 2013) and after (30 July 2013) the collapse of the inner rim of Kīlauea's Overlook crater. The inner rim had been constructed during high lake levels in October 2012 (~22 m below the Halema`uma`u crater floor). The webcam (HT cam) was located on rim of Halema`uma`u crater and it captured a new image every ~15 minutes; the temperature scale is in degrees Celsius up to a maximum of 500°C and it automatically scaled based on the maximum and minimum temperatures within the frame. At the time of these photos, the surface of the lava lake was ~75 m below the Overlook crater rim. Courtesy of HVO. |
According to HVO, the lava lake level within the Overlook crater generally fluctuated 30-60 m below the rim during 2013. A laser rangefinder was used to obtain regular measurements during the year. Lava was closest to the rim and flooded part of the inner ledge of the crater in January 2013 (an event that also occurred in October 2012). Lava at the flooded lake's margin chilled and reinforced the bathtub-like ring that persisted above the active lava surface (note the "inner rim" in figure 213). In daily online reports, HVO noted: "The lake level responds to summit tilt changes with the lake generally receding during deflation and rising during inflation."
Starting in 2009, HVO scientists noted rise/fall events and determined that the pattern began with decreasing tremor from the summit at a time when lava rose within the lake, spattering would decrease or completely stop, and summit tilt would also decrease. "After a period of minutes to hours, the lava will abruptly drain back to its previous level amidst resumed vigorous spattering, seismic tremor amplitude will increase for a short time (a seismic tremor burst) before resuming background levels, and summit tilt will return to its previous level. Gas emissions decrease significantly during the high lava stand (the plume gets wispy), and resume during its draining phase. Taken together, the geophysical characteristics suggest that, during the high lava stand, lava is puffed up with gas trapped under the lava lake crust."
During 2013, explosive events at the summit rarely occurred; intermittent spattering and degassing dominated summit activity. The plume from the vent continued to deposit variable amounts of ash, spatter, and Pele's hair onto nearby areas, particularly downwind of the crater (figure 214). The Overlook crater diameter was 35 m in March 2008 and, by the end of 2013, the dimensions had increased to 160 x 215 m. The size increase followed minor explosions and rockfalls from the interior crater walls.
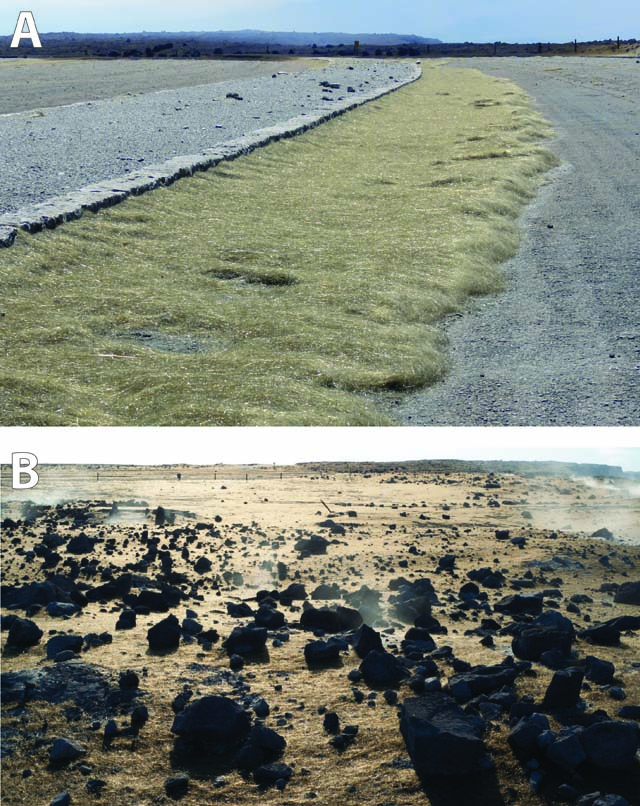 |
Figure 214. Pele's hair (fine strands of natural glass) continued to accumulate downwind of Kīlauea's active summit crater. A) This photograph from 3 May 2012 was taken looking along the curb of the Halema`uma`u parking lot (closed to the public since the onset of summit activity in 2008), and shows a mat of Pele's hair accumulated on the windward side of the parking curb. Courtesy of Matthew Patrick, USGS. B) On 9 December 2013, a continuous carpet of Pele's hair was observed shining like gold near the Halema`uma`u Overlook trail next to the parking lot. Courtesy of Ben Gaddis, USGS. |
Kīlauea's Overlook crater lava lake produced a small explosion during 2148-2149 on 23 August 2013 (figure 215). A portion of the overhanging SE crater rim collapsed and struck the surface of the lava lake. The debris had fallen into an area where nearly persistent spattering had previously been observed. The ensuing explosion generated a plume containing ash, lapilli, bombs (up to 34 cm in diameter), and lithics (ash, lapilli, and blocks up to 10 cm in diameter). The plume deposited material across the Overlook area. The level of the lava lake had been measured as ~38 m below the rim of Halema`uma`u crater earlier that day. Normal conditions prevailed after visibility returned within the camera's field of view at ~2149.
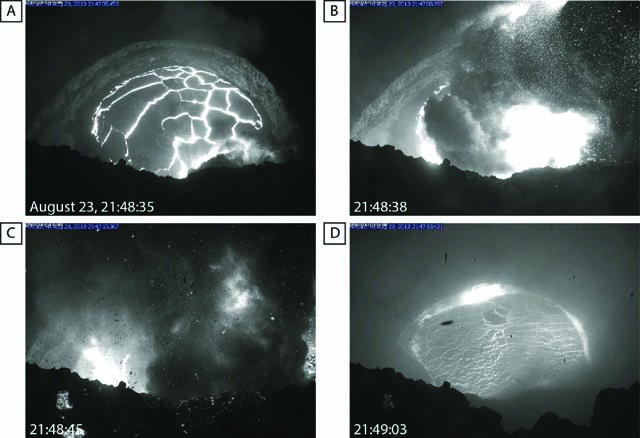 |
Figure 215. Images captured between 2148 and 2149 on 23 August 2013 by the HT camera (see figure 212 for location) during a small explosion from Kīlauea's lava lake. The thermal images A-D highlight the incandescence that persisted from the lake's surface as well as the hot spatter and debris that exploded after a portion of the inner crater rim fell into the lava lake. Courtesy of HVO. |
Pu'u 'O'o and East Rift Zone lava flows. The Pu'u 'O'o eruption consisted of three lava flows during 2013: the Peace Day, Kahauale'a, and Kahauale'a 2 flows (figure 216). The Kahauale'a flows were unique in that they traveled N of the rift zone, unlike the numerous other lava flows that have spread generally toward the ocean (including the Peace Day flow) (figure 217). This activity was considered the continuation of Episode 61, which began on 20 August 2011 and continued through the end of this reporting period (December 2013).
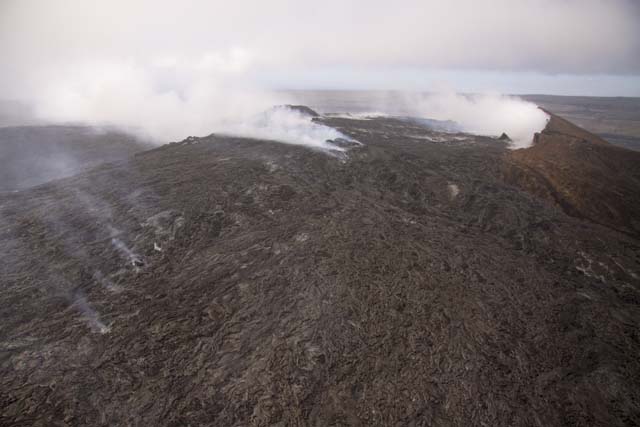 |
Figure 216. The "spillway"—Pu`u `O`o's eastern flank—has been buried by flows fed mostly from a spatter cone on the NE side of the crater floor. Most of the dark-colored lava in the foreground is new lava that has resurfaced the spillway during the past year. The fume to the left is the trace of the Peace Day tube which carried lava to the coast and had been covered by lava flows from the crater . The tube carrying lava to the NE is inconspicuous, but extends toward the lower right side of the photo. Photo taken on 25 February 2013. Courtesy of HVO. |
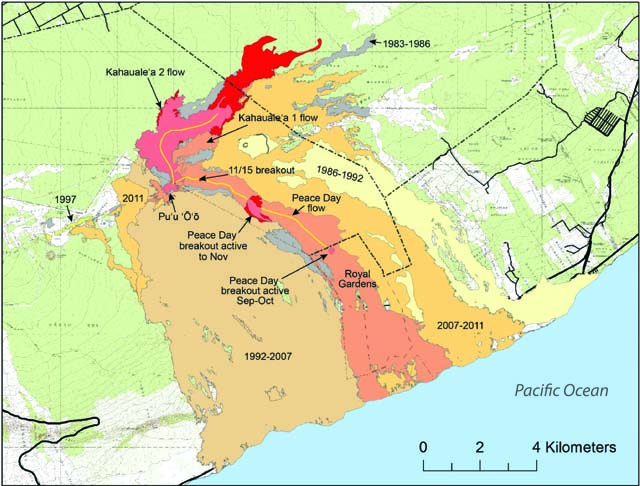 |
Figure 217. Geologic map of Kīlauea's East Rift Zone and lava flows from the active vent, Pu`u `O`o. The distribution of lava flows emplaced during 2013 is shaded red (bright red, pink, and red-orange). The yellow lines extending from Pu`u `O`o represent the general path of lava tubes that directed the flows Peace Day, Kahauale'a 1, and Kahauale'a 2. Changes to the surface area of the Kahauale'a 2 and Peace Day flows are shaded bright red, corresponding to activity during 19 September-26 December and 19 September-2 November 2013 respectively. Note that Kahauale'a 1 was active during 19 January-17 April 2013. Courtesy of HVO. |
The morphology of Pu'u 'O'o crater was relatively stable through 2013. The crater remained very shallow and at or near the level of the original E spillway rim (figure 216). There were four spatter cones, all consistently active and often exhibiting incandescent openings at their tops (figure 218). These cones also emitted gas-jetting sounds and occasional, effusive spattering. The main center of activity through the year was the NE spatter cone. This cone often hosted a small lava pond and served as the vent for the Kahauale'a and Kahauale'a 2 flows.
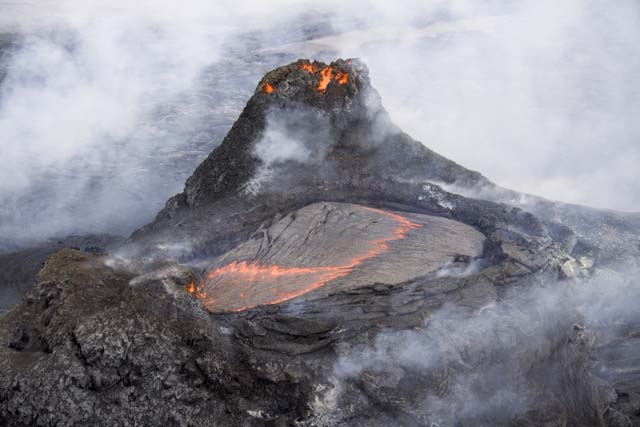 |
Figure 218. A small lava lake, several meters in diameter, had persisted for nearly a year on the NE side of the Pu`u `O`o crater. The lake was perched several meters above the surrounding crater floor (seen behind the topographic high, shrouded in steam). The feature was near the top of a mound of lava composed of spatter cones and lava lake overflows. Flows from the lake and other nearby spatter cones had inundated the E rim of Pu`u `O`o's crater, which would normally be visible in the background just behind the area seen here. Photo taken on 31 January 2013. Courtesy of HVO. |
In late 2012, Pu'u 'O'o crater was slowly infilling, and by the beginning of 2013, lava from the NE spatter cone reached the E spillway rim. A dramatic inflation event in mid-January triggered numerous overflows from the NE spatter cone, and the SE cone spread more lava across the crater floor but also sent flows over the E spillway. On 19 January, an overflow from the NE spatter cone sent lava down the E spillway in what would become the Kahauale'a flow. Over the next month, overflows from the cone covered much of the E spillway. Inflation in late April correlated with abundant venting and more overflows from four cones on the crater floor, with some spilling out toward the E, adding to the recent flows mantling the upper E flank of Pu'u 'O'o (figure 219). After the Kahauale'a flow eventually stalled in April, overflows in early May from the NE spatter cone fed a new flow, following the same course; this became the Kahauale'a 2 flow. Small overflows occurred sporadically from the cones through the remainder of the year, with larger events in mid-August and mid-November.
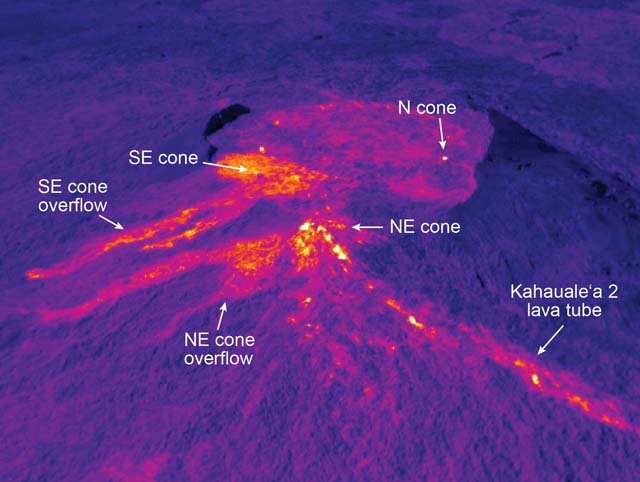 |
Figure 219. This thermal image of Pu`u `O`o was captured on 27 November 2013. The SE and NE spatter cones had produced small flows that extended out of the crater, shown clearly here by their warm temperatures. The vent for the Kahauale`a 2 flow is at the NE spatter cone, and the lava tube supplying the Kahauale`a 2 flow is obvious as the line of elevated temperatures extending to the lower right corner of the image. The distance between the black scarps is ~ 300 m. Courtesy of HVO. |
Coastal plain lava flows and ocean entries. The Peace Day flow (episode 61b) began on 21 September 2011, and it was active for much of 2013 before ceasing in November 2013. This lava flow reached the sea and generated scattered, branching flows (breakouts) on the coastal plain, as well as several isolated breakouts above the pali (fault scarp).
The ocean entry consisted of two main entry points during 2013, with an E entry at Kupapa`u (just E of the Park boundary) and a smaller, weaker entry immediately to its W (within the Park). These entry points were not vigorous; there were little-to-no-observed littoral explosions; a delta formed that extended several meters out from the sea cliff (figure 220 A).The view from the E margin of the Peace Day flow field on the sea cliff was relatively good, and the ocean entry provided a destination for guide services (not all sanctioned) operating out of Kalapana (numerous, possibly over 100 tourists made the hour-long walk out to the site each evening). As activity on the coastal plain declined in the summer, the W entry shut down in mid-July; the E entry ceased on 21 August.
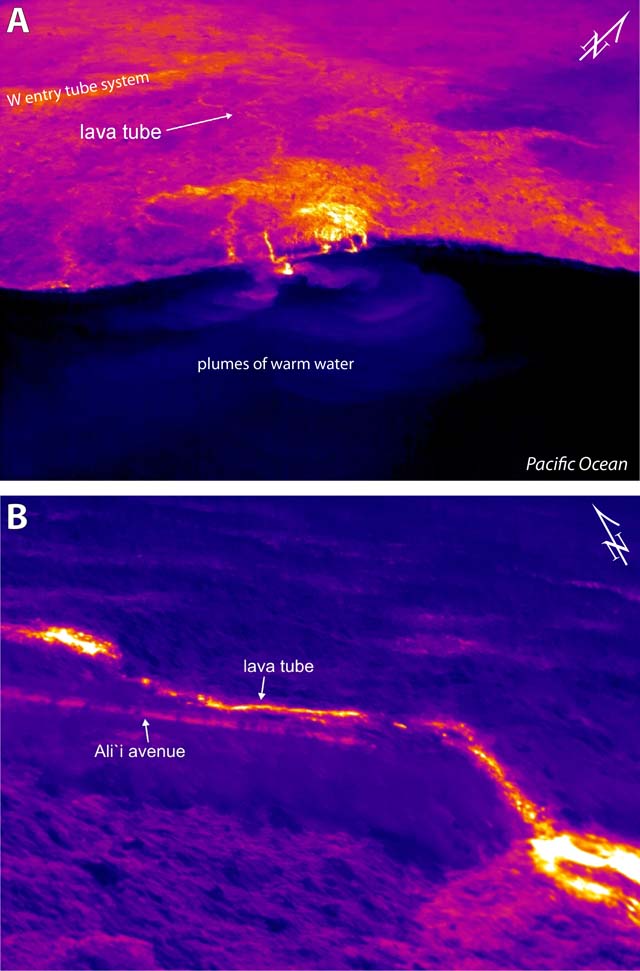 |
Figure 220. Thermal images have helped HVO geologists map Kīlauea's lava tube system. (A) This thermal image from 27 June 2013 shows Kīlauea's E ocean entry (spanning ~ 1 km along the shore) at Kupapa`u Point. Just inland from the entry point a patch of slightly warmer temperatures indicates an area of recent small breakouts. Inland from this warm patch you can see a narrow line of elevated temperatures that traces the path of the lava tube beneath the surface that is supplying lava to this ocean entry. Two plumes of higher temperature water (~50°C in areas close to the ocean entries) spread out from the entry point. Courtesy of HVO. (B) This image shows the Peace Day lava tube coming down the pali in Royal Gardens subdivision on 24 May 2013. The lava tube parallels Ali`i avenue (see figure 217 for the location of Royal Gardens), shown by the straight line of warm temperatures that represent asphalt heated in the sun. This tube feeds lava to the ocean entry and breakouts on the coastal plain. There is no active lava on the surface in this image - the warm surface temperatures are due to heating by the underlying lava tube. Courtesy of HVO. |
Most of the Peace Day flow activity during 2013 was constrained to the coastal plain. From January through August, the coastal plain featured episodic of breakouts near the base of the pali in Royal Gardens. Those branches from the main flow slowly migrated toward the ocean before halting on the coastal plain (figure 220 B). Eventually, another breakout occurred at the base of the pali and sent out another flow that presumably drained supply from the previous flow. The new flow reached the location of the stagnating previous flow, and the flows became an indistinguishable mix of small, scattered breakouts in the middle of the coastal plain (figure 221). Minor, scattered breakouts were common on the coastal plain during January-August. Activity levels declined by August, the ocean entry diminished, and the last coastal plain flows ended around 8 September. With no ocean entry or surface flows, the coastal plain (and Kalapana-based lava tourism) became quiet again.
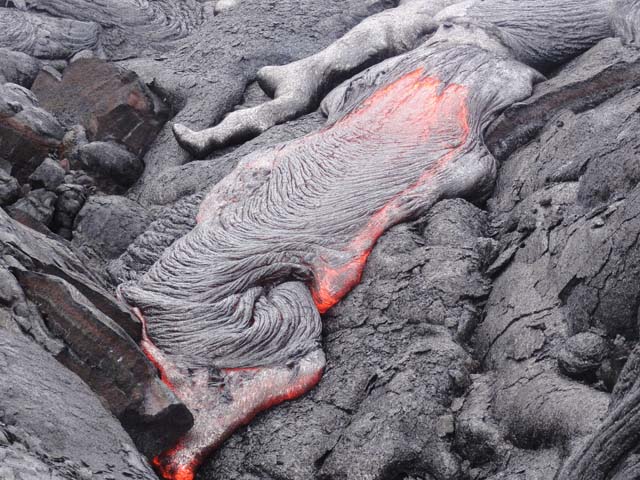 |
Figure 221. Lava flows from Pu'u 'O'o consisted of only a few scattered breakouts near the shoreline on 18 January 2013, with most of the activity focused on the coastal plain closer to the base of the pali. This pahoehoe lobe (~1 m wide) was active near the E margin of the Peace Day flow field just a few hundred meters from the coastline. Courtesy of HVO. |
Lava flow activity above the pali. From mid-January to the end of May 2013, a large amount of lava escaped the Peace Day tube to create a divergent flow above Royal Gardens. It did not advance very far until April, when it crept slowly downslope into the upper reaches of Royal Gardens. This breakout flow ceased on 30 May. As the coastal plain breakouts progressively decreased during September, two small flows appeared above the pali, presumably resulting from the abandonment of the lower Peace Day lava tube. The smaller of the two breakouts was at the top of Royal Gardens, about 6 km from Pu'u 'O'o, and appeared to start between 7 and 14 September but was inactive by mid-October (timing was determined in large part by satellite images as opposed to direct observation). This small breakout flow was visible from the Kalapana lava-viewing area.
The larger of the two breakouts began around 5 September and was about 3 km SE of Pu'u 'O'o, advancing a little over a kilometer before stalling. This breakout was active until 7 November, when it and the rest of the Peace Day flow stalled. This wasn't the end, however, and the Peace Day flow gasped a final breath when a very small, brief breakout occurred on the upper Peace Day lava tube, near Pu'u Halulu, on 15 November. It was probably active for only minutes or hours and marked the end of the Peace Day flow.
The Kahauale'a flow (episode 61c) began as an overflow from the NE spatter cone on 19 January 2013, occurring simultaneously as Kīlauea inflated. It advanced down the NE flank of Pu'u 'O'o, N of the Peace Day tube, until it hit flat topography N of the cone where it developed a lava tube and covered early Pu'u 'O'o 'a'a flows. The flow consisted of scattered pahoehoe lobes, and these migrated slowly (~50 m/day) E toward Kahauale'a cone, reaching it in mid-February (figure 222). From there, it followed the N margin of an earlier flow emplaced during the episode 58 flow. The path of this new flow abutted the steep northern slope of the 2007-2008 perched lava channel. This confinement led to a narrowing of the advancing flow front, resulting in increased advance rates (>100 m/day) in early March. As the front passed the perched channel, it became less confined, and advance rates dropped to under 50 m/day. By the first week of April, the flow had reached 4.9 km from the vent on Pu'u 'O'o but ceased on 17 April during a deflation-inflation (DI) event (see figure 199 in Bulletin 38:02 where DI events are illustrated). Due to infrequent overflights by HVO scientists during 2013 (resulting from budget cuts), staff relied heavily on satellite images--particularly EO-1 Advanced Land Imager images--to track the advance of the flow.
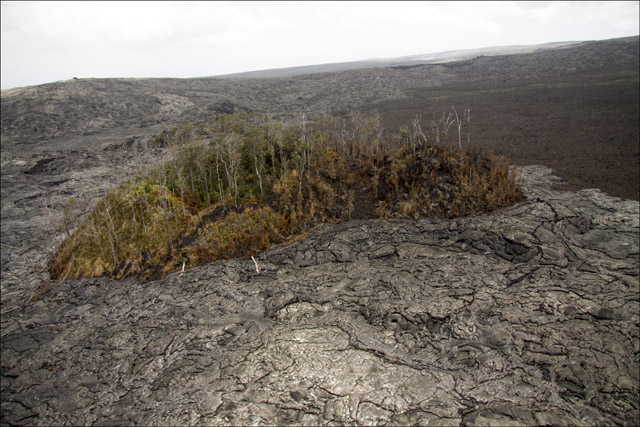 |
Figure 222. Kahauale`a Cone, a local topographic high several hundred meters long, has long been a small oasis of vegetation in the midst of Pu`u `O`o lava. This photo from 19 March 2013 shows new lava from the active Kahauale`a flow surrounding the cone, which has also partly burned. Vent structures (such as episode 58, active from 2007 to 2011), are in the background just behind Kahauale`a. Pu`u `O`o is out of sight to the right. Courtesy of HVO. |
HVO noted that the Kahauale'a flow was unusual in that the most recent flows from Pu'u 'O'o traveled S toward the ocean, providing minimal threat to residential areas. The Kahauale'a flow, however, was directed N of the rift zone, along a NE trend. This put the flow on a downslope trajectory that could have threatened residential areas of including Ainaloa and Paradise Park. HVO and Hawai'i County Civil Defense increased their communications through that time period but just a few weeks later, in mid-April, an abrupt change in magma supply occurred at Pu'u 'O'o and the flow ceased.
Inflation at Pu'u 'O'o produced another overflow from the NE spatter cone, which started on 6 May. This became the Kahauale'a 2 flow (episode 61d) and was directed slightly more to the N by the original Kahauale'a flow, reaching the forest boundary ~2 km NW of Pu'u 'O'o in early June. These flows invaded the forest a short distance and created steady forest fires. During July, the flow front took a more northeasterly course, following the N margin of the original Kahauale'a flow (figure 223). Its advance slowed during late July to mid-August, but during September the advance increased when the flow entered the previously mentioned narrow channel along the episode 58 perched lava channel.
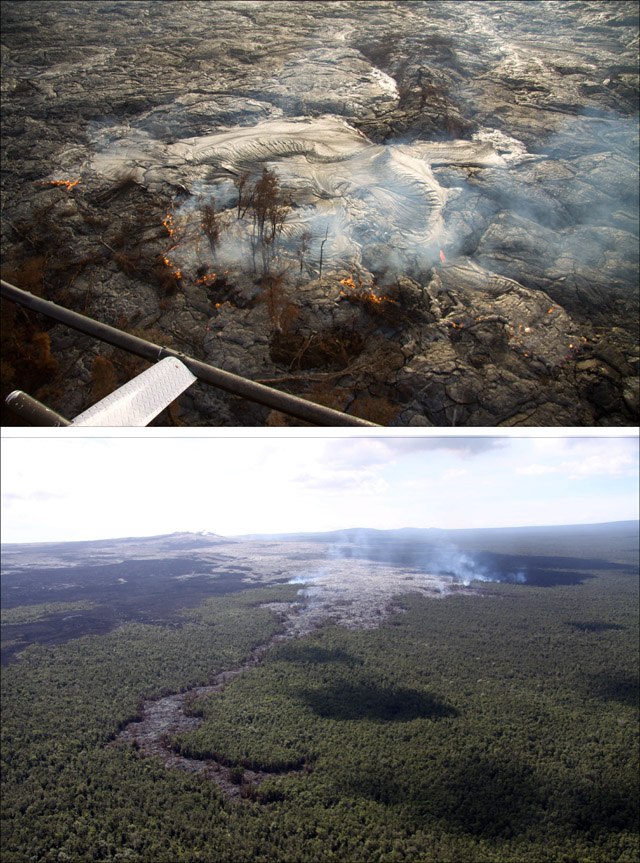 |
Figure 223. (top) A photo taken looking W from a helicopter on 19 September 2013 of the burning forest due to Kīlauea's Kahauale`a 2 flow (approximately 7 km long). This lava flow extended from Kīlauea's Pu'u 'O'o NE vent. Active breakouts on the Kahauale`a 2 were scattered over a broad area. Here, a breakout near the edge of the forest engulfed trees and burned dead foliage. Courtesy of HVO. (bottom) The flow front of the Kahauale`a 2 flow cut a narrow swath through forest NE of Pu`u `O`o. The narrow lobe at the front was inactive at the time of this photo on 27 November 2013, with the main area of surface flows about 2 km behind the end of this lobe. Some of these surface flows slowly expanded N into the forest, igniting fires. Pu`u `O`o is in the upper left, ~7 km SW. Courtesy of HVO. |
By mid-October, Kahauale'a 2's narrow flow front had reached the distant forest boundary and surpassed the length of the original Kahauale'a flow. A narrow finger of lava forming the flow front advanced into the forest in mid-November, reaching just over 7 km distance from Pu'u 'O'o, before stalling soon after 20 November. Behind the flow front, branching flows began to migrate along a more northerly direction into the forest, triggering more fires. This area of breakouts soon turned NE, paralleling the narrow finger that had stalled in late November. By 26 December, the active flow front was 6.3 km NE of the vent and persisted into the New Year.
Petrology of the summit (Halema`uma`u) and rift (Pu`u `O`o) lavas. From 2013 to 2014, the juvenile component of Kīlauea's summit tephra remained essentially as it had during 2008-2013. The overall temporal variation of summit lava mimicked the MgO systematics of ERZ lava for the 2008-2014 interval, with summit glass compositions overlapping those of contemporaneous bulk ERZ lava but erupting 20° to 25°C hotter than at Pu'u 'O'o. There were no changes in trace-element signatures, which matched those of the East Rift Zone (ERZ) lava. Halema'uma'u vent tephra remained sparsely olivine and spinel phyric with ~2 volume percent of 100-300 μm, subhedral to euhedral olivine phenocrysts (typically with melt inclusions). Olivine in summit glasses was consistently complemented by >0.05 volume percent of chromian-spinel microphenocrysts.
2013 Pu'u 'O'o lava also did not show any significant petrologic changes. It contained a five-phase assemblage: olivine(-spinel)-augite-plagioclase-liquid. The assemblage was interpreted as the result of simultaneous growth and dissolution of phenocrysts, reflecting the modeled values for cooling, fractionation, and mixing in the shallow edifice prior to eruption. This multi-phyric condition (see figure 224 for photomicrograph examples from previous years), which had persisted in the steady-state ERZ lava for most of the last ~15 years, attested to a stable shallow magmatic condition perpetuated by near-continuous recharge and eruption.
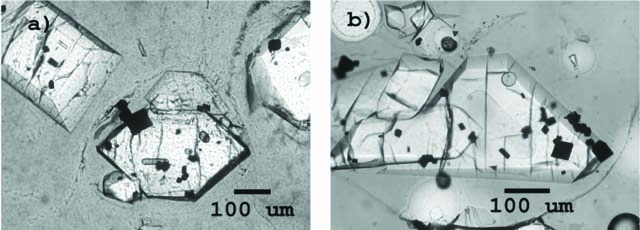 |
Figure 224. Two photomicrographs of Pu'u 'O'o thin sections sampled by HVO scientists from vent (a) and lava tube activity (b) during 1996-1998 (100 μm = 0.1 mm). Both show glass containing olivine phenocrysts with melt inclusions and opaque microphenocrysts of spinel. Image B shows an olivine phenocryst and spinel microphenocrysts in glass with round vesicles (one is located behind "b"). Modified from Roeder and others (2003). |
SO2 emission rates. During 2013, HVO reported notable advances in measuring the dense, opaque summit SO2 plume. It was significant to note that the summit SO2 emission rates measured since 2008 represented a minimum constraint on emissions, whereas by the end of 2013 it was possible to determine a more accurate estimate of the amount of gas emitted from the Overlook crater. Because traditional gas measuring techniques are subject to multiple scattering effects from incoming radiation that can contribute to significant errors in the calculated SO2 emission rates, HVO scientists were pursued various approaches to achieve a more accurate emission rate.
HVO scientists addressed the issue of underestimation due to scattered light in two ways: (1) minimize and/or model the effects of scattering on the retrieved results and (2) measure farther away from the emission source where the plume is more dispersed and not as optically thick.
Using HVO's old metric for evaluating SO2 summit emissions, the total SO2 released in 2013 was first calculated as 266,000 metric tons. They had long recognized these value as among those that had persistently understated the true mass of SO2. To account for the summit emission rate underestimation, they used an initial preliminary correction. It was based on early Simulated Radiative Transfer- Differential Optical Absorption Spectroscopy (SRT-DOAS) values. This refinement increased the summit's traditional estimate 3-fold, yielding a summit total SO2 amount of ~800,000 metric tons for the year 2013.
HVO further reported a preliminary calculation of Kīlauea's 2013 summit emissions using their available Flyspec array data yielded ~1.0 x 10⁶ metric tons for 2013. This was judged more accurate value for the total summit SO2 release.
East rift zone (ERZ) emissions for 2013 continued at the low level recorded since mid-2012. Early in the year, SO2 emissions increased coincident with the occurrence of the Kahauale'a lava flow, but emissions stabilized several months later and continued at a low level for the balance of the year. Rift emissions were consistently less than those at the summit for 2013 totaled ~113,000 metric tons (using the refined methods mentioned above). This was ~20% less than reported in 2012, and the lowest amount recorded since the ERZ eruption began in 1983. The low SO2 emissions from the ERZ were at least partially due to degassing at the summit.
Summit CO2 emission rates. During 2013, CO2 emission rates remained at the relatively low level measured since approximately 2009 (figure 225). The continued absence of a strong CO2 signature in 2013 confirmed that the current summit activity reflects shallow reservoir processes rather than deeper ones. All CO2 measurements in 2013 were made with the Licor LI-6252 gas analyzer.
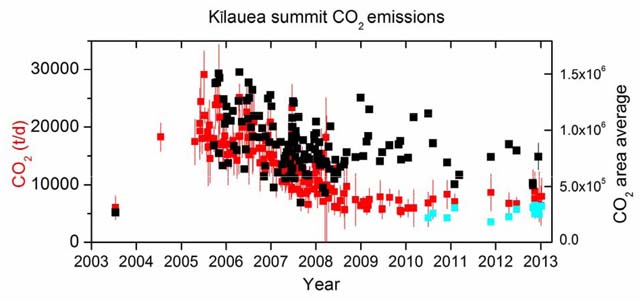 |
Figure 225. Daily average CO2 emissions from the summit of Kīlauea, as measured under trade-wind conditions, during 2003-2013. The vertical bars represent standard deviations of all traverses on a single day. The cyan symbols show CO2, calculated using filtered data to more confidently bracket CO2 emission rates. The black squares are raw CO2 area-count averages; these values provide a measure of CO2 independently of the C/S ratio and SO2 emission rates by accounting for the area traversed through the plume and integrating that area by gas concentration magnitudes (this method also takes into account the plume direction and speed). CO2 values were calculated without any correction to underestimated SO2 emission rates. Courtesy of HVO. |
Quantifying summit and rift plume characteristics. In addition to emission-rate studies, HVO continued to monitor the summit and rift plumes using a variety of techniques, including multi-species sensor-based time-series measurements and open-path FTIR. In 2013, FTIR measurements of the summit plume reconfirmed the shallow nature of the degassing source, with plume chemistry characterized by low CO2, high SO2, high H2O, and significant HCl and HF (table 10). Measurements of the summit and rift plumes yielded similar chemistry, suggesting a common source for these gases. Also reconfirmed in 2013 were the previously observed short-term changes in gas chemistry correlating with behavior in Overlook crater.
Table 10. The composition of Kīlauea's summit plume for 2013 reported in moles and mole%. Courtesy of HVO.
| Gas species | moles | mole% |
| H2O | 1,117.98 | 88.23 |
| SO2 | 81.46 | 6.43 |
| CO2 | 64.69 | 5.11 |
| HCl | 1 | 0.08 |
| HF | 1.17 | 0.09 |
| CO | 0.84 | 0.07 |
| total moles | 1,267.14 | 100 |
Gas hazards. In 2013, the maximum ambient concentration of SO2 measured near the summit along Crater Rim Drive during traverses made with a car was 150 ppm, a value well above the IDLH (Immediately Dangerous to Life and Health) threshold. Concentrations measured inside the vehicle reached a maximum of 12 ppm. The inside-car levels were measured with all air-handling turned off, the operating conditions that minimize SO2 penetration into the vehicle. Fumarole sampling at the two locations on the rim of Halema'uma'u were subsequently paused during 2013 while shifting to alternative, less-hazardous measurement techniques.
HVO continued to operate the low-resolution SO2 sensor and rain collector network on Kapapala Ranch in 2013 (within 23 km SW of the summit). In general, maximum SO2 concentrations on the Ranch in 2013 were lower than in 2012. During the early years of the activity at the Overlook vent, the Ranch's livestock exhibited runny eyes, respiratory issues, weight loss, and tooth mottling and degradation (possibly indicating fluorosis). Additionally, fences and other metal infrastructure on the ranch had been deteriorating more rapidly than before the summit eruption began. New data showed SO2 one-minute values for 2013 (a single, one-second measurement per minute) up to 4 ppm. Hazard monitoring and communication with the ranch operators, veterinarians, and public health officials remained ongoing.
Ambient SO2 concentrations measured downwind of Halema'uma'u continued to reach very high levels (~150 ppm) along Crater Rim Drive near the Halema'uma'u parking lot, warranting continued caution along Crater Rim Drive in 2013. HVO scientists maintained communications with community groups and county, state, and federal agencies in order to relay the changing gas-hazard conditions associated with Kīlauea's ongoing eruptions.
In 2013, the National Park Service's (NPS) ambient air quality stations located at HVO and behind the Kīlauea Visitor Center continued to record periods of hazardous air quality resulting from the ongoing eruptions. The National Park continued to close the highly impacted areas of the park during poor air-quality episodes. Closing of park locations, including Kīlauea Visitor Center and Jaggar Museum, were based on the following criteria: a Visitor Center is closed when SO2 concentrations exceed 1 ppm for 6 consecutive 15-minute periods (1.5 hrs), 3 ppm for 3 consecutive 15-minute averages (45 minutes), or 5 ppm for one 15-minute average. NPS high-resolution SO2 analyzers located at the visitor centers operated in the extended 0-10 ppm range.
Flank deformation. The variable-rate inflation of Kīlauea that has been ongoing since 2010 continued through 2013. There were periods of slight deflation in March-May, late May, July-August, and September and November. The saw-tooth pattern created by the alternating inflation and deflation is most obvious in the distance change across the Halema'uma'u crater, but can also be seen in the tilt record at summit tiltmeters, such as at station UWE and subtly in the vertical changes at summit GPS sites (figure 226).
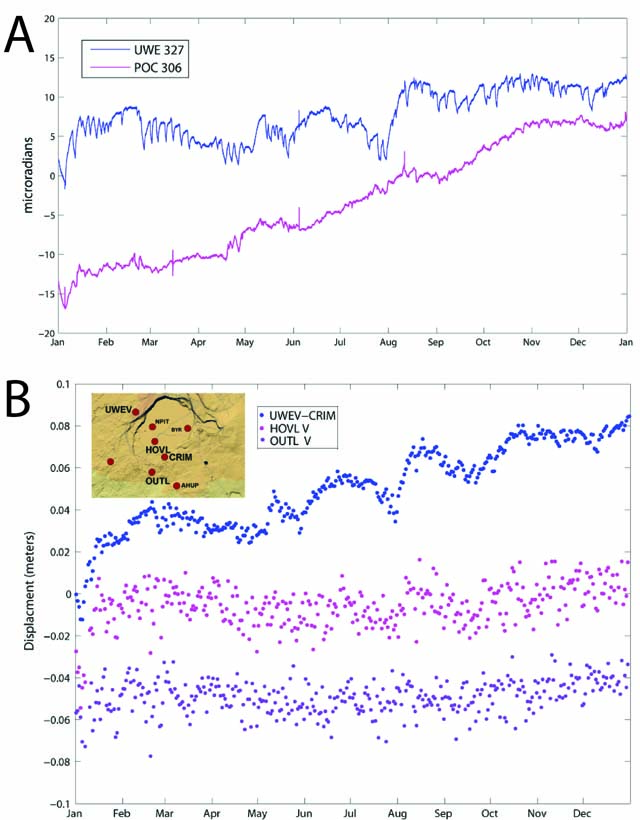 |
Figure 226. (A) Radial tilt measured by borehole instruments at the summit (UWE) and at Pu'u 'O'o (POC) in 2013. Positive change indicating tilt away from the most common magmatic sources, usually indicating inflation, and negative change indicating tilt towards those sources, usually indicating deflation. (B) Changes in distance across Halema'uma'u (UWEV-CRIM) and elevation of GPS stations (HOVL V and OUTL V) from July 2012 through July 2013. Courtesy of HVO. |
During 2013, there was a total of almost 10 cm of extension on the approximately 3.5-km baseline between UWEV and CRIM (figure 226 B) and about 10 microradians of inflationary tilt at UWE (figure 226 A). There was very little accumulated vertical change at the summit GPS sites over the year, however. This was also reflected in the lack of appreciable line-of-sight displacement in the interferograms from INSAR spanning 2013. There were 65 deflation-inflation (DI) events in 2013, similar to the rate of occurrence observed since the opening of the summit vent in 2008. Most of these were only weakly detected by the POC tiltmeter at Pu'u 'O'o.
At Pu'u 'O'o, the GPS site on the N rim (PUOC), recorded a fairly steady, slow rate of N-NW motion in 2013, with a slight acceleration in late April-early May. The direction of motion is usually indicative of inflation, but there was no appreciable uplift at the site. There was a net tilt of about 20 microradians to the NW at POC on the N flank, also usually indicative of inflation.
The pattern and velocity of GPS sites on the S flank of Kīlauea in 2013 were similar to the patterns and rates that have been observed in the recent past during times free of slow-slip events and ERZ intrusions.
Deformation monitoring equipment. Two continuous GPS sites (LEIA and SPIL) were lost to lava flows from Pu'u 'O'o in early 2013. After a data outage at the Malama Ki (MKI) tilt site on the lower ERZ in April, HVO discovered that thieves had dismantled the gate to the security enclosure and stolen everything except the actual tiltmeter. This had been part of a string of thefts at this site, forcing HVO to eventually abandon it. This was an unfortunate loss to the monitoring network, especially because the only other tiltmeter station on the lower ERZ, near Heiheiahulu (HEI) had also been stolen late during the previous year. In July, HVO installed a new tiltmeter in a less accessible location a few kilometers NW of Heiheiahulu.
Seismicity. In 2013, HVO's seismic network consisted of 57 real-time continuous stations (25 broadband, 21 strong-motion, 7 three-component short-period, and 25 vertical-component short-period instruments) (figure 227). The network coverage was most dense on and around Kīlauea. In 2013, HVO upgraded of the seismic network which involved installing the digital stations NAHU (to replace the analog station ESR) and TOUO (to replace analog station KII). They also established three arrays of infrasound sensors in order to better track acoustical waves in the air (infrasound) associated with volcanic processes.
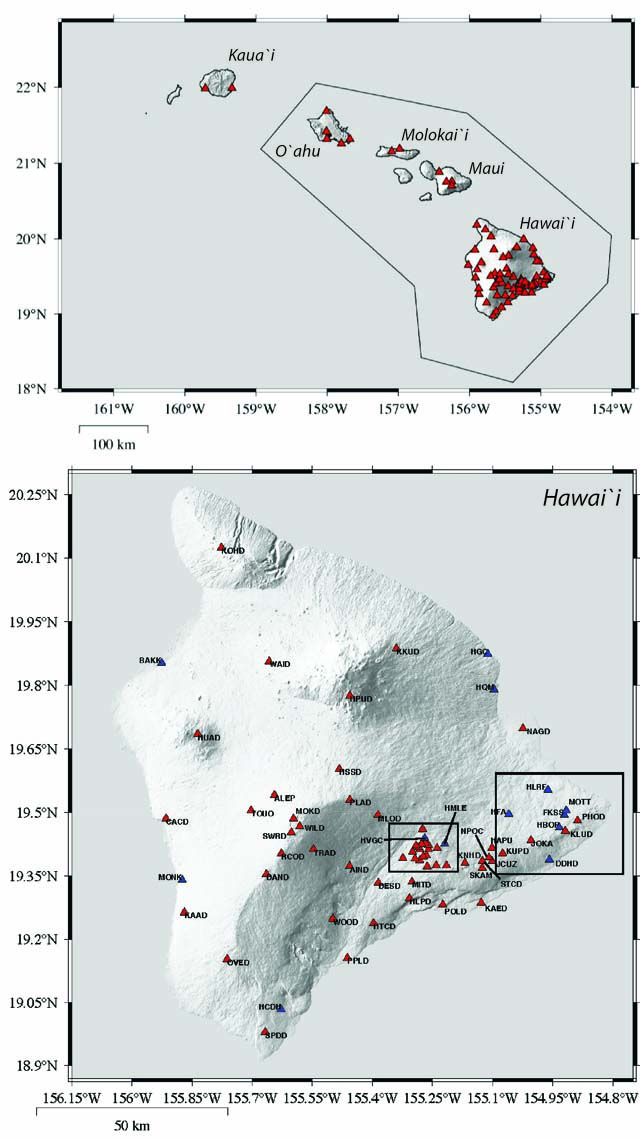 |
Figure 227. (top) Authoritative region of HVO (black line). Red triangles represent permanent, continuous seismic stations and Netquakes instruments, a new type of digital seismograph that transmits data to USGS via the internet after an earthquake. Stations from the National Strong-Motion Program (NSMP) are excluded here because their high triggering threshold means that they produce data for only a handful of earthquakes a year. (bottom) Map showing both HVO stations (red triangles) and Netquakes (blue triangles). Two boxes indicate regions of special interest for seismic monitoring. Netquakes instruments enable the USGS to achieve a "denser and more uniform spacing of seismographs in select urban areas. … The instruments are designed to be installed in private homes, businesses, public buildings and schools" (USGS, 2013a). Courtesy of HVO. |
Seismic activity at Kīlauea was generally low in 2013 compared to that of other time periods since the 2008 start of the summit eruption (figure 228). Tremor was a ubiquitous feature of the seismicity near the summit, with discrete very-long-period (VLP) and long-period (LP) events occurring sporadically. Tremor amplitudes appeared to modulate in conjunction with the presence or absence of spattering in the lava lake within Halema'uma'u. In general, increased seismicity in the S caldera and upper ERZ were coincident with rapid increased lava lake level and tilt. None of these swarms were remarkable in number or size compared to previous swarms, especially those in 2011 and 2012.
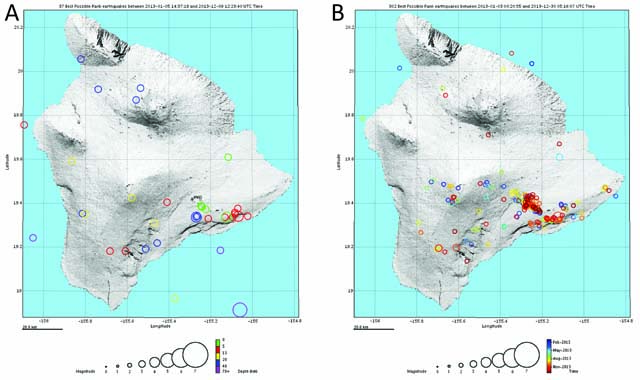 |
Figure 228. (A) January-December 2013 earthquake locations, Hawai'i Island, 0-60 km deep, M ≥ 3.0. Earthquake colors are based on depth. The symbol size of the earthquake is based on the preferred magnitude. All plotted earthquakes have been reviewed by an analyst. (B) January-December 2013 earthquake locations, Hawai'i Island, 0-5.0 km deep (shallow), M ≥ 2.0. Earthquake colors are based on time. Symbol sizes are based on the magnitude. Plotted events include both reviewed and automatically determined locations that have horizontal errors < 2 km and vertical errors < 4 km. Courtesy of HVO. |
New interactive earthquake webpage launched. In October 2013, HVO launched a new interactive earthquake webpage, informally called Volcweb (USGS, 2013b). The new website used several new technologies that provided a better user-experience and a better compatibility with mobile devices. In addition to providing earthquake location information, the site also creates cross-sections, time-depth plots, cumulative number of earthquake plots, and cumulative magnitude plots for data up to a year old. Webicorders for all stations were available (updated every 10 minutes). The rollout of this website allowed HVO to retire the old "Recent Earthquakes" page.
References. Patrick, M., Orr, T., Sutton, A.J., Elias, T., and Swanson, D., 2013, The first five years of Kīlauea's summit eruption in Halema'uma'u crater, 2008-2013. Hawai`i National Park, HI: U.S. Geological Survey, Hawaiian Volcano Observatory, Fact Sheet 2013-3116.
Patrick, M.R., Orr, T., Antolik, L., Lee, L., and Kamibayashi, K., 2014, Continuous monitoring of Hawaiian volcanoes with thermal cameras, Journal of Applied Volcanology, 3:1.
Roeder, P.L., Thornber, C., Poustovetov, A., and Grant, A., 2003, Morphology and composition of spinel in Pu'u 'O'o lava (1996-1998), Kīlauea volcano, Hawaii. Journal of Volcanology and Geothermal Research, 123, 245-265.
USGS, 2013a (January). Earthquake Hazards Program, Netquakes: Map of Instruments. Retrieved from http://earthquake.usgs.gov/monitoring/netquakes/map/.
USGS, 2013b (December). Hawaiian Volcano Observatory, Recent Earthquakes in Hawaii. Retrieved from http://hvo.wr.usgs.gov/earthquakes/new.
Geological Summary. Kilauea overlaps the E flank of the massive Mauna Loa shield volcano in the island of Hawaii. Eruptions are prominent in Polynesian legends; written documentation since 1820 records frequent summit and flank lava flow eruptions interspersed with periods of long-term lava lake activity at Halemaumau crater in the summit caldera until 1924. The 3 x 5 km caldera was formed in several stages about 1,500 years ago and during the 18th century; eruptions have also originated from the lengthy East and Southwest rift zones, which extend to the ocean in both directions. About 90% of the surface of the basaltic shield volcano is formed of lava flows less than about 1,100 years old; 70% of the surface is younger than 600 years. The long-term eruption from the East rift zone between 1983 and 2018 produced lava flows covering more than 100 km2, destroyed hundreds of houses, and added new coastline.
Information Contacts: Hawaiian Volcano Observatory (HVO), U.S. Geological Survey, PO Box 51, Hawai`i National Park, HI 96718, USA (URL: https://volcanoes.usgs.gov/observatories/hvo/); Hawai`i Institute of Geophysics and Planetology (HIGP) Thermal Alerts System, School of Ocean and Earth Science and Technology (SOEST), Univ. of Hawai`i, 2525 Correa Road, Honolulu, HI 96822, USA (URL: http://modis.higp.hawaii.edu/); Hawaii 24/7 (URL: http://www.hawaii247.com); Great ShakeOut (URL: http://shakeout.org/hawaii/); and West Hawaii Today (URL: http://www.westhawaiitoday.com/).