Report on Kikai (Japan) — July 2014
Bulletin of the Global Volcanism Network, vol. 39, no. 7 (July 2014)
Managing Editor: Richard Wunderman.
Edited by Julie A. Herrick.
Kikai (Japan) Small ash eruption on 4 June 2013
Please cite this report as:
Global Volcanism Program, 2014. Report on Kikai (Japan) (Herrick, J.A., and Wunderman, R., eds.). Bulletin of the Global Volcanism Network, 39:7. Smithsonian Institution. https://doi.org/10.5479/si.GVP.BGVN201407-282060
Kikai
Japan
30.793°N, 130.305°E; summit elev. 704 m
All times are local (unless otherwise noted)
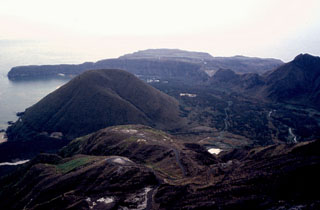
Kikai is a caldera, mostly submerged, which includes several islands (figure 3). Previous reports documented modest seismic activity during October 2010-December 2012, with occasional tremor (through June 2012), minor earthquakes, and diffuse white plumes (BGVN 37:07 and 38:01). Subsequent activity during January 2013-July 2014 included one eruption with intermittent explosions, occasional ash and steam plumes, and sporadic weak seismic tremor.
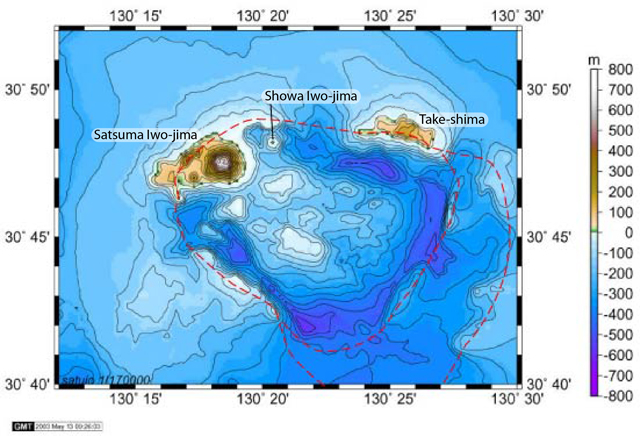 |
Figure 3. The subaerial expression of Kikai includes two major islands: Satsuma Iwo-jima (~5.5 km long) and Take-shima (~4.5 km long). Three additional islands are included in the structure: Unose, Asase, and Showa Iwo-jima, of which only Showa Iwo-jima was large enough to include on this topographic map. The red dotted lines correspond to the mostly-submerged Kikai caldera structure. Elevations and bathymetry are indicated by color coding based on the key in meters. Courtesy of the Geological Survey of Japan. |
Ash plume on 4 June 2013. During 2013, seismicity from Satsuma Iwo-jima was at background levels and plume activity (vapor plumes that rose 300-900 m above the summit) was limited for most of the year (figure 4). Seismic unrest occurred during 15-26 May but dropped back to normal levels thereafter.
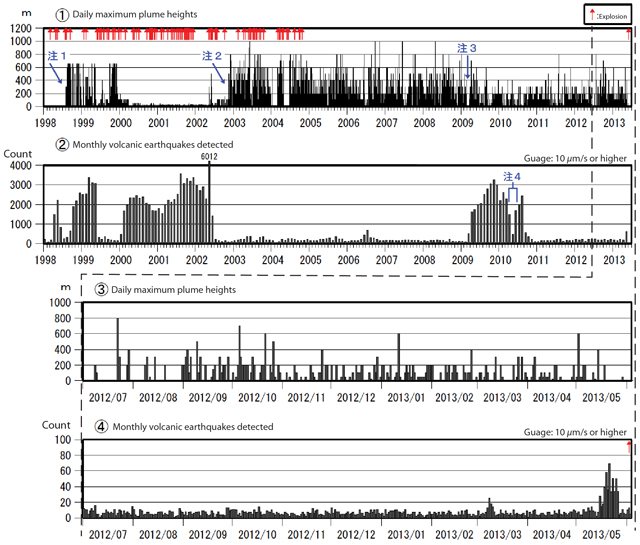 |
Figure 4. Plots showing multi-year records of measured plume heights (1 and 3) and volcanic earthquakes (2 and 4) during 1 January 1998-3 June 2013 from Satsuma Iwo-jima. Explosive events frequently occurred during 1998-2004 (red arrows) and following a ~8 year hiatus, activity resumed on 3 June 2013. Plume heights are measured in meters above the crater. Note that 1) personnel began observational monitoring on 1 August 1998; 2) video monitoring was installed on 16 November 2002; 3) there were video camera problem during 23 February-21 March 2009; 4) seismic data is incomplete due to problems with monitoring equipment. This record is from a seismic station located less than 1 km from the summit. Courtesy of Japan Meteorological Agency (JMA). |
According to the Japan Meteorological Agency (JMA), weak tremor was detected at 0502 on 4 June. At ~0517, an eruption began, with explosions occurring intermittently until 1500. An ash plume drifted W from Satsuma Iwo-jima's summit (figure 5), Iodake (also "Iwo-dake"). As a result, JMA raised the Alert Level from 1 to 2 on a scale of 5. The Tokyo Volcanic Ash Advisory Center (VAAC) issued two advisories on 4 June, although no ash was visible in satellite images. Despite this activity, there were few signs of unrest from the seismic, GPS, and thermal monitoring networks during 3-5 June. JMA released a warning about potentially hazardous conditions within 1 km of the summit and noted that the leeward side of the island could experience ashfall and gas emissions.
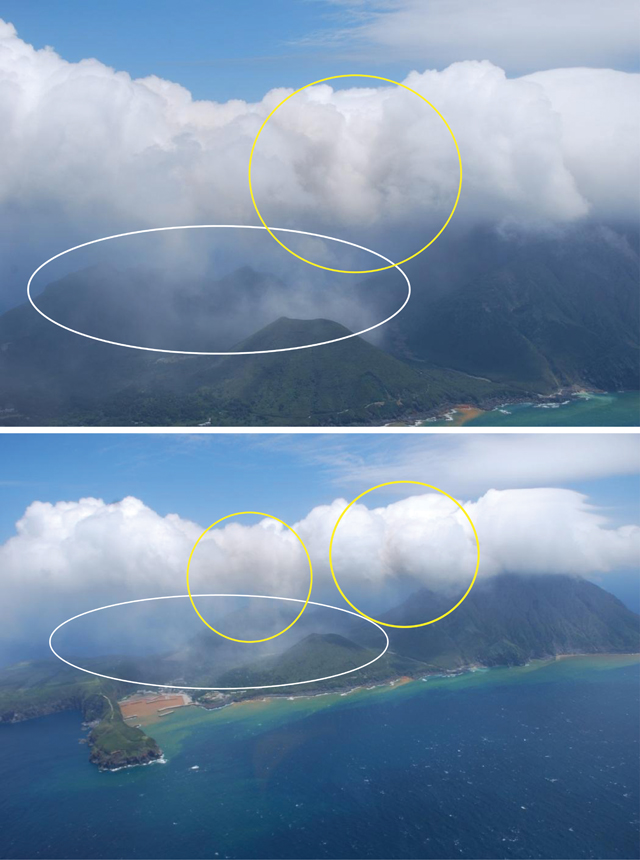 |
Figure 5. Areas at Satsuma Iwo-jima on 4 June 2013 with observed an ash plume (yellow circles) and potential ashfall (white circles). Low-level clouds obscured much of the view, but brown-colored areas in the white clouds were identified as ash. The town of Mishima is located at the cluster of white buildings in the harbor (Nagahama Bay) formed by the Erabuzaki peninsula. Within the harbor and other protected inlets along shore, the water color is orange-brown; this is a persistent feature of the island that results from hydrothermal vents contributing Fe-oxyhydroxides and causing turbidity (Kiyokawa and others, 2012). The look direction in both images is approximately NNW. Courtesy of JMA. |
Ashfall from the 4 June 2013 eruption was reported on the flanks of Iodake during field surveys. Deposits were also noted in the village of Mishima, ~3 km WSW of the summit. After 6 June, white plumes rose from the summit as high as 400 m. Sulfur dioxide emissions measured before and after the eruption did not indicate any anomalies; the average flux was 300 tons per day based on measurements from 29 May and 400 tons per day on 9 July 2013.
Aerial surveys and thermal monitoring. Hot springs and other thermal feature have been well-documented and monitored across Satsuma Iwo-jima (figure 6). JMA reported that an aerial survey on 13 June 2013 provided a view of the E flank where a persistently active fumarole appeared to have expanded in size (figure 7). Aerial surveys conducted on 9 July and 25 December 2013 found no major thermal changes on the surface of Iodake; however, elevated temperatures persisted at fumarolic sites (figure 8).
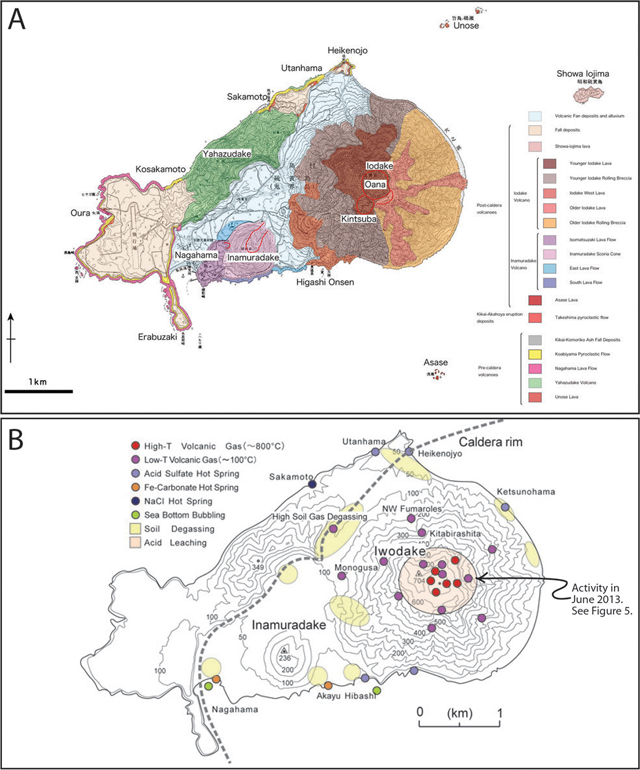 |
Figure 6. (A) Geologic map of Satsuma Iwo-jima annotated with place names and showing the small islands of Unose (NE), Showa Iwo-jima (NE), and Asase (SE). Lithologies range from rhyolite to basalt; Iodake (also written Iwodake) is dominantly rhyolitic (the Nagahama lava flow is dacitic), Yahazudake is andesitic-to-basaltic, Showa Iwo-jima has a rhyolitic central zone and dacitic breccia zone, and Inamura-dake is basaltic (Maeno and Taniguchi, 2006; Ono and others, 1982). (B) Distribution of fumaroles, hot springs, and diffuse soil gas emissions on Satsuma Iwo-jima and offshore sites. The highest temperatures (~800°C) were mainly restricted to the summit of Iodake, within Oana crater. The black arrow indicates the area where a low-temperature (~100°C) fumarole has been active on the E flank, the location of morphological changes in June 2013. Courtesy of the Geological Survey of Japan. |
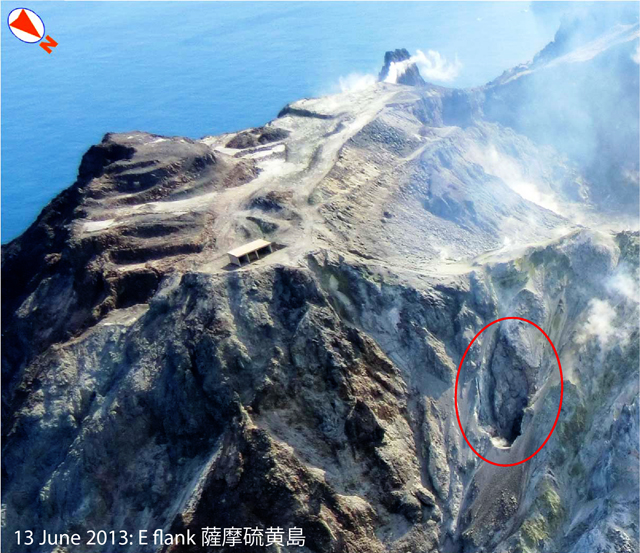 |
Figure 7. Aerial survey recording conditions on Satsuma Iwo-jima on 13 June 2013. The scar associated with an active fumarole on the E flank (red circle) was notably larger compared to previous images from December 2012. Courtesy of JMA. |
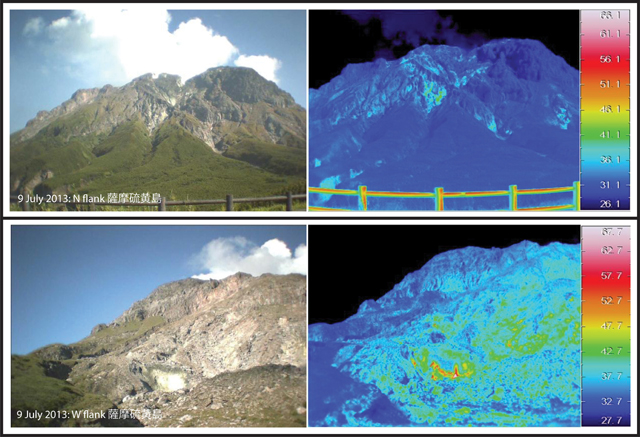 |
Figure 8. Thermal images (at right) paired with visible light photos of Satsuma Iwo-jima from less than 2 km away taken on 9 July 2013. Visible and thermal images of the N (top) and W flank (bottom). JMA noted that elevated temperatures from the ground surface occurred in areas known for fumarolic activity. These conditions did not change significantly in the months before or after the 4 June 2013 eruption. Courtesy of JMA. |
Observations during 2014. JMA reported few changes during January-July 2014 (table 5). White plumes were frequently observed and typically rose 300-800 m above the summit (figure 9). Earthquakes occurred at background levels. Four episodes of tremor occurred in February with a total duration of two minutes. Several field surveys determined that no significant changes were occurring with respect to SO2 flux and thermal emissions. Since December 2013, incandescence from the summit was observed only in January and June 2014.
Table 5.Monthly observations and monitoring data for Satsuma Iwo-jima during December 2013-July 2014. Plume heights were documented and presumably reflect characteristic heights seen above the vent; white plumes were frequently visible. Courtesy of JMA.
| Month | Plume Height | Earthquakes | Notes |
| Dec 2013 | 400 m | 122 | Incandescence. |
| Jan 2014 | 500 m | 153 | Incandescence; sulfurous plume visible. |
| Feb 2014 | 400 m | 180 | Four episodes of tremor (2 minutes). |
| Mar 2014 | 400 m | 173 | SO2 flux 700 tons/day. |
| Apr 2014 | 500 m | 145 | -- |
| May 2014 | 500 m | 163 | -- |
| Jun 2014 | 300 m | 172 | Incandescence; thermal surveys showed no changes to surface temperatures. |
| Jul 2014 | 800 m | 186 | -- |
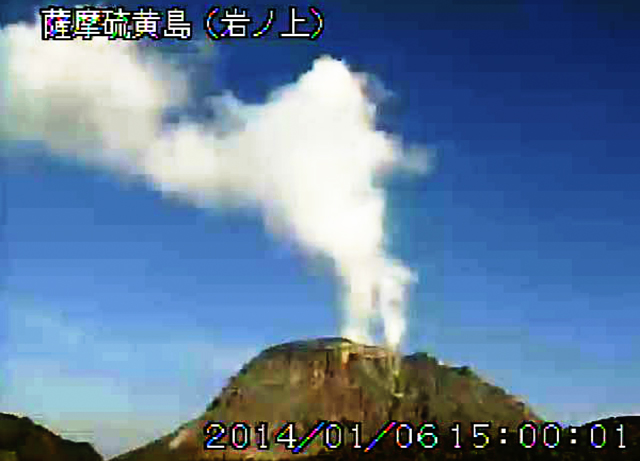 |
Figure 9. Video camera image of Satsuma Iwo-jima at 1500 on 6 January 2014. Steam plumes such as this were frequently observed during January-July 2014 rising 300-800 m above the crater. The camera location was ~3 km W of the summit near the town of Mishima. Courtesy of JMA. |
References. Kiyokawa, S., Ninomiya, T., Nagata, T., Oguri, K., Ito, T., Ikehara, M., and Yamaguchi, K.E., 2012, Effects of tides and weather on sedimentation of iron-oxyhydroxides in a shallow-marine hydrothermal environment at Nagahama Bay, Satsuma Iwo-Jima Island, Kagoshima, southwest Japan, Island Arc, 21, 66-78.
Maeno, F. and Taniguchi, H., 2006, Silicic lava dome growth in the 1934–1935 Showa Iwo-jima eruption, Kikai caldera, south of Kyushu, Japan, Bulletin of Volcanology, 68, 673-688.
Ono, K., Soya, T., and Hosono, T., 1982, Geology of the Satsuma-Io-Jima District. Quadrangle Series, Scale 1:50,000, Geological Survey Japan, 80 p.
Geological Summary. Multiple eruption centers have exhibited recent activity at Kikai, a mostly submerged, 19-km-wide caldera near the northern end of the Ryukyu Islands south of Kyushu. It was the source of one of the world's largest Holocene eruptions about 6,300 years ago when rhyolitic pyroclastic flows traveled across the sea for a total distance of 100 km to southern Kyushu, and ashfall reached the northern Japanese island of Hokkaido. The eruption devastated southern and central Kyushu, which remained uninhabited for several centuries. Post-caldera eruptions formed Iodake (or Iwo-dake) lava dome and Inamuradake scoria cone, as well as submarine lava domes. Recorded eruptions have occurred at or near Satsuma-Iojima (also known as Tokara-Iojima), a small 3 x 6 km island forming part of the NW caldera rim. Showa-Iojima lava dome (also known as Iojima-Shinto), a small island 2 km E of Satsuma-Iojima, was formed during submarine eruptions in 1934 and 1935. Mild-to-moderate explosive eruptions have occurred during the past few decades from Iodake, a rhyolitic lava dome at the eastern end of Satsuma-Iojima.
Information Contacts: Japan Meteorological Agency (JMA), Otemachi, 1-3-4, Chiyoda-ku Tokyo 100-8122, Japan (URL: http://www.jma.go.jp/); Geological Survey of Japan and National Institute of Advanced Industrial Science and Technology (GSJ, AIST) (URL: https://www.gsj.jp/en/index.html, http://www.aist.go.jp/index_en.html); Tokyo Volcanic Ash Advisory Center (VAAC), Tokyo, Japan (URL: http://ds.data.jma.go.jp/svd/vaac/data/).