Report on Kilauea (United States) — September 2014
Bulletin of the Global Volcanism Network, vol. 39, no. 9 (September 2014)
Managing Editor: Richard Wunderman.
Kilauea (United States) 1 January-26 June 2014: Waning stages of the Kahauale'a 2 lava flow
Please cite this report as:
Global Volcanism Program, 2014. Report on Kilauea (United States) (Wunderman, R., ed.). Bulletin of the Global Volcanism Network, 39:9. Smithsonian Institution. https://doi.org/10.5479/si.GVP.BGVN201409-332010
Kilauea
United States
19.421°N, 155.287°W; summit elev. 1222 m
All times are local (unless otherwise noted)
This report, taken largely from Hawaiian Volcano Observatory (HVO) reporting in their Daily Updates, weekly (Volcano Watch) articles, and online photo galleries, covers 1 January to 26 June 2014. Links to the HVO website appear in the Information Contacts section. The daily and weekly publications both feature online retrieval of older publications. This several page report condenses at least 400-1,000 pages of HVO reporting dedicated to this ~6 month reporting interval. Three observations stood out within this period.
1. Lava emissions persisted. On 3 January 2014 the current eruption surpassed 31 years in length; it had emitted just over 4 km3 of lava, had covered 128 km2 of land, and had destroyed 214 structures.
2. The lava flow of note during this interval was the Kahauale'a 2 flow, which had started in May 2013 (BGVN 39:05). That flow had, during April-June 2014, advanced erratically and HVO Daily Updates declared it inactive ("cutoff and dead") at or near the end of June. (A day after this reporting interval ended, a new flow later emerged adjacent to the Kahauale'a 2 flow. The new flow that emerged on 27 June 2014 became informally named by that date. That flow will be discussed in our next Bulletin report.)
3. The Kahauale'a 2 flow did not advance in the usual southerly direction nor did lava emerge from tubes at the sea, thus there was an absence of lava entering the ocean. Instead the flows during this reporting interval advanced to NE.
Many of the typical observations associated with the three-decade-long eruption persisted. Those typical events included the following:
• Advancing lavas developed new areas of flowing molten material ('breakouts'), which sometimes occurred at the margins of flows and advanced to enter vegetated areas where they started fires.
• The circulating lava lake that has resided at the summit area in Overlook crater since 2008 rose and fell during this reporting interval with several cases of the lake's surface reaching above the inner ledge at ~31-m depth below the Halema'uma'u crater floor. High stand for the lava occurred on 29 April 2014 at 30 m depth; the low stand, on 21 and 22 January 2014 at 69-70 m depth.
• Overlook crater also emitted products such as ash, spatter, and Pele's hair (glass strands or fibers).
• Emissions of gas and particulate at Overlook crater and at Pu'u 'O'o vent remained sufficiently elevated to pose downwind health considerations on many days. At closer range, in areas within 1 km downwind of vent areas, there could be potentially lethal concentrations of sulfur dioxide (SO2) gas.
• Observers noted glow in a variety of settings, including at cones, vents, flows, breakouts, and from lava thrown into the air. For one illustrative example of many sources of glow on the crater floor at Pu'u 'O'o, on 21 May 2014 glow was observed from the N, S, SE, and NE spatter cones there.
• Deformation-inflation events (sudden reversals in tilt lasting on the order of days) have dominated the tilt measurements since 2008. This pattern continued at both Halema'uma'u and Pu'u 'O'o.
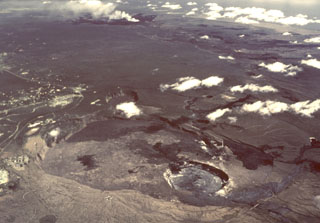
Background. A colored sketch map emphasizing Kīlauea's main features appears on figure 161 in BGVN (29:02). The vents in this reporting interval were Halema'uma'u and Pu'u 'O'o, with the former containing a lava lake and the latter the only significant source of lava flows. As noted by HVO, the (first) Kahauale'a flow started from the NE spatter cone and lava pond at the NE edge of the Pu'u 'O'o crater floor in mid-January 2013; it ceased advancing and become inactive by middle to late April 2013, having advanced 4.9 km NE. A new flow (informally called Kahauale'a 2) began venting at Pu'u 'O'o in early May 2013 (BGVN 39:05).
Although NE-advancing lavas have been uncommon during the current 31-year-long eruption, a Volcano Watch report issued on 24 April 2014 noted that lava also flowed NE from Pu'u 'O'o episodically in 1983–1986 and for four months in 2007.
Overlook crater lies within Halema`uma`u crater, itself within the larger (roughly 4- by 2-km diameter) Kīlauea caldera (often also termed the summit caldera). Both of the volcano's rift zones intersect in the summit region (figure 161). The E rift zone extends over 100 km E and the W (or SW) rift zone at least 30 km WSW (figure 161).
The focus of most of the venting of lava at the surface has in recent years been from the E rift zone, most recently Pu'u 'O'o.
In the past, ocean entries (lava flowing into the sea) often resulted from lava that traveled from Pu'u 'O'o. In some cases the lava traveled extensive distances via lava tubes (see "lava tube" on simplified cutaway view at right on figure 161). Lava entering the sea ceased in August to September 2013 (BGVN 39:05) and as previously mentioned, ocean entries were absent during this reporting interval.
1 January to 26 June 2014. Both Halema'uma'u and Pu'u 'O'o were the subject of daily reports discussing the sometimes elevated levels of gases and particulates emerging from those craters and negatively affecting air quality (figure 229, top). Access close to the Halema'uma'u vent is potentially hazardous, resulting in closure of road, trail, and similar public access (figure 229, bottom).
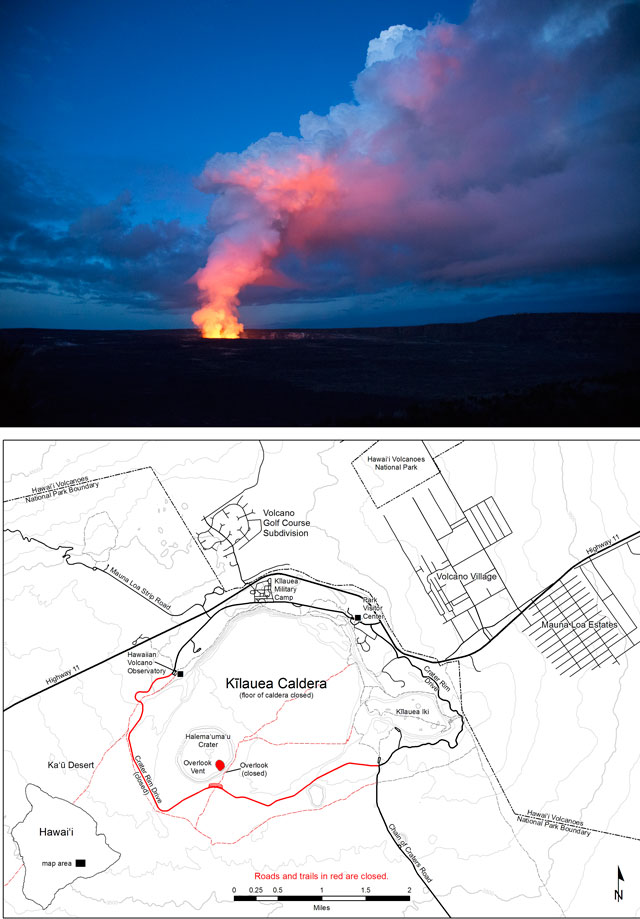 |
Figure 229. (top) Photo taken from the NE rim of Kīlauea caldera showing a billowing gas and condensate plume emerging from Halema'uma'u crater. The photographer captured this scene from the overlook by the Volcano House at 0625 on 30 January 2014. (bottom) Map of the Kīlauea summit caldera area. Note Halema`uma`u and the pit crater within it, Overlook crater. Overlook crater is indicated by the red area representing this crater-confined molten lava lake. The lake has been mostly active since invading the pit crater during a small explosive event in 2008. Overlook crater is cylindrical, vertical walled, and ~160 m in diameter. The lava lake's surface has varied in height, with distances below the rim ranging from 25 m to over 200 m (out of sight) below Halema`uma`u 's floor. Notice road and trail closures owing to high gas emission levels. Credits: (top) National Park Service photo posted online at their website (photographer not acknowledged). (bottom) HVO. |
On their website, the Hawai'i Department of Health furnished general comments on air quality from Kīlauea's eruption. "An 'N95 type' disposable dust/particulate mask plus eye protection (goggles/safety glasses) will provide protection from ash and reduce exposures to particulates, but will not provide protection from SO2 or other gases. Many people may find it difficult to breathe while wearing a dust/particulate mask and should not use one. The safest way to eliminate exposure to significant levels of volcanic particulates, vog, or gases such as SO2 is to leave the area. The [Department of Health] maintains stationary ambient air quality monitors that measure SO2 and fine particulate levels in Hilo, Kona, Mountain View, Ocean View, Pahala, and Puna E (SO2 and [H2S,] hydrogen sulfide) on the Island of Hawai'i." (Hawai'i Department of Health, 2013).
Kroll and others (2015) discuss the atmospheric evolution of volcanic smog ("vog") from Kīlauea's summit area with measurements of oxidation, dilution, and neutralization within the volcanic plume based on sampling nearby and directly downwind 31 km SW of Halema'uma'u crater. Sampling dates did not appear in their abstract. The abstract noted that "The particles within the plume were extremely acidic, with pH values (controlled largely by ambient relative humidity) as low as −0.8 and strong acidity (controlled largely by absolute sulfate levels) up to 2200 nmol/m3."
SO2 flux data were extracted from HVO Daily Updates for the interval 24 December through 24 June 2014. Overall, SO2 fluxes at Halema'uma'u yielded values in the range 1750-7400 metric tons (tonnes) per day (t/d). Overall, fluxes for Pu'u 'O'o and associated E rift zone sources of degassing yielded values in the range 150-450 t/d. This is consistent with HVO statements in May Daily Updates that these fluxes "typically ranged between 150 and 450 t/d since July 2012."
HVO emphasized the following caveat. "Starting in 2014, [HVO began reporting] the emission rate estimated by a new, more accurate method. The numbers increase by a factor of 2-4 but the actual emission rate has not changed." The 19 December 2013 issue of Volcano Watch briefly described the methodology to that point in time (2013) as changing from a vehicle-based upward looking observation platform to a fixed-array technique. Further details await more detailed discussion by the authors for further context on the data collected after the article in order to elucidate the 24 December 2013 to 24 June 2014 dataset.
Volcano Watch regularly contains a subsection on Kīlauea's recent behavior. The Kīlauea section in the 2 January 2014 issue of Volcano Watch made these statements: "Unless there is a significant change at Pu'u 'O'o, the Kahauale?a [2] flow poses no imminent threat to infrastructure, but will likely continue advancing toward the [NE], burning forest as it does. It could eventually reach communities far downslope, but fortunately, the East rift zone eruptive output remains weak. At its current pace, the Kahauale?a [2] flow would take more than a year to reach populated areas."
The Kahauale?a 2 lava flow had reached 8.3 km NE of Pu'u 'O'o on 9 April 2014. Some metrics on the advance appear in a table below. As alluded to above, even early in the year 2014 the pace of advance was considered slow. In discussing the slow pace, the 6 June Daily Update said that the flow front had not advanced more than 1.8 km since the first time it stalled in early November 2013.
HVO's website contained maps depicting flow position and breakouts. HVO noted that most of the active flow field lay within closed-access areas thus restricting the public's direct viewing at close range to aerial approaches. Under clear weather conditions at night, distant glow from the active flows could be seen from favorable vantage points.
Figure 230 shows the Kahauale'a 2 flow's position at three points during 2014: (top) 24 January, (middle) 18 April, and (bottom) 6 June. These cases are each discussed further after the figure.
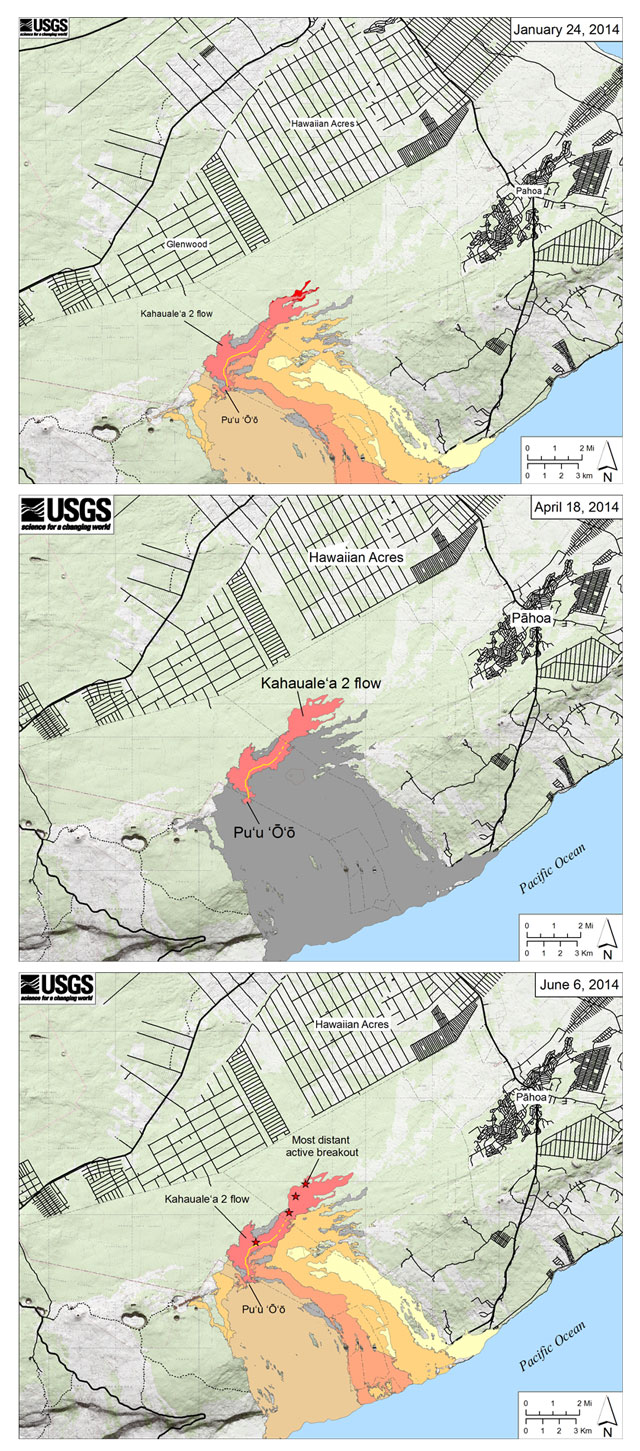 |
Figure 230. The Kahauale'a 2 lava flow as mapped by USGS-HVO scientists at three dates: (top) 24 January, (middle) 18 April, and (bottom) 6 June 2014. Significant breakouts are indicated as red stars or red areas. Inferred lava tube feeding the flow is shown as a yellow curve. Topographic constraints channeled the flow NE, an uncommon direction of advance. Areas covered by the more typical direction of advance for the E rift zone lavas during the past 31 years, progressing to the S, appear as a broad swath of unlabeled gray or colored areas on the maps. Courtesy of HVO. |
For the 24 January flow geometry the active area of breakouts (depicted in red on figure 230) were chiefly at the distal end. The Daily Update for the 24th reported the approximate linear distance for the total flow length from the vent at Pu'u 'O'o to the flow extreme at 7.5 km. That distance had been measured from a satellite image taken on 17 January.
For the 18 April flow geometry, the map lacks breakouts. As with the other two maps we see an inferred lava tube (in yellow) for that point in time. The flow front had remained fixed during the interval 9-28 April at a distance of 8.3 km from the vent. A measurement on 5 May showed farther advance, however and later breakouts also took place.
For the 6 June flow geometry, the active areas with breakouts appear as red stars. In this case three of the breakouts were inside the flow boundaries and one (the farthest from the vent) at the flow's N margin at 6.5 km linear distance from the vent. HVO reported the total flow length for 6 June at 8.8 km (based on a 14 May satellite measurement). No later refinements were posted and presumably this distance reflected the final state of advance for the Kahauale'a 2 flow.
The forward advance and to less extent the lateral spreading of the flows are summarized in table 11 as extracted from HVO daily and weekly reporting (and in some cases from the much shorter summaries in SI/USGS Weekly Volcanic Activity Reports). In addition to employing satellite images to discern the location of the flow front and breakouts, flow geometries were also measured with other approaches including spotters in aircraft, geologists in the field, and the gauging of flow behavior based on distant views or web camera images of smoke and fires. As noted above, the Kahauale'a 2 flow began at a complex of spatter cones actively venting lava at Pu'u 'O'o. The cones are described by their locations on the Pu'u 'O'o crater floor. A small lava lake (or lava pond) was generally present on the NE spatter cone during the reporting interval.
Table 11. Selected major and occasional minor events seen at Kīlauea during 26 December 2013 to 26 June 2014. Time intervals in this table are variable. Abbreviations used: Pu`u`O`o = P*; Halema`uma`u = H*; Kahauale'a 2 = K2. The column labeled L is the straight-line length of the Kahauale'a 2 flow (in kilometers) from source vent at Pu`u`O`o to the distal end. For example, in the second row "7.5 (17th)" reflects a length of 7.5 km from a measurement on 17 January. (Some measurements of L also appear in Comments.) Breakouts were often mentioned in HVO source data. We only included cases where both the distances from the vent were over a few kilometers and the distances were clearly specified. Some of this data came from compilations provided in the SI/USGS Weekly Volcanic Activity Reports. All the data were initially made public in HVO's weekly and daily reports.
| Date range | L | Comments |
| 24 Dec-14 Jan 2014 | 6.3 | The NE spatter cone fed the K2 lava flow, which contained breakouts. During 1-2 January the SE spatter cone erupted 5 short lava flows. The Volcano Alert Level and Aviation Color Code both remained stable during reporting interval (at Watch and Orange, respectively). |
| 15 Jan-21 Jan 2014 | 7.5 (17th) | At the summit a deflation-inflation (DI) event began the 17th; during 21st-22nd the lava-lake at Outlook crater dropped more than 20 m to ~70 m below H* crater floor (the low stand for the 1st half of 2014). On 19th HVO noted the N side of the NE spatter cone at P*collapsed, possibly due to lowered lava lake corresponding to the DI event. The collapse exposed a lava pond. |
| 22 Jan-28 Jan 2014 | 7.8 (24th) | K2 was fed by the NE spatter cone. On the 23rd, minor lava oozed out of SE spatter cone. During 23-26 Jan lava rose in W-most spatter cone and flowed down its N flank. |
| 29 Jan-04 Feb 2014 | 7.8 (27th) | Scattered breakouts from K2 flow 4.8 and 6.7 km NE of P*. On 31st, brief lava overflow at two spatter cones at P*. A satellite image from 2nd shows breakouts 4.8 to 6.7 km NE of P*. Outlook crater lava-lake depth below H* floor during 29th-4th, 43-60 m. |
| 05 Feb-04 Mar 2014 | 7.8 (2nd) | On 12th, breakouts extended 7.2 km P*, mostly advancing over previously erupted lava flows. |
| 05 Mar-11 Mar 2014 | 7.9 (7th) | Outlook crater lava-lake depth below H* floor during 5th-11th, 40-49 m. |
| 12 Mar-18 Mar 2014 | 8 (11th) | On the 12th, lava from the S cone traveled to the S. Once on the 14th and twice on the 17th lava from the pond rose and spilled over the rim. Breakouts from the K2's main lobe. |
| 19 Mar-25 Mar 2014 | 8.2 (21st) | The P* NE spatter cone still hosted a lava pond, which on the 18-19th spilled over the rim occasionally. |
| 26 Mar-01 Apr 2014 | -- | NE spatter cone at P* both hosted lava pond and fed the K2 lava flow. Satellite imagery for 27th defined breakouts at 5.5 and 8 km NE of P*. |
| 02 Apr-08 Apr 2014 | 8.2 (7th) | The K2 lava flow continued to advance. Breakouts from the main stalled lobe burned adjoining forest. Outlook crater lava-lake depth below H* floor during 2nd-8th, 23-47 m. |
| 09 Apr-15 Apr 2014 | 8.3 (9th) | At P*Crater, the lava pond continued in the NE spatter cone (during most of the reporting period). |
| 16 Apr-22 Apr 2014 | -- | The K2 lava flow continued to advance, with breakouts from the main stalled lobe, and burned adjoining forest |
| 22 Apr-29 Apr 2014 | 8.3 (28th) | On the 28-29th, the lava lake surface in Overlook crater reached ~30 m below the crater floor, the highest measured since Feb 2013. Just before midnight on the 22nd, the N spatter cone produced a vigorous lava flow that traveled E, in minutes crossing P*'s floor and descending through the tube feeding the K2 flow. |
| 30 Apr-06 May 2014 | 8.6 (5th) | The S spatter cone periodically erupted lava flows that traveled N and SE beyond the crater rim. During 5-6 May the N cone ejected spatter and a small lava flow. Outlook crater lava-lake depth below H* floor during 30th-6th, 31-35 m. |
| 07 May-13 May 2014 | -- | HVO reported "...the flow front has not advanced more than 1.6 km (1 mi) since the first time it stalled in early November 2013." On the 13th, HVO noted that "There was no lava activity on the Pu`u `O`o [P*] crater floor or on the flanks of the cone--the decrease in activity is probably a direct response to the ongoing deflation of the cone." The most recent sulfur-dioxide emission-rate measurement on the E rift zone was 200 tons per day on the 12th. |
| 14 May-20 May 2014 | 8.8 (14th) | K2 again advanced. P*'s NE spatter cone still hosted a lava pond. A satellite image from the 14th showed scattered breakouts on the flow field. |
| 21 May-27 May 2014 | -- | Volcano Watch article on 12 June noted that with respect to P*, the flow front stalled at 8.8 km and breakouts from the main flow occurred as far away as 8.4 km. Summit tilt meters recorded continued weak inflationary tilt and the lava-lake surface was in the range of 51-53 m below H*'s floor. K2 lava flow remained active but advanced slowly. Tremor was elevated, as were summit earthquakes (35 were strong enough to be located in a 24 hour interval ending on the 21st; 10 struck the S flanks; and several, along the E rift zone). Measurements across Kīlauea caldera indicated continued extension. The extension rate since 2010 has averaged 10 cm/yr. |
| 28 May-01 Jun 2014 | -- | P*'s lava pond at the NE spatter cone briefly overflowed its rim each morning. On 30 May HVO mapped three small breakouts on several lobes 1.8-6.2 km from P*. |
| 02 Jun-17 Jun 2014 | -- | HVO commented that the slow-moving K2 flow appeared to be weakening over the past few months. On the 6th, HVO mapped 4 small breakouts in the flow's interior extending out to 6.5 km NE of P* (see map, figure 230, bottom). On the 16th the SO2 flux was 300 tons per day from all E rift zone sources. Outlook crater lava-lake depth below H* floor during 2nd-17th, 33-47 m. |
| 11 Jun-26 Jun 2014 | -- | On the 17th HVO mapped 5 small breakouts as far as 7 km NE from P*; a satellite image for the 20th a satellite revealed multiple breakouts in the flow's interior extending to 7.1 km NE of P*. On the 19th lava started pouring out of the NE spatter cone and flowing N along the K2 lava flow for about 12 hours. The new lava erupting coincided with tilt at P* that included -0.7 microradians of abrupt deflation. Overall, the K2 lava flow moved slowly and showed signs of continued weakening. On the 21st the lava-lake surface in Overlook crater dropped, but by the 22nd it came back up to about 34-35 m below the floor of H*. On the 23rd, the lava pond was covered with a crust. On 24th, rockfalls triggered a small explosion; spatter fell on the closed tourist overlook at H*. |
As previously noted, in table 11 the column L reflects the flow's linear distance between the vent area at Pu'u 'O'o on the E rift zone and the E-advancing Kahauale'a 2 flow front. When this distance (L) remained constant for days or longer the flow was described as 'stalled' although in many cases portions of the flow farther back may have continued to grow and spread laterally as evidenced by areas of freshly exposed lava (breakouts such as those listed in the table). These HVO distance data are preliminary.
DI events were the subject of an article in the 29 March 2012 issue of Volcano Watch, from which the following freely borrows. The term DI event stands for deflation-inflation of the edifice. DI events have been dominating deformation of the volcano since 2008. According to HVO Daily Updates, they remained common in both 2013 and this reporting interval. A sudden deflation often lasts for 1–3 days, followed by an equally sudden inflation that returns the tilt to pre-event levels. This gives the tilt events a V- or U-shaped appearance in tilt records. The article said, "The total amount of subsidence during deflation and subsequent uplift during inflation is usually only about an inch (2.5 cm) and appears to be caused by pressure changes about 1 km beneath the east margin of Halema'uma'u Crater."
Put simplistically, during DI inflation, magma pressure increases and lava feeds the active lava flow, allowing it to advance. During DI deflation, the magma pressure decreases, reducing the supply of lava, causing the flow to stall. When the cycle repeats, DI inflation returns. This returns more lava to the flow. The incoming lava typically breaks out well behind the stalled flow front.
DI tilt is recorded at both Halema`uma`u and at Pu'u 'O'o. According to the Volcano Watch article, tilt at the E rift zone's eruption site has the same overall form as that at the summit but lags behind by a few hours. HVO interprets this as a response pressure change moving from the summit to Pu'u 'O'o. DI events are often associated with changes in eruptive activity. During the deflation phase, lava effusion at Pu'u 'O'o tends to decrease and the summit lava lake surface in Outlook crater drops, while the inflation phase is accompanied by a rise in the lava lake and sometimes a surge in lava from Pu'u 'O'o. Exceptions to these generalizations are frequent, however.
According to HVO's weekly reports, deflation-inflation cycles (DI events) did not occur from mid-December 2013 through the week of 16 January 2014. Late on 17 January, a large DI event occurred and from 22-23 January a DI inflation event was also observed. Over the next two weeks, a total of four DI events were reported. Starting in mid-February through early March, cycles of DI events were observed. On 10 April, the deflation phase of a large DI event occurred and inflation then began on 14 April. Abrupt summit deflation was noted on 10 May and was followed by a gradual deflation. During the last week of May, summit inflation began and in early June, deflation was noted.
Most of the seismic data presented in Daily Updates were the preliminary location and magnitude of located events. According to a Volcano Watch article issued on 27 February 2014, the location and magnitude of an earthquake may change after more careful review. According to the article, after an earthquake is recorded by the seismic network the data are processed within seconds. An initial preliminary earthquake location and magnitude becomes available about 3 minutes later.
On the basis of the preliminary values in Daily Updates, located events during 2014 were generally lower than 40-50 events per day. On the most seismically active single days, instruments recorded slightly over 100 events, and on the least active, just a few per day. Tremor was often described as weak and steady. Areas with epicenters typically included the summit caldera, East and SW rift zones, and the S flank area.
References. Hawai'i State Department of Health, (May) 2013, Frequently Asked Questions and Answers on Vog and Volcanic Emissions from Kīlauea (6 pp., URL: Health.hawaii.gov/cab/files/2013/05/Kīlauea_vog_qa_1.pdf ) Accessed 24 March 2015.
Kroll, J. H., Cross, E. S., Hunter, J. F., Pai, S., Wallace, L., Croteau, P. L., ... and Frankel, S. L., 2015, Atmospheric evolution of volcanic smog ("vog") from Kīlauea: Real-time measurements of oxidation, dilution, and neutralization within a volcanic plume. Environmental science & technology (ASAP), American Chemical Society Publications (published 3 March 2015) DOI: 10.1021/es506119x
Geological Summary. Kilauea overlaps the E flank of the massive Mauna Loa shield volcano in the island of Hawaii. Eruptions are prominent in Polynesian legends; written documentation since 1820 records frequent summit and flank lava flow eruptions interspersed with periods of long-term lava lake activity at Halemaumau crater in the summit caldera until 1924. The 3 x 5 km caldera was formed in several stages about 1,500 years ago and during the 18th century; eruptions have also originated from the lengthy East and Southwest rift zones, which extend to the ocean in both directions. About 90% of the surface of the basaltic shield volcano is formed of lava flows less than about 1,100 years old; 70% of the surface is younger than 600 years. The long-term eruption from the East rift zone between 1983 and 2018 produced lava flows covering more than 100 km2, destroyed hundreds of houses, and added new coastline.
Information Contacts: Hawaiian Volcano Observatory (HVO), U.S. Geological Survey, PO Box 51, Hawai`i National Park, HI 96718, USA (URL: https://volcanoes.usgs.gov/observatories/hvo/, Daily Updates, https://volcanoes.usgs.gov/observatories/hvo/activity/Kilaueastatus.php, and (weekly) Volcano Watch, https://volcanoes.usgs.gov/observatories/hvo/volcanowatch/); Recent maps, https://volcanoes.usgs.gov/observatories/hvo/maps); and SI/USGS Weekly Volcanic Activity Reports (URL: http://www.volcano.si.edu).