Reventador
Ecuador
0.077°S, 77.656°W; summit elev. 3562 m
All times are local (unless otherwise noted)
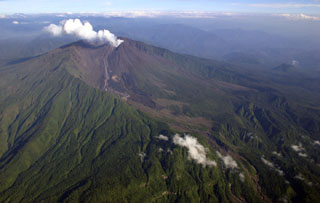
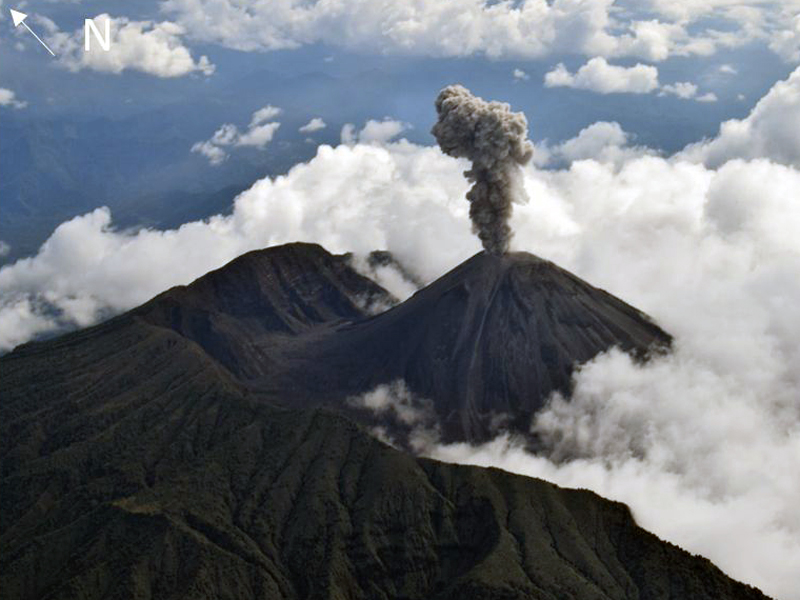
Reventador is one of the most active volcanoes in Ecuador. The active cone is situated in a horseshoe-shaped collapse crater that opens to the E. Typical activity consists of explosions that eject blocks onto the slopes and ash plumes, as well as occasional lava flows and pyroclastic flows. Activity has been elevated since 2002, with several breaks between eruptions during this time. Since 2002 there have been 637 volcanic ash activity reports indicating ash plumes, and 36 ash plumes have exceeded 3.1 km above the crater. This report summarizes eruptive activity for April through September 2018 and is based on Instituto Geofisico (IG-EPN) reports, Washington Volcano Ash Advisory Center (VAAC) reports, and various satellite data.
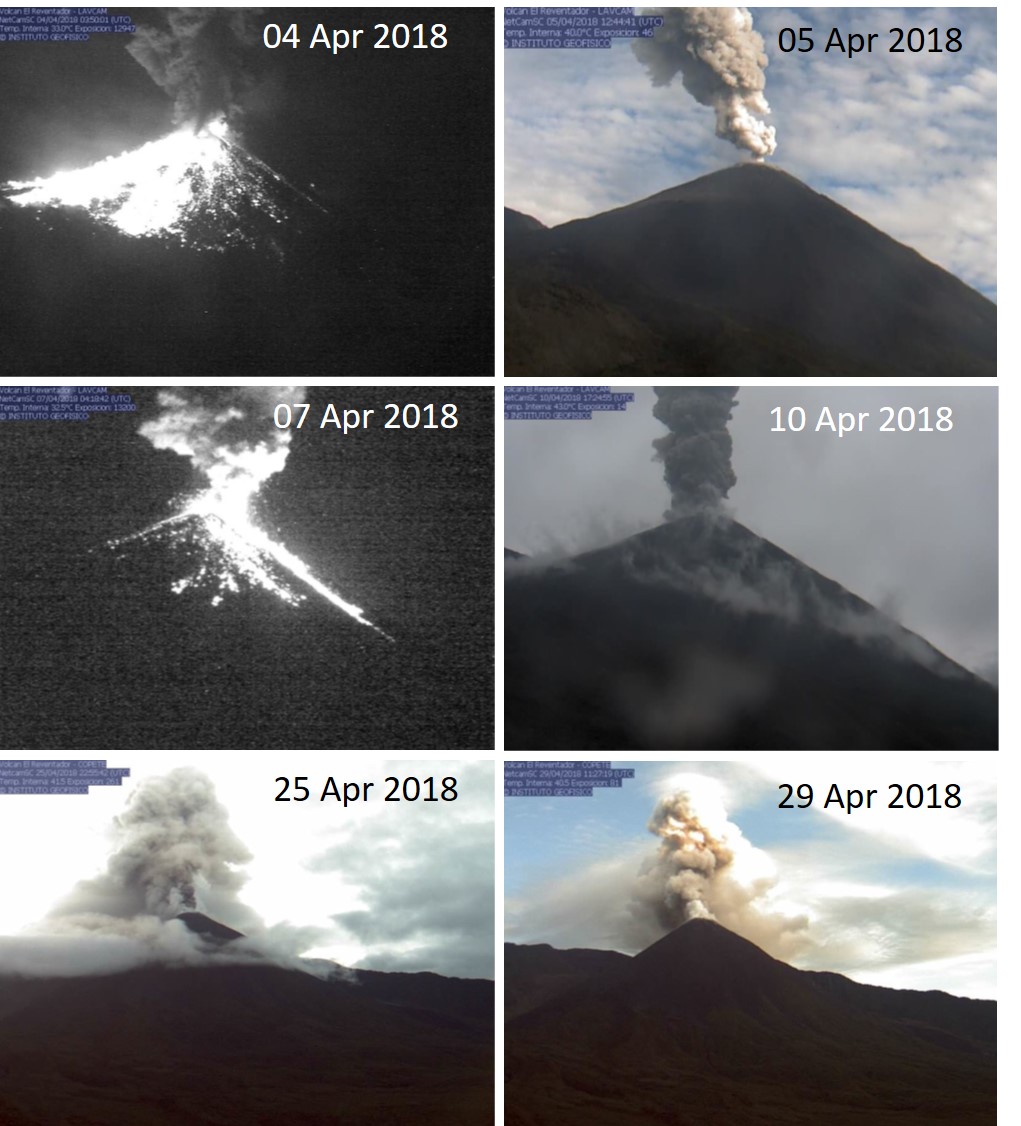
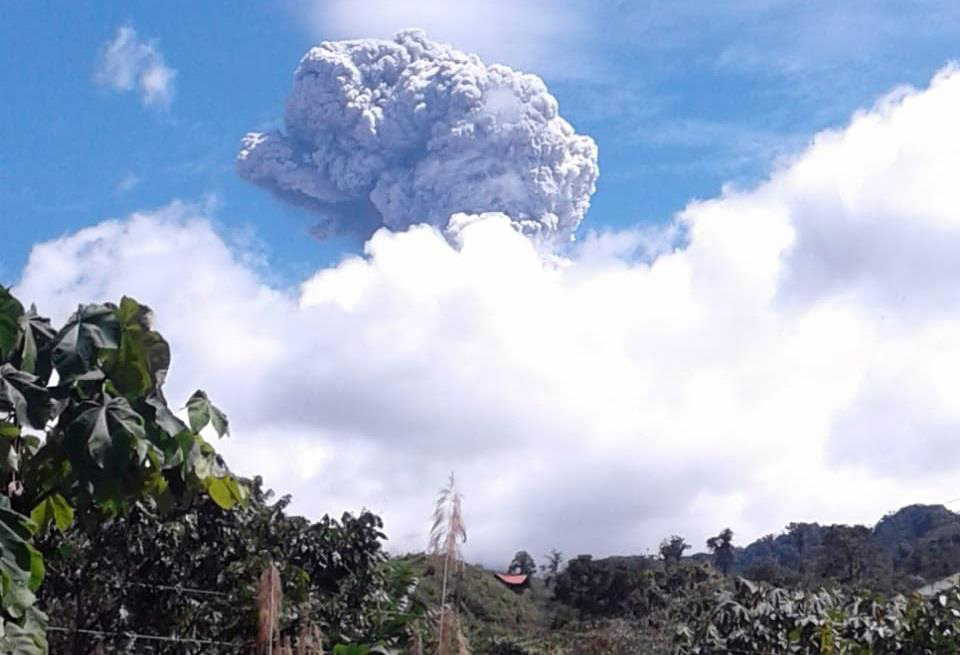
The activity at Reventador has had several broad levels of activity during this time: 'very explosive' during January to 21 April with up to 45 explosions per day; a period of reduced explosive activity from 22 April to 16 August with fewer than five explosive events per day; and 'very explosive' activity continued after 17 August. The activity produced frequent plumes, several lava flows out to 3 km from the vent, and pyroclastic flows. Incandescence was frequently observed at the crater throughout this period. A partial flank collapse occurred in April, resulting in five new vents within the new scarp on the W side. Incandescent blocks were frequently observed on the flanks, reaching down to 1 km from the crater and ash plumes were frequently observed with maximum heights of 1-3 km (table 10). The area was often concealed by cloud cover but incandescence was frequently noted when the summit was visible. Near-continuous activity was reported when the volcano was visible (figure 89).
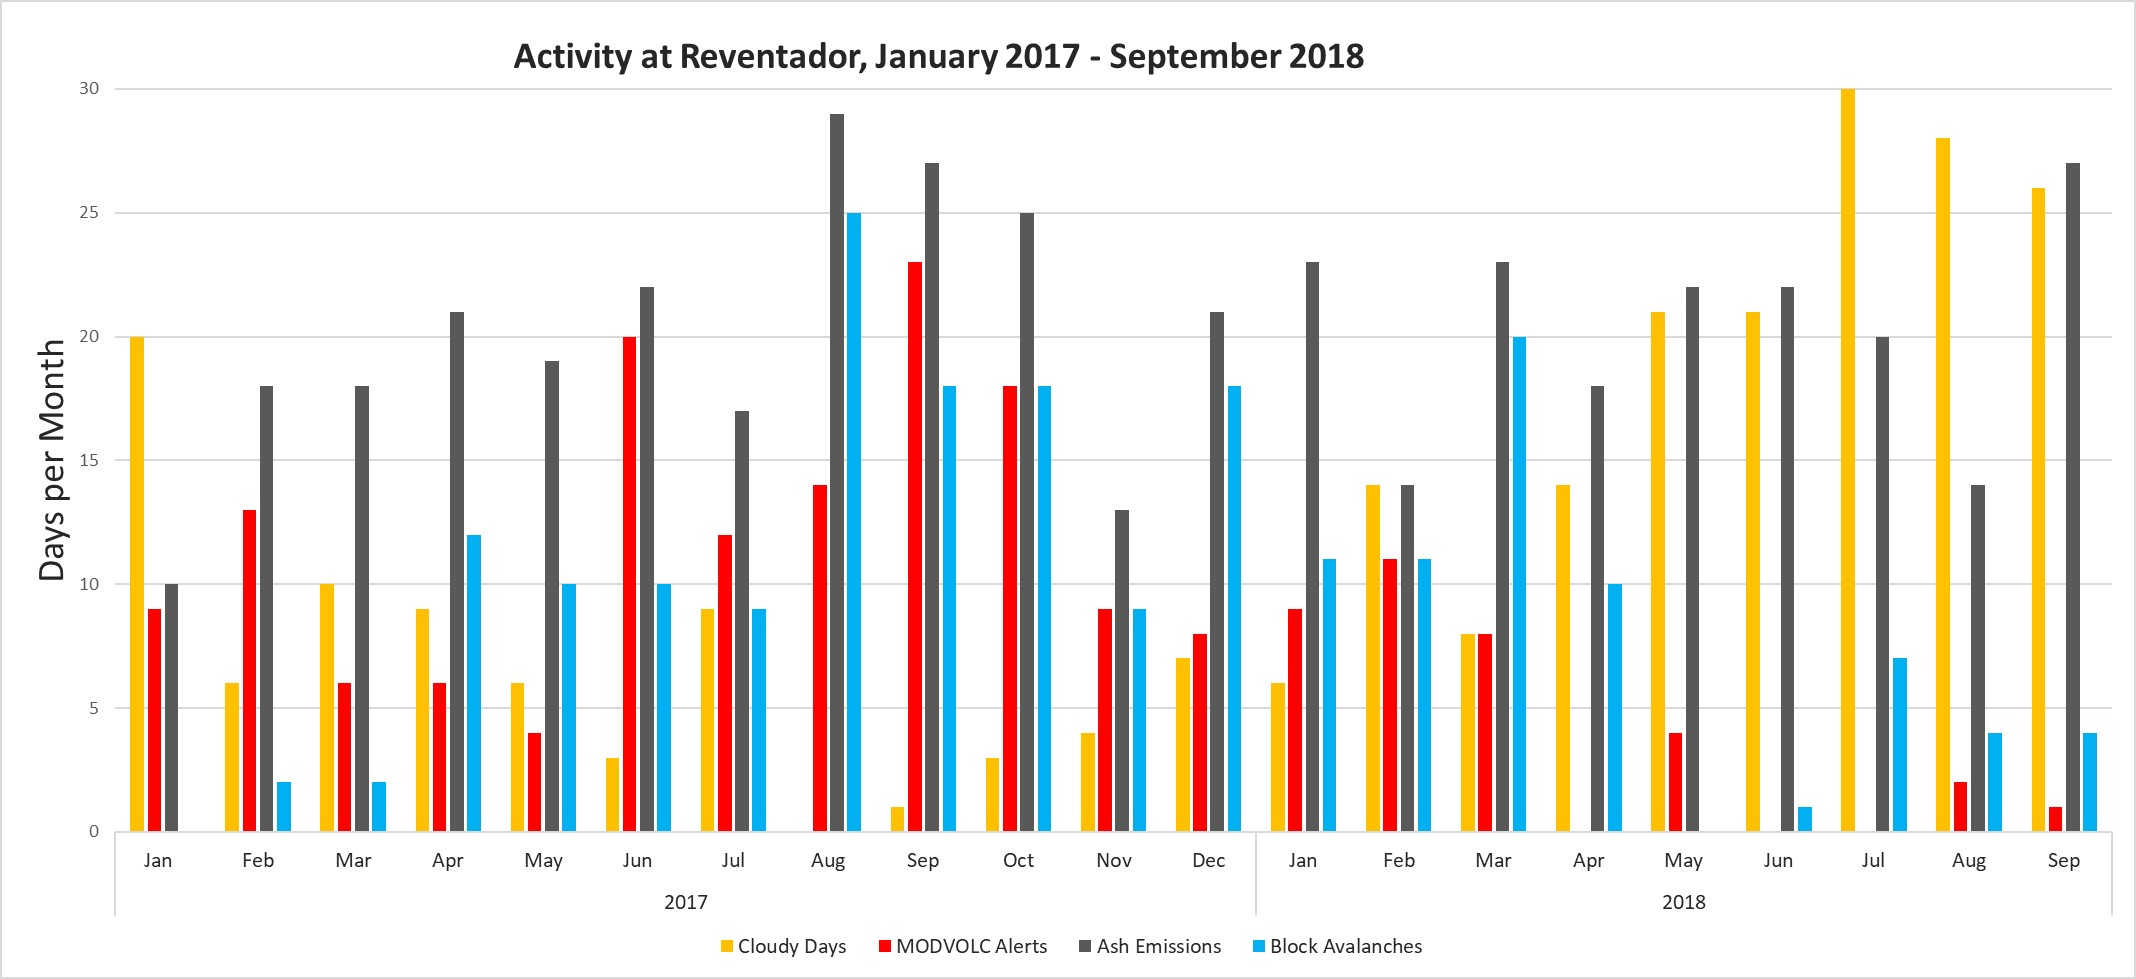
Table 10. High levels of activity at Reventador during April-September 2018 were evident from the numbers of MODVOLC thermal alerts, days with reported ash emissions, and block avalanches. Clouds covering the volcano impacted observations of activity during most months. Compiled from IG-EPN daily reports, VAAC reports, and MODVOLC data.
| Date |
MODVOLC alerts |
Cloudy days |
Days with ash emissions |
Plume heights above summit (m) |
Days with block avalanches |
Block avalanche runout distances (m) |
| Apr 2018 |
0 |
14 |
18 |
Less than 200 - over 1,000 |
10 |
200 - 800 |
| May 2018 |
4 |
21 |
22 |
300 - 3,100 |
1 |
800 |
| Jun 2018 |
0 |
21 |
22 |
300 - over 1,000 |
5 |
300 - 800 |
| Jul 2018 |
0 |
30 |
20 |
200 - 2,500 |
7 |
100 - 1,000 |
| Aug 2018 |
2 |
28 |
14 |
100 - over 1,000 |
4 |
600 - 1,000 |
| Sep 2018 |
1 |
26 |
27 |
400 - over 1,000 |
4 |
300 - 600 |
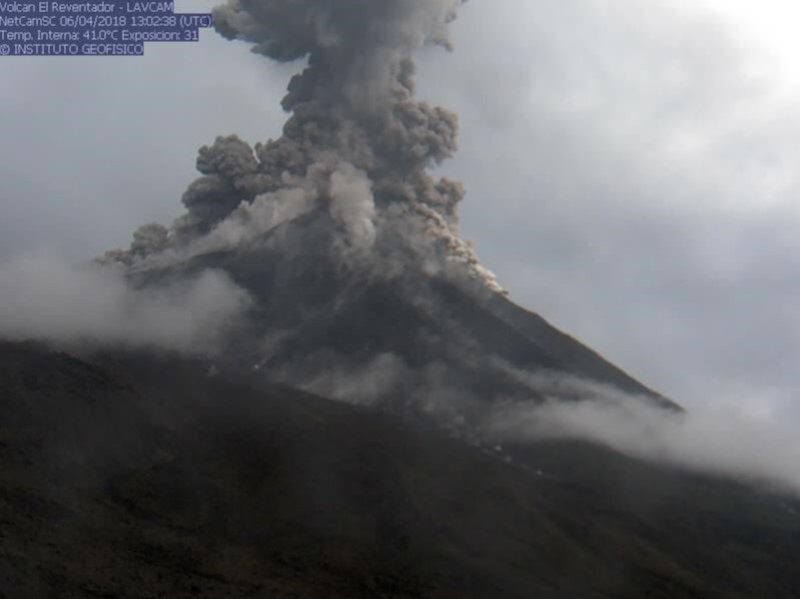
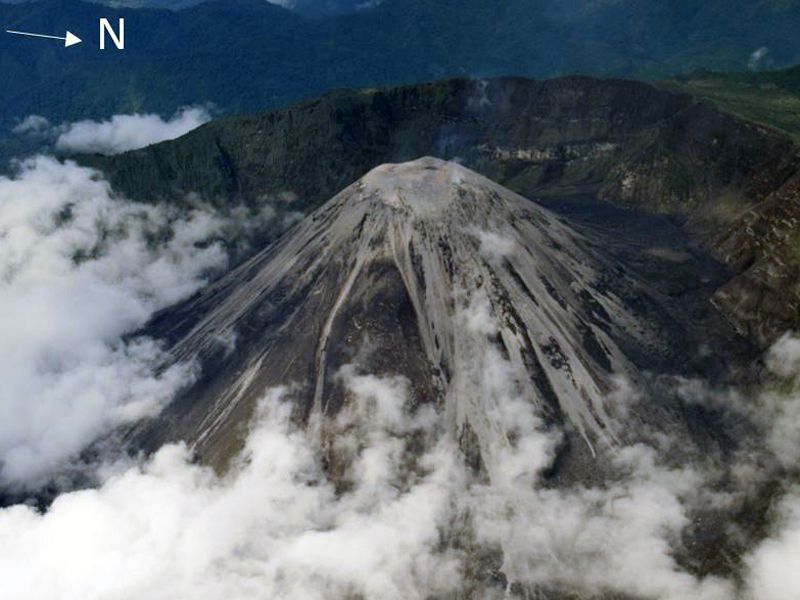
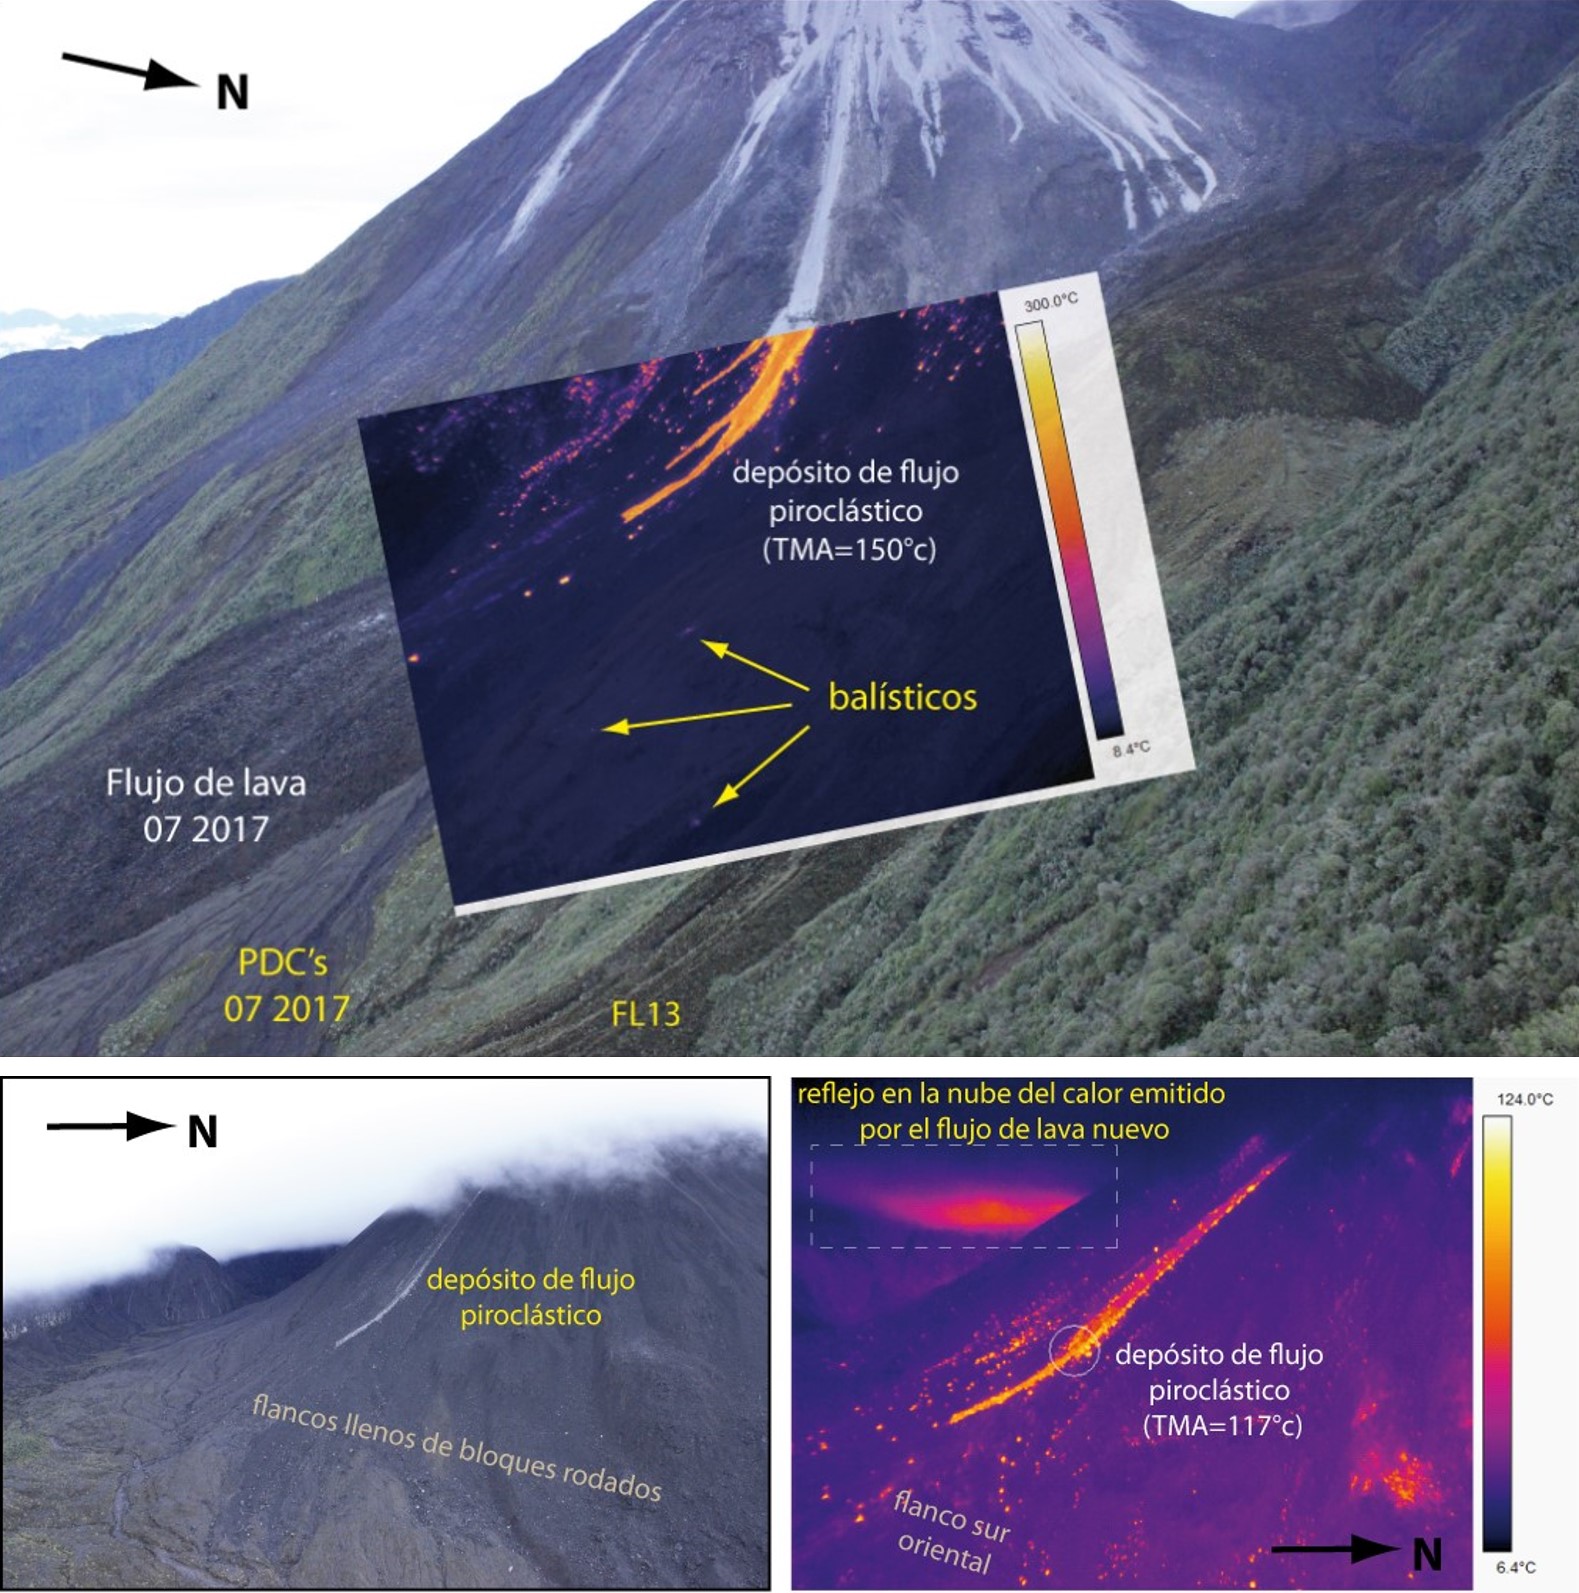
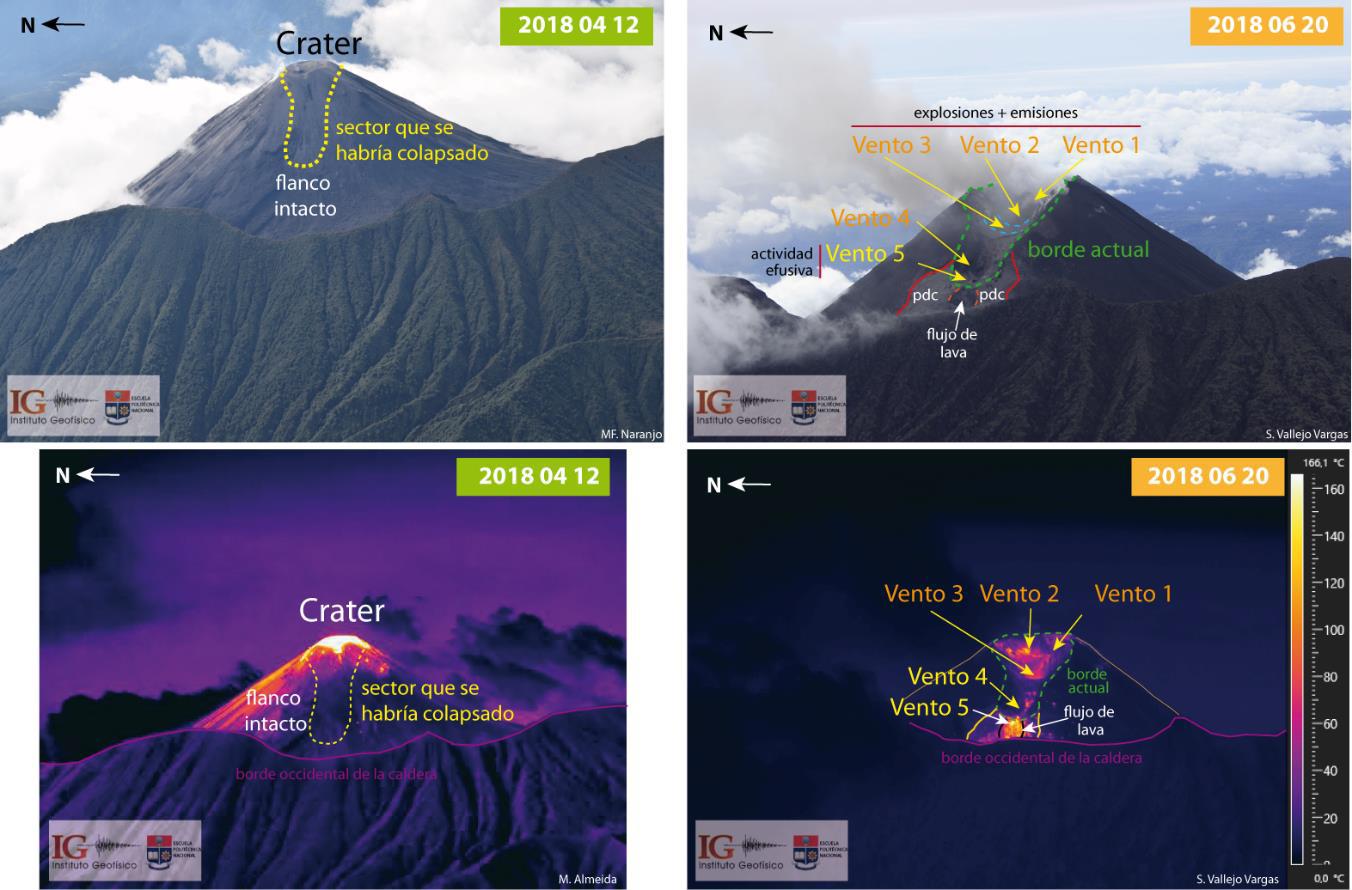
Near-continuous activity continued through April, with ash or gas-and-steam plumes observed on most days when weather permitted (figure 90). On 6 April a 600-m-high ash plume was accompanied by pyroclastic flows that traveled down multiple flanks (figure 91). Light ashfall was reported to the NE of Reventador on the night of 9 April after a 600-m-high ash plume and incandescent blocks were ejected. An overflight on 12 April observed short ash plumes up to 1.5 km above the crater accompanied by "cannon-shot" booms (figure 92), a pyroclastic flow, and hot avalanche deposits radiating from the crater out to 1.6 km (figures 93 and 94). Temperatures in the vent reached 355°C and the maximum detected pyroclastic flow deposit temperature was 150°C.
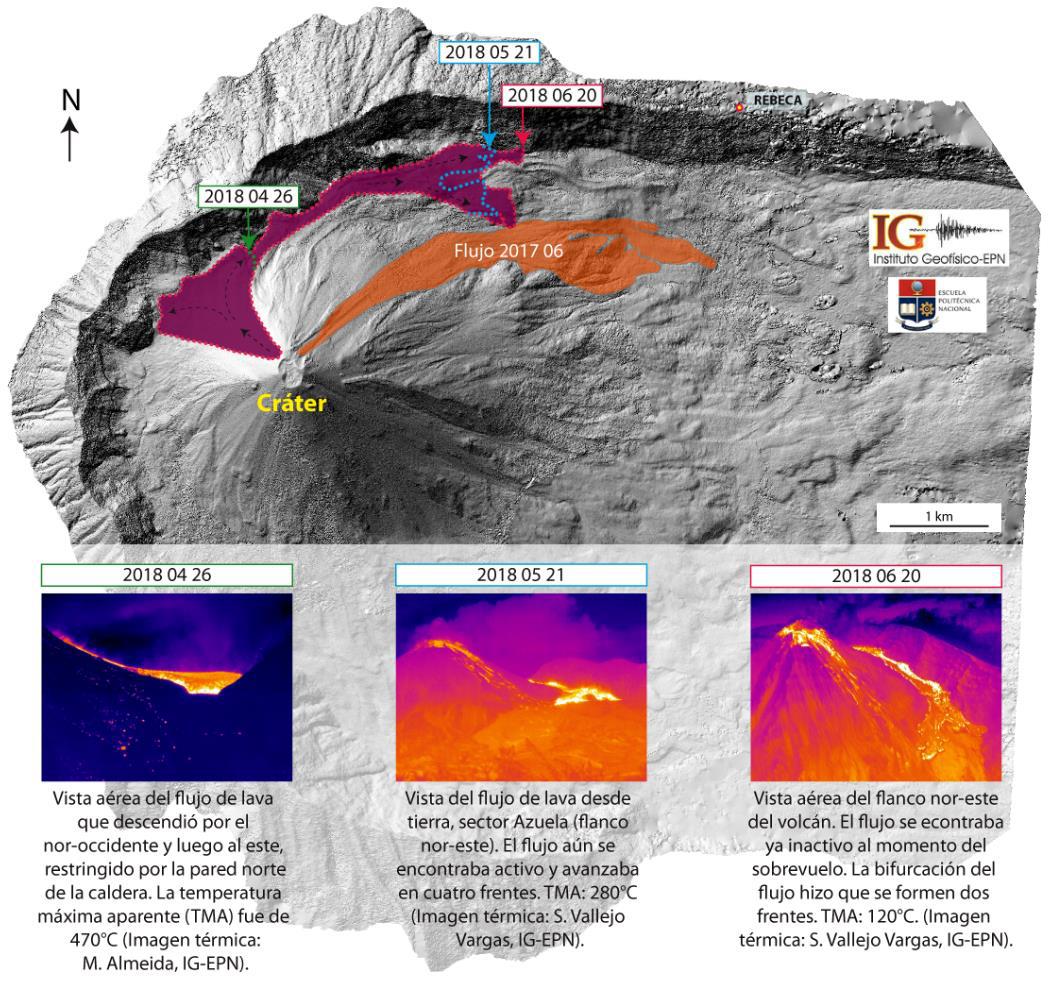
Continuous explosive activity in the second and third weeks of April caused a partial collapse of the western flank, including part of the summit (figure 95). The length and width of the resulting scarp was 400 x 200 m, and the maximum depth was 200 m. Within this collapse scarp, five vents had formed that were producing both effusive and explosive activity. A lava flow and pyroclastic flow deposits were observed below the collapse area. On 26 April an active lava flow was observed descending the W flank that was redirected towards the E once it reached the older collapse scarp wall (figure 96). The lava flow was active for around one month and had ceased by the time the flow was observed again during an overflight on 20 June. A thermal survey on 20 June detected temperatures within the vents ranging from 60-155°C. At the time of the survey, three out of five vents were active with either effusive or explosive activity.
Ash and gas-and-steam plumes continued through May with plumes reaching 3.1 km above the crater, accompanied by ballistic projectiles and hot avalanches that reached 800 m away from the crater on the flanks of the volcano. There were 12 reports of ashfall on 27 May in the provinces of Imbabura, Napo and Pichincha. On 27 May there were 12 reports of ashfall in the provinces of Imbabura (Antonio Ante, Otavalo), Napo (Quijos), and Pichincha (Cayambe, Pedro Moncayo, Quito), originating from a 3.1-km-high ash plume (figure 97).
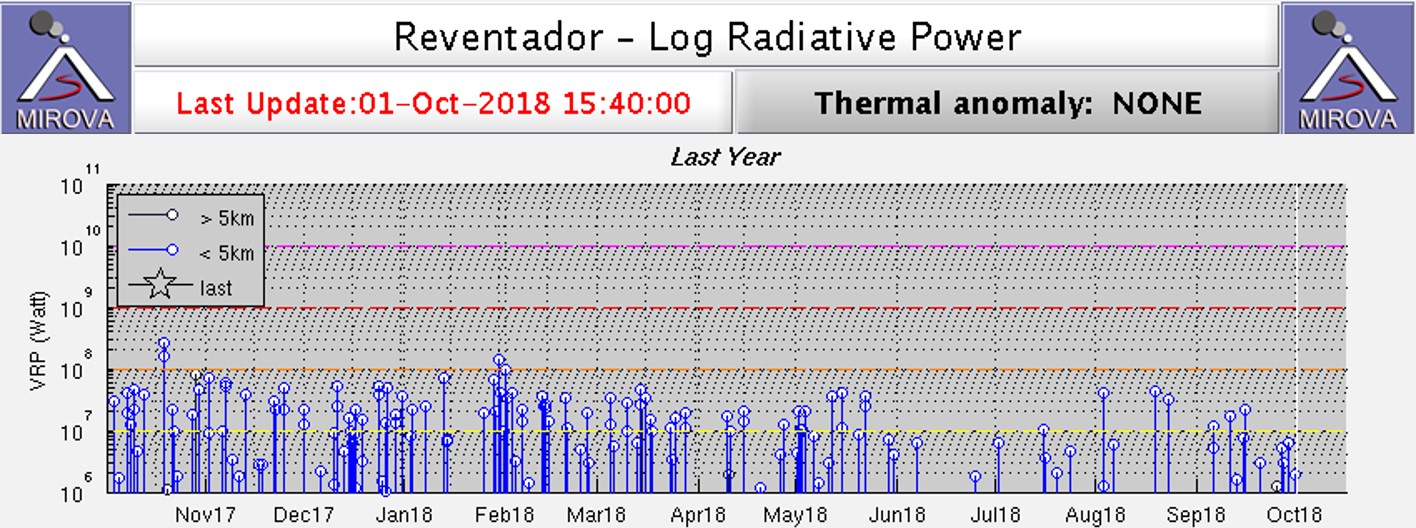
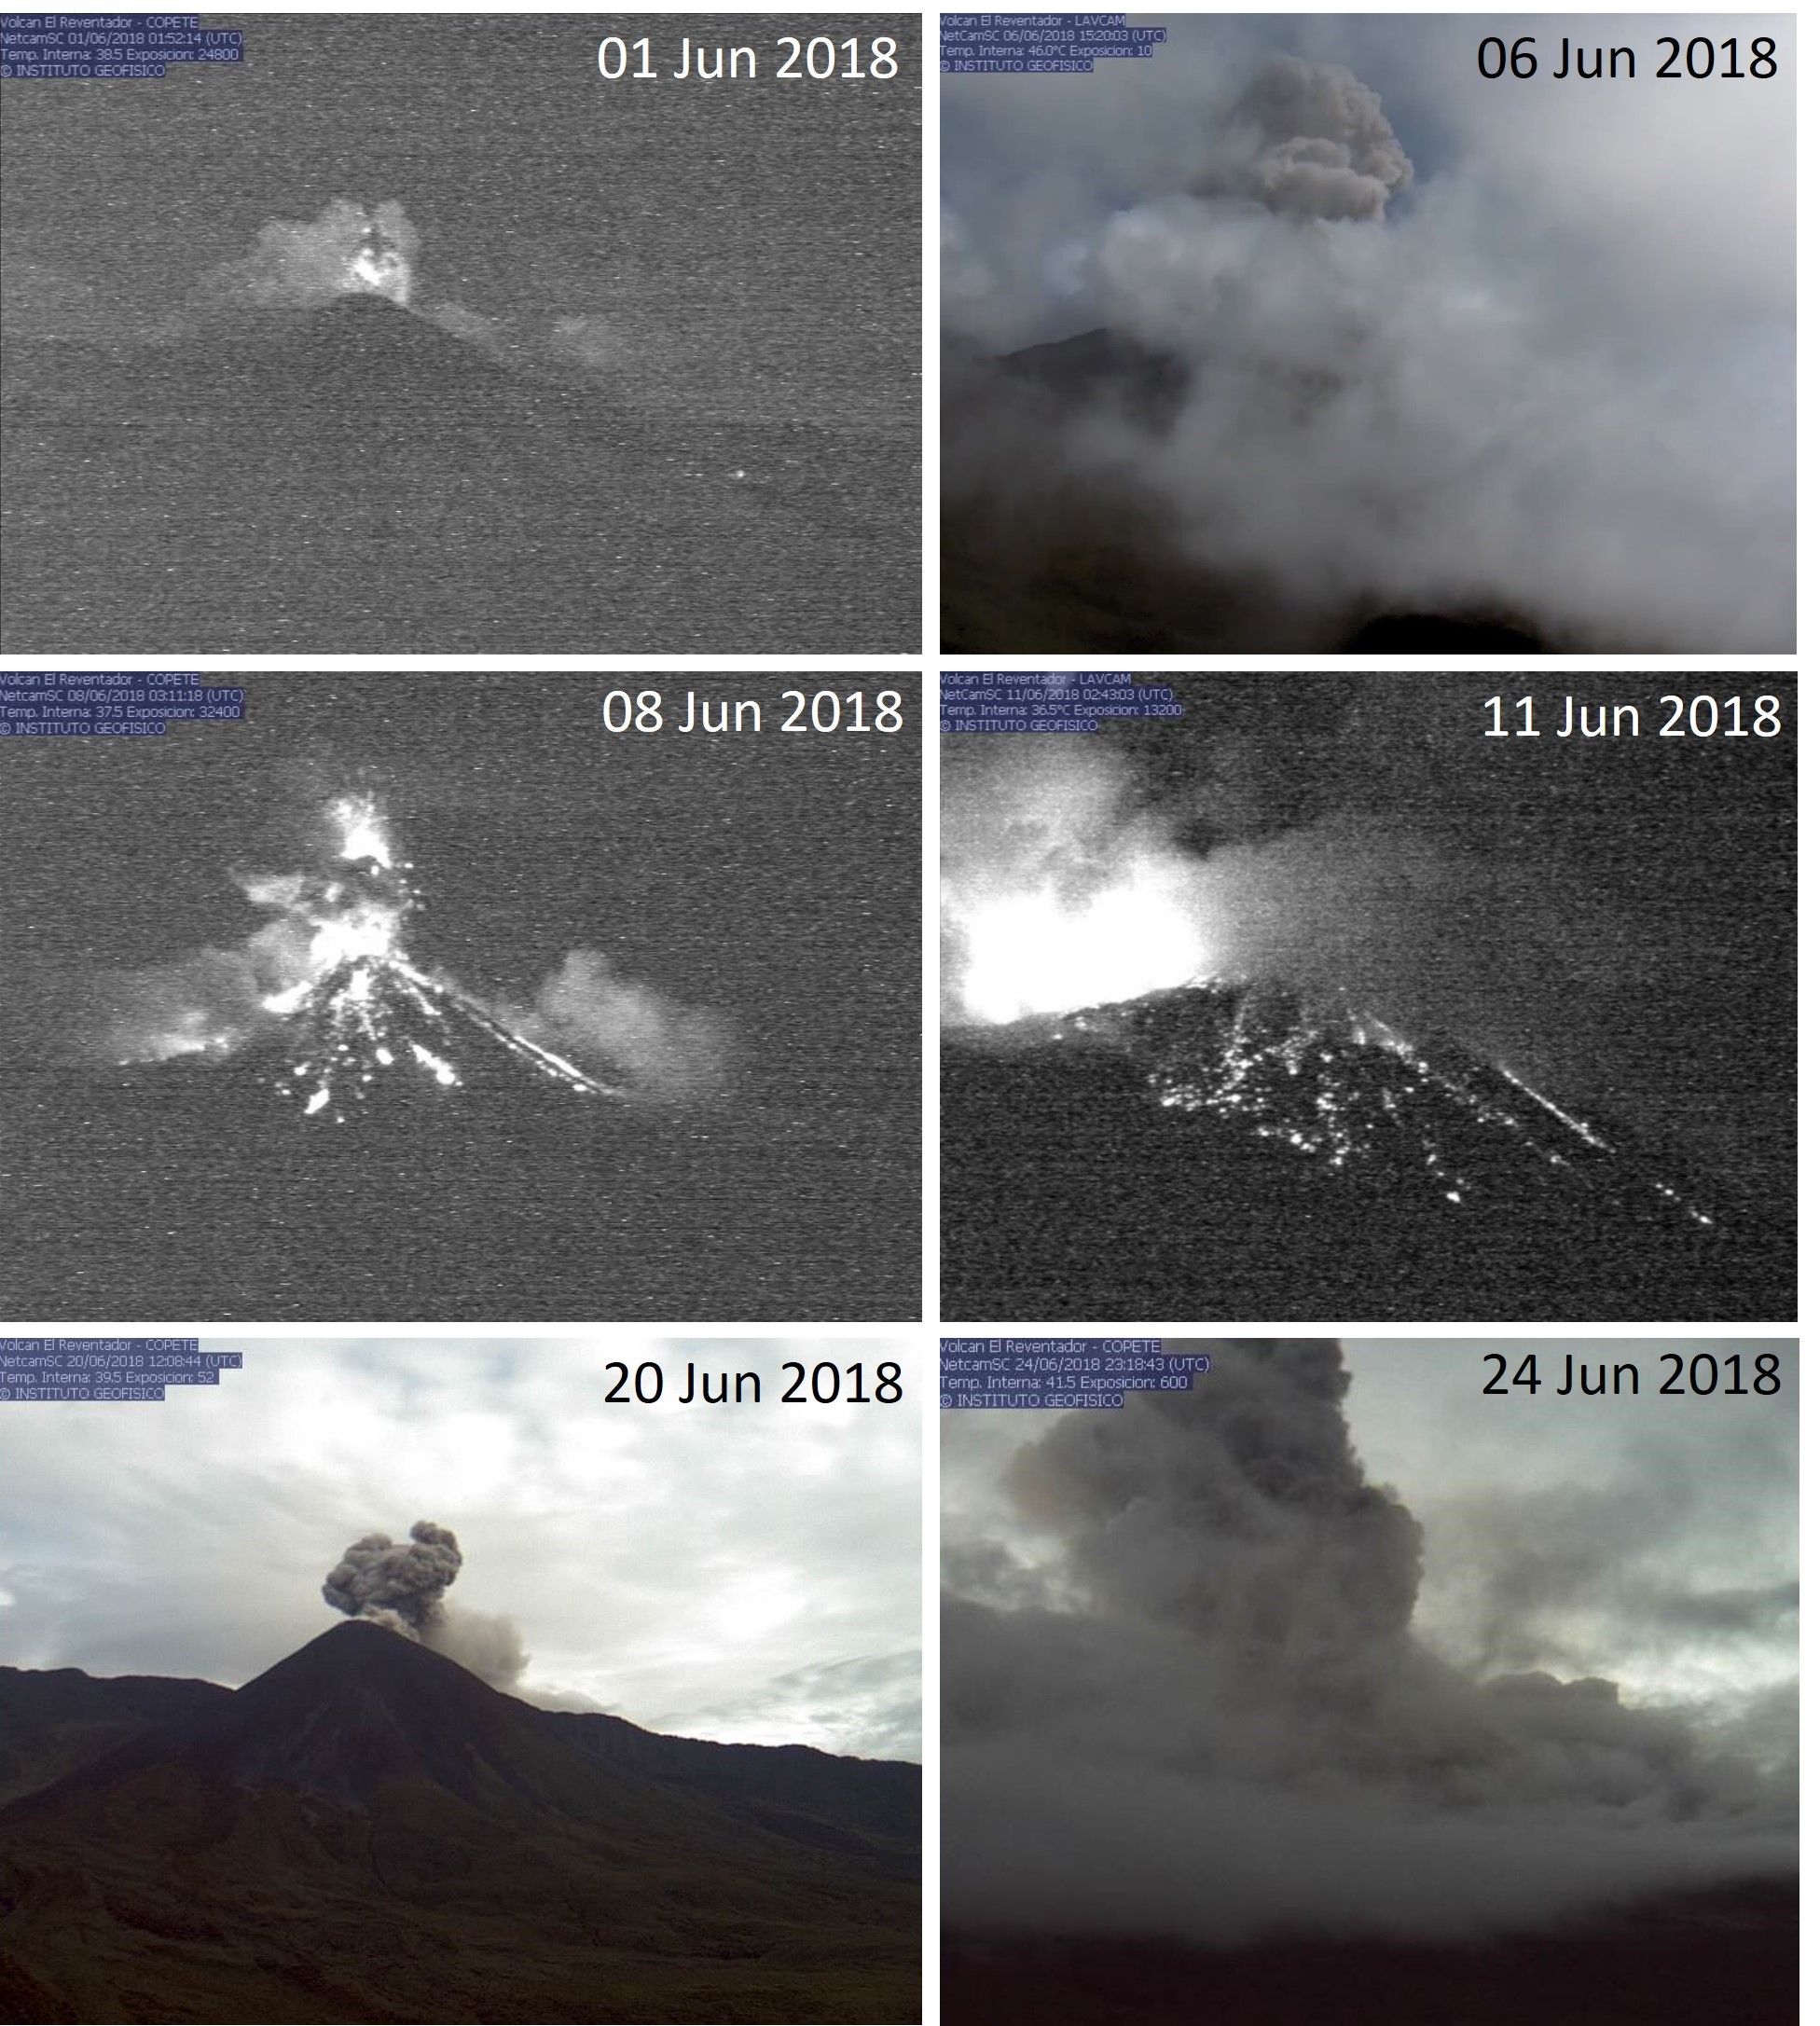
Detected thermal anomalies were less frequent from June through September (figure 98). Ash and gas-and-steam plumes continued through June, reaching over 1 km above the crater (figure 99). Light ashfall was reported in Azcásubi on 28 June. Five avalanches of incandescent blocks were recorded, extending 800 m from the crater. Through July, ash and gas-and-steam plumes reached a maximum height above the crater of 2.5 km. Four incandescent block avalanches were observed down to 1 km below the crater. Ashfall was reported on 2 July in the Cayambe sector and in the town of Juan Montalvo (figure 100). Light ashfall was also reported in Tababela and Puembo on 19 July.
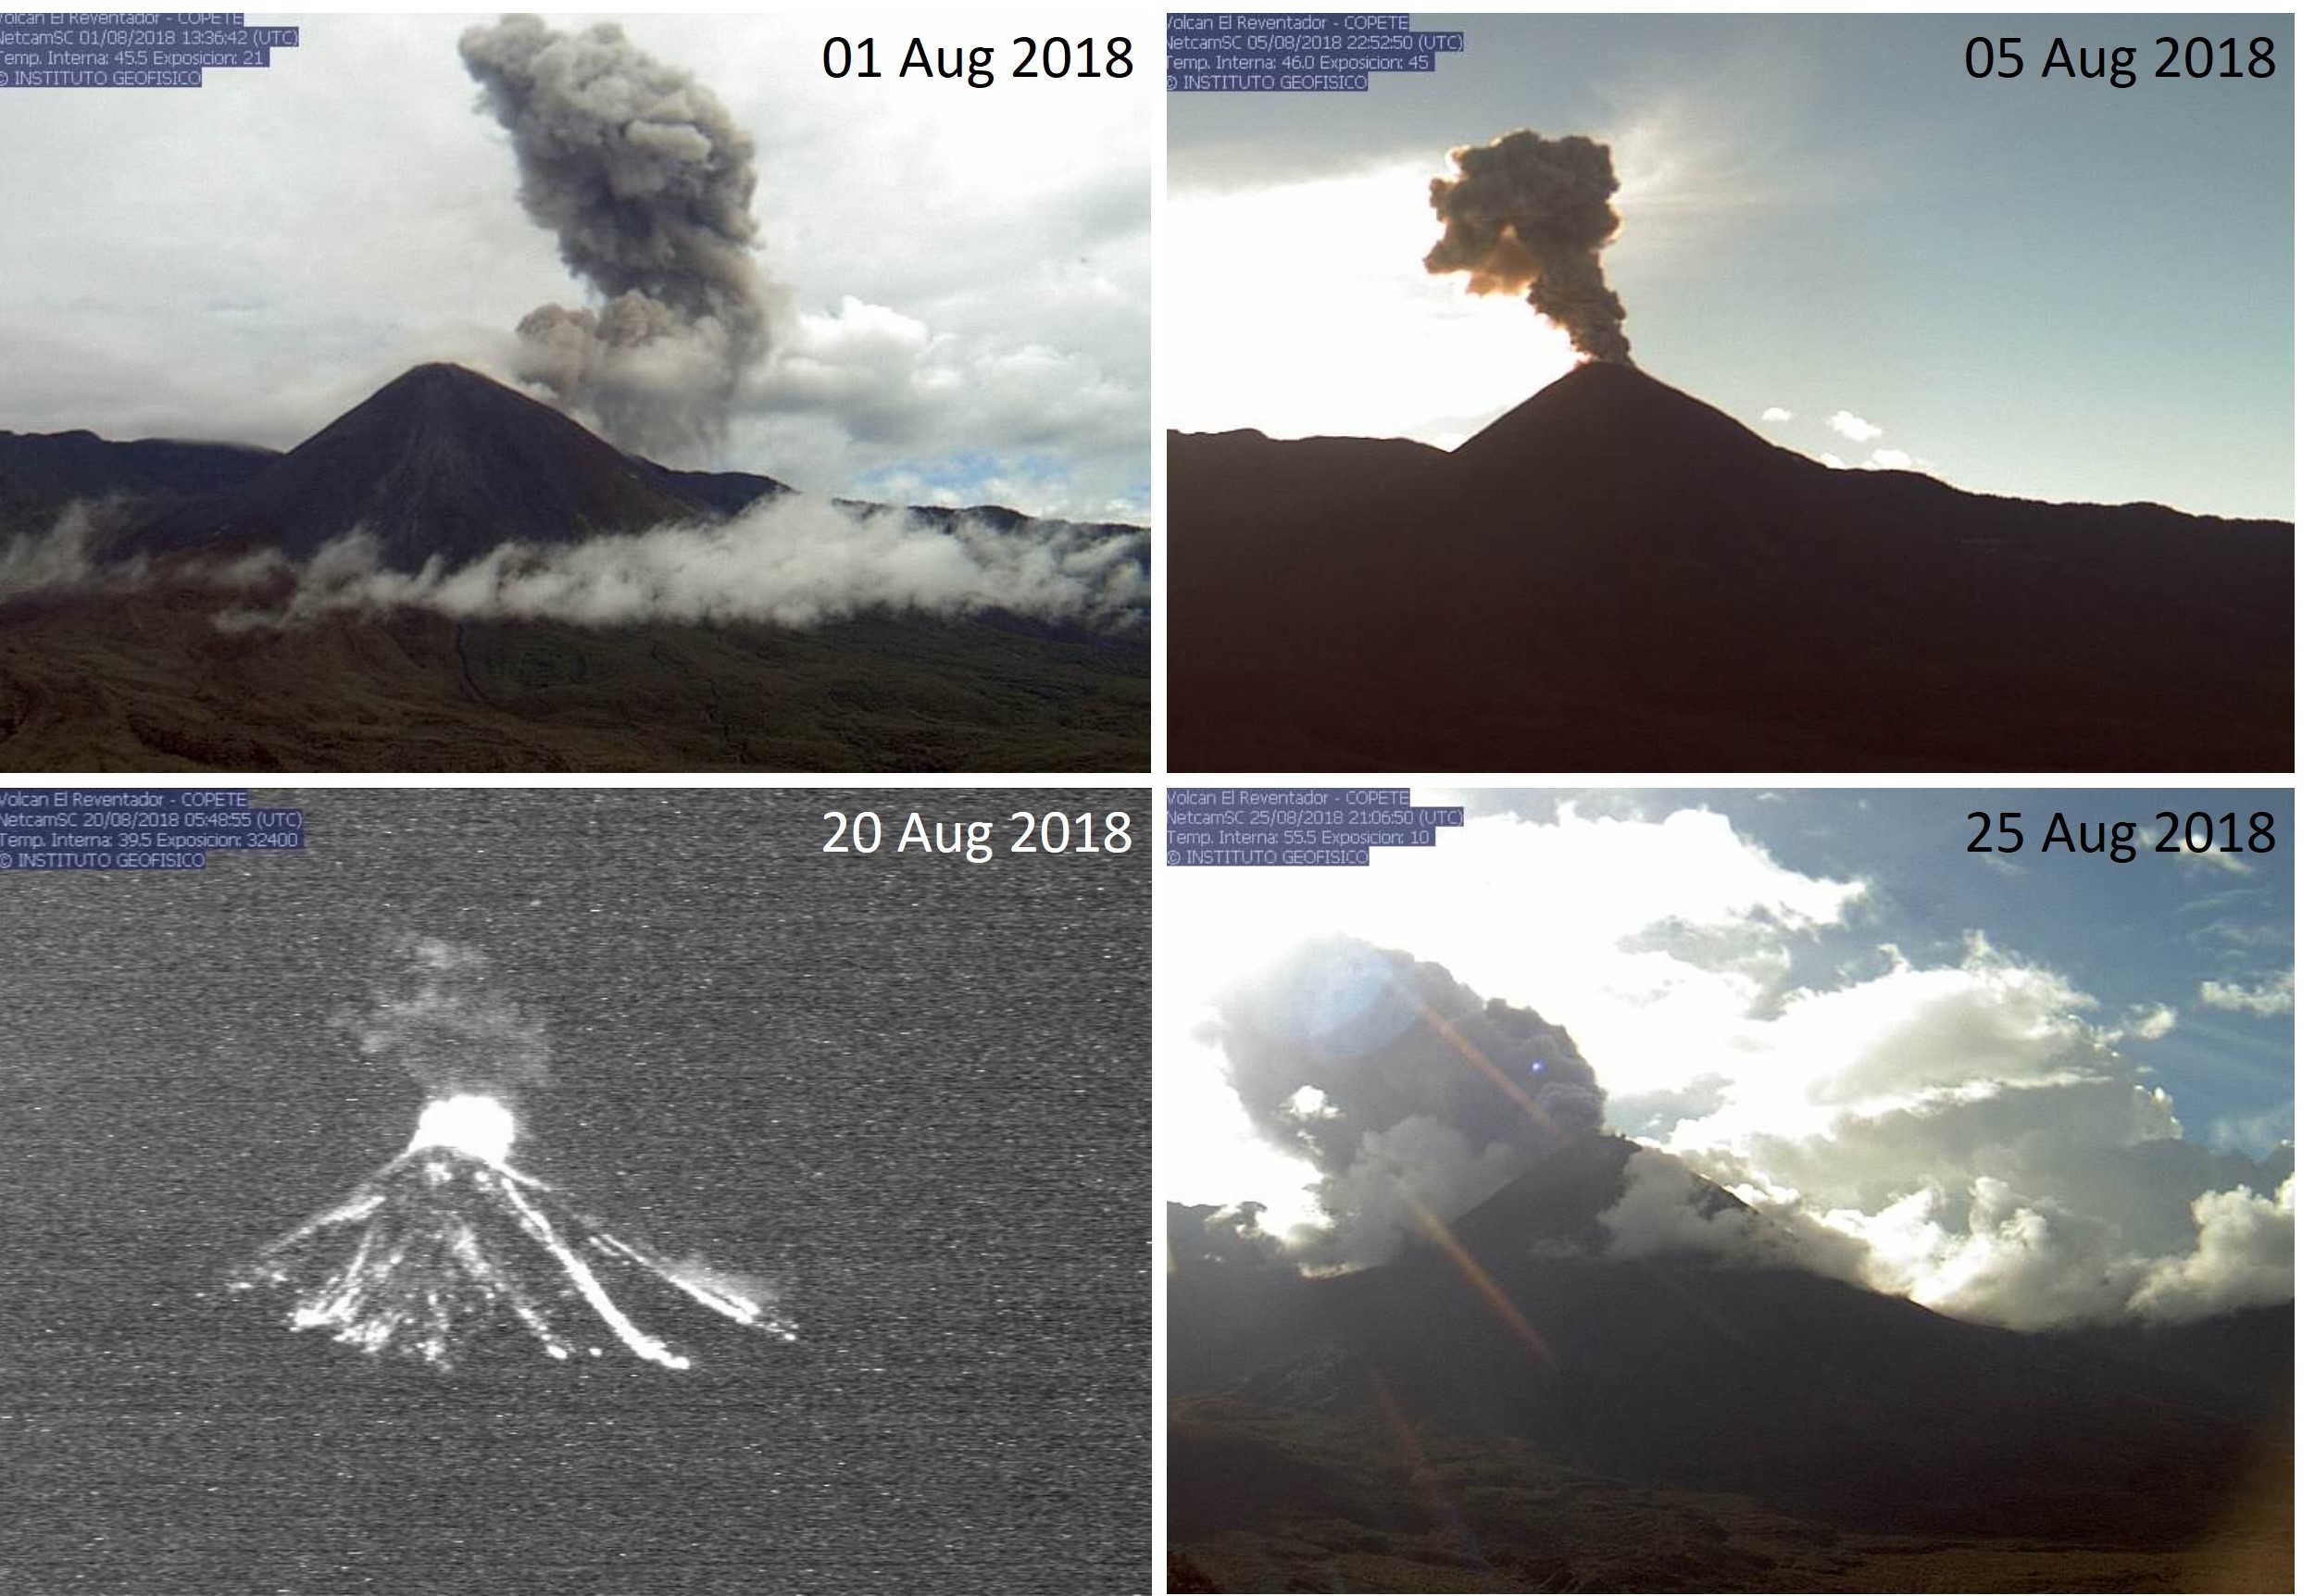
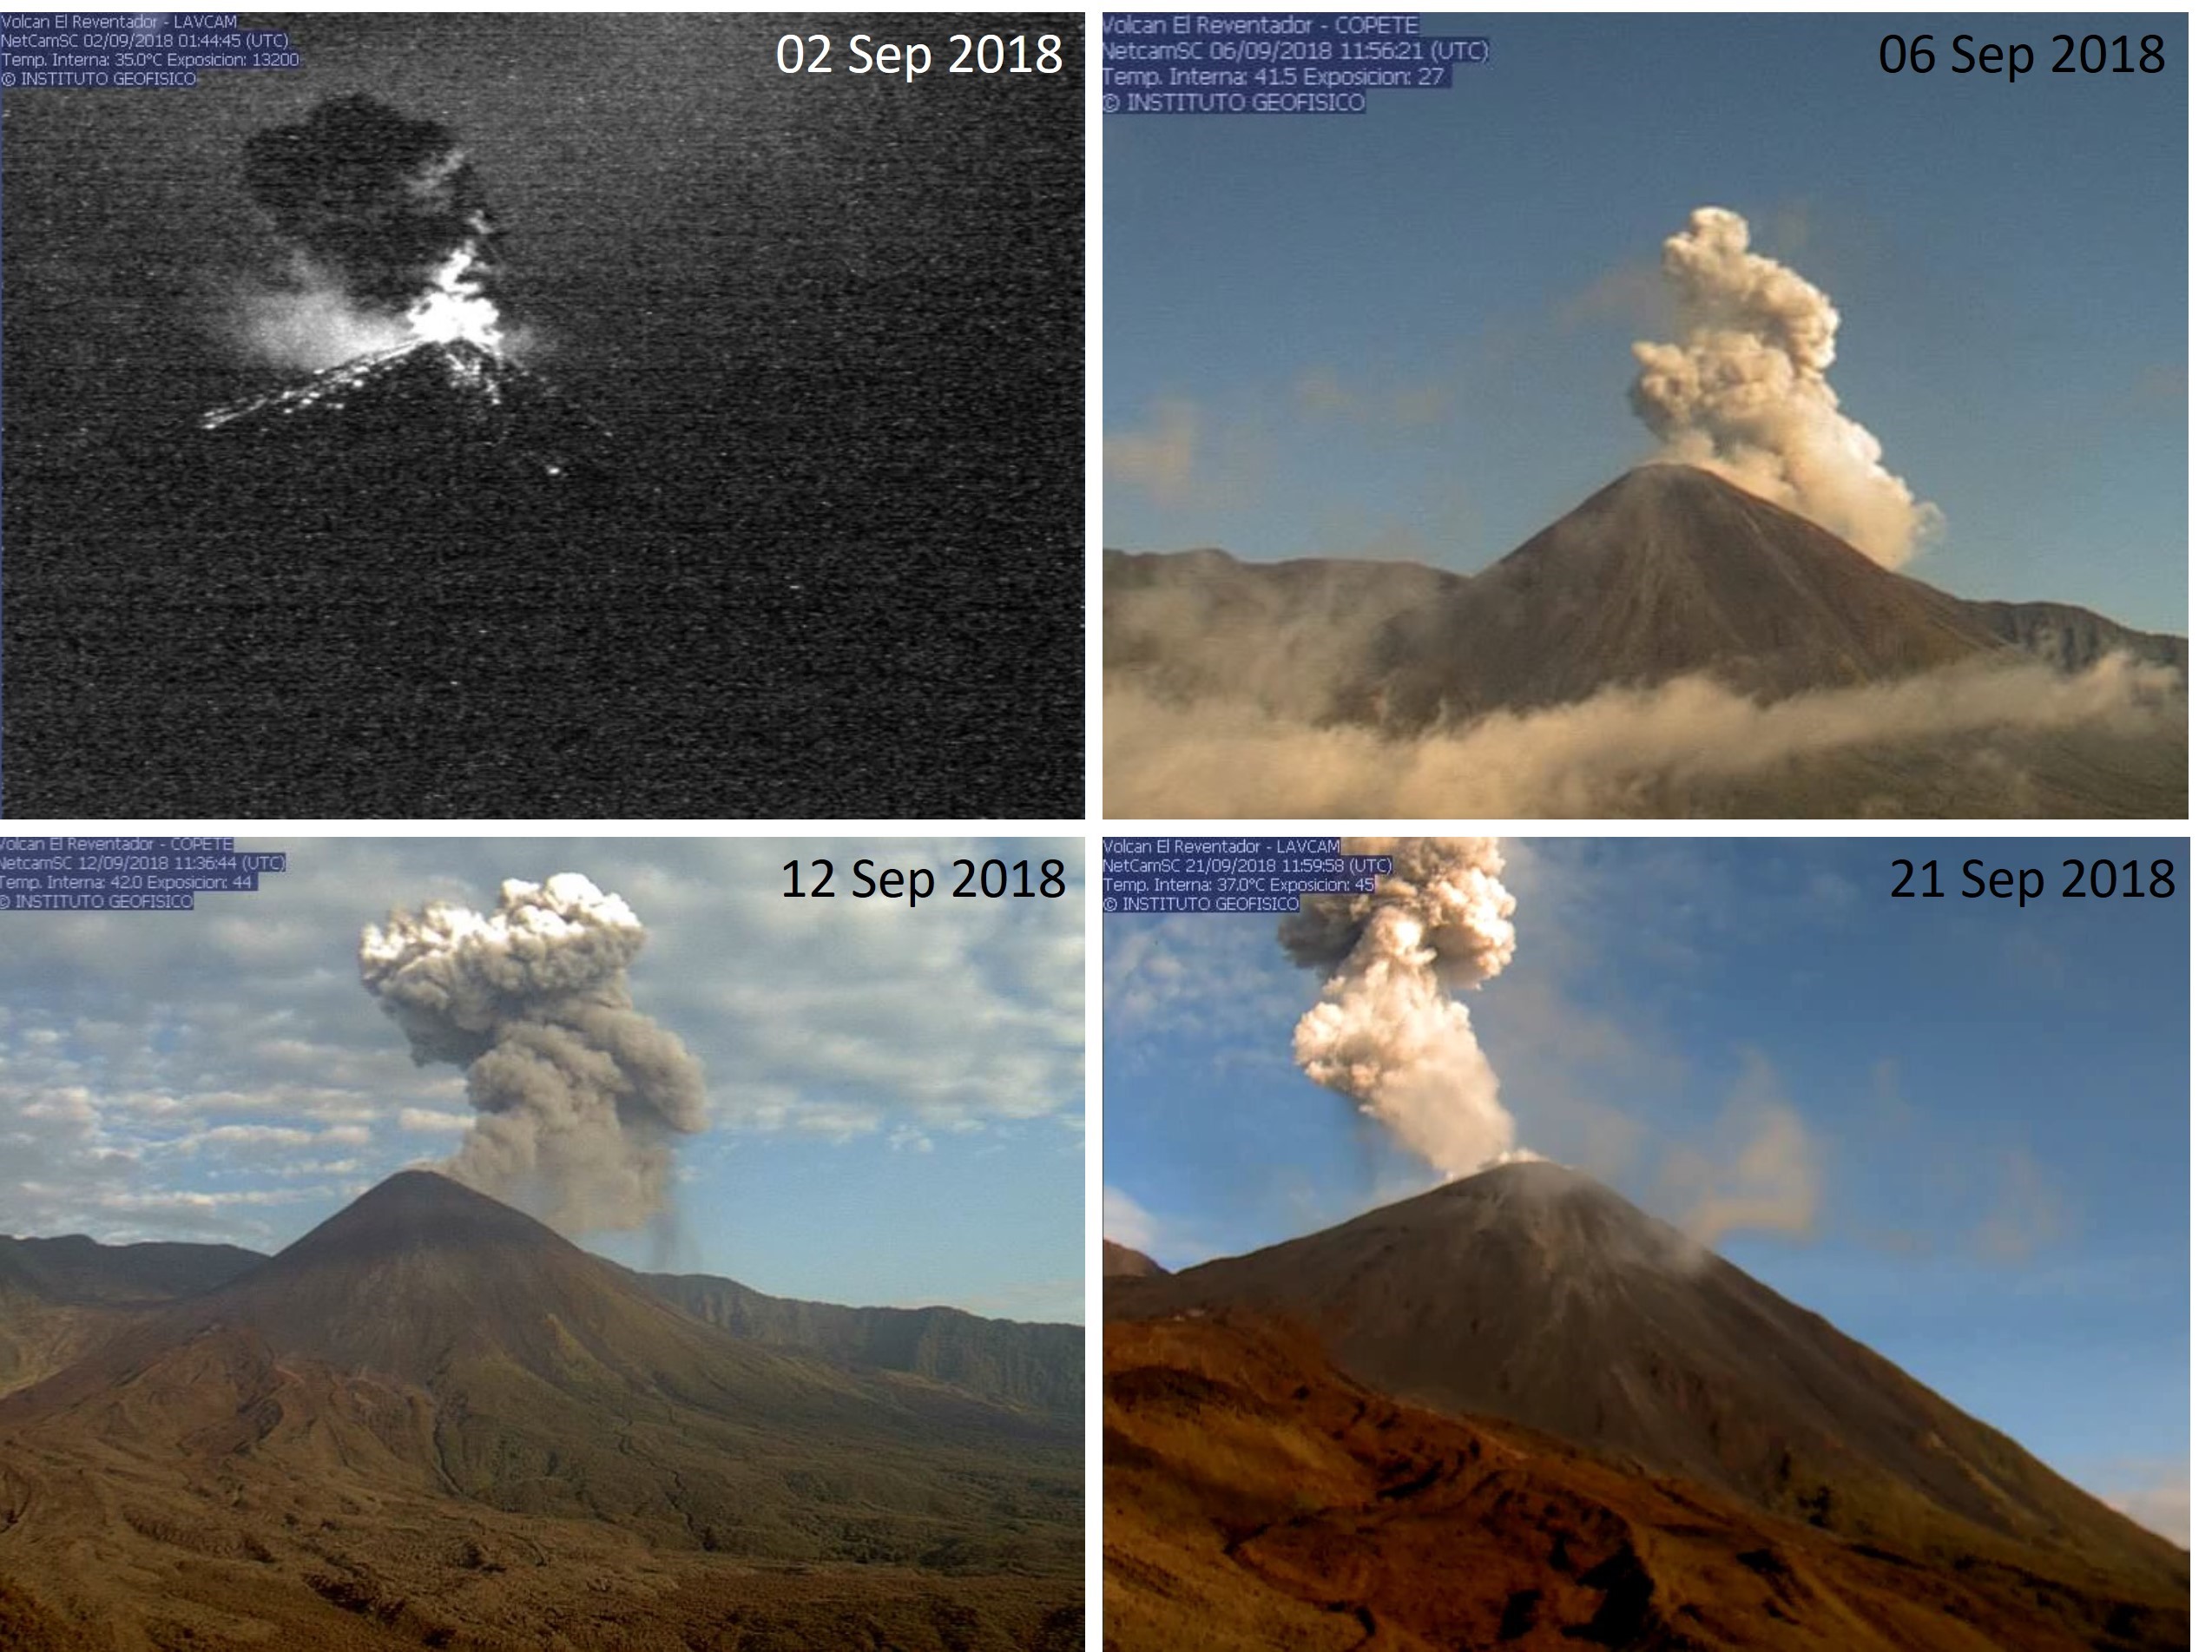
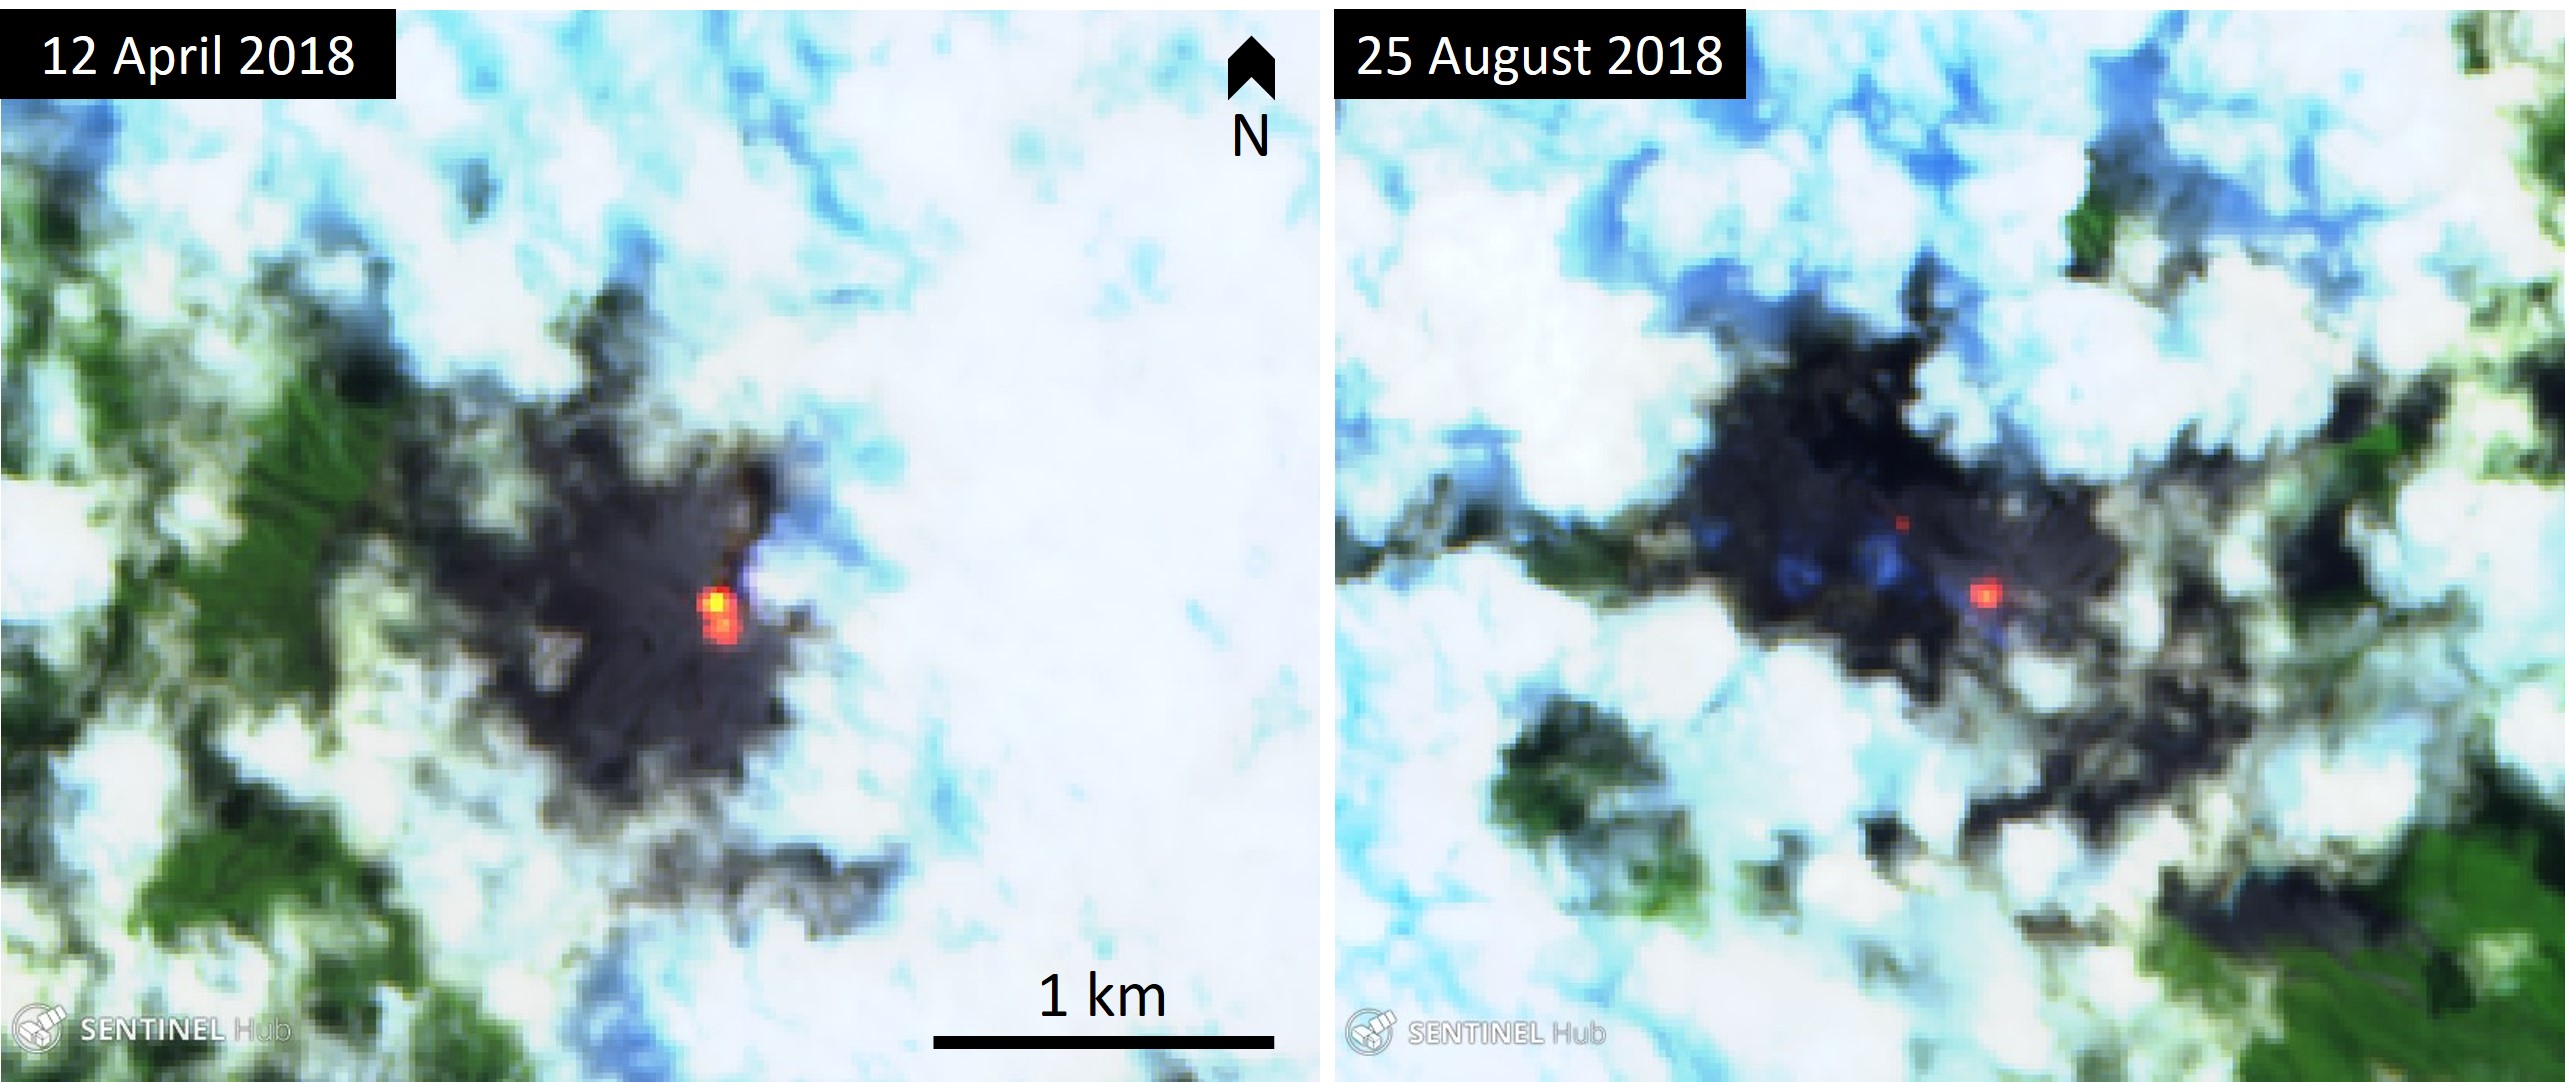
Similar activity continued through August and September, with ash and gas-and-steam plumes reaching over 1 km from the crater (figures 101 and 102). Four avalanches were noted in both August and September, with material reaching 1 km and 600 m, respectively. A Sentinel-2 thermal satellite image acquired on 25 August showed the new morphology of the crater after the April collapse, with two active vents at that time (figure 103).
Geological Summary. Volcán El Reventador is the most frequently active of a chain of Ecuadorian volcanoes in the Cordillera Real, well east of the principal volcanic axis. The forested, dominantly andesitic stratovolcano has 4-km-wide avalanche scarp open to the E formed by edifice collapse. A young, unvegetated, cone rises from the amphitheater floor to a height comparable to the rim. It has been the source of numerous lava flows as well as explosive eruptions visible from Quito, about 90 km ESE. Frequent lahars in this region of heavy rainfall have left extensive deposits on the scarp slope. The largest recorded eruption took place in 2002, producing a 17-km-high eruption column, pyroclastic flows that traveled up to 8 km, and lava flows from summit and flank vents.
Information Contacts: Instituto Geofísico (IG-EPN), Escuela Politécnica Nacional, Casilla 17-01-2759, Quito, Ecuador (URL: http://www.igepn.edu.ec ); Washington Volcanic Ash Advisory Center (VAAC), Satellite Analysis Branch (SAB), NOAA/NESDIS OSPO, NOAA Science Center Room 401, 5200 Auth Rd, Camp Springs, MD 20746, USA (URL: www.ospo.noaa.gov/Products/atmosphere/vaac, archive at: http://www.ssd.noaa.gov/VAAC/archive.html); MIROVA (Middle InfraRed Observation of Volcanic Activity), a collaborative project between the Universities of Turin and Florence (Italy) supported by the Centre for Volcanic Risk of the Italian Civil Protection Department (URL: http://www.mirovaweb.it/); Hawai'i Institute of Geophysics and Planetology (HIGP) - MODVOLC Thermal Alerts System, School of Ocean and Earth Science and Technology (SOEST), Univ. of Hawai'i, 2525 Correa Road, Honolulu, HI 96822, USA (URL: http://modis.higp.hawaii.edu/); Sentinel Hub Playground (URL: https://www.sentinel-hub.com/explore/sentinel-playground).