Report on Stromboli (Italy) — December 2018
Bulletin of the Global Volcanism Network, vol. 43, no. 12 (December 2018)
Managing Editor: Edward Venzke.
Edited by Janine B. Krippner.
Stromboli (Italy) Explosive activity produced ash, lapilli, and bombs, with occasional spattering during July-October 2018
Please cite this report as:
Global Volcanism Program, 2018. Report on Stromboli (Italy) (Krippner, J.B., and Venzke, E., eds.). Bulletin of the Global Volcanism Network, 43:12. Smithsonian Institution. https://doi.org/10.5479/si.GVP.BGVN201812-211040
Stromboli
Italy
38.789°N, 15.213°E; summit elev. 924 m
All times are local (unless otherwise noted)
Stromboli is a persistently-active volcano that currently has five active vents in the crater terrace area that sits above the steep slope of the Sciara del Fuoco. For several decades, activity has been focused at three main craters, the North crater (N area) and the Central and South craters (CS area), each with multiple frequently-active vents.
This report summarizes activity for July-October 2018 (table 4) and is based on reports by Istituto Nazionale di Geofisica e Vulcanologia (INGV) and satellite data. Intensities associated with explosions are based on the following heights of material ejected from the crater and are as follows. Very low is less than 40 m; low is 40-80 m; medium is 80-150 m; and high is greater than 150 m (figure 131). Overall, the intensity of all vents ranged from very low to medium, with variations in the eruption of ash and lapilli to bomb-sized material (less than 2 mm, 2-64 mm, and over 64 mm, respectively). The variations in activity of the five active vents during July-October is seen in Sentinel-2 thermal satellite data (figure 132).
Table 4. Activity at Stromboli during July-October 2018 summarized by vent areas: N Area (North) with vents N1 and N2; CS Area (central-south) with vents C, S1, and S2. Maximum reported heights for each month are given as meters above the crater. Data courtesy of INGV weekly reports.
| Month | N Area Activity | CS Area Activity |
| Jul 2018 | N1: Explosions ejected lapilli and bombs with some ash up to heights of 200 m. N2: Explosions ejected ash, lapilli, and bombs up to 200 m. The average explosion frequency for the N-Area was 1-19 per hour. | C: Continuous degassing with intense Spattering on the 26th. S1: Gas jets with some ash, lapilli, blocks up to 80 m. S2: Explosions with ash, lapilli, blocks up to 150 m. The average explosion frequency for the CS-Area was 1-11 per hour. |
| Aug 2018 | N1: Explosions ejected lapilli and bombs with some ash up to 140 m. N2: Explosions ejected lapilli and bombs with occasional spattering up to 140 m. The average explosion frequency for the N-Area was 2-20 per hour. | C: Continuous degassing at two points, intense spattering on the 27th. Some explosions ejected material up to 120 m. S1: Explosive activity and gas jets, incandescent material up to 150 m. S2: Explosive activity ejected material up to 80 m. Major explosion occurred at the CS area on the 18th.The average explosion frequency for the CS-Area was 1-15 per hour. |
| Sep 2018 | N1: Explosions ejected lapilli and bombs with some ash up to 140 m. N2: Explosions ejected mainly ash with some lapilli and bombs up to 150 m. The average explosion frequency for the N-Area was 2-12 per hour. | C: Two emission points with continuous degassing, interrupted by explosions and spattering. S1: Jets of incandescent material up to 120 m. S2: Explosive activity with some ash and lapilli up to 120 m, two active vents from the 10th. The average explosion frequency for the CS-Area was 4-20 per hour. |
| Oct 2018 | N1: Explosions ejected lapilli and bombs with some ash up to 150 m. N2: Explosions ejected mostly ash with some lapilli and bombs up to 150 m. The average explosion frequency for the N-Area was 1-13 per hour. | C: Two emission points with continuous degassing interrupted by occasional spattering and explosions. S1: Jets of incandescent material up to 120 m. S2: Variable explosive activity ejecting material up to.120 m. The average explosion frequency for the CS-Area was 6-20 per hour. |
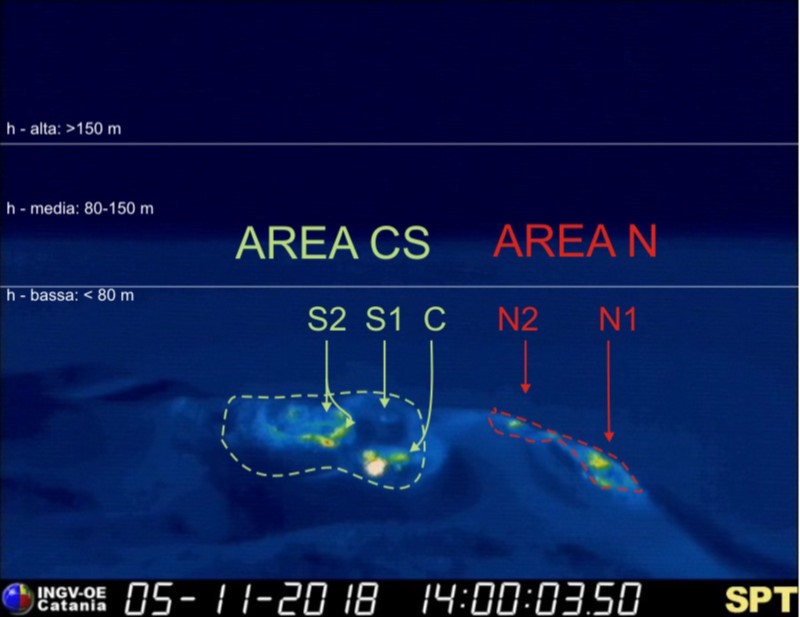 |
Figure 131. A thermal image of the active craters of Stromboli showing the Central-South crater (Area CS) and northern crater (Area N), with the active vents S1, S1, C, N1, N2. The white horizontal lines show the heights attributed to explosion intensity: low (bassa), medium (media), and alta (high). Image taken on 29 October 2018, courtesy of INGV (Report No. 44/2018, released on 30 October 2018). |
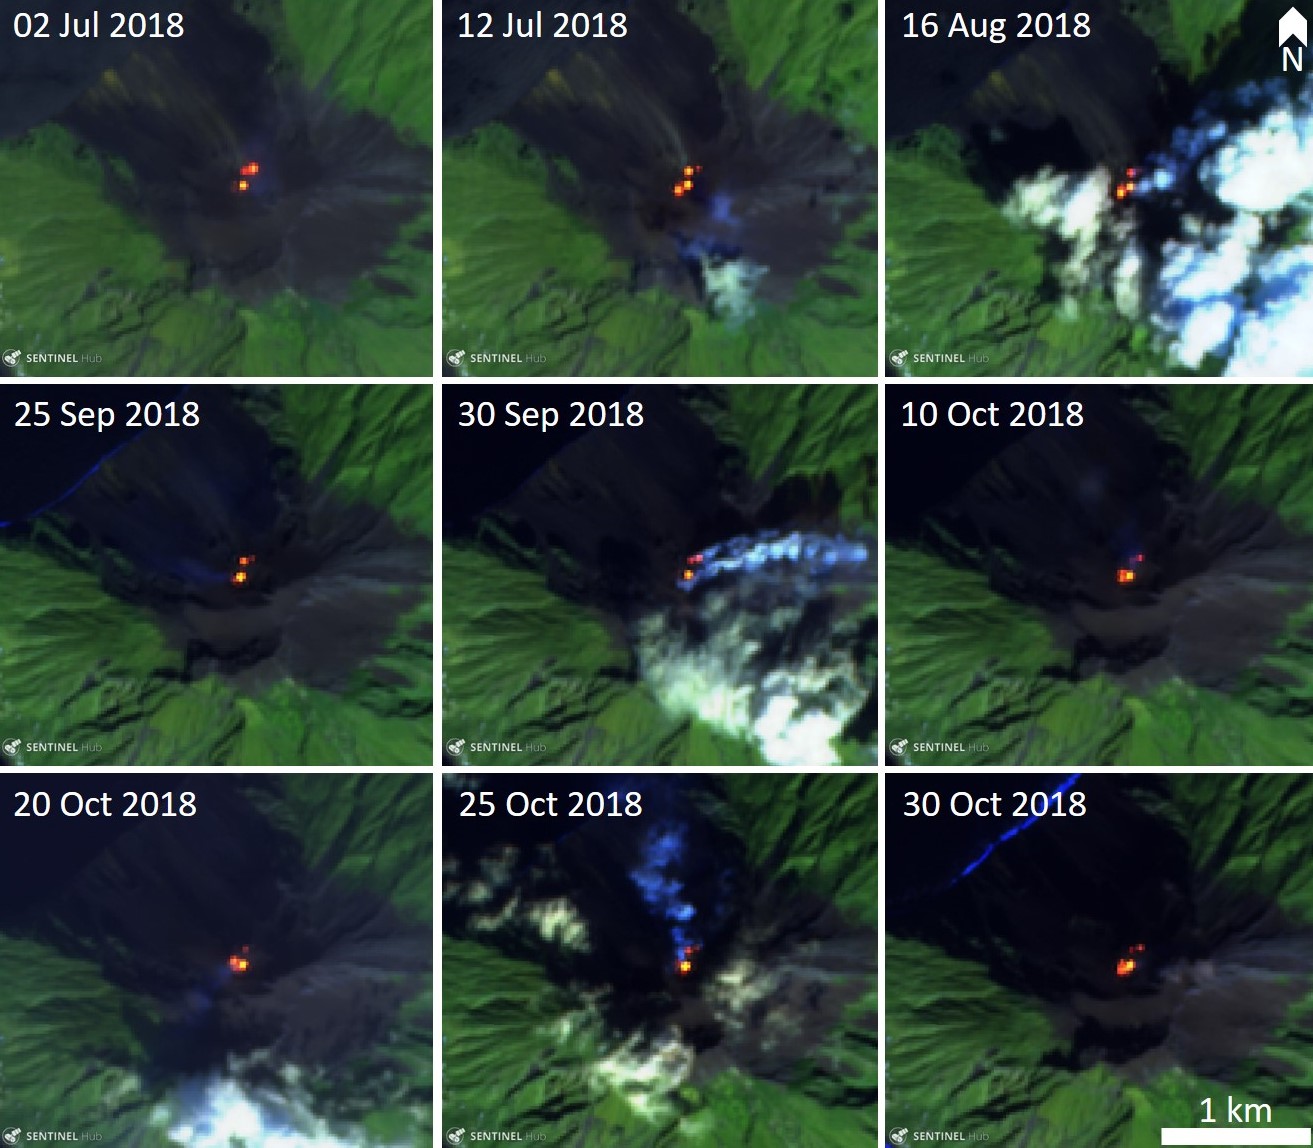 |
Figure 132. Infrared Sentinel-2 satellite images showing thermal variations at vents on Stromboli during July-October 2018. The active vents are shown in bright yellow-orange and gas plumes appear as light blue-white areas emanating from the vents. Courtesy of Sentinel Hub Playground. |
During July Strombolian activity continued with explosions of low to medium-low intensity in the N Area; variable explosions ejected mainly lapilli and bombs along with some ash at the N1 vent, and mainly ash with lapilli and bombs at the N2 vent. Explosive activity was absent or sporadic at the N2 vent during 4-5 July. There was a rapid increase in explosion frequency at the N1 vent on the 14th, and on the 16th lapilli and bombs were ejected. During 16-29 July explosive activity in the N Area was focused at the N2 vent. The average frequency of explosions in the N area ranged from 1-19 per hour. Explosion intensity in the CS Area ranged from low to medium at both the S1 and S2 vents. The C vent produced continuous degassing that was interrupted by intense spattering on the 26th. Activity at the S1 vent was characterized as jets with some ash, lapilli, and blocks, and explosions with ash, lapilli, and blocks occurred at the S2 vent. The average frequency of explosions in the CS area ranged from 1 to 11 per hour during July. The total number of explosions at Stromboli increased in mid-July and remained elevated compared to previous months through the end of October (figure 133).
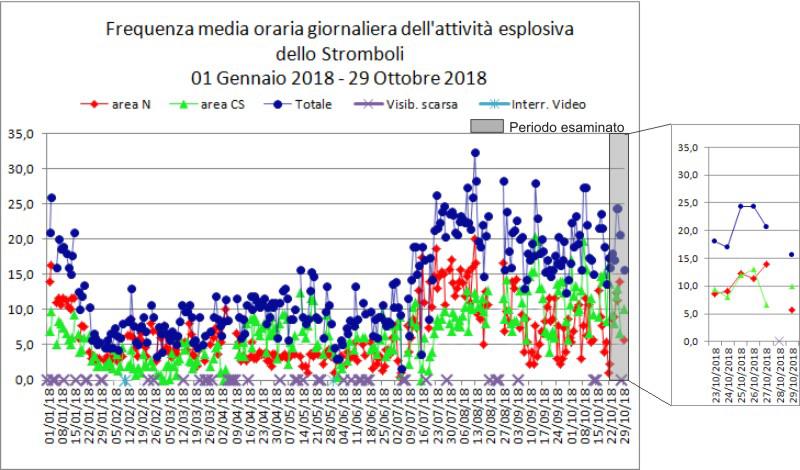 |
Figure 133. Graph showing the average number of explosions at Stromboli per day from 1 January to 20 October 2018. The red data are for the N crater area, green are for the CS crater area, and dark blue are the total explosions per day for all active vents. There was a period from mid-January to mid-July when there was a reduction in the frequency of explosions, which then increased to around a total of 15-30 per day. Courtesy of INGV (Report No. 44/2018 released on 30 October 2018). |
Similar activity continued through August with the exception of a strong explosion at the C vent that lasted approximately one minute at 1508 on 18 August (figure 134). The explosion ejected an ash plume that rapidly dissipated. Coarse pyroclastic material fell on the crater terrace area and the upper part of the Sciara del Fuoco, and rolled down to the ocean. Occasional intense spattering at the C vent was also observed on the 27th, interrupting the continuous degassing from two vents. Medium to low, and occasionally high-intensity gas jets that incorporated incandescent material were frequent at the S1 vent through August. Low- to medium-intensity explosive activity occurred at the S2 event throughout the month. Explosions averaged 1-11 per hour for the entire CS area during August. The N area produced variable explosions that ejected lapilli and bombs with some ash at the N1 vent. During 8-12 August most of the activity in the N area continued to be focused at the N2 vent, and during this time it produced intense spattering activity. During the rest of the month activity at the N2 vent was characterized by variable explosive activity that produced lapilli and bombs with occasional spattering. The average frequency of explosions for the month was 2-20 per hour.
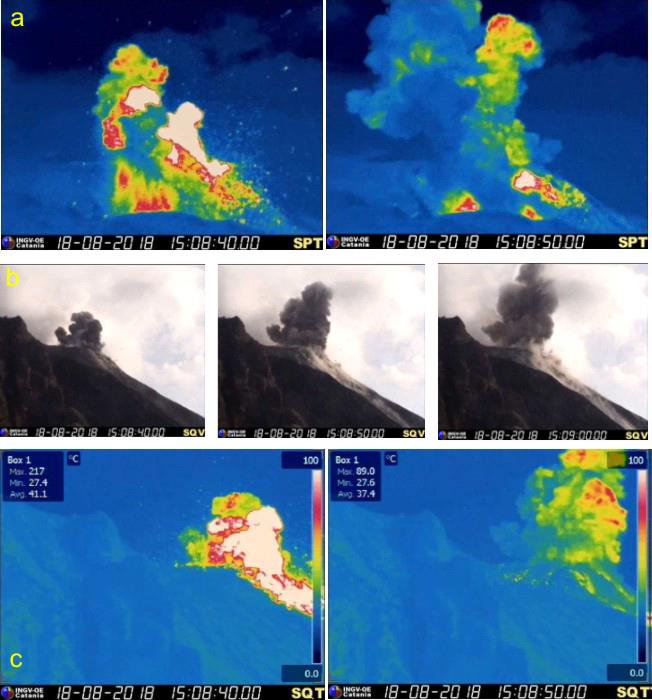 |
Figure 134. The major explosion at the Stromboli C vent on 18 August 2018 as seen in thermal and photograph images. The brief (less than one minute) explosion produced an ash plume that deposited material around the vent and on the Sciara del Fuoco. Courtesy of INGV (Report No. 34/2018 released on 21 August 2018). |
The typical activity persisted through September with explosions producing ash, lapilli, and blocks (figures 135 and 136), gas jets with incandescent material (figures 137 and 138), and degassing. Over the month there was an average of 2-12 explosive events per hour at the N area, and an average of 4-20 events per hour at the CS area. Variable explosions that ejected lapilli and bombs with some ash characterized activity at the N2 vent, and mainly ash with some lapilli and bombs were typically ejected at the N1 vent. Continuous emissions originated from two points within the C vent and was occasionally interrupted by explosions and spattering. Jets of gas and incandescent material continued at the S1 vent and explosive activity with some ash and lapilli occurred at the S2 vent. The S2 vent had two active points from the 10 September onwards.
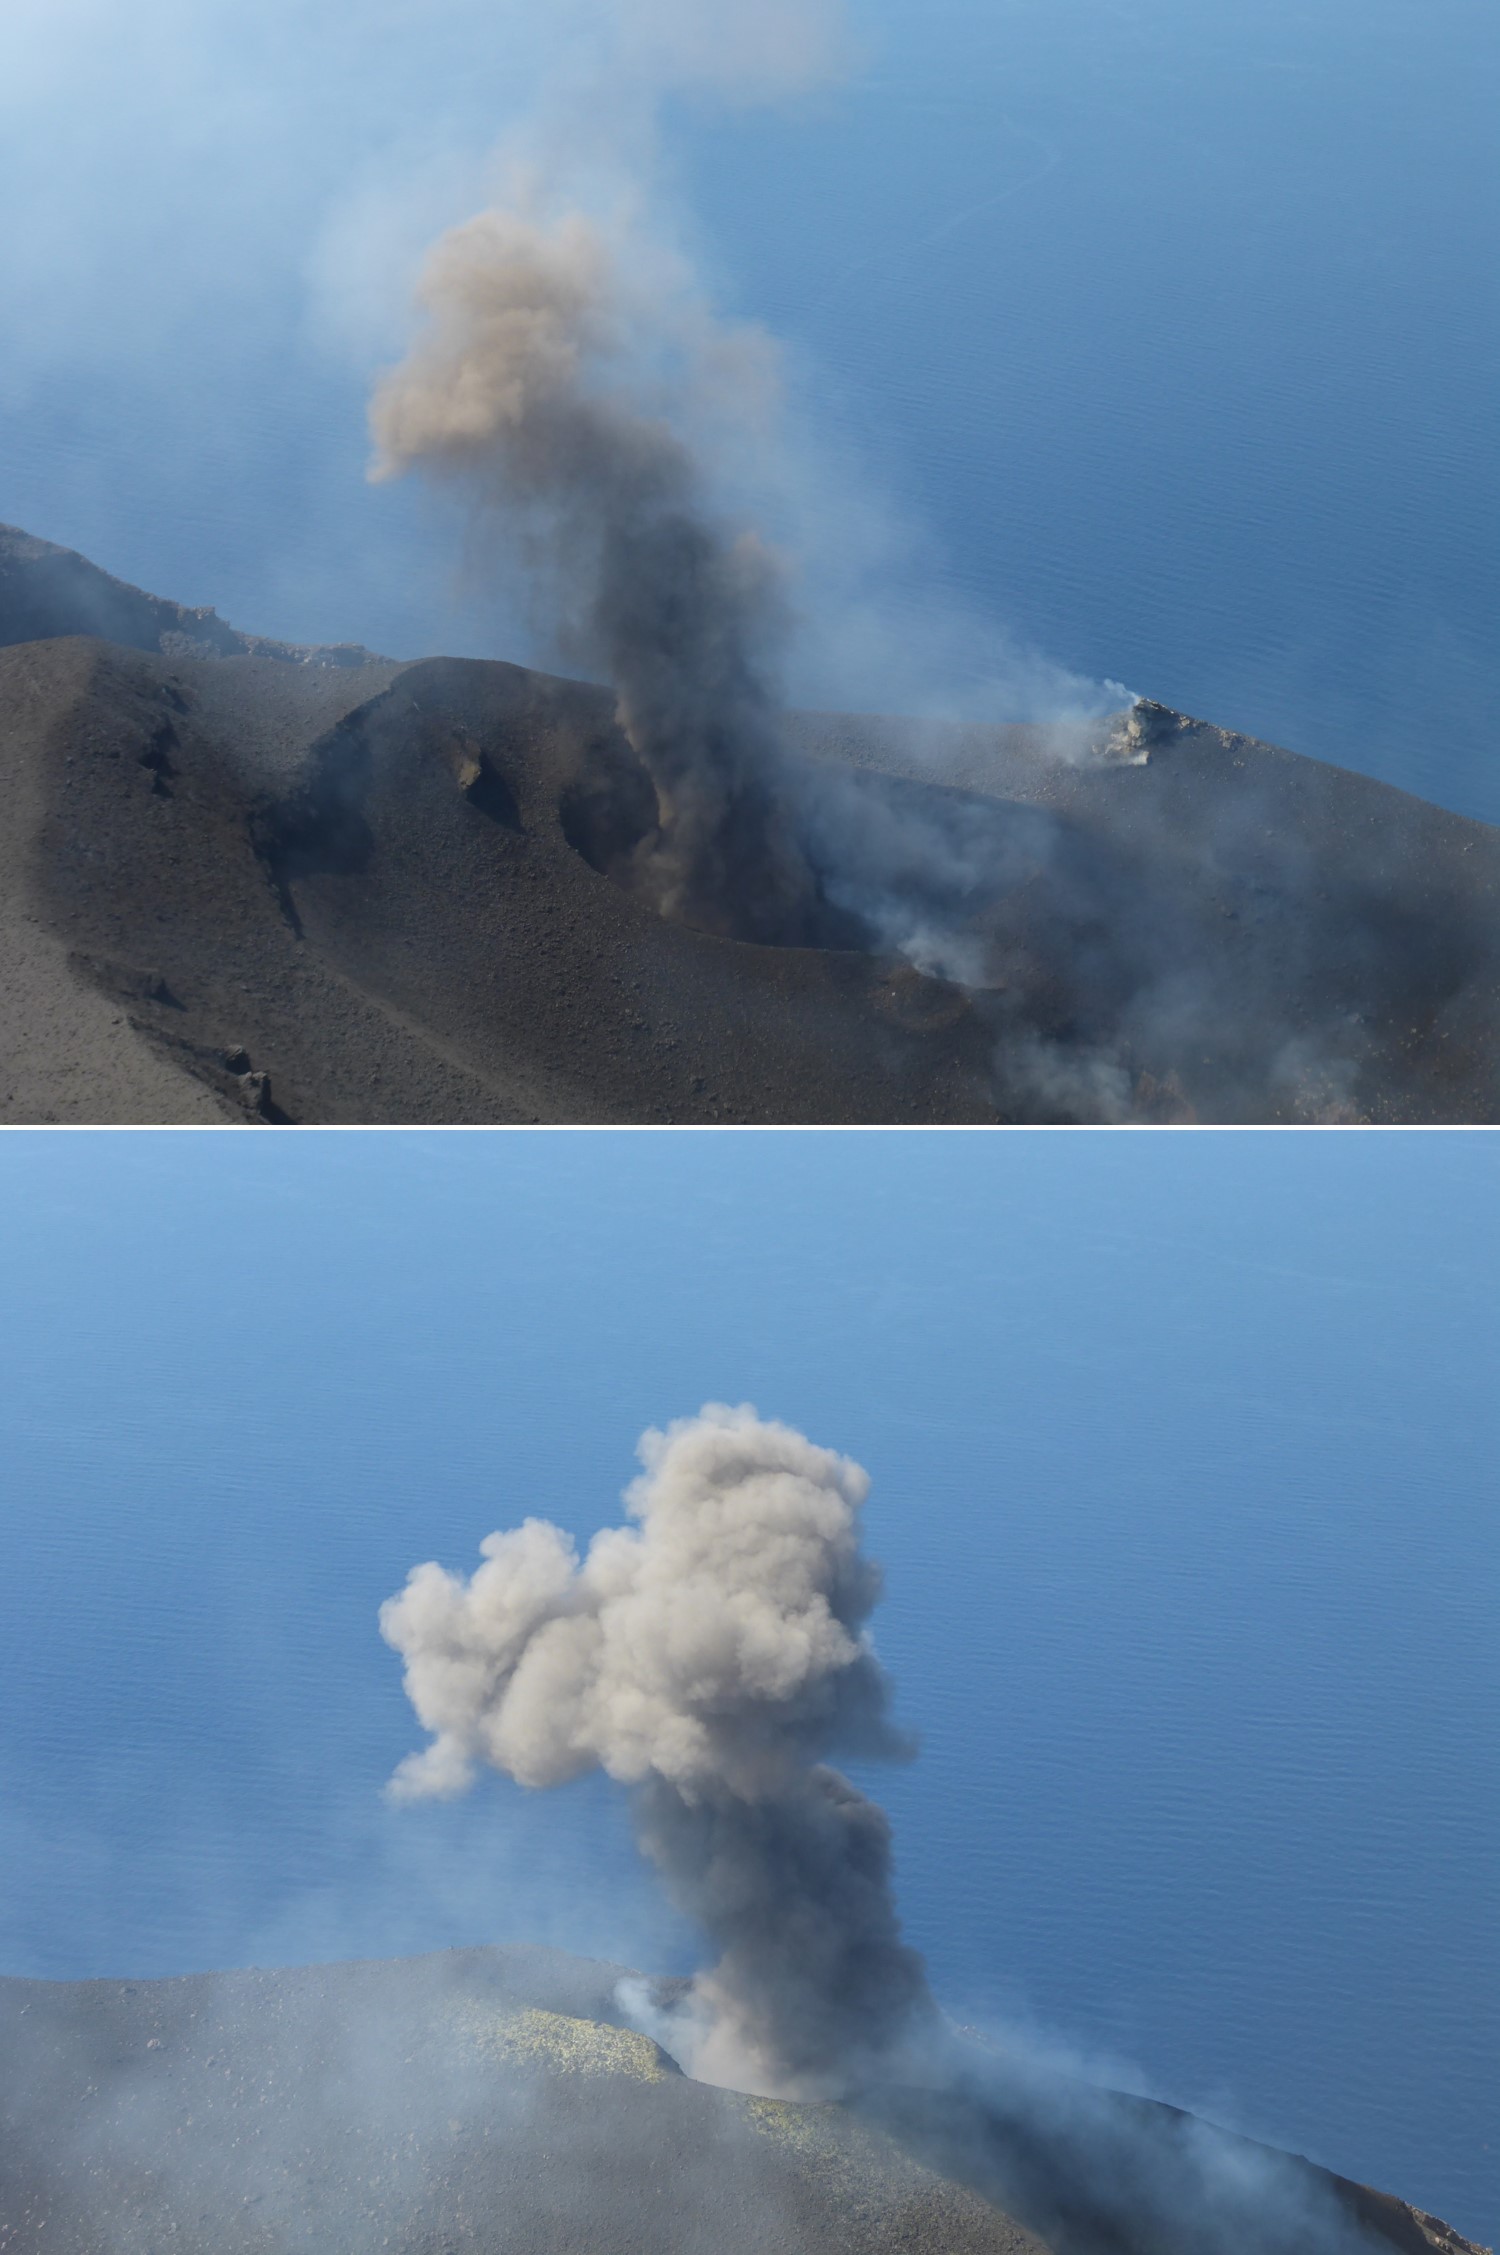 |
Figure 135. Ash plumes and degassing on 10 September. Courtesy of Benjamin Simons, The University of Auckland. |
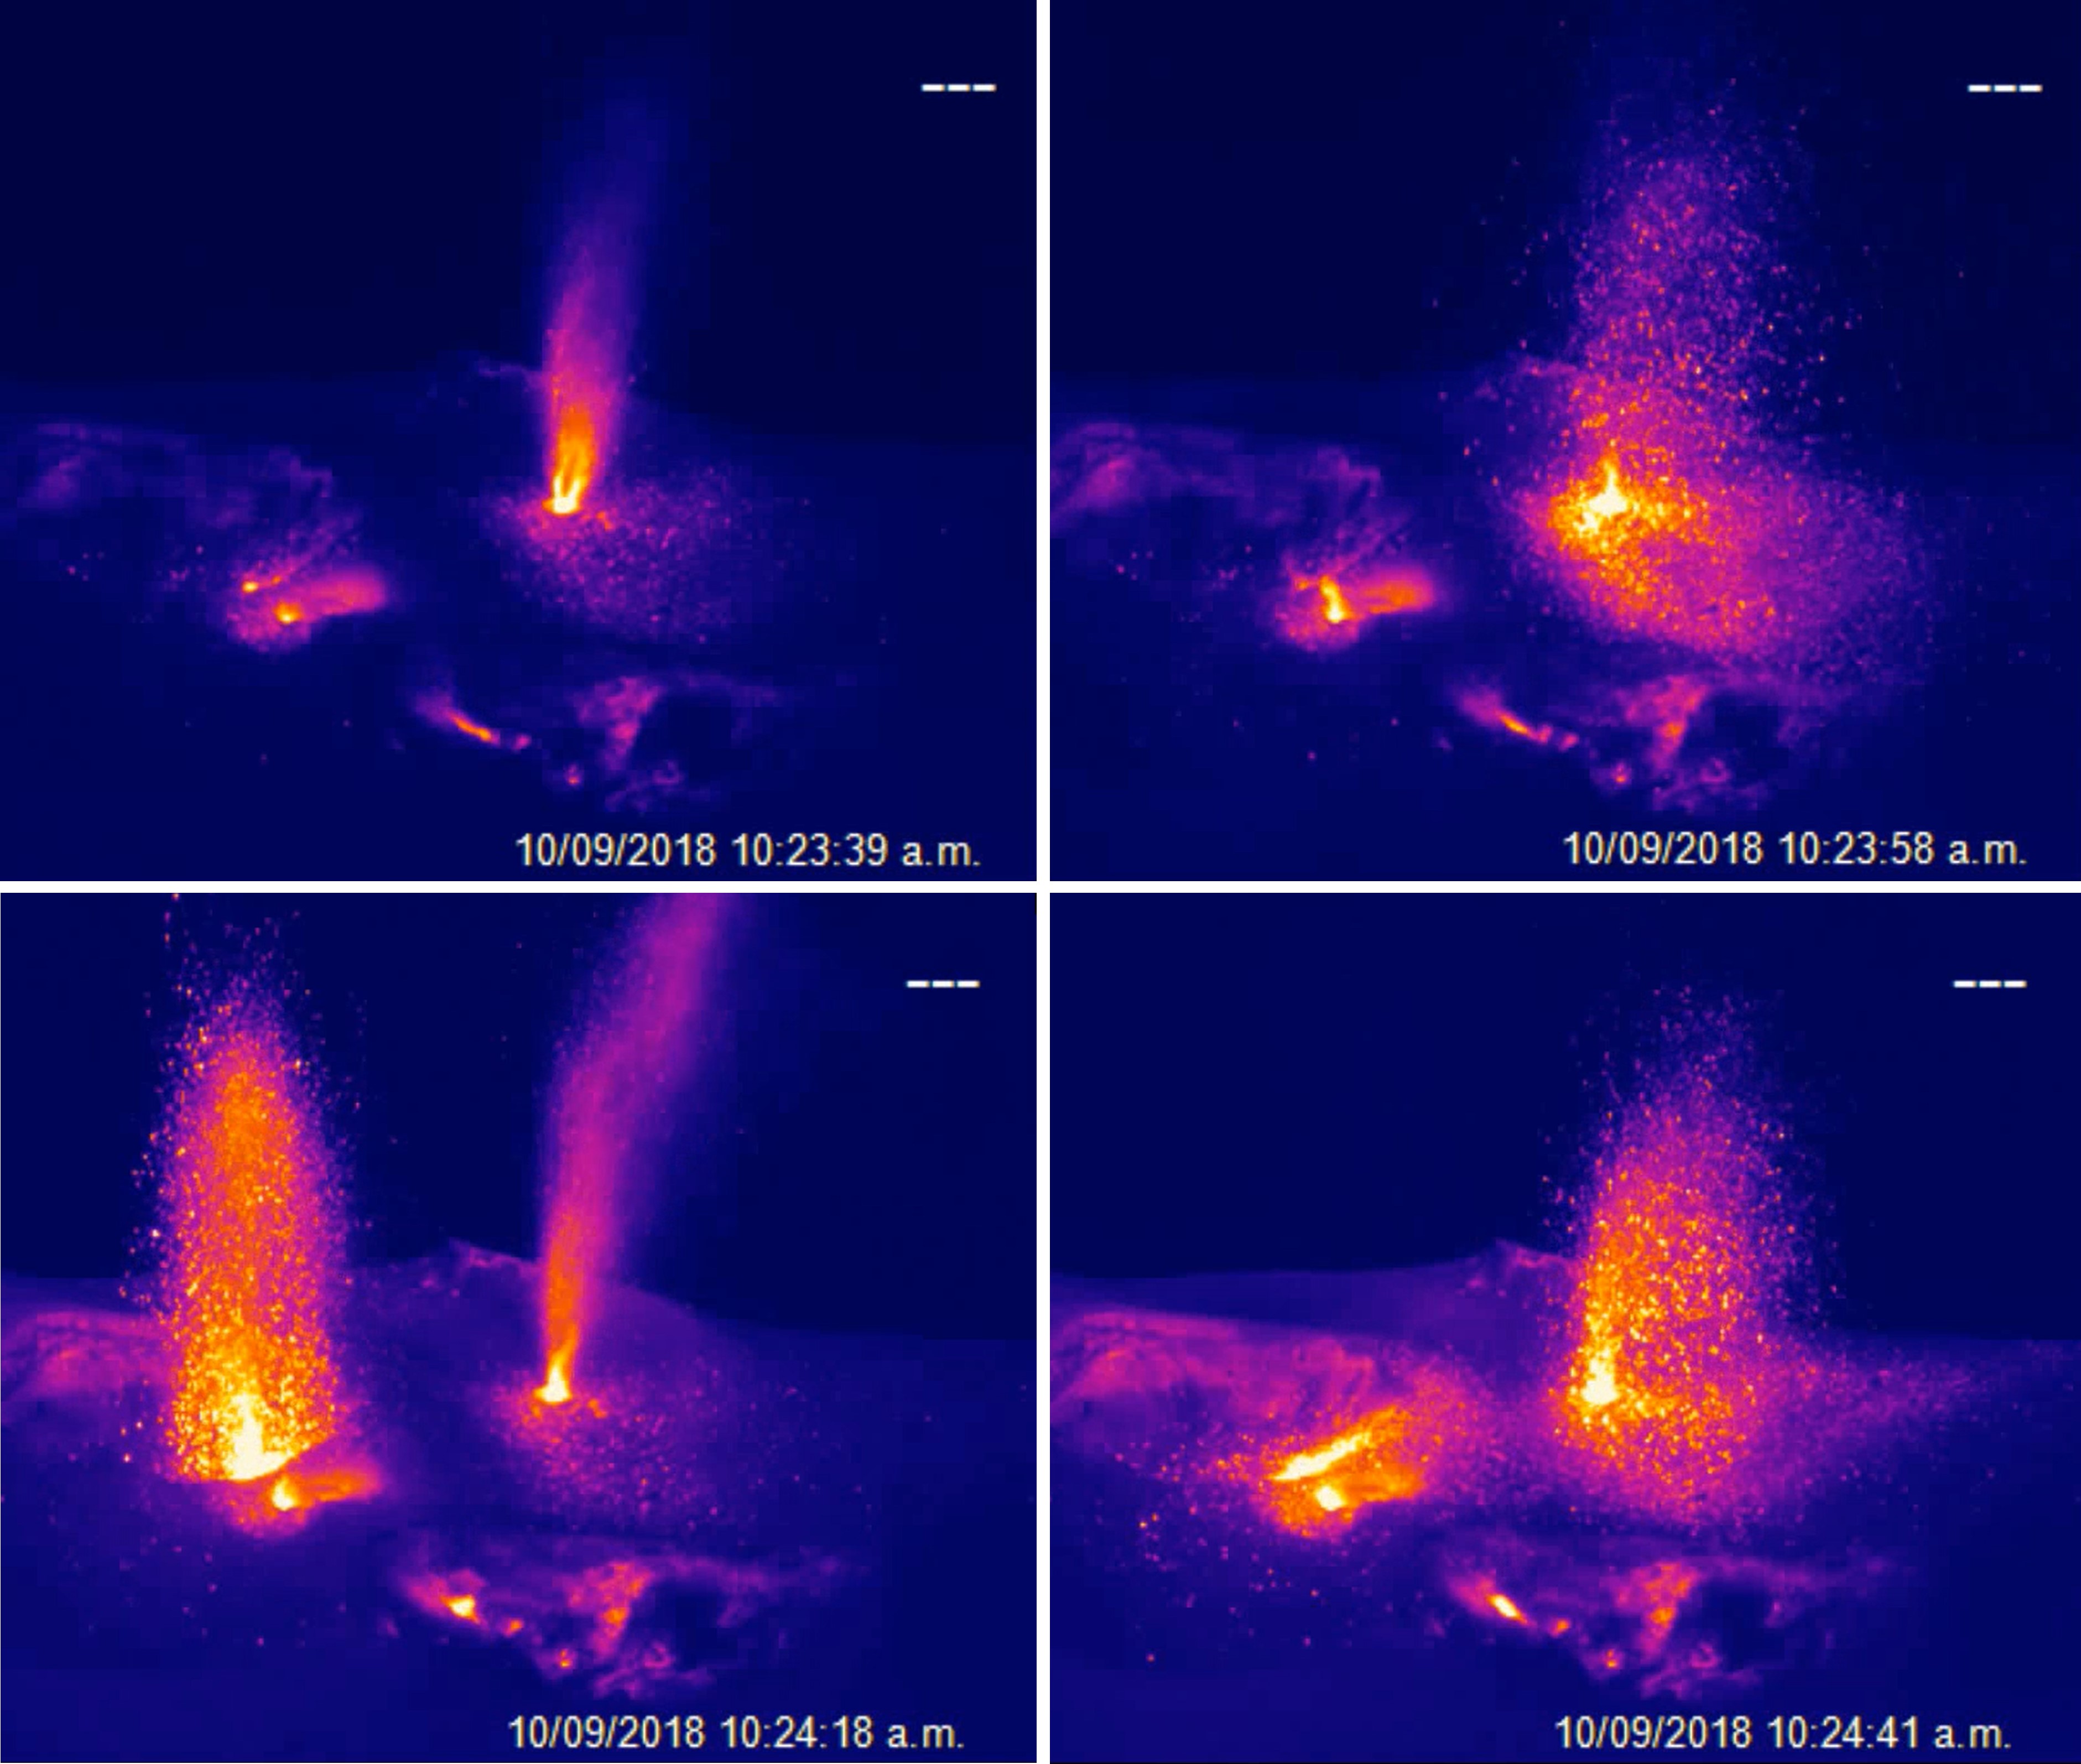 |
Figure 136. Thermal infrared video screenshots showing multiple active vents in the Stromboli central-south crater area on 10 September 2018. Vents are actively degassing and explosions eject hot lapilli and blocks at two craters. Courtesy of Benjamin Simons, The University of Auckland. |
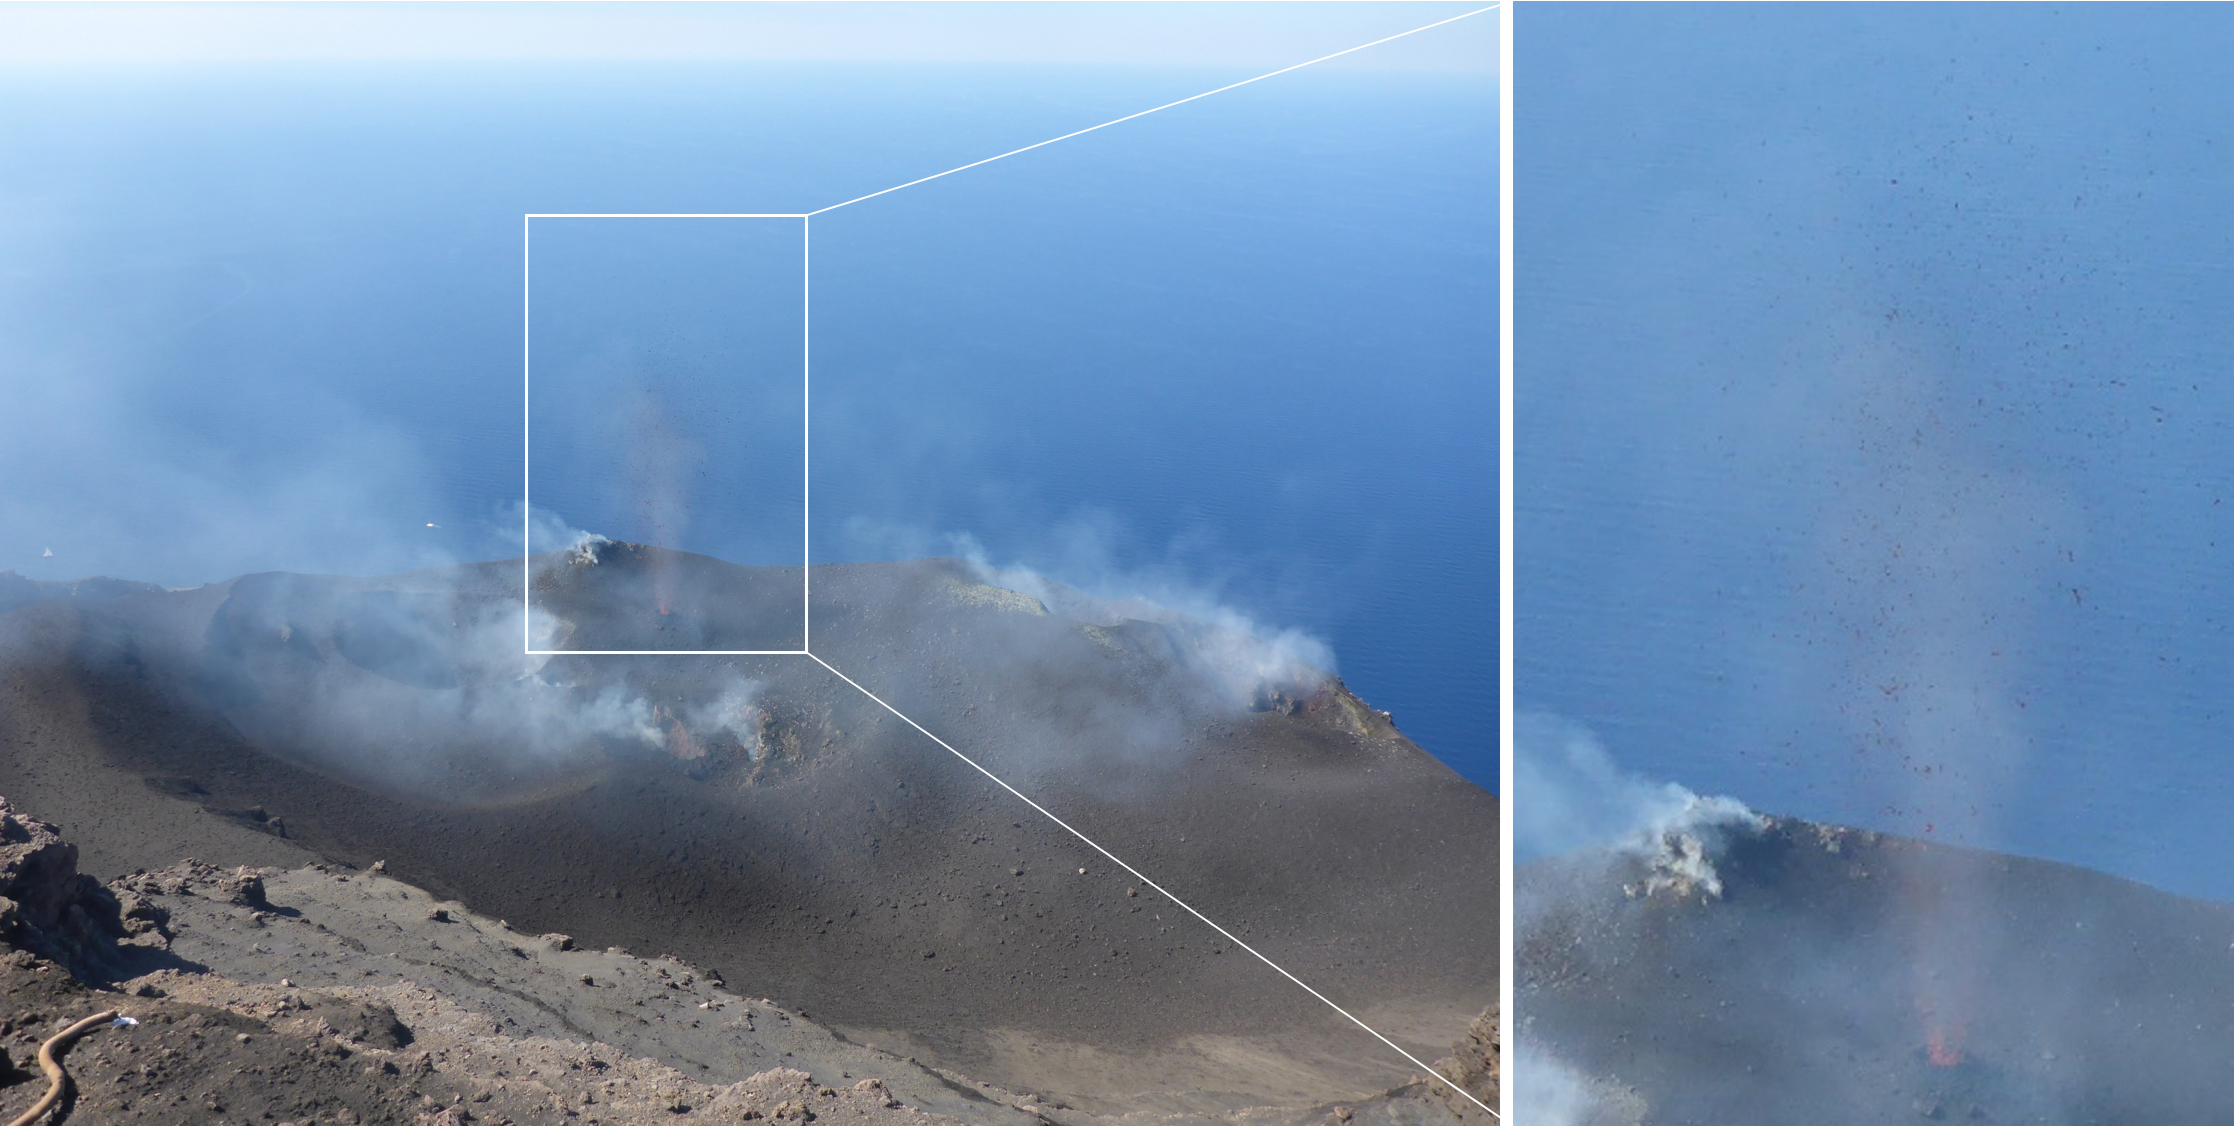 |
Figure 137. A gas jet with incandescent lapilli and bombs from the Stromboli central-south crater area on 10 September 2018. White gas plumes are visible emanating from other vents in the central-south and north craters. Courtesy of Benjamin Simons, The University of Auckland. |
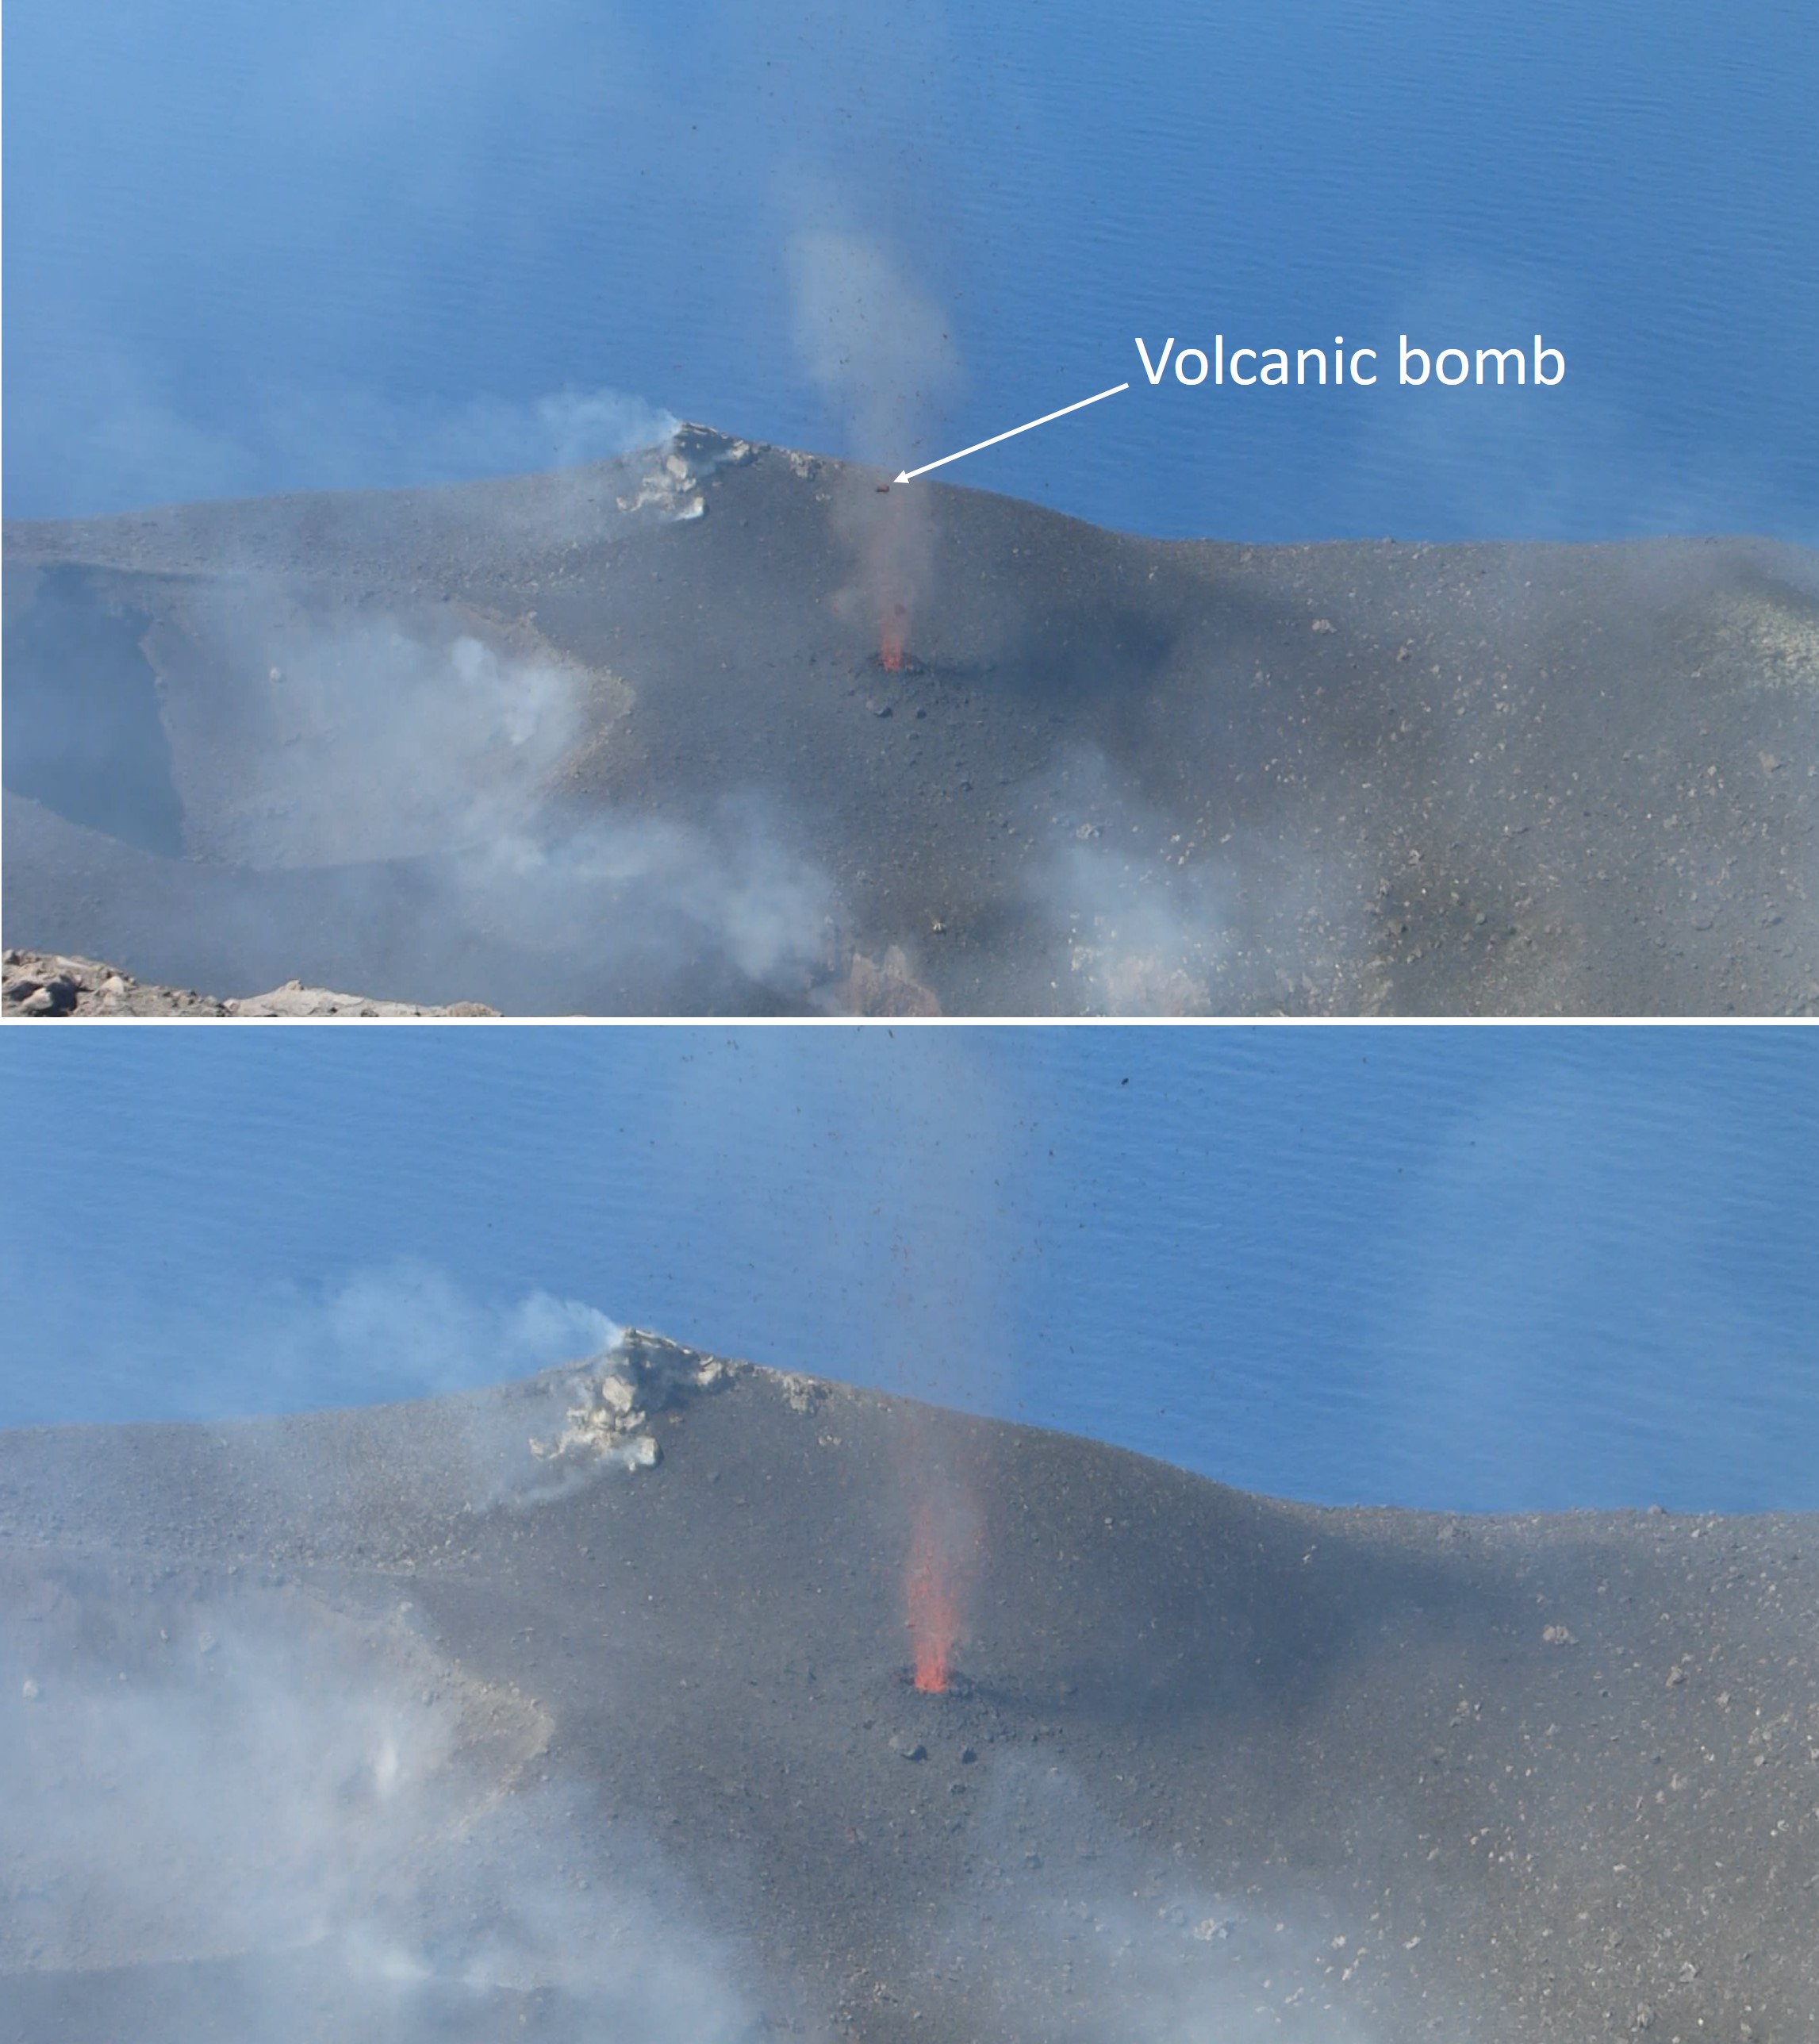 |
Figure 138. Screenshots of a video showing a gas jet with incandescent lapilli, bombs, and ash from the Stromboli Central-South crater area on 10 September 2018. A large bomb can be seen ejecting from the vent in the top photo. White plumes are a result of degassing of the surrounding vents. Courtesy of Benjamin Simons, The University of Auckland. |
During October variable explosions continued to produce low-to medium-intensity explosions that ejected lapilli and bombs, and sometimes ash, at the N1 vent, and very low- to low-intensity explosions that produced mostly ash with some lapilli and bombs at the N2 vent. Explosions averaged 1-13 events per hour through the month. The CS area produced a higher average of 6-20 explosions per hour for October. Sustained degassing continued at two points in the C vent. Low- to medium-low-intensity jets on incandescent material occurred at the S1 vent, and the same intensity of explosive activity was reported at the S2 vent.
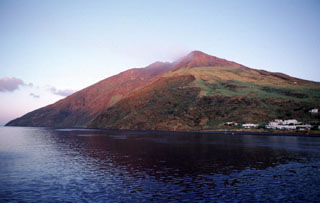
Geological Summary. Spectacular incandescent nighttime explosions at Stromboli have long attracted visitors to the "Lighthouse of the Mediterranean" in the NE Aeolian Islands. This volcano has lent its name to the frequent mild explosive activity that has characterized its eruptions throughout much of historical time. The small island is the emergent summit of a volcano that grew in two main eruptive cycles, the last of which formed the western portion of the island. The Neostromboli eruptive period took place between about 13,000 and 5,000 years ago. The active summit vents are located at the head of the Sciara del Fuoco, a prominent scarp that formed about 5,000 years ago due to a series of slope failures which extends to below sea level. The modern volcano has been constructed within this scarp, which funnels pyroclastic ejecta and lava flows to the NW. Essentially continuous mild Strombolian explosions, sometimes accompanied by lava flows, have been recorded for more than a millennium.
Information Contacts: Istituto Nazionale di Geofisica e Vulcanologia (INGV), Sezione di Catania, Piazza Roma 2, 95123 Catania, Italy (URL: http://www.ct.ingv.it/en/); Benjamin Simons, The University of Auckland, 23 Symonds Street, Auckland, 1010, New Zealand (URL: https://unidirectory.auckland.ac.nz/people/profile/bsim836); Sentinel Hub Playground (URL: https://www.sentinel-hub.com/explore/sentinel-playground).