Report on Veniaminof (United States) — January 2019
Bulletin of the Global Volcanism Network, vol. 44, no. 1 (January 2019)
Managing Editor: Edward Venzke.
Research and preparation by Sara Arav-Piper.
Veniaminof (United States) Eruption with lava flows and ash plumes during September-December 2018
Please cite this report as:
Global Volcanism Program, 2019. Report on Veniaminof (United States) (Venzke, E., ed.). Bulletin of the Global Volcanism Network, 44:1. Smithsonian Institution. https://doi.org/10.5479/si.GVP.BGVN201901-312070
Veniaminof
United States
56.17°N, 159.38°W; summit elev. 2507 m
All times are local (unless otherwise noted)
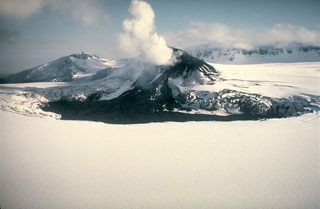
The most recent eruptive period at Veniaminof began in September 2018 with seismic activity followed by ash emissions and lava flows continuing through mid-December 2018, the end of this reporting period (figure 25). An intracaldera cone has been the source of historic volcanic activity in the last 200 years and more recent activity last reported in June 2013 (BGVN 42:02). Veniaminof is closely monitored by the Alaska Volcanic Observatory (AVO) and the Anchorage Volcanic Ash Advisory Center (VAAC), and is also monitored by a Federal Aviation Administration (FAA) web camera in the town of Perryville, 35 km E.
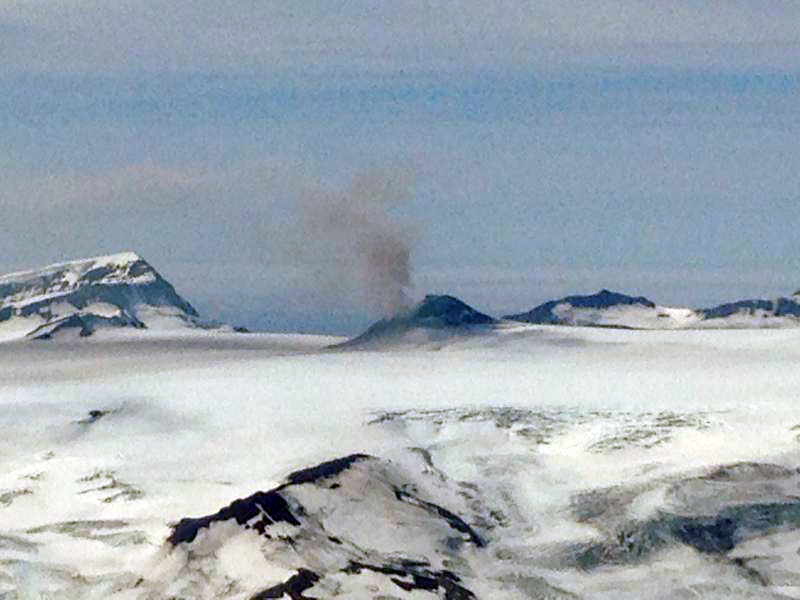 |
Figure 25. View of Veniaminof to the W with a diffuse ash plume at 1517 local time on 5 September 2018. Photo by Zachary Finley (color adjusted from original); courtesy of USGS/AVO. |
The most recent Strombolian-type eruptive cycle commenced with increased seismic activity on 2 September 2018. Low-level ash that rose 3 km and pulsatory low-altitude ash emissions were observed in FAA webcam images on 4-6 September. Ash deposits extended onto the snowfield at and below the summit to the SSW and SE, forming a "v" shape downslope from the summit. On 7 September a thermal feature was detected, suggesting lava fountaining at the summit, which was later confirmed by satellite data showing a S-flank lava flow about 800 m long on 9-11 September (figure 26). FAA webcam images on 26 September showed lava fountains issuing from a second vent 75 m N of the first, producing additional lava flows on the S flank (figures 27 and 28). Minor ash emissions associated with lava fountaining possibly rose as high as 4.5 km and quickly dispersed.
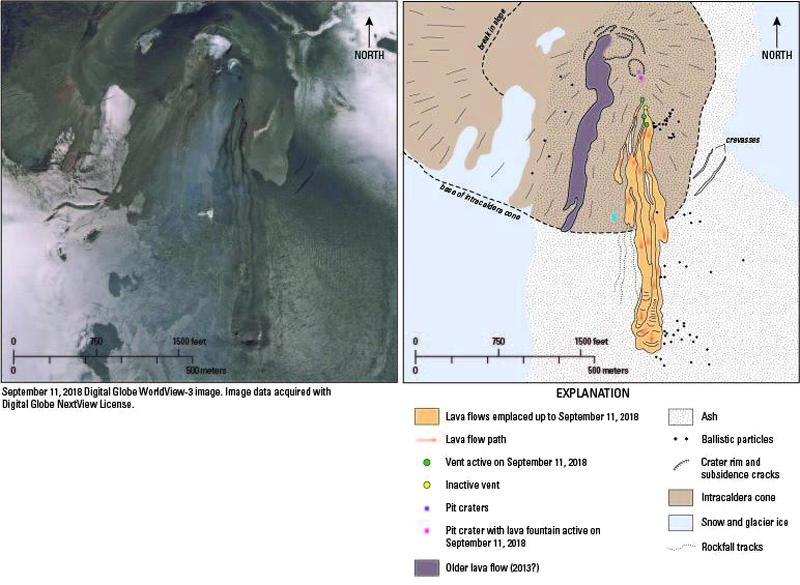 |
Figure 26. Geologic sketch map of lava flows and features on the intracaldera cone of Veniaminof as of 11 September 2018. DigitalGlobe WorldView-3 image (left) acquired with Digital Globe NextView License. Image by Chris Waythomas; courtesy of USGS/AVO. |
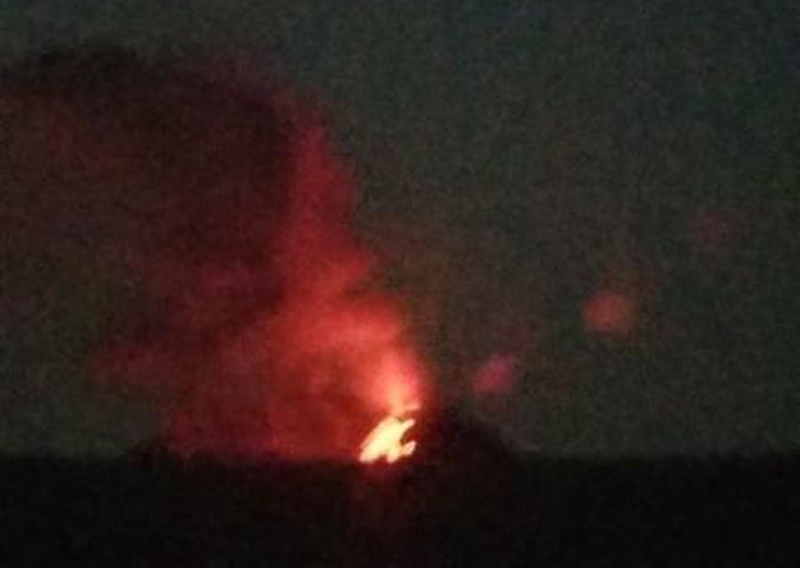 |
Figure 27. Veniaminof eruption on the evening of 18 September 2018. Photo by Pearl Gransbury; courtesy USGS/AVO. |
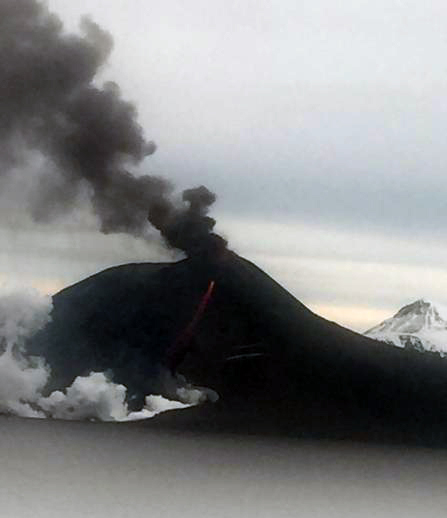 |
Figure 28. Veniaminof in eruption on 26 September 2018. A lava flow is visible on the S flank of the volcano with steaming at the base. Photo by Jesse Lopez (color adjusted from original); courtesy of USGS/AVO. |
The lava flow had traveled 1 km down the S flank of the summit cone by 1 October. Satellite imagery from 6 October showed three lobes of lava flows and a plume over a thin tephra deposit. By 25 October the lava flow had traveled as far as 1.2 km (figures 29 and 30). Fractures in the ice sheet adjacent to the lava flow field continued to grow due to meltwater flowing beneath. Additionally, a persistent and robust steam plume which contained sulfur dioxide was visible from the FAA webcam on 18 October.
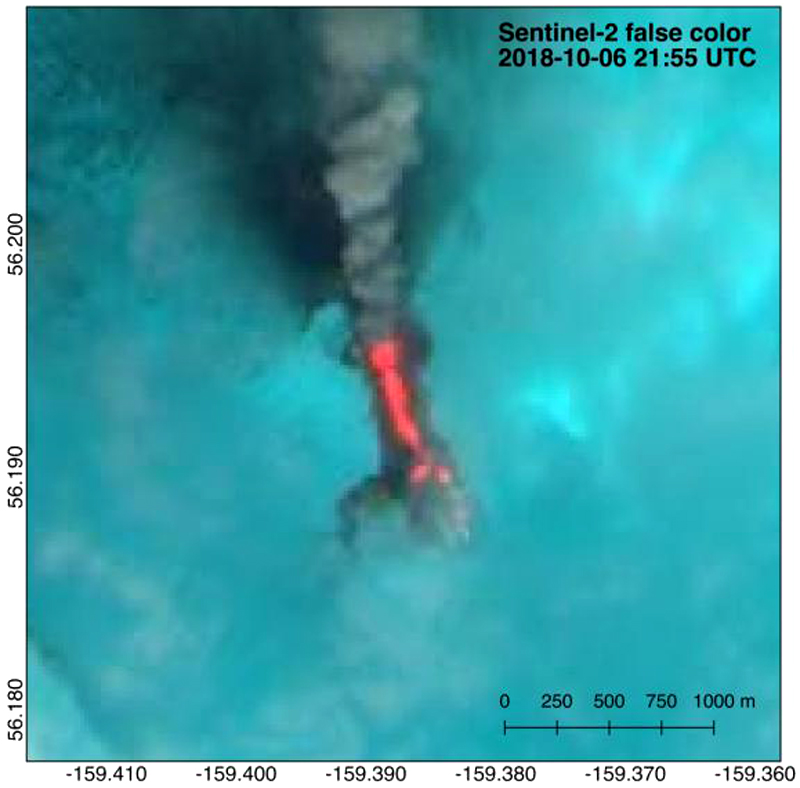 |
Figure 29. False color ESA Sentinel-2 image of Veniaminof on 6 October 2018 showing lava effusion and a plume with a thin tephra deposit beneath to the N. The flow is ~1 km in length with the most active front on the E, which has a SWIR (short wave infrared) anomaly extending to the flow front. A branch in the channel feeding the western lobes appears to be active as well, but without any SWIR anomaly near the flow front, suggesting that this western branch is less active. The eastern flow front is producing the strongest steam plume. Prepared by Hannah Dietterich with ESA Sentinel-2 imagery; courtesy of USGS/AVO. |
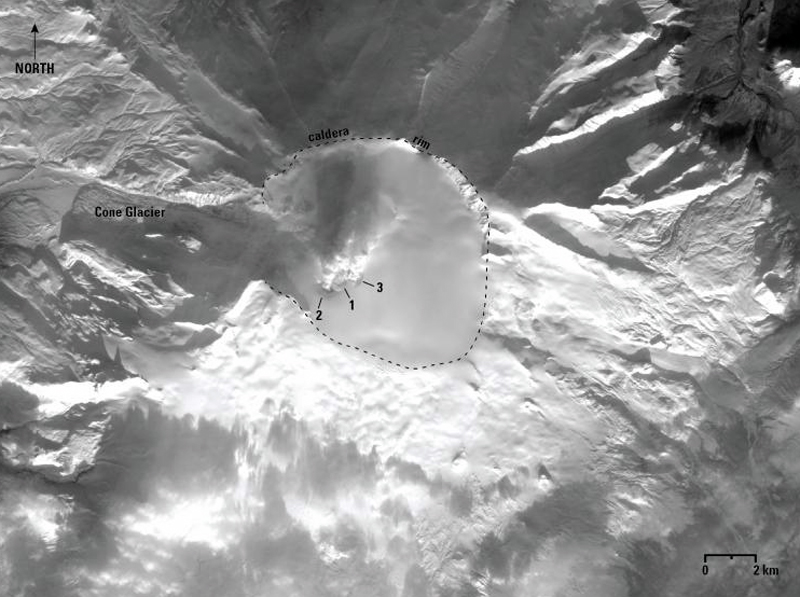 |
Figure 30. Sentinel-2 satellite image of Veniaminof acquired 5 December 2018. Image shows three lava lobes with relative ages from oldest (1) to youngest (3). AVO became aware of flow 3 on 29 November 2018. It is uncertain when this flow first formed because the volcano had been obscured by clouds earlier. Prepared by Chris Waythomas; courtesy of USGS/AVO. |
Ash emissions significantly increased overnight on 20-21 November, prompting AVO to raise the Aviation Color Code (ACC) to Red and the Alert Level to "Warning" (the highest levels on a four-level scale). The ash emissions rose to below 4.6 km and drifted more than 240 km SE. On 21 November observations and FAA webcam images indicated continuous ash emissions through most of the day as ash plumes drifted SE, extending as far as 400 km (figure 31). A short eruptive pulse was recorded during 1526-1726, and subsequent ash plumes rose to below 3 km with low-altitude ash emissions drifting 100 km S on 22 November (figure 32). Decreased ash emissions prompted AVO to lower the ACC and Alert Level to Orange and "Watch", respectively. However, lava effusion was persistent through 27 November.
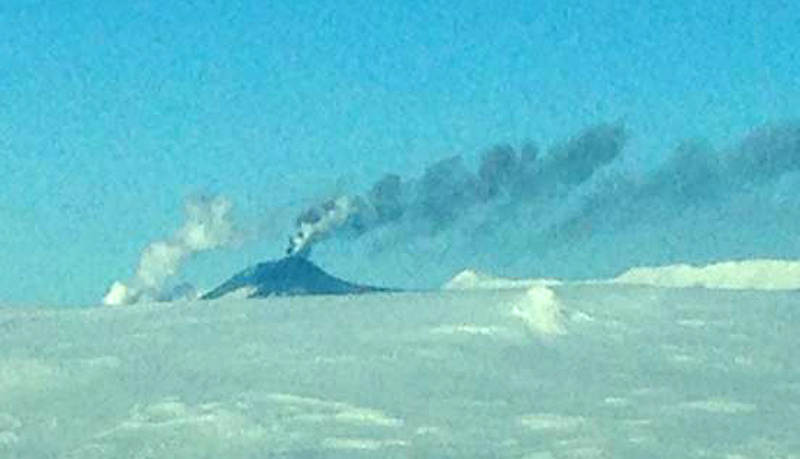 |
Figure 31. Plume rising from Veniaminof on 9 November 2018. View is to the west. Ash is visible at the summit and steam is rising from the S-flank lava flow. Photo by Zachary Finley (color adjusted from original); courtesy of USGS/AVO. |
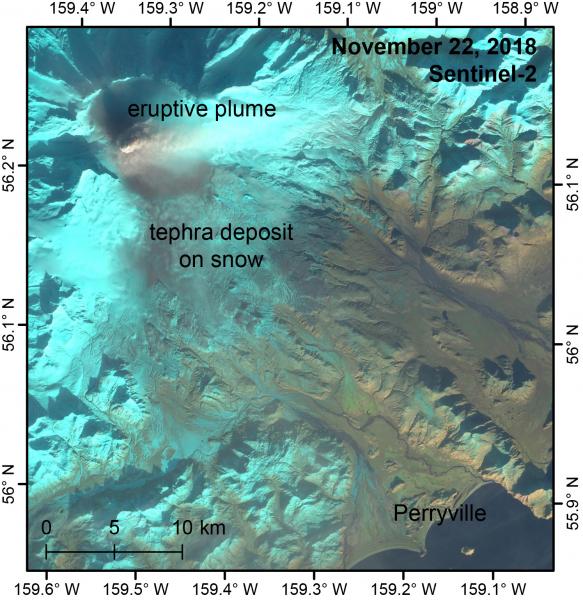 |
Figure 32. Annotated satellite image of the Veniaminof eruption taken by Sentinel-2 on 22 November 2018. The image shows an eruptive plume above the active cone within the caldera, as well as a broad tephra deposit to the SE on snow extending to Perryville. Image courtesy of USGS/AVO (ESA/Copernicus; Sentinel-2 image visualized in EOS LandViewer). |
During 27-28 November acoustic waves were recorded by regional infrasound sensors. A continuous low-amplitude tremor was recorded until the network went offline following a M 7 earthquake in Anchorage on 30 November. On 6 December seismicity changed from nearly continuous low-level volcanic tremor to intermittent small low-frequency events and short bursts of tremors, possibly indicating that lava effusion had slowed or stopped. Variable seismicity continued through 12 December, though there was no visual confirmation of lava effusion.
Minor ashfall was recorded in Perryville (35 km E) on 25 October and 22 November 2018. Elevated surface temperatures and thermal anomalies were identified in satellite data on 7, 12-26 September, 2-9 and 24-30 October, 7-22 November, and 4-5 December. Nighttime incandescence was visible from the FAA webcam at various times during this reporting period (figure 27). Following 22 November, the ACC remained at Orange and the Volcano Alert Level remained at "Watch."
The MIROVA thermal anomalies detected during this period were reported as having moderate to high radiative power (figure 33). Numerous thermal anomalies identified using the MODVOLC algorithm were also detected during this period, and showed the S-flank lava flows (figure 34).
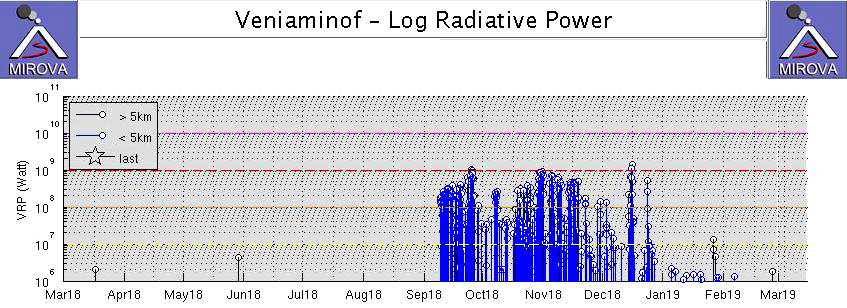 |
Figure 33. Plot showing the log radiative power of thermal anomalies at Veniaminof identified using MODIS data by the MIROVA system for the year ending on 28 February 2019. Courtesy of MIROVA. |
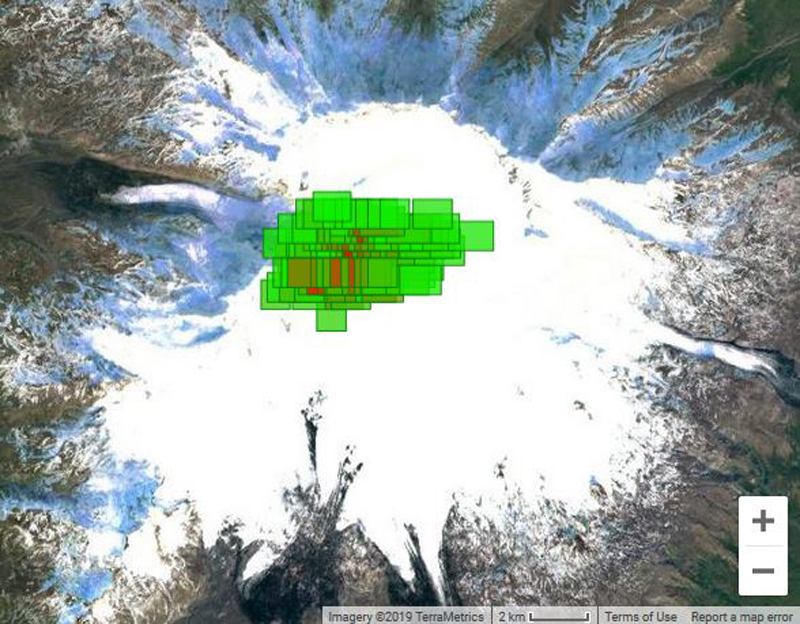 |
Figure 34. Map of thermal alert pixels at Veniaminof from the MODVOLC Thermal Alert System during 7 September-24 December 2018 (UTC). Courtesy of HIGP - MODVOLC Thermal Alert System. |
Geological Summary. Veniaminof, on the Alaska Peninsula, is truncated by a steep-walled, 8 x 11 km, glacier-filled caldera that formed around 3,700 years ago. The caldera rim is up to 520 m high on the north, is deeply notched on the west by Cone Glacier, and is covered by an ice sheet on the south. Post-caldera vents are located along a NW-SE zone bisecting the caldera that extends 55 km from near the Bering Sea coast, across the caldera, and down the Pacific flank. Historical eruptions probably all originated from the westernmost and most prominent of two intra-caldera cones, which rises about 300 m above the surrounding icefield. The other cone is larger, and has a summit crater or caldera that may reach 2.5 km in diameter, but is more subdued and barely rises above the glacier surface.
Information Contacts: Alaska Volcano Observatory (AVO), a cooperative program of a) U.S. Geological Survey, 4200 University Drive, Anchorage, AK 99508-4667 USA (URL: https://avo.alaska.edu/), b) Geophysical Institute, University of Alaska, PO Box 757320, Fairbanks, AK 99775-7320, USA, and c) Alaska Division of Geological & Geophysical Surveys, 794 University Ave., Suite 200, Fairbanks, AK 99709, USA (URL: http://dggs.alaska.gov/); Anchorage Volcanic Ash Advisory Center (VAAC), Alaska Aviation Weather Unit, NWS NOAA US Dept of Commerce, 6930 Sand Lake Road, Anchorage, AK 99502-1845 USA (URL: http://vaac.arh.noaa.gov/); Hawai'i Institute of Geophysics and Planetology (HIGP) - MODVOLC Thermal Alerts System, School of Ocean and Earth Science and Technology (SOEST), Univ. of Hawai'i, 2525 Correa Road, Honolulu, HI 96822, USA (URL: http://modis.higp.hawaii.edu/); MIROVA (Middle InfraRed Observation of Volcanic Activity), a collaborative project between the Universities of Turin and Florence (Italy) supported by the Centre for Volcanic Risk of the Italian Civil Protection Department (URL: http://www.mirovaweb.it/); Sentinel Hub Playground (URL: https://www.sentinel-hub.com/explore/sentinel-playground).