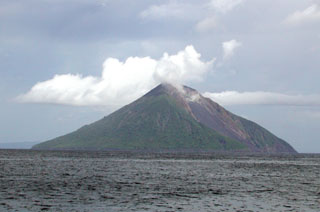
Tinakula
Solomon Islands
10.386°S, 165.804°E; summit elev. 796 m
All times are local (unless otherwise noted)
Remote Tinakula lies 100 km NE of the Solomon Trench at the N end of the Santa Cruz Islands, which are part of the country of the Solomon Islands located 400 km to the W. It has been uninhabited since an eruption with lava flows and ash explosions in 1971 when the small population was evacuated (CSLP 87-71). The nearest communities live on Te Motu (Trevanion) Island (about 30 km S), Nupani (40 km N), and the Reef Islands (60 km E); residents occasionally report noises from explosions at Tinakula. Ashfall from larger explosions has historically reached these islands. The most recent eruptive episode was a large ash explosion and substantial SO2 plume during 21-26 October 2017; satellite imagery suggested that a flow of some type traveled down the scarp on the W flank. Renewed thermal activity that was recognized in satellite imagery beginning in December 2018 continued intermittently through June 2019 and is covered in this report. Satellite imagery and thermal data are the primary sources of information for this volcano. It is occasionally visited by members of the National Disaster Management Office (NDMO) of the Solomon Islands Government, tourists, and research vessels who are able to capture ground-based information.
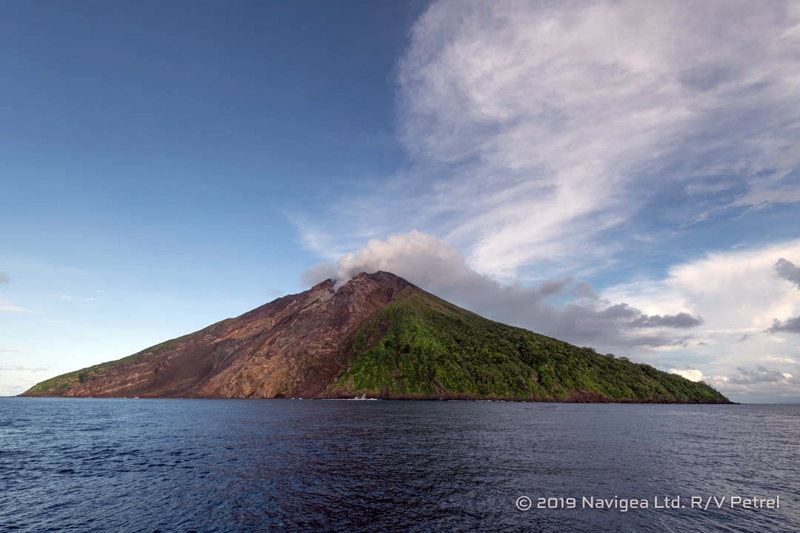
Satellite images from December 2018 to February 2019 show thermal anomalies at the summit vent. Excellent ship-based photographs of the island on 24-25 January 2019 provided by a crewmember from the R/V Petrel identify numerous volcanic features and show a steam-and-gas plume at the vent. Satellite images from April and May 2019 show thermal anomalies at both the summit vent and along the W flank scarp suggesting flow activity during that time.
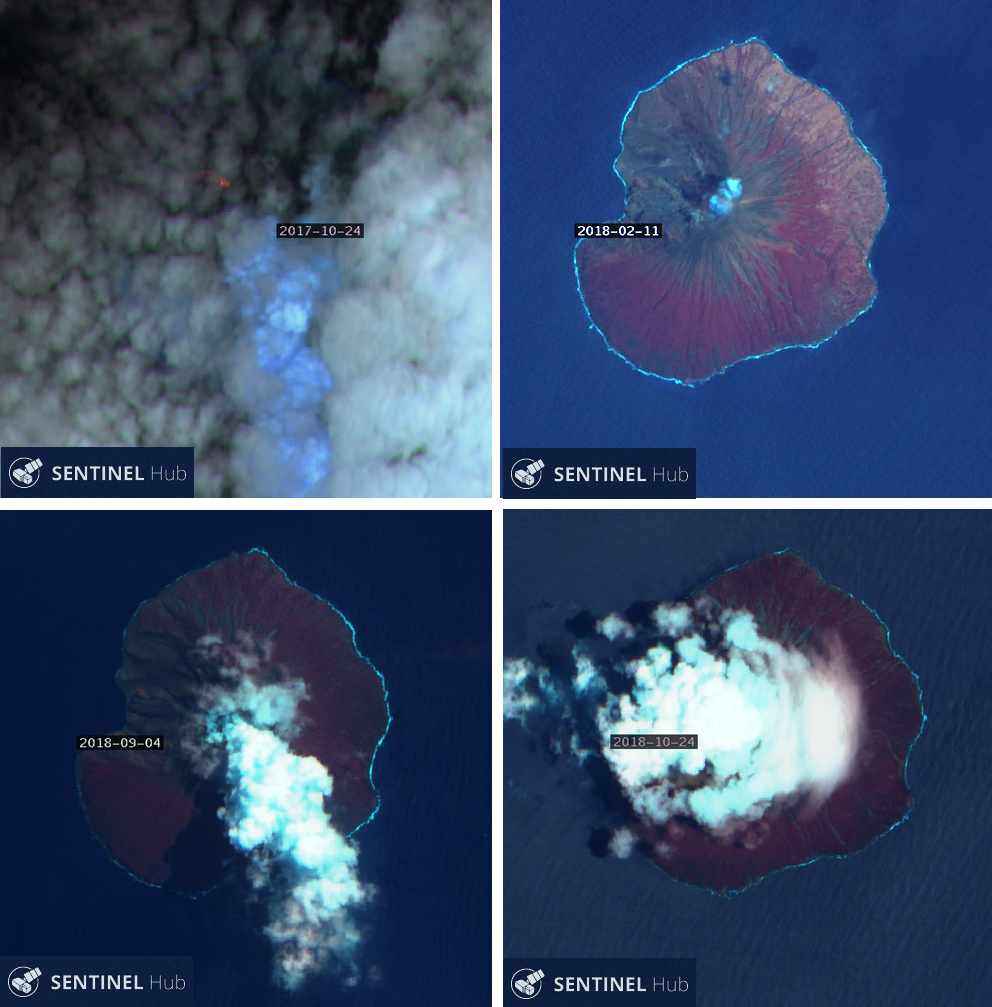
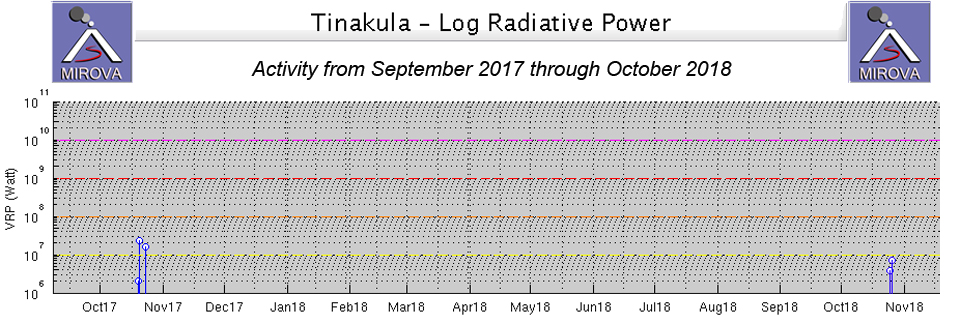
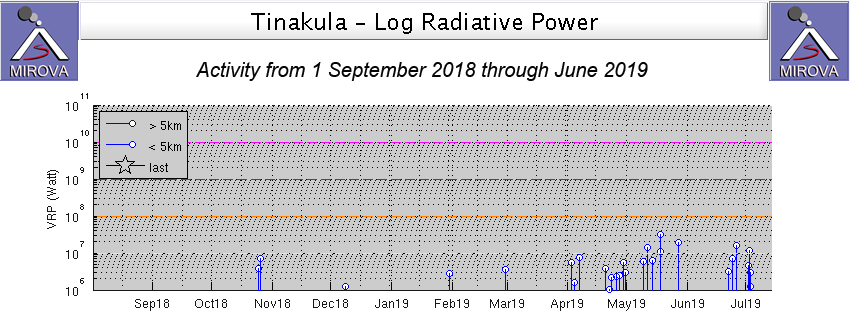
A stream of incandescence on the NW flank of Tinakula in a Sentinel 2 satellite image on 24 October 2017 confirmed that some type of high-temperature flow accompanied the explosions and eruptive activity of 21-25 October 2017 (BGVN 43:02). Satellite imagery during most of 2018 recorded steam plumes drifting in several directions from the summit, but no thermal activity (figure 24). There was no further evidence of activity in satellite visible or thermal data until almost exactly one year later when the MIROVA project recorded two thermal alerts in the third week of October 2018 (figure 25). Satellite images from that week were cloudy and did not confirm any surface activity.
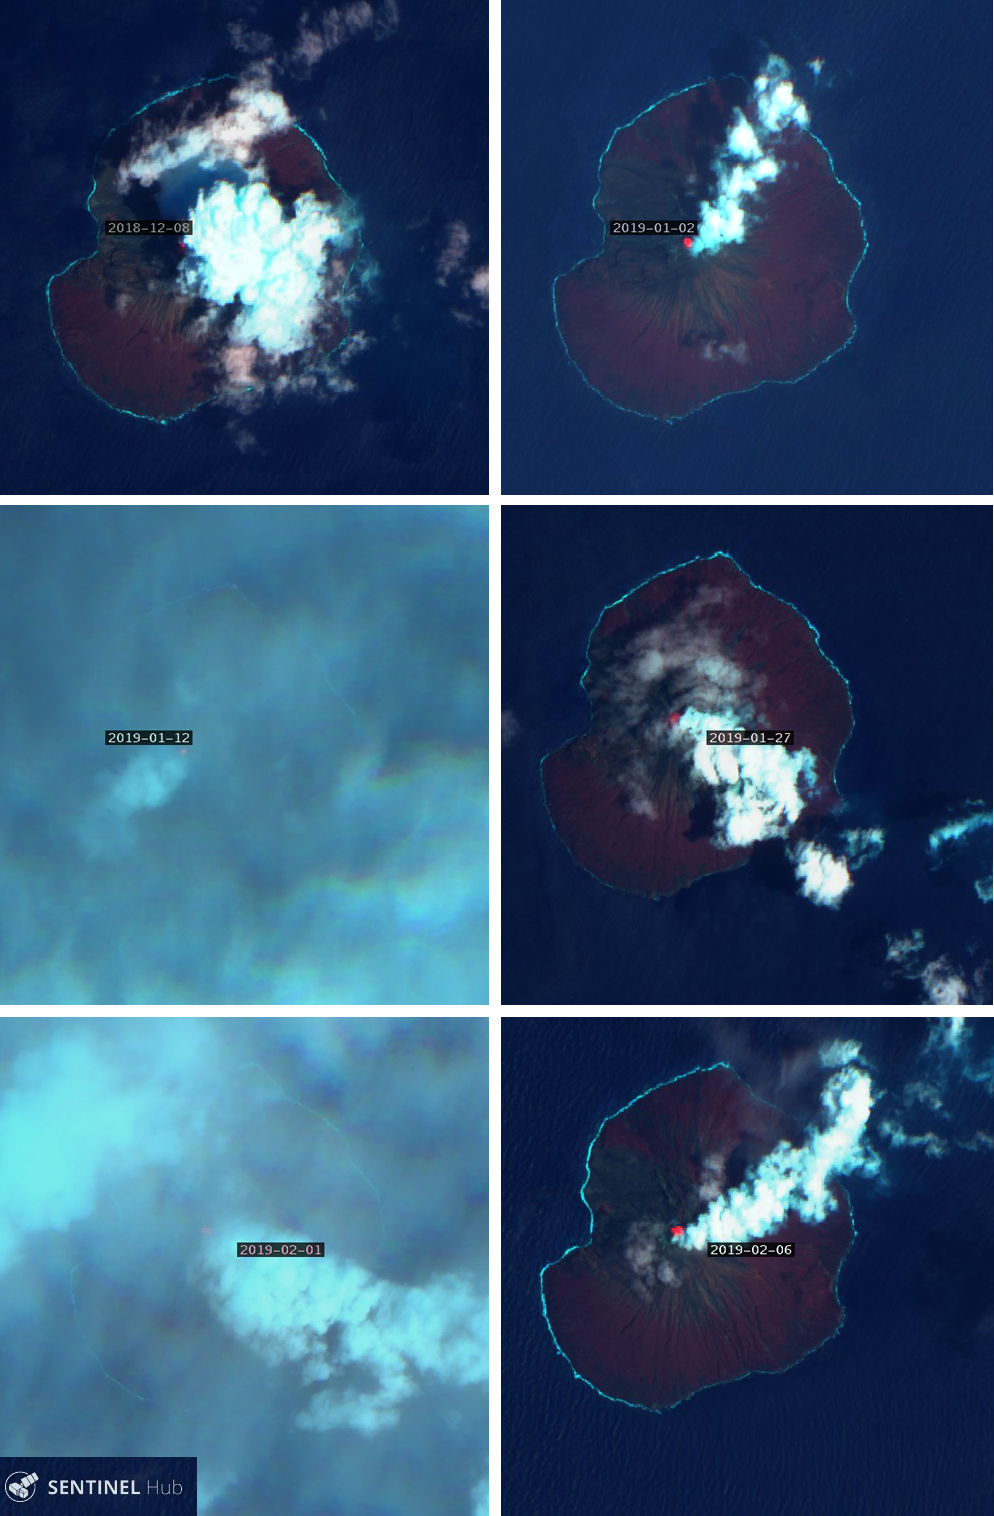
The first satellite imagery confirming renewed thermal activity appeared on 8 December 2018, around the same time as a small MIROVA anomaly. After that, several images during January and February 2019 confirmed moderately strong thermal activity at the summit (figure 26). Whether the anomalies were the result of active lava effusion or strong incandescent gases from the summit vent is uncertain.
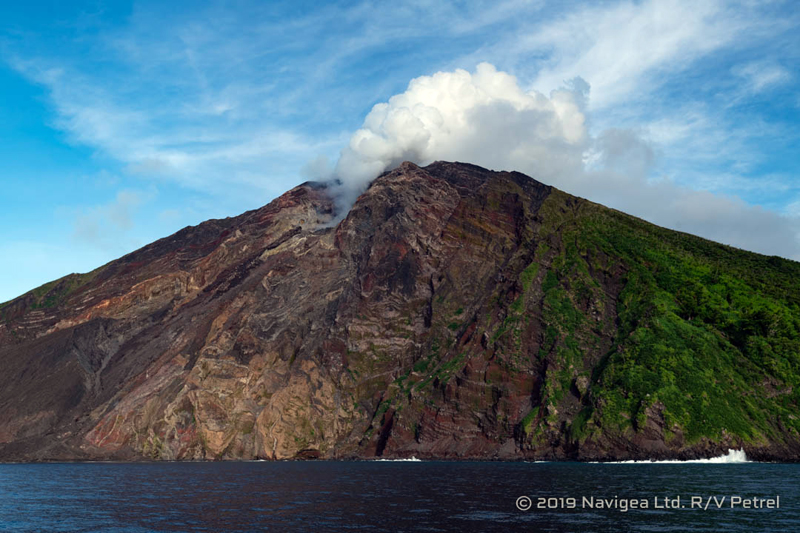
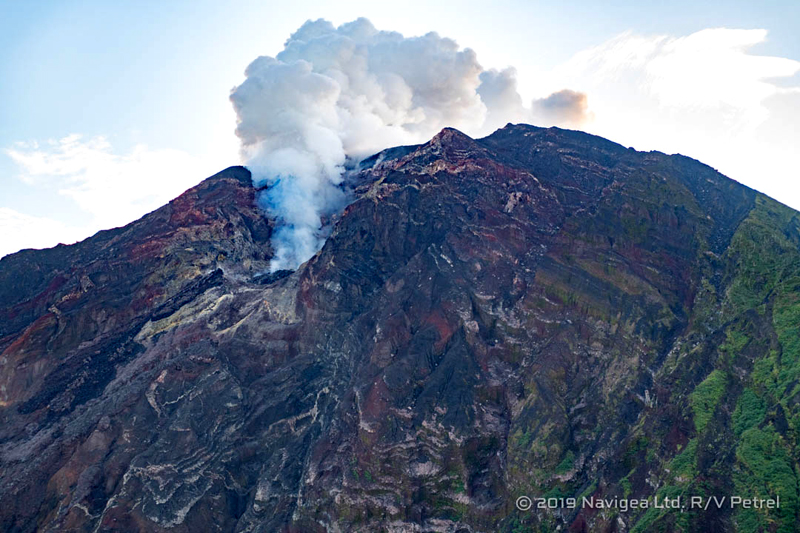
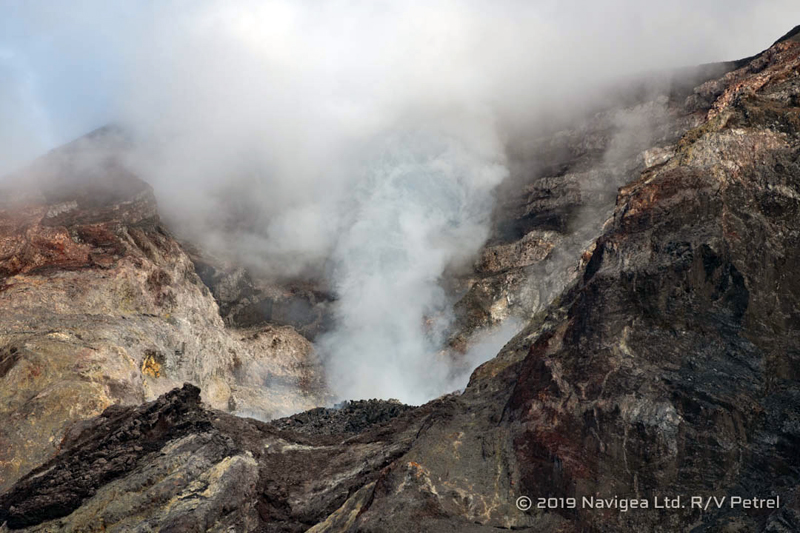
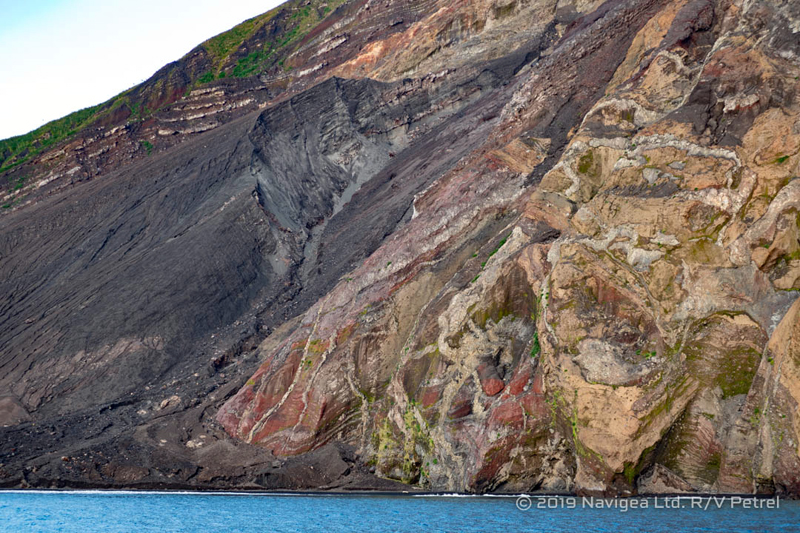
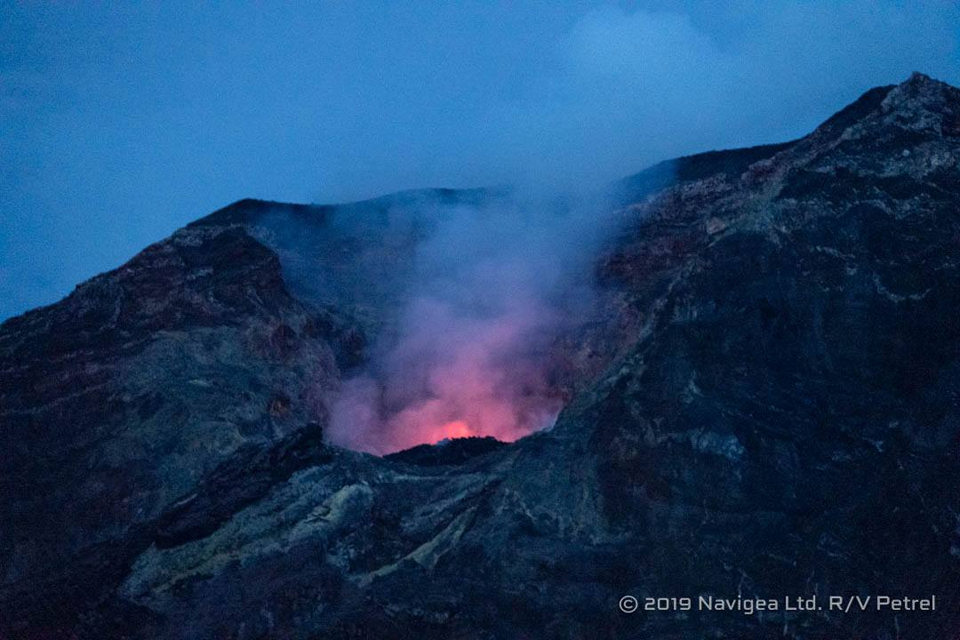
Visual confirmation of activity at Tinakula is rare, but the research vessel R/V Petrel sailed past the volcano on 24 and 25 January 2019 and a crewmember provided detailed images of the W flank and vent area. The summit vent is located at the top of a W facing scarp, and steam is frequently observed rising from the vent (figures 27). Recent flows and volcaniclastic deposits were visible in the ravine on the W flank (figures 28 and 29). Fresh-looking lava was also visible near the summit vent on top of older deposits (figure 30). Eroded volcaniclastic deposits near the base of the scarp on the W flank were visible on top of older veined and layered volcanic rocks (figure 31). Crewmembers on the vessel R/V Petrel could clearly see an incandescent glow from the summit crater at night (figure 32).
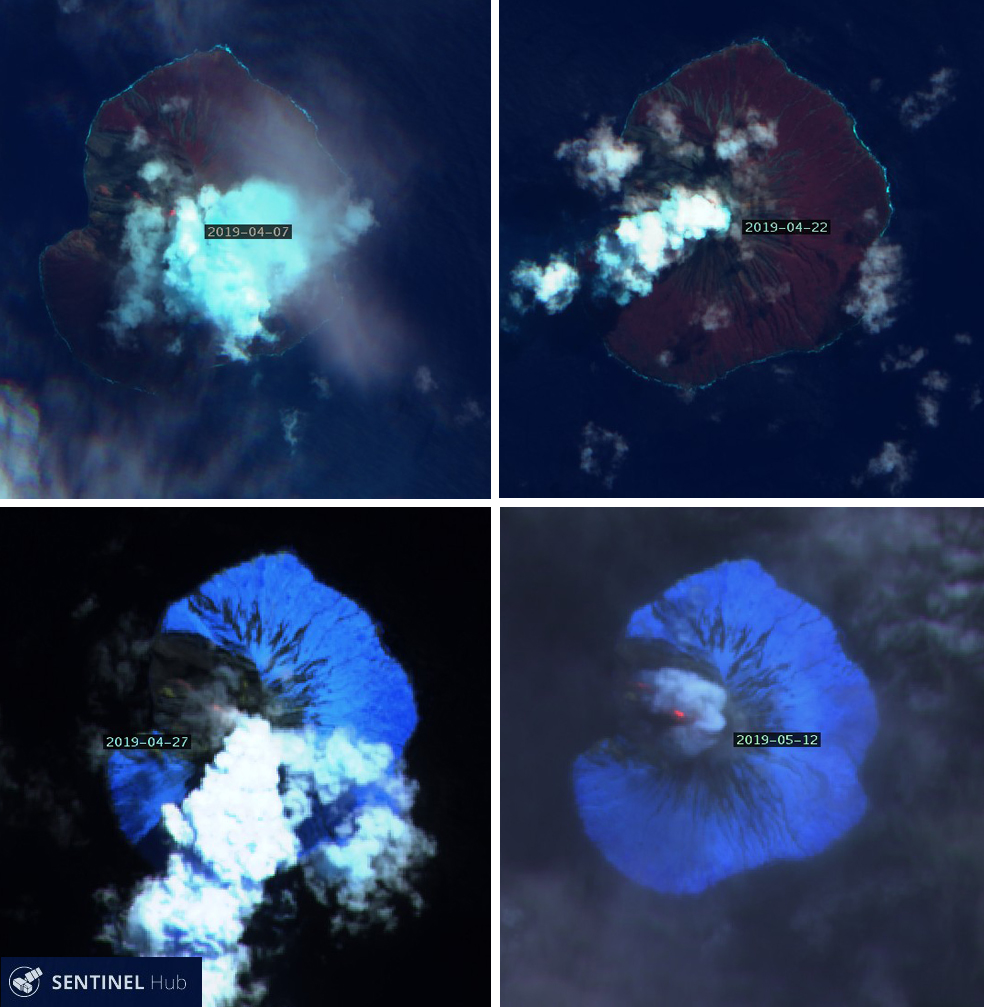
During April and May 2019, both the MIROVA project and MODVOLC measured a number of thermal anomalies (figure 33) using MODIS satellite data. MODVOLC alerts were issued on 4 and 20 April, and 11, 18, and 27 May. Sentinel-2 satellite images during the period confirmed that a flow on the W flank was a likely source of the thermal energy in addition to the summit vent (figure 34). Thermal anomalies appeared again at the end of June in MIROVA data, but no satellite images showed anomalies at that time.
Geological Summary. The small 3.5-km-wide island of Tinakula is the exposed summit of a massive stratovolcano at the NW end of the Santa Cruz islands. It has a breached summit crater that extends from the summit to below sea level. Landslides enlarged this scarp in 1965, creating an embayment on the NW coast. The Mendana cone is located on the SE side. The dominantly andesitic volcano has frequently been observed in eruption since the era of Spanish exploration began in 1595. In about 1840, an explosive eruption apparently produced pyroclastic flows that swept all sides of the island, killing its inhabitants. Recorded eruptions have frequently originated from a cone constructed within the large breached crater. These have left the upper flanks and the steep apron of lava flows and volcaniclastic debris within the breach unvegetated.
Information Contacts: MIROVA (Middle InfraRed Observation of Volcanic Activity), a collaborative project between the Universities of Turin and Florence (Italy) supported by the Centre for Volcanic Risk of the Italian Civil Protection Department (URL: http://www.mirovaweb.it/); Hawai'i Institute of Geophysics and Planetology (HIGP) - MODVOLC Thermal Alerts System, School of Ocean and Earth Science and Technology (SOEST), Univ. of Hawai'i, 2525 Correa Road, Honolulu, HI 96822, USA (URL: http://modis.higp.hawaii.edu/); Sentinel Hub Playground (URL: https://www.sentinel-hub.com/explore/sentinel-playground); Vulcan Inc. (URL: https://www.vulcan.com/), additional details about the R/V Petrel (URL: https://www.paulallen.com/).