Report on Kilauea (United States) — June 2021
Bulletin of the Global Volcanism Network, vol. 46, no. 6 (June 2021)
Managing Editor: Edward Venzke.
Edited by Kadie L. Bennis.
Kilauea (United States) Active lava lake, lava flows, and spattering during February-May 2021
Please cite this report as:
Global Volcanism Program, 2021. Report on Kilauea (United States) (Bennis, K.L., and Venzke, E., eds.). Bulletin of the Global Volcanism Network, 46:6. Smithsonian Institution. https://doi.org/10.5479/si.GVP.BGVN202106-332010
Kilauea
United States
19.421°N, 155.287°W; summit elev. 1222 m
All times are local (unless otherwise noted)
Kīlauea is the southeastern-most volcano in Hawaii and overlaps the E flank of the Mauna Loa shield volcano. It’s East Rift Zone (ERZ) has been intermittently active for at least 2,000 years; an extended eruption period began in January 1983 and was characterized by open lava lakes and lava flows from the summit caldera and the East Rift Zone. During May 2018 lava migrated into the Lower East Rift Zone (LERZ) and opened 24 fissures along a 6-km-long NE-trending fracture zone that produced lava flows traveling in multiple directions. Lava fountaining was reported in these fissures and the lava lake in the Halema’uma’u crater drained (BGVN 43:10).
September 2018 marked the end of the previous eruption period after 36 years of continuous activity. A new eruption began during December 2020 in the Halema’uma’u crater, with a new lava lake, lava flows, fountaining, and gas-and-steam emissions. During January 2021 a levee developed around the perimeter of the lake, creating what is known as a “perched” lake with the center elevated above a moat near the crater wall. In addition, the E half of the lake became stagnant and crusted over with cooled lava, allowing the active W half of the lake to rise slightly higher. This report updates activity during February through May 2021 using daily reports, volcanic activity notices, and abundant photo, map, and video data from the US Geological Survey's (USGS) Hawaiian Volcano Observatory (HVO).
Activity during February 2021. The effusive eruption continued from the base of the vent on the NW side of Halema’uma’u crater, maintaining an active lava lake in the W half of the crater (figures 487 and 488). During February, the depth of the lava lake increased to 219 m relative to the bottom of the crater; only the W part of the lake was active. The W fissure had a few incandescent vents, but there was no open lava channel and no signs of spattering. The stagnant E part of the lake was 5-8 m lower than the perched, active W part of the crater. The lake surface actively overturned at “plate” boundaries. The small islands that had formed in the E side of the crater remained stationary; the dimensions of the main, largest island in the W perched area remained unchanged and was 9 m above the lake, with the highest point at 21 m, based on measurements taken on 12 February. A series of surface cracks separated the active and inactive sections of the crater. Sulfur dioxide emission rates remained elevated; measurements of a high of 2,200 tons/day were taken on 1 February. Seismicity was also elevated, but stable, which included a few minor earthquakes.
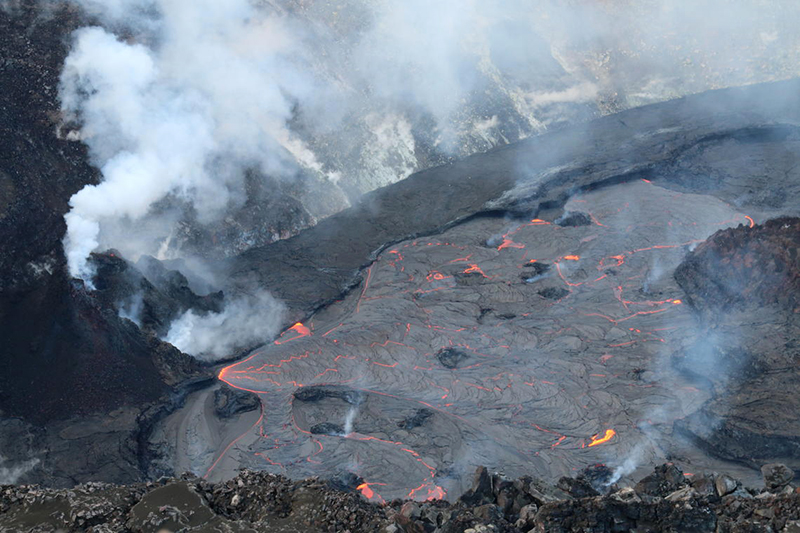 |
Figure 487. Close-up photo of the active W vent in Halema’uma’u at Kīlauea on 5 February 2021. The W side of the lava lake had numerous surface breakouts while lava effusion fed the lake from the base of the vent (left). White gas-and-steam plumes were observed from the W vent. Photo by K. Lynn; courtesy of USGS HVO. |
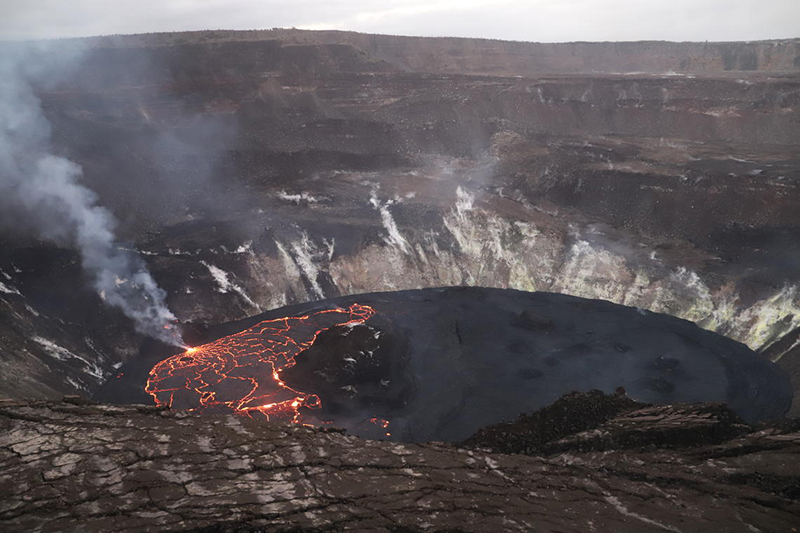 |
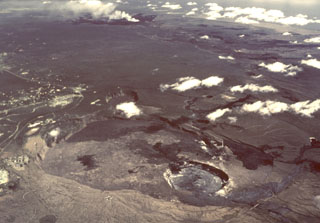
Figure 488. Photo of the lava lake in Halema’uma’u at Kīlauea taken on 10 February 2021 from the S rim and looking N showing the active western (left) part of the lake that has hot incandescent lava and the inactive (right) eastern part of the lake that appears dark. A white gas-and-steam plume accompanied the W active vent. Photo by N. Deligne; courtesy of USGS HVO. |
On 2 February HVO scientists observed that the intensity of the lava flow into the crater varied, with cycles lasting 5-6 minutes. During the morning of 8 February, a small dome fountain became active; by 13 February lava rapidly developed a thin crust from this upwelling that flows to the E (figure 489). Observations showed gas jetting at two locations above the W vents and two bursts of spatter during 9-10 February. Sulfur dioxide measurements taken on three consecutive days in February showed a gradual decrease from 1,600 tons/day on the 10th, 1,200 tons/day on the 11th, and 1,100 tons/day on the 12th. During 14-15 February some lava overflows N of the inlet site flowed around the NW margin of the perched lake. A few lava flows were noted along the N and E margins of the stagnant E portion of the lake during 15-16 February. HVO reported on 21 February that there was circulation in the active W part of the lake due to lava effusions. The E part of the lake remained stagnant with a solidified surface crust that slowly grew W around the main island; minor amounts of debris accumulated around one or two of the smaller islands as their edges began to cool and collapse. Lava effusion at the W vent slowed during 22 February, allowing a thin crust to develop. A thin surface crust also started to form around three small pieces of the spatter cone that had been in the lake and close to the vent. On 22 and 23 February SO2 measurements continued to show a gradual drop in flux to 600 tons/day and 800 tons/day, respectively.
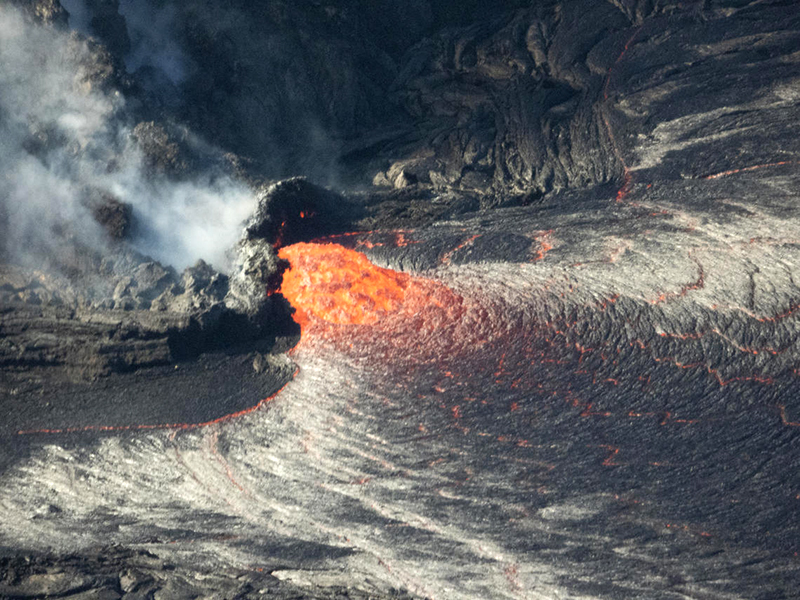 |
Figure 489. Close-up photo of the small dome fountain at Kīlauea effusing from the active W vent in Halema’uma’u on 11 February 2021. Lava from this upwelling cooled rapidly and began to form a thin crust by 13 February, moving E. Photo by M. Patrick; courtesy of USGS HVO. |
On 24 February the W vent was 28 m tall, feeding a submerged inlet to the lava lake in addition to a slow-moving flow that was several tens of meters long onto the crusted-over NW margin of the lake. The S end of the island was 10 m above the lava lake surface, with the highest point at 23 m. SO2 emissions had increased briefly to 1,100 tons/day on 25 February before declining again to 700 tons/day on the 26th. A map of the summit area updated on 26 February showed the lava lake surface was 65 m below the Halema’uma’u rim, 218 m deep, and had a total volume of 36 million cubic meters (figure 490).
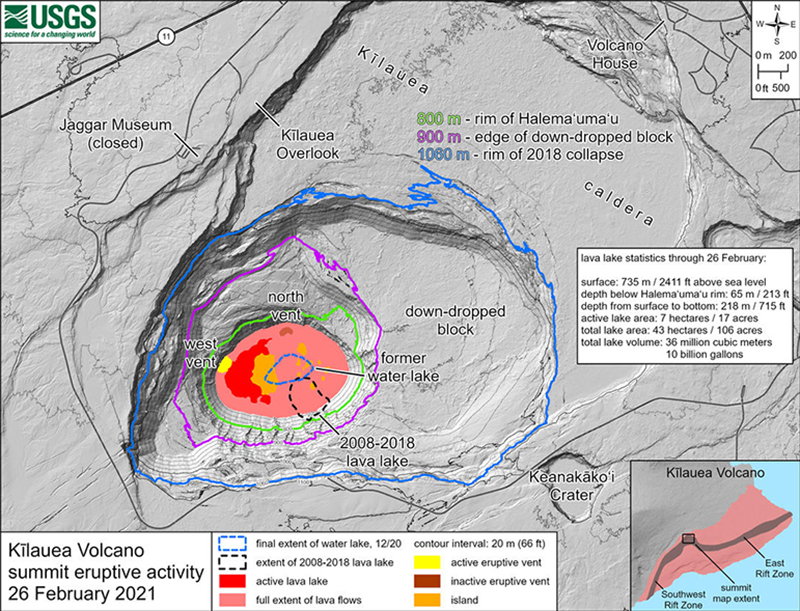 |
Figure 490. Map of the summit area at Kīlauea updated on 26 February 2021 noting that the lava lake was 65 m below the Halema’uma’u rim and 218 m deep relative to the bottom of the crater when the eruption began on 20 December 2020. The contour lines highlighted in green, purple, and blue mark the rim of the crater, the edge of the E down-dropped block, and the rim of the 2018 collapse, respectively. The total lava lake volume was 36 million cubic meters. The red color represents the active lava lake; the light red color represents the extent of the lava flows; the yellow color represents the active W eruptive vent; the maroon color represents the inactive eruptive vent; the orange color marks the location of the central island. The dashed blue line marks the formed water lake, and the dashed black line marks the 2008-2018 lava lake. The contour lines are in 20 m intervals. Courtesy of USGS HVO. |
Activity during March 2021. Similar activity continued during March and remained confined to Halema’uma’u where the main section of the W vent effused lava through one or two crusted-over channels and submerged lake inlets on the NW side of the crater. Another section of the W vent less than 100 m to the NE occasionally fed short lava flows (less than 100 m) onto the crusted margins of the lake, one of which was lasted an hour during the morning of 4 March. One of these flows stretched to 150 m long by 5 March. Several shifting inlets were active, but some lava was also accumulating on the lake margin within 50 m of the vent. Circulation continued in the active W part of the lake as lava effused into it through several new inlets. The E part of the lake remained stagnant with a solidified surface crust that slowly grew W around the main island. Lava continued to develop a thin crust while expanding E. Minor debris continued to accumulate on the lava surface around one or two of the islands as their edges cooled, cracked, and broke off. The active W half of the lava lake was approximately 224 m deep, as measured by a remote laser rangefinder (figure 491). SO2 emissions rates varied during the month but remained elevated to 1,100 tons/day based on measurements on 19 March. By 29 March the SO2 flux had declined to 600 tons/day.
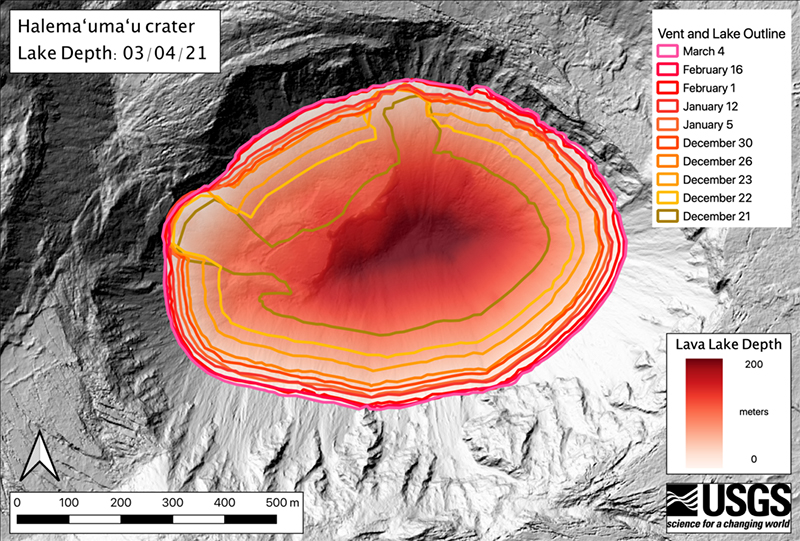 |
Figure 491. Data taken from a Kīlauea summit helicopter overflight on 4 March 2021 was used to calculate the depth of the lava lake in Halema’uma’u. The deepest parts of the lake (darkest red) exceed 200 m. The different colored lines show the perimeter of the lake and the vents. The rise of the lava lake had slowed as the rate of the eruption decreased and the crater extent increased. The base map is a pre-eruption DEM from 2019. Courtesy of USGS HVO. |
By midday on 7 March the lava flows had built a perched lava pond on the NW lake margin, but it abruptly collapsed just after 1300; the ongoing lava flow stabilized into a second relatively steady inlet to the lake. Rangefinder measurements and visual observations made on 15 March indicated that the E part of the lake was 5 m lower than the active W part of the lake. Lava effusions continued to flow from both the main vent and a newer one several meters NE into the lake through submerged inlets. On 16 March at 0220 the NE section of the W vent complex, located several meters away from the submerged inlets, fed another lava flow from approximately halfway up the cone structure.
Activity during April 2021. During April lava continued to erupt at a low rate through a crusted-over channel and submerged inlet on the NW side of the crater; the lake reached 227 m depth and the E half remained stagnant with a solidified crust. SO2 emission rates were consistent with previous measurements of 1,200 tons/day on 1 April. Lava circulation continued in the W part of the lake, with lava flowing out sporadically along the perimeter of the lake through 26 April (figure 492). During 1-2 April HVO scientists noted occasional weak spatter from two areas on the W vent (figure 493). Thermal mapping done on 16 April showed that the stagnant and solidified crust covered 93% of the lake surface (figure 494). HVO reported that SO2 emission rates during 21, 22, 23, 24, and 25 April were among the lowest recorded during the current eruption period: 350 tons/day, 550 tons/day, 300 tons/day, 350 tons/day, and 375 tons/day respectively, though they were still considered elevated compared to rates in the month before the start of the eruption in late December 2020. This drop in emissions occurred when summit tilt was slowly increasing, which also suggested that the effusion rate had also decreased.
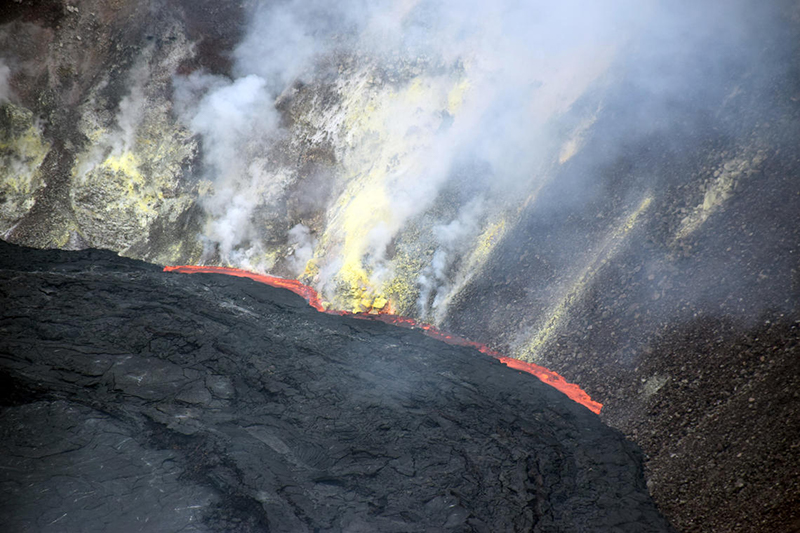 |
Figure 492. Photo of the E side of Halema’uma’u at Kīlauea on 2 April 2021 showing lava extruding between the crusted surface of the lava lake and the crater wall. Photo by L. DeSmither; courtesy of USGS HVO. |
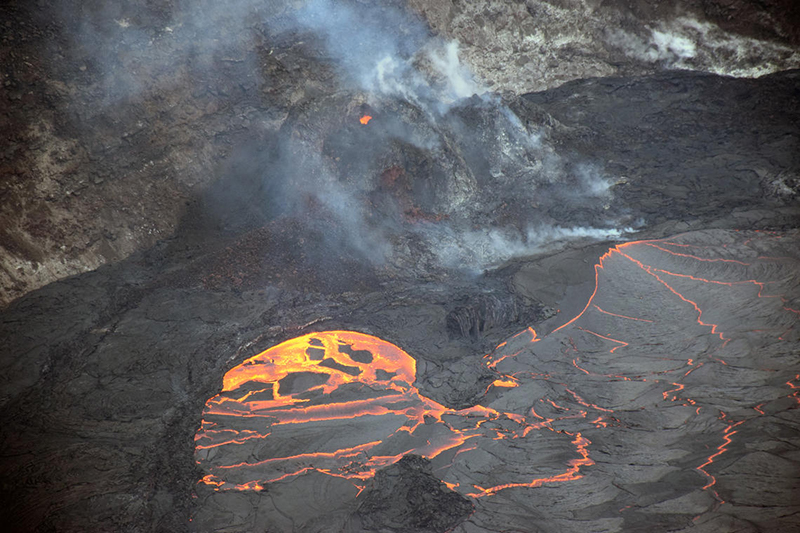 |
Figure 493. Photo from the S crater rim of Halema’uma’u at the summit of Kīlauea showing lava on 2 April 2021 continuing to enter the lake through an inlet near the base of the W vent cone (right). An incandescent opening near the top of the cone (upper center) ejected occasional spatter accompanied by white gas-and-steam emissions. Photo by L. DeSmither; courtesy of USGS HVO. |
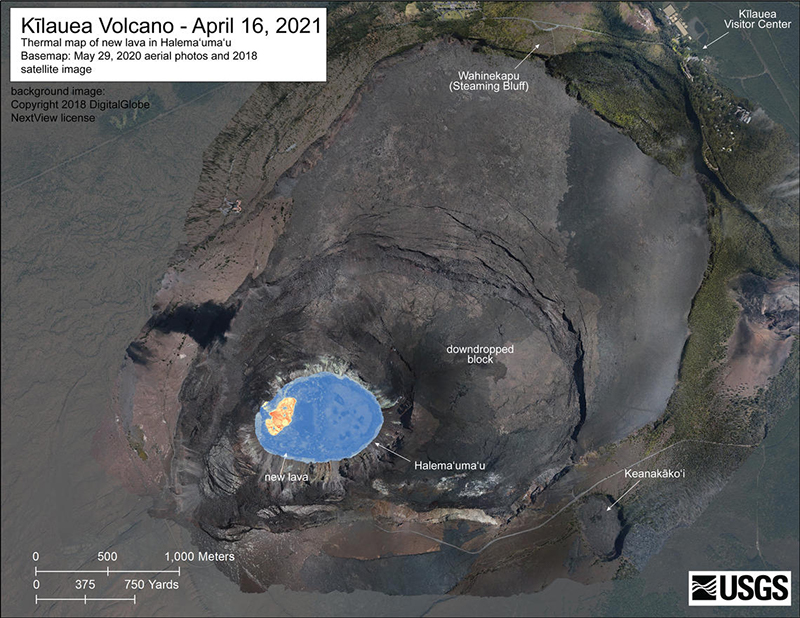 |
Figure 494. Composite view using a basemap of aerial photos and satellite images of Halema’uma’u crater at the summit of Kīlauea overlayed with a thermal image of the active surface lava lake taken from a helicopter at 1200 on 16 April 2021. The active surface lava is limited to the W side of the lake (yellow-orange) while the E part of the lake has stagnated and is mostly composed of cooling, solidified crust (blue). The scale of the thermal map ranges from blue to red with blue colors representing cooler temperatures and red colors representing warmer temperatures. Map by M. Patrick; courtesy of USGS HVO. |
Activity during May 2021. Effusive activity continued through 23 May at the Halema’uma’u crater where lava erupted from a vent on the NW side of the crater through a submerged inlet. The lava lake was 229 m deep, based on data from a laser rangefinder; the E half of which remained stagnant. Sulfur dioxide emission rates were elevated to 475 tons/day on 2 May but were significantly lower than rates that averaged over 800 tons/day during mid-February to mid-April. Lava circulation continued in a smaller W part of the lava lake, though effusions have not been observed around the perimeter since 26 April. Measurements of the surface showed that it was no longer rising, which suggested that between 11 and 13 May lava had stopped flowing into the lake. The decrease in lava supply over the previous month caused the lake to shrink to two small ponds by 11 May. After 11 May some weak inflation was recorded and an increase in shallow volcano tectonic earthquakes at the summit. SO2 emission rates continued to gradually decline to a less than 100 tons/day after 18 May, which was comparable to levels associated with the non-eruptive period from late 2018 to late 2020 (less than 100 tons/day). By 13 May lava circulation was confined to two small pools that had occasional overflows; effusions had not been observed along the perimeter of the lake since early May (figure 495). Stagnant and solidified lava crust covered 99% of the lake surface, based on thermal mapping done on 13 May. A series of thermal images taken on 13 and 28 April, and 10 and 19 May, showed a decreasing area of active surface lava between the two months (figure 496). By 19 May the small lava pond was visible in thermal imagery and measured 20 m long near the W fissure.
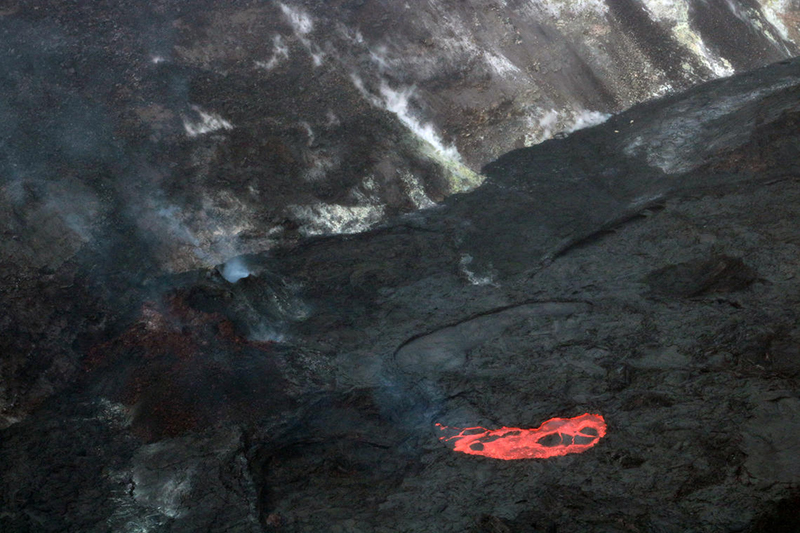 |
Figure 495. Photo of the fluid surface of the lava lake at Kīlauea on 13 May 2021. Two areas of ponded lava were visible (one pictured here). Photo taken from the S ponded area at 1415 by K. Mulliken; courtesy of USGS HVO. |
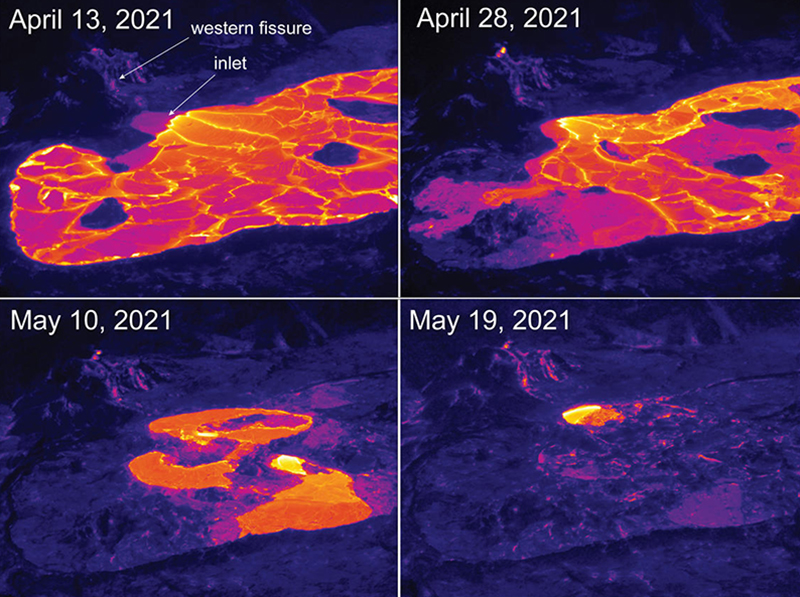 |
Figure 496. Comparison of thermal images taken from the S rim of Halema’uma’u at the summit of Kīlauea showing the decreasing area of the active lava on the surface on 13 April (top left) 2021, 28 April (top right), 10 May (bottom left), and 19 May (bottom right). By 19 May 2021 the active lava was limited to a small pond about 20 m long near the W fissure. Images by M. Patrick; courtesy of USGS HVO. |
According to HVO, no active lava was observed after 23 May, based on webcam images. In addition, there was a decrease in the volume of gas emissions to close to pre-eruption background levels. Seismicity, though weaker, persisted, which indicated some shallow magmatic activity. Field crews on 24 May observed two small points of incandescence in the lava lake and a faint glow from the W vent but reported no signs of surface activity. The location of the incandescence was also noted in thermal webcams (figure 497). Summit tiltmeters recorded inflation until 2100 on 24 May and recorded deflation afterward. The total volume of the lake was approximately 41.2 million cubic meters. Field crews on 25 May did not observe any sign of lake activity, incandescence, nor surface activity. As a result, on 26 May HVO lowered the Volcano Alert Level (VAL) to Advisory and the Aviation Color Code to Yellow (the third highest on a four-color scale).
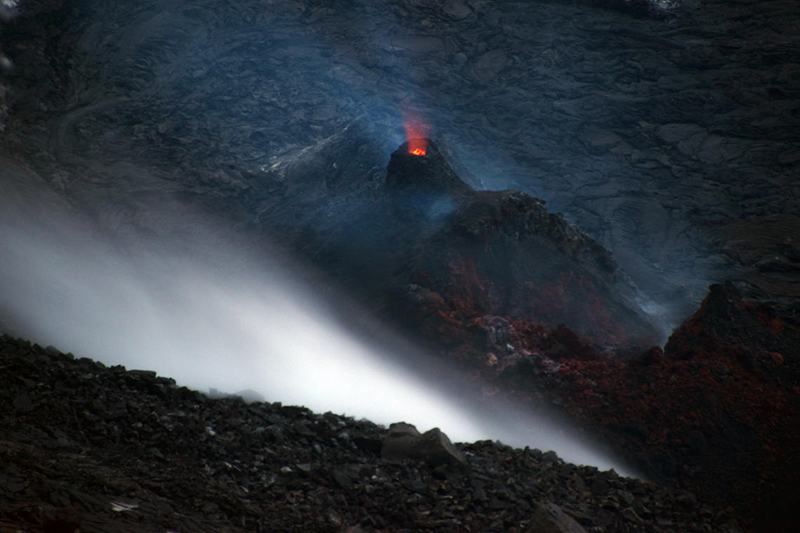 |
Figure 497. Zoomed-in view of the W vent in Halema’uma’u at Kīlauea showing a weak incandescent glow on 24 May 2021. Photo by B. Carr; courtesy of USGS HVO. |
Geological Summary. Kilauea overlaps the E flank of the massive Mauna Loa shield volcano in the island of Hawaii. Eruptions are prominent in Polynesian legends; written documentation since 1820 records frequent summit and flank lava flow eruptions interspersed with periods of long-term lava lake activity at Halemaumau crater in the summit caldera until 1924. The 3 x 5 km caldera was formed in several stages about 1,500 years ago and during the 18th century; eruptions have also originated from the lengthy East and Southwest rift zones, which extend to the ocean in both directions. About 90% of the surface of the basaltic shield volcano is formed of lava flows less than about 1,100 years old; 70% of the surface is younger than 600 years. The long-term eruption from the East rift zone between 1983 and 2018 produced lava flows covering more than 100 km2, destroyed hundreds of houses, and added new coastline.
Information Contacts: Hawaiian Volcano Observatory (HVO), U.S. Geological Survey, PO Box 51, Hawai'i National Park, HI 96718, USA (URL: http://hvo.wr.usgs.gov/).