Report on Sinabung (Indonesia) — August 2021
Bulletin of the Global Volcanism Network, vol. 46, no. 8 (August 2021)
Managing Editor: Edward Venzke.
Edited by A. Elizabeth Crafford.
Sinabung (Indonesia) Ash plumes rise to 12.2 km with pyroclastic flows on 2 March and 13-14 May 2021
Please cite this report as:
Global Volcanism Program, 2021. Report on Sinabung (Indonesia) (Crafford, A.E., and Venzke, E., eds.). Bulletin of the Global Volcanism Network, 46:8. Smithsonian Institution. https://doi.org/10.5479/si.GVP.BGVN202108-261080
Sinabung
Indonesia
3.17°N, 98.392°E; summit elev. 2460 m
All times are local (unless otherwise noted)
Indonesia’s Sinabung volcano in north Sumatra had its first confirmed Holocene eruption during August and September 2010. It remained quiet until September 2013 when a new eruptive phase began that continued through mid-2018. Dome growth and destruction resulted in block avalanches, multiple explosions with ash plumes, and deadly pyroclastic flows during the period. After a pause in activity from September 2018 through April 2019, explosions resumed during May and June 2019. Rock avalanches, frequent, dense, ash-bearing explosions, and periodic pyroclastic flows continued through February 2021. This report covers ongoing similar activity from March through June 2021 with information provided by Pusat Vulkanologi dan Mitigasi Bencana Geologi (PVMBG, also known as CVGHM, the Center of Volcanology and Geological Hazard Mitigation), MAGMA Indonesia, and the Darwin Volcanic Ash Advisory Centre (VAAC). Additional information comes from satellite instruments and the Indonesian National Disaster Management Agency (BNPB).
Hundreds of block avalanches and tens of ash-bearing explosions were reported each month during March to mid-May 2021. Ash plumes rose 500-2,000 m above the summit (3,000-4,500 m altitude) on most days; occasional larger events produced much higher plumes. Two major sets of explosions, on 2 March and 13-14 May, each produced ash plumes that rose to 12.2 km altitude, more than 10 pyroclastic flows, and significant SO2 plumes measured by satellite instruments. Reports of activity during the period came from the Sinabung Observation Post (in Surbakhti, 10 km SE of the volcano) and from geoscientists monitoring seismic instruments and webcams from remote locations; the combined information provides a more complete picture of activity at the volcano (table 10). Thermal activity was recorded by the MIROVA project and indicated a spike in radiative power that began in late February and lasted through May 2021, attributable to increased explosive activity (figure 93). Two notable sequences of explosions on 2 March and 13-14 May produced significant plumes of SO2 that were measured by the TROPOMI instrument on the Sentinel-5P satellite (figure 94). None of the other explosions during the period produced significant SO2 anomalies. Only two days of explosions, 3 and 6 June, occurred after 19 May through the end of June.
Table 10. A summary of information and sources reporting activity at Sinabung during March-June 2021 includes the distance block avalanches traveled, the number of eruptions, pyroclastic flows, and lahars reported by the observatory, the seismic eruptions recorded by MAGMA Indonesia, and the VONA’s issued. All heights and distances shown are in meters. Information provided by PVMBG unless otherwise noted. Courtesy of PVMBG and MAGMA Indonesia.
| Month | Block Avalanches Distances (m) | Eruptions reported by Sinabung Observation Post | Eruptions reported by MAGMA Indonesia via seismometers and webcams | Pyroclastic flows reported by Sinabung Observation Post | VONAs (m above the summit) | Lahar Seismic Signals |
| Mar 2021 | 500-1,500, E SE flanks | 49 (1-6 per day), 1,000 m high, gray ash | 42 (500-2,000), dense gray emissions | 20 (15 on 2 March), 1,000-3,700 E, SE, and S | 22 (500-1,000) | 3 |
| Apr 2021 | 500-1,500, E SE flanks | 123 (1-10 per day) 500-1,000 m, gray ash | 74 (500-2,000) dense gray emissions | 7, 1,500-2,000 E and SE | 30 (500-2,000) | 5 |
| May 2021 | 500-1,500 E SE flanks | 37 (1-6 per day), 500-3,000 m, gray ash | 26 (500-3,500) dense gray emissions | 15 (14 on 13 May), 2,500-4,000 m; E, SE | 10 (700-3,000) | 5 |
| Jun 2021 | Not Observed | 2, Not Observed | 3, Not Observed | 1, Not Observed | 2, Not Observed | 5 |
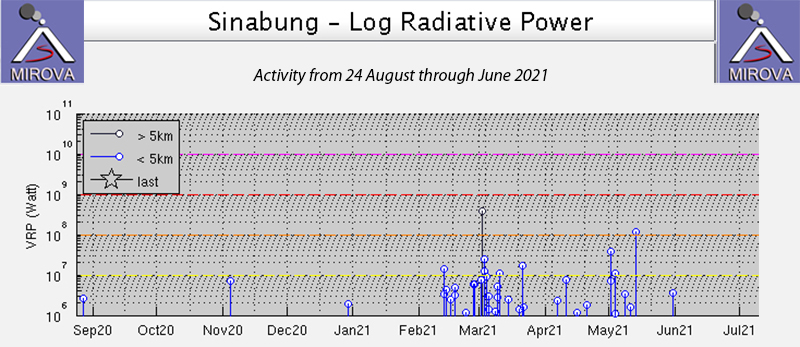 |
Figure 93. An increase in thermal activity at Sinabung during late February-May 2021 corresponded to an increase in explosive activity during the period as shown in the MIROVA graph of Log Radiative Power for 24 Aug 2020 through June 2021. Courtesy of MIROVA. |
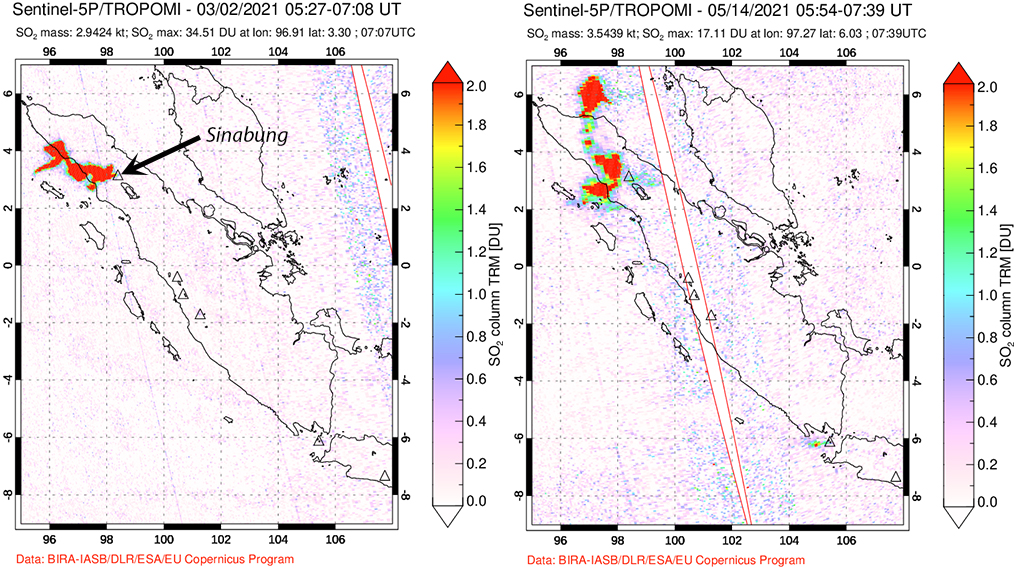 |
Figure 94. High level explosions at Sinabung on 2 March and 13 May 2021 produced significant plumes of SO2 that drifted NW from the volcano and were measured by the TROPOMI Instrument on the Sentinel-5P satellite. The ash plumes were reported at 12.2 km altitude. Courtesy of NASA Global Sulfur Dioxide Monitoring Page. |
Activity during March-June 2021. Significant explosive activity continued at Sinabung during March 2021. In a special press release on 2 March, PVMBG reported a series of pyroclastic flows that began at 0642 local time and traveled 2,000-5,000 m ESE from the summit accompanied by a column of ash that rose 4,000-5,000 m above the body of the pyroclastic flow (figure 95). MAGMA Indonesia reported three explosions that rose to about 1,000 m above the summit and drifted E and SW. The Darwin VAAC first reported that the ash emissions from the eruption rose to 7.6 km altitude (5.1 km above the summit) and drifted W; they were clearly discernable in satellite imagery. About an hour later they updated the altitude of the plume to 12.2 km based on analysis of HIMAWRI-8 imagery. In the following hours the plume was observed drifting W at 12.2 km altitude and SW at 7.6 km before dissipating. According to BNPB ashfall was noted in 17 villages in the Tiganderket District, eight villages in the Kutabuluh District, and 15 villages in the Tigabinaga District.
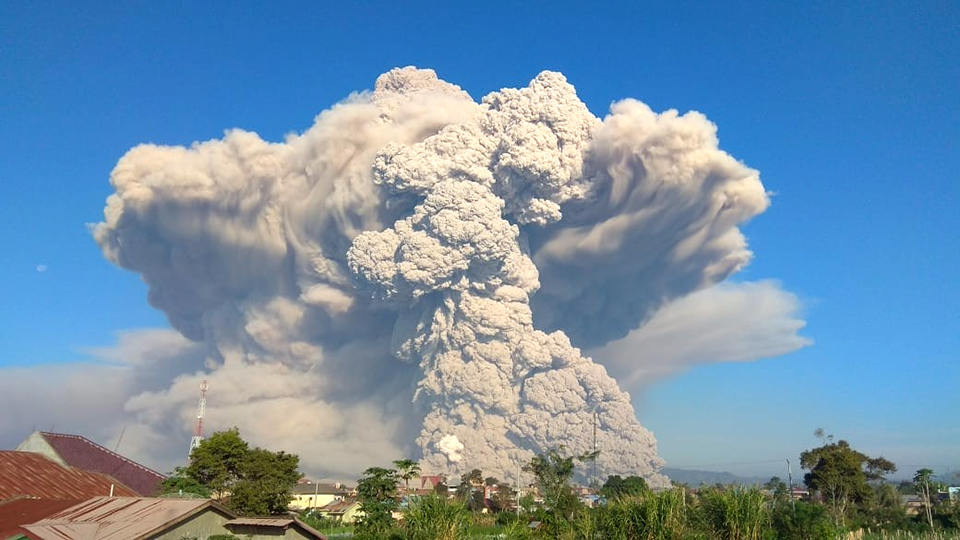 |
Figure 95. This explosion at 0836 local time was one of three at Sinabung on 2 March 2021 that produced 15 pyroclastic flows and ash plumes that rose to 12.2 km altitude according to the Darwin VAAC. The pyroclastic flows descended up to 3.7 km down the SE and E flanks. Photo by PVMBG - Sinabung PGA Post. Courtesy of PVMBG (Press Release Volcanic Activity of Mount Sinabung – North Sumatra March 2, 2021). |
On most days in March steam plumes were observed rising 50-500 m above the summit; they reached 1,000 m high on 7 March. Block avalanches were reported descending the E and SE flanks 500-1,500 m on 12 days of the month. The Sinabung Observation Post reported 49 explosion earthquakes and gray ash emissions. There were 1-2 explosions on most days; six were observed on 11 March (figure 96) that all rose only 500-1,000 m above the summit and drifted W and SW with no ashfall reported. MAGMA Indonesia reported an explosion on 15 March that rose 2,000 m above the summit; the Darwin VAAC could not confirm it in satellite imagery due to meteoric clouds. For the second half of March, 1-4 explosions were reported daily; dense gray ash rose 500-1,000 m above the summit and drifted SW, W, NW, and NE.
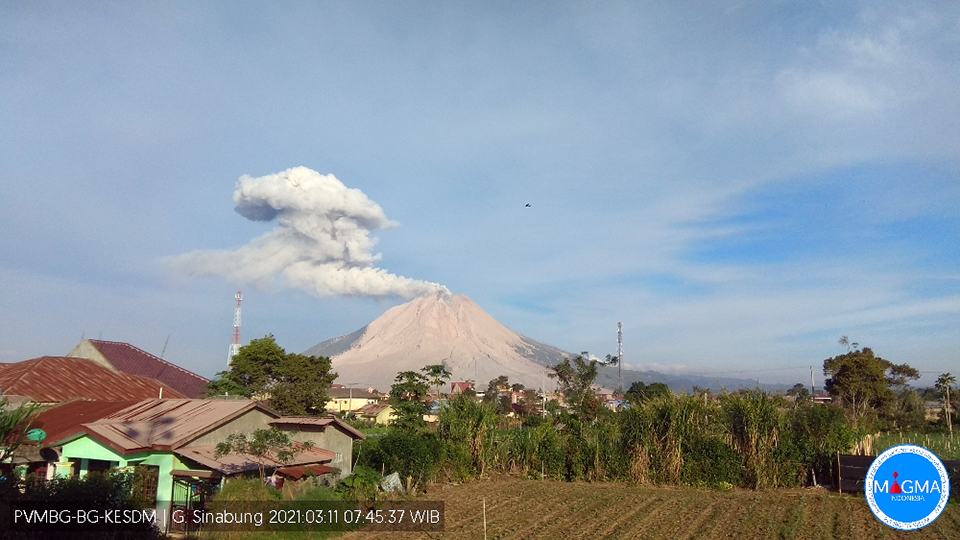 |
Figure 96. Six explosions with ash emissions from Sinabung were reported on 11 March 2021. The plumes rose 500-1,000 m above the summit and drifted S and SW. Courtesy of MAGMA Indonesia. |
MAGMA Indonesia reported 42 eruptions throughout March with dense gray ash emissions that rose 500-2,000 m above the summit and drifted SW, W, or NW. The Darwin VAAC issued 53 ash advisories. VONAs were issued 22 times; two on 2 and 11 March were for pyroclastic flows, the others were for ash plumes from explosions. There were 20 pyroclastic flows reported by PVMBG during the month; 15 of them occurred on 2 March when they traveled 1,000-3,700 m down the E and SE flanks and 2,300 m down the S flank (figure 97). One pyroclastic flow was reported on 1 March, and two others were reported on 3 and again on 11 March that traveled 2,000-3,000 m ESE from the summit. Three seismic signals indicative of lahars were recorded on 12, 16, and 18 March.
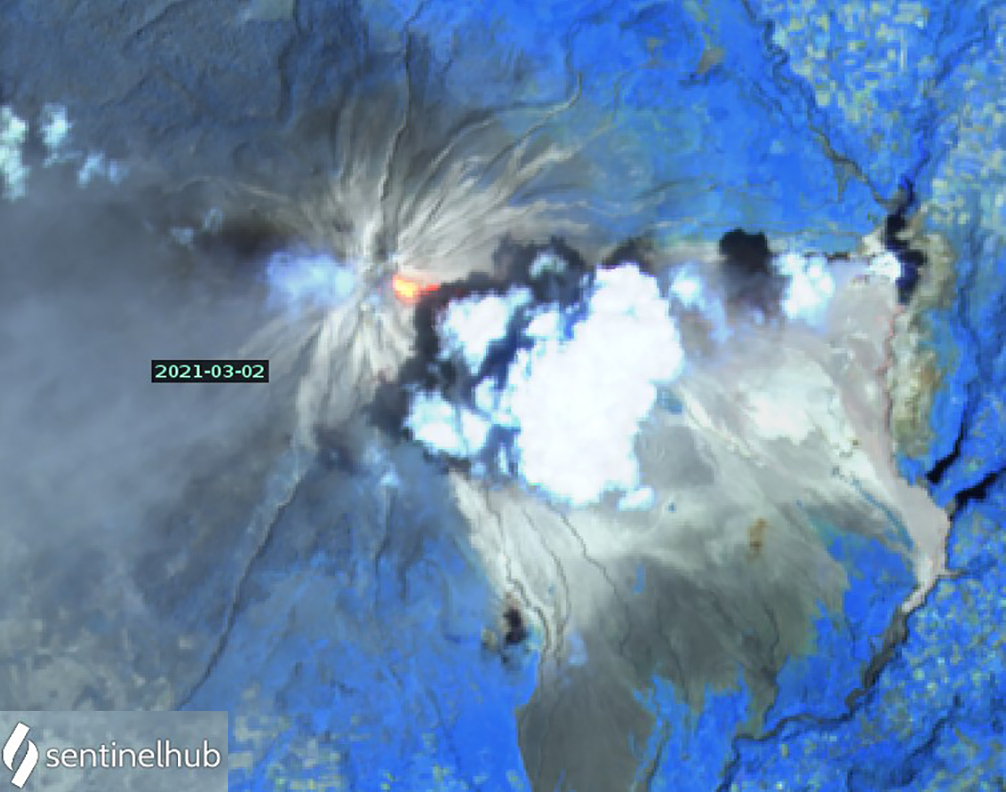 |
Figure 97. A strong thermal anomaly at Sinabung was recorded in Sentinel-2 satellite imagery on 2 March 2021. Its location near the summit on the ESE flank suggests it was related to one of the 15 pyroclastic flows observed that day. Image uses Atmospheric penetration rendering (bands 12, 11, 8a). Courtesy of Sentinel Hub Playground. |
The frequency of explosive activity increased significantly during April 2021. Block avalanches were reported on 15 days, traveling 500-1,500 m down the S and SE flanks. PVMBG reported 123 eruptions with gray ash plumes rising 500-1,000 m above the summit. VONA’s were issued for 30 events. MAGMA Indonesia reported 74 explosions with dense gray ash emissions rising 500-2,000 m above the summit. There were 1-10 explosions nearly every day; only two days had no explosions reported. Eight explosions were reported on 2 April with heights of 500-1,000 m above the summit. On 4 April PVMBG reported an ash emission to 3.7 km altitude, but the Darwin VAAC revised that estimate to 5.5 km based on satellite infrared temperature data (figure 98). During 7-8 April the VAAC reported ash emissions at 4.3 km altitude. MAGMA Indonesia reported eight explosions on 17 April with plume heights ranging from 500 to 1,500 m above the summit, drifting S and W. On 19 April emissions were reported by the Darwin VAAC drifting SE at 4.6 km altitude; they reached 4.3 km on 24 April. For the remainder of the month six or more explosions occurred most days, with altitudes of 3.0-3.9 km. Seven pyroclastic flows were reported during April. On 1 April, one traveled 1,500 m down the SE flank. One was reported on 8 April, two on 13 April, and one each on 19, 21, and 29 April. The pyroclastic flow on 21 April traveled 2,000 m down the flank. Signals indicating lahars were recorded on 12, 16, 24, 29, and 30 April.
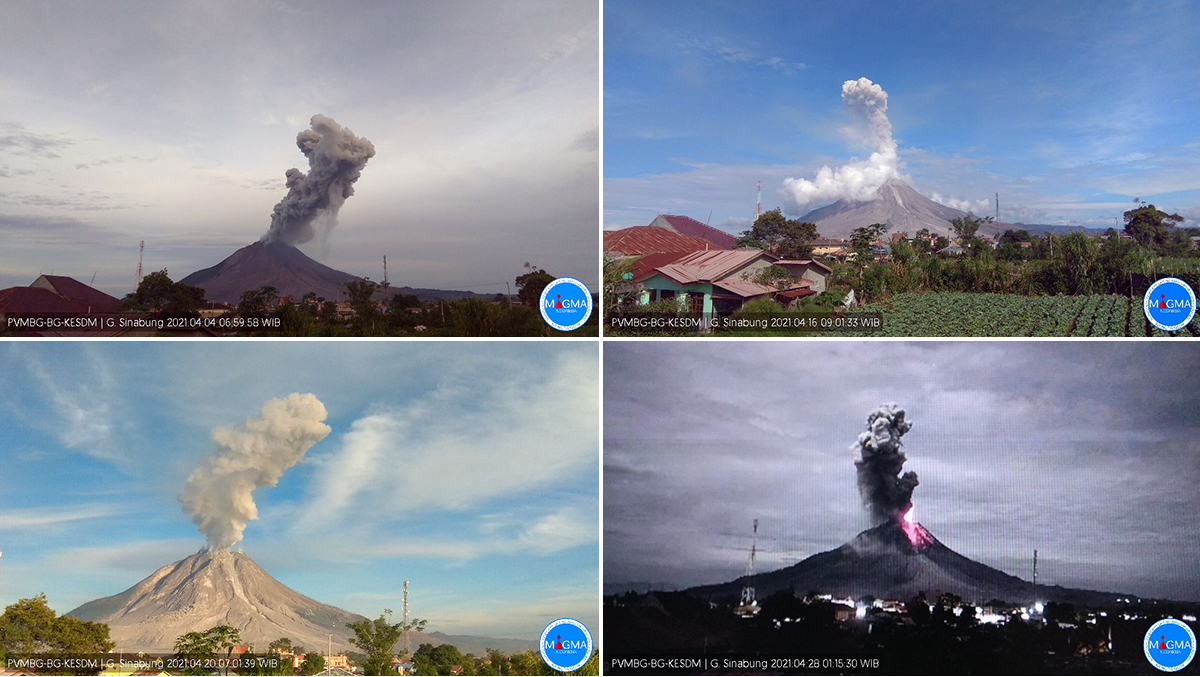 |
Figure 98. PVMBG reported 123 explosions with ash at Sinabung during April 2021, including four on 4 April (top left), five on 16 April (top right), nine on 20 April (bottom left), and six on 28 April (bottom right). Courtesy of MAGMA Indonesia and PVMBG. |
Substantially fewer explosions were reported during May 2021 than April, although the ash plumes were higher for several events. The Sinabung Observation Post reported 37 explosions that produced gray ash plumes rising 500-3,000 m above the summit; 1-6 explosions occurred daily through 14 May; a single explosion on 19 May was the last one recorded for the month. The ten VONA’s also recorded plume heights 700-3,000 m. MAGMA Indonesia reported 26 seismic events with dense gray emissions ranging from 500-3,500 m high. During 6-10 May ash emissions were reported 2,000 m or higher above the summit each day; six explosions were reported by PVMBG and MAGMA Indonesia on 8 May. The Darwin VAAC noted that ash plumes on 6 May rose to 4.6 km altitude. The next day the emissions rose to 5.2-5.5 km altitude and were discernable late in the day drifting NNW in RGB satellite imagery. On 8 May the ash plumes were reported at 4.3-5.2 km altitude drifting E; on 10 May two discrete events rose to 4.9 and 3.7 km and drifted S, both noted in satellite imagery (figure 99). Four explosions were reported on 11 May. Sentinel-2 satellite imagery recorded incandescent material in the large SE flank ravine that day (figure 100).
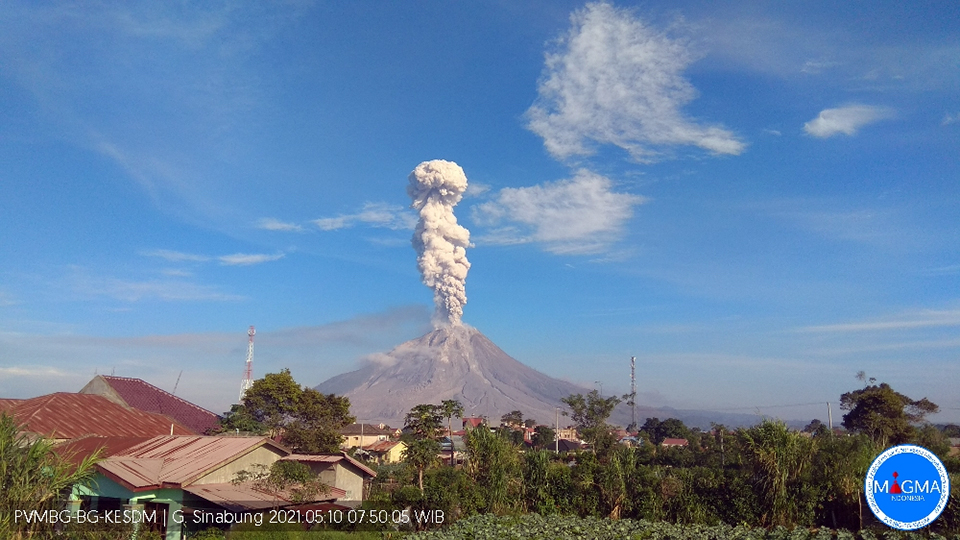 |
Figure 99. Three explosions at Sinabung on 10 May 2021, including this one at 0750 local time produced ash emissions that rose up to 2,500 m above the summit (4.9 km altitude) and drifted S. Courtesy of MAGMA Indonesia and PVMBG. |
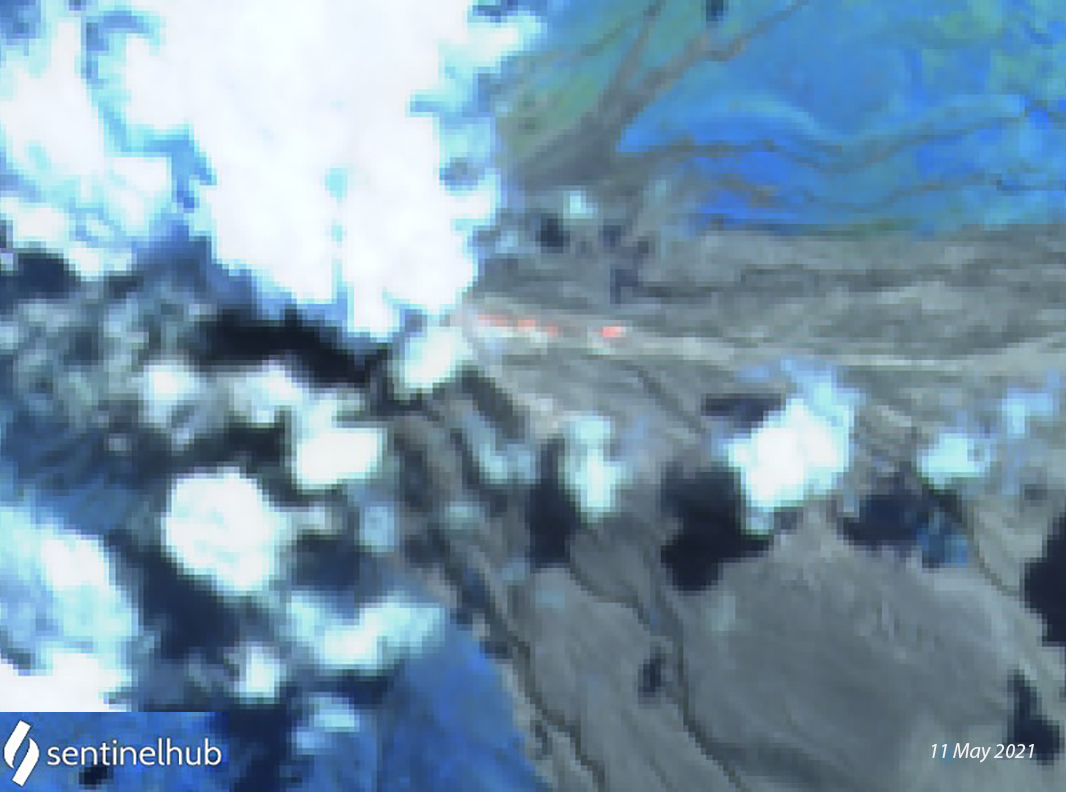 |
Figure 100. Four explosions were reported at Sinabung on 11 May 2021; a thermal anomaly extended hundreds of meters down the SE flank ravine in this Sentinel-2 satellite image. Image uses Atmospheric penetration rendering (bands 12, 11, 8a). Courtesy of Sentinel Hub Playground. |
During 13-14 May six explosions and 15 pyroclastic flows were reported by PVMBG with ash plumes 700-1,000 m above the summit, and pyroclastic flows descending the SE and E flanks 2,500-4,000 m. A larger eruption with ash to 12.2 km that drifted NW, clearly identifiable in satellite imagery, was reported by the Darwin VAAC on 13 May. A second explosion three hours later produced a plume that was identifiable in RGB satellite imagery at 9.8 km altitude moving WNW. Eruptions were ongoing on 14 May, with plumes rising to 9.1-10.7 km altitude and drifting NW (figure 101). A significant SO2 plume was measured by satellite instruments that day. A single large explosion early on 19 May (local time) produced an ash plume to 3,500 m above the summit (5.9 km altitude). The Jakarta Meteorological Office reported the eruption to the Darwin VAAC but it was not visible in satellite imagery due to meteoric clouds. This was the last explosion reported for May. Five lahars were recorded during the month; one each day on 12, 15, and 16 May, and two on 13 May.
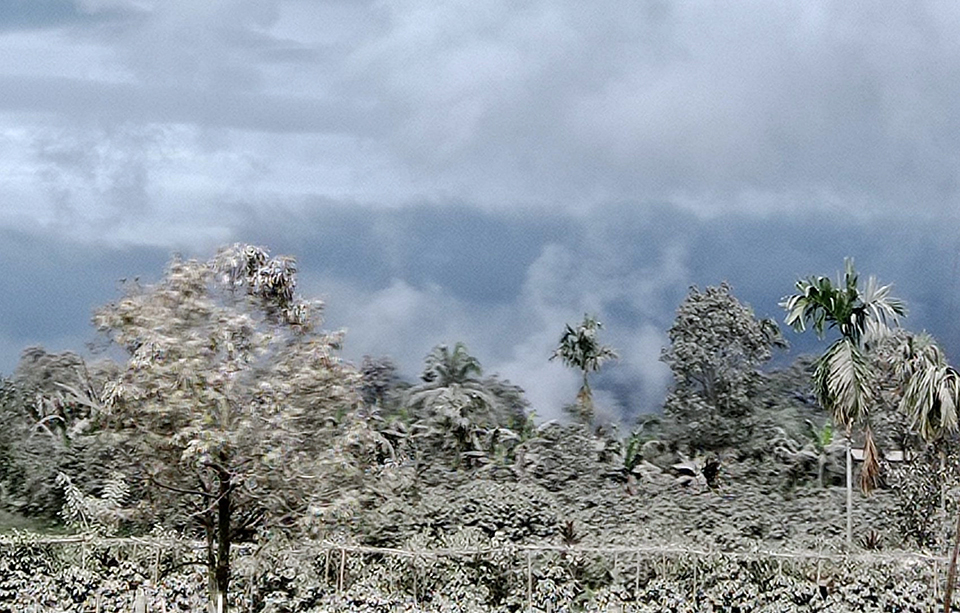 |
Figure 101. This photo was posted to Twitter on 15 May 2021 with the caption “..areas affected by the eruption of Mount Sinabung” and likely represents ashfall from the large explosions of 13-14 May 2021. Courtesy of amoy rest buying. |
Very little activity was reported from Sinabung during June 2021. Steam emissions rose 50-300 m above the summit on most days, occasionally rising to 500 m. Block avalanches were reported only on 11 and 12 June. PVMBG reported two seismic eruption events, on 3 and 5 June, but they were not observed. A single pyroclastic flow occurred on 6 June, the only day a single VONA was issued. MAGMA Indonesia reported two eruption events on 4 June and one on 6 June; none were observed due to poor weather conditions. The Darwin VAAC reported a significant eruption on 6 June that sent an ash plume to 9.1 km altitude that drifted W. Initially it was not visible, but later appeared on RGB satellite imagery moving N and W. A few hours after the eruption the plume was drifting N at 4.3 km altitude, W at 7.3 km, and WSW at 9.1 km. It dissipated the following morning, and was the last explosion reported for June. Lahars were recorded on 3, 15, and 25 June.
Geological Summary. Gunung Sinabung is a Pleistocene-to-Holocene stratovolcano with many lava flows on its flanks. The migration of summit vents along a N-S line gives the summit crater complex an elongated form. The youngest crater of this conical andesitic-to-dacitic edifice is at the southern end of the four overlapping summit craters. The youngest deposit is a SE-flank pyroclastic flow 14C dated by Hendrasto et al. (2012) at 740-880 CE. An unconfirmed eruption was noted in 1881, and solfataric activity was seen at the summit and upper flanks in 1912. No confirmed historical eruptions were recorded prior to explosive eruptions during August-September 2010 that produced ash plumes to 5 km above the summit.
Information Contacts: Pusat Vulkanologi dan Mitigasi Bencana Geologi (PVMBG, also known as Indonesian Center for Volcanology and Geological Hazard Mitigation, CVGHM), Jalan Diponegoro 57, Bandung 40122, Indonesia (URL: http://www.vsi.esdm.go.id/); MAGMA Indonesia, Kementerian Energi dan Sumber Daya Mineral (URL: https://magma.esdm.go.id/v1); Badan Nasional Penanggulangan Bencana (BNPB), National Disaster Management Agency, Graha BNPB - Jl. Scout Kav.38, East Jakarta 13120, Indonesia (URL: http://www.bnpb.go.id/); NASA Global Sulfur Dioxide Monitoring Page, Atmospheric Chemistry and Dynamics Laboratory, NASA Goddard Space Flight Center (NASA/GSFC), 8800 Greenbelt Road, Goddard, Maryland, USA (URL: https://so2.gsfc.nasa.gov/); Sentinel Hub Playground (URL: https://www.sentinel-hub.com/explore/sentinel-playground); MIROVA (Middle InfraRed Observation of Volcanic Activity), a collaborative project between the Universities of Turin and Florence (Italy) supported by the Centre for Volcanic Risk of the Italian Civil Protection Department (URL: http://www.mirovaweb.it/); amoy rest buying (URL: https://twitter.com/jjaemshine/status/1393531437949743111).