Report on Kilauea (United States) — January 2022
Bulletin of the Global Volcanism Network, vol. 47, no. 1 (January 2022)
Managing Editor: Edward Venzke.
Edited by Kadie L. Bennis.
Kilauea (United States) New eruption in the lava lake at Halema’uma’u during September-December 2021
Please cite this report as:
Global Volcanism Program, 2022. Report on Kilauea (United States) (Bennis, K.L., and Venzke, E., eds.). Bulletin of the Global Volcanism Network, 47:1. Smithsonian Institution. https://doi.org/10.5479/si.GVP.BGVN202201-332010
Kilauea
United States
19.421°N, 155.287°W; summit elev. 1222 m
All times are local (unless otherwise noted)
Kīlauea is the southeastern-most volcano in Hawaii and overlaps the E flank of the Mauna Loa shield volcano. Its East Rift Zone (ERZ) has been intermittently active for at least 2,000 years. An extended eruption period began in January 1983 and was characterized by open lava lakes and lava flows from the summit caldera and the East Rift Zone. During May 2018 lava migrated into the Lower East Rift Zone (LERZ) and opened 24 fissures along a 6-km-long NE-trending fracture zone that produced lava flows traveling in multiple directions. Lava fountaining was reported in these fissures and the lava lake in Halema’uma’u crater drained (BGVN 43:10).
The previous eruption period, during December 2020-May 2021 in Halema’uma’u crater, included a lava lake, lava flows, fountaining, and gas-and-steam emissions (BGVN 46:06). During January 2021 a levee developed around the perimeter of the lake, creating what is known as a “perched” lake with the center elevated above a moat near the crater wall. The E half of the lake became stagnant and crusted over with cooled lava, allowing the active W half of the lake to rise slightly higher. A new eruption period with similar activity that started in September is described here through December using daily reports, volcanic activity notices, and abundant photo, map, and video data from the US Geological Survey's (USGS) Hawaiian Volcano Observatory (HVO).
Activity during June-August 2021. Activity during June through August was relatively low and consisted primarily of low sulfur dioxide emissions and an increase in the number of earthquakes during August. On 12 August the sulfur dioxide emission rate was 50 tons/day (t/d), which was close to levels associated with the non-eruptive period from late 2018 to late 2020 (less than 50 t/d) and significantly lower compared to the 800 t/d measured during mid-February to mid-April. An earthquake swarm was recorded beneath the S part of the caldera at 1630 on 23 August and continued into the early morning of 25 August. The swarm increased in intensity at 0130 on 24 August and was accompanied by an increase in the rate of ground deformation to the W, as recorded by the Sandhill tiltmeter. Over 275 earthquakes were recorded during this swarm, the largest of which was Mw 3.3; the majority were less than Mw 1. Small earthquakes continued at a rate of at least 10 per hour and peaked at 28 events between 1900 and 2000 on 24 August. The rate of earthquakes decreased to 5-12 during 25 August, and by 26 August ground deformation levels had also decreased. HVO reported that ground deformation beneath the S part of the caldera had stopped on 30 August and the earthquake rate decreased during 30-31 August.
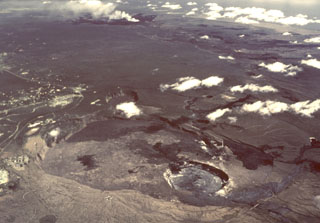
Activity during September 2021. No significant activity was reported through most of September until the 29th, when HVO detected an increase in earthquakes activity and a change in ground deformation. At approximately 1520 that day incandescence appeared in the summit webcam images, in addition to new fissures on the floor of Halema’uma’u crater that generated lava flows (figure 498). A photo taken at 1615 showed a large plume comprised of steam, carbon dioxide, and sulfur dioxide rising from the fissures. Measurements taken just after the eruption began showed that the rate of the sulfur dioxide emissions was high at around 85,000 t/d. At about 1640 another fissure with several vents opened on the inner W wall of the crater and produced low lava fountains and flows that descended to the crater floor (figure 499). Lava from both fissures pooled on the solidified lava lake surface that quickly began to overturn and form a lava lake. Tephra was deposited in areas SW of the crater. The tallest fountain was near the S end of the lava lake and rose 20-25 m during the night of 29-30 September. Scientists on a helicopter overflight at 0730 on 30 September determined that the lake was about 980 m E-W and 710 m N-S, covering an estimated 52 hectares (figure 500). The W wall was visible, and several fountains rose from the fissure in the center of the lake. Sulfur dioxide rates remained high at around 20,000 t/d. Overnight during 30 September-1 October the fountains rose as high as 15 m above the dominant vent on the W wall, based on reports from field crews (figure 501). In total, the surface of the lava lake had risen 24 m by the morning of 1 October since the eruption began. Cooled and crusted parts of the lake’s surface overturned, also referred to as “overfoundered.” Sulfur dioxide emissions remained high, though had decreased slightly to 12,900 t/d.
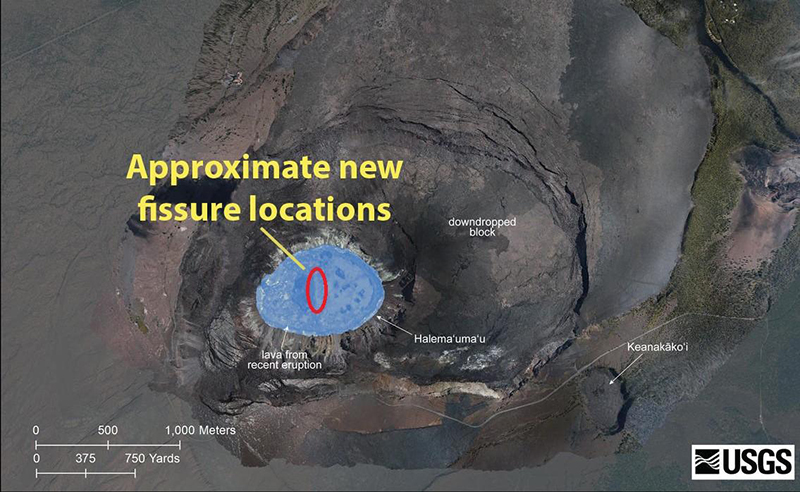 |
Figure 498. An aerial photo of Halema’uma’u crater at Kīlauea’s summit crater on 29 September 2021. Webcam imagery showed fissures at the base of the crater (highlighted with the red circle). Aerial image was taken prior to the reactivation of the lake. Cooler temperatures are blue and warmer are shown in red. Aerial imagery copyright 2018 DigitalGlobe Nextview license. Annotated image courtesy of M. Patrick, USGS. |
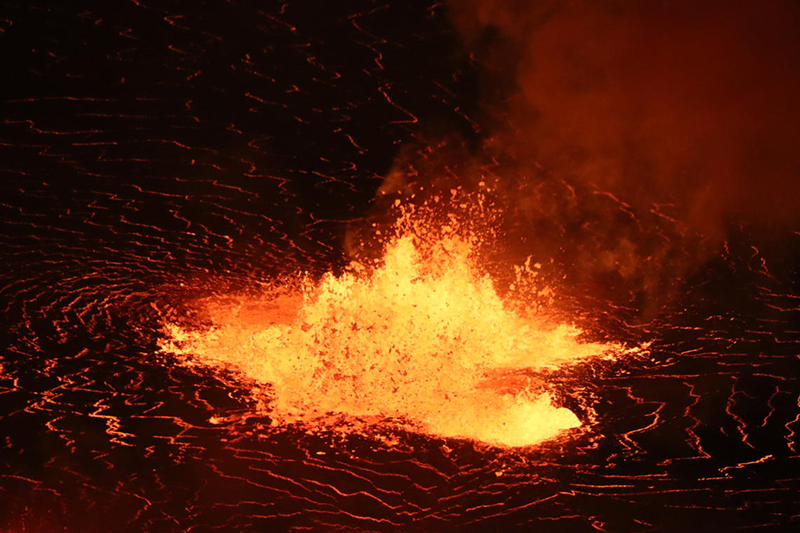 |
Figure 499. Telephoto image of one of the low lava fountains near the center of Halema’uma’u crater lava lake at the Kīlauea summit crater taken on 29 September 2021. Courtesy of M. Patrick, USGS. |
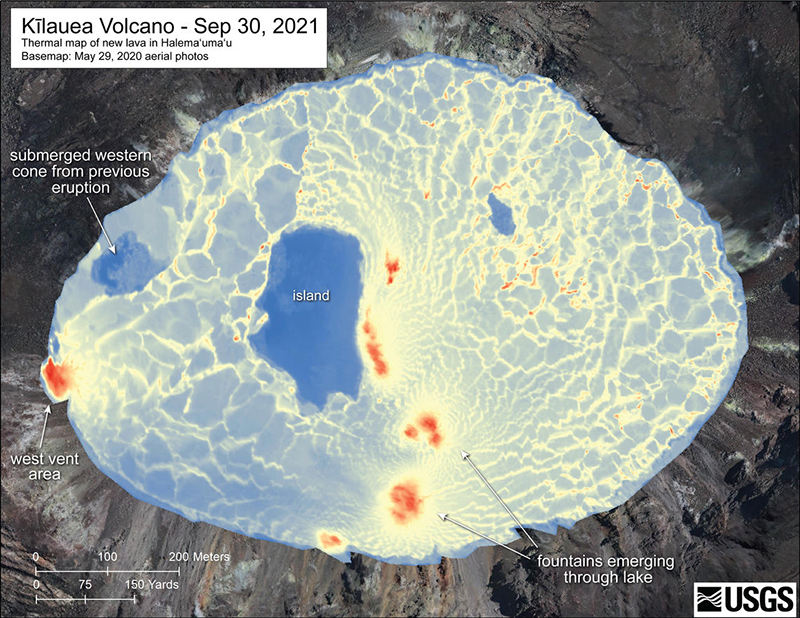 |
Figure 500. Thermal map of the Halema’uma’u crater at the summit of Kīlauea based on aerial visual and thermal imagery taken from a helicopter at 0730 on 30 September 2021. Cooler temperatures are blue and warmer are shown in red; the red spots indicate where lava fountains had emerged through the lava lake surface, and the active W vent area. The dimensions of the lava lake are 980 m E-W and 710 m N-S, an area of about 52 hectares. Annotated image courtesy of M. Patrick, USGS. |
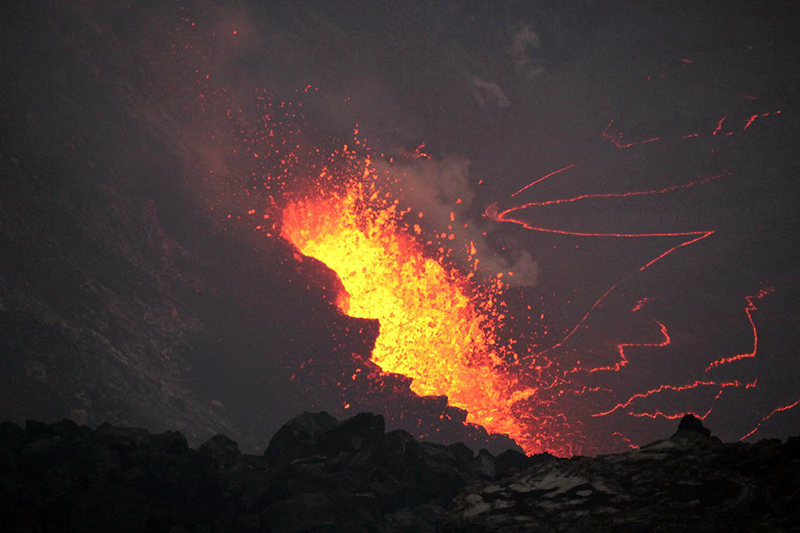 |
Figure 501. Photo of Halema’uma’u crater at the summit of Kīlauea at 1800 on 30 September 2021 showing vigorous fountaining activity at the new vent on the western crater wall. This view is from the south caldera rim looking to the W. The fountain here is approximately 15 m high, measured over a five-minute interval. Courtesy of K. Lynn, USGS. |
Activity during October 2021. The lake had risen another 2 m by the morning of 2 October for a total of 26 m since the start of the eruption, though the rate of the rise in the lava lake surface has slowed (figure 502); fountains were 7 m tall at the main W wall vent and rose 1-2 m at the S vents, based on observations from field crews. A burst of fountain spattering on the morning of 2 October rose 50-60 m high. On 3 October the sulfur dioxide rate was 14,750 t/d and the lava lake had risen 27 m, partially submerging the fountaining fissures and building a cone around the W vent. The W vent remained the most vigorous during 3-4 October; lava fountains rose 10-15 m with occasional bursts to 20 m and a 12-m-high spatter cone had formed. In the S and central parts of the lake, including along a fissure 35-42 m long, fountains rose 5-10 m. The W end of the lava lake was 1-2 m higher than the E part and the S end was approximately 2-3 m higher than the N end. The active lava lake surface was perched 1-2 m above a 20-m-wide ledge that extended outward to the Halema’uma’u crater wall.
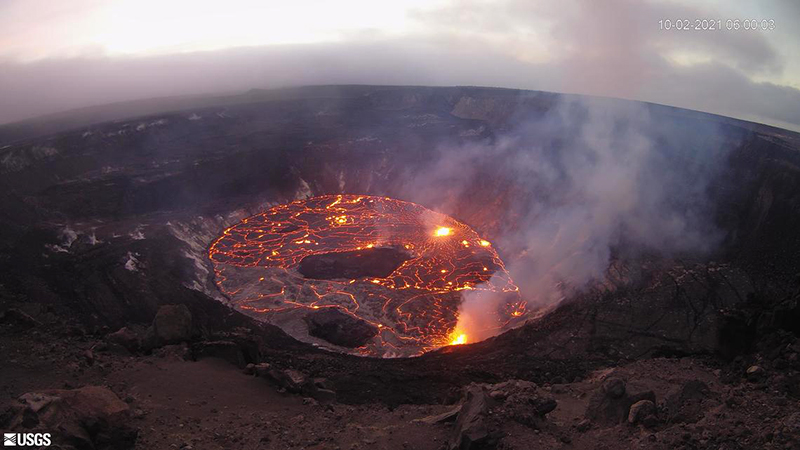 |
Figure 502. Webcam image of Halema’uma’u crater at the summit of Kīlauea taken at 0600 on 2 October 2021 showing the active lava lake that is slowly filling the crater. The W vent in the crater is located to the bottom right. Courtesy of USGS, HVO. |
A VONA report on 4 October described vigorous fountaining up to 50-60 m high that produced significant amounts of pumice, Pele’s hair, and fragments of volcanic glass that were deposited downwind along the rim and beyond the crater. Sulfur dioxide emissions decreased from 85,000 to 7,000-9,000 t/d by 4 October. The central island and several of the smaller eastern islets from the 2020 lava lake were also visible on the lake surface; the smaller islets were covered at the beginning of the eruption but have since re-emerged. A dark ring of cooled lava around the central island was from the partial submersion at the beginning of the eruption.
The surface of the lava lake continued to rise each day by about 1 m, and the depth of lava filling in the lake was 256 m with a surface elevation of 774 m by 6 October. The W vent remained the most vigorous source of lava effusion, where fountains were rising 12-16 m high and bursts to 20 m. The cone building around the W vent had an opening to the E that effused lava to the lake (figure 503). The active vent in the S part of the lake sustained fountains that rose 1-5 m but was no longer active by 8 October. Overturning of the lake’s surface was mainly focused on the W part of the lake. The lava fountain height at the W vent was variable; on 11 October it ranged from 4 to 35 m. The total lava volume erupted since the start of the eruption was an estimated 19.9 million cubic meters on 15 October. Fountains during late October were typically less than 12 m high, according to field crews. The spatter cone that built up around the W vent was approximately 10 m wide. On 29 October field crews reported that fountaining had been replaced by low roiling in the lake and spatter from the W vent. The sulfur dioxide emissions were as high as 6,800 t/d on 12 October but continued to fluctuate up to 1,600 t/d on 16 October.
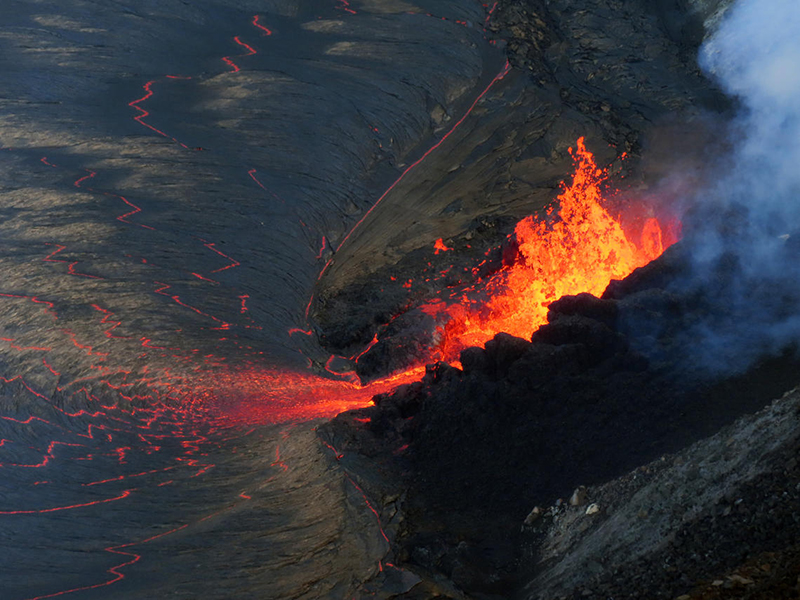 |
Figure 503. Photo of the W vent at Kīlauea showing lava fountaining rising 12 m high on 6 October 2021. A spatter cone had built up around the vent and has an opening to the E. Photo taken from the NW rim looking S. Courtesy of K. Lynn, USGS. |
Activity during November 2021. Lava continued to erupt from a vent in the W wall of Halema’uma’u crater, though it was described as roiling and spatter activity that fed the lake rather than fountaining (figure 504). The W end of the crater had a maximum elevation of 795 m, based on data from HVO’s laser rangefinder on 1 November; the lake had risen roughly 51 m since 29 September and continued to rise by roughly 1 m/day. The lava lake continued to have about 7-8 m of elevation difference between the active W vent and the stagnant E part. On 3 November the spatter reached 6 m high, and lava was frequently thrown over the edge on the vent cone. The total volume of lava erupted as of 3 November was about 28.2 million cubic meters. The short channel from the vent to the lake crusted over on 4 November. HVO reported that the E edge of the lake was level with the lowest down-dropped blocks from the 2018 collapse event. Activity briefly decreased on 8 November; SO2 emissions decreased to 250 t/d and webcams showed minimal spatter in the W vent. Activity resumed at normal levels the next day; webcam images showed spatter and ponded lava in the W vent and an increase in the active lava surface area. Lava sporadically oozed out along the cooler outer lake margins (figure 505). By 16 November the total erupted volume was roughly 30 million cubic meters (figure 506). A brief increase in effusion on 22 November lasted a few hours. According to HVO, the area of the lava lake decreased greatly in size for about 9 hours during the late afternoon on 24 November but recovered by the early morning on 25 November. Webcams showed spatter and ponded lava within the W vent and an overflow on the S side of the cone. Sulfur dioxide emissions varied, ranging from 1,200 t/d on 29 November to 6,400 t/d on 23 November; the average rate was 3,000 t/d during the month.
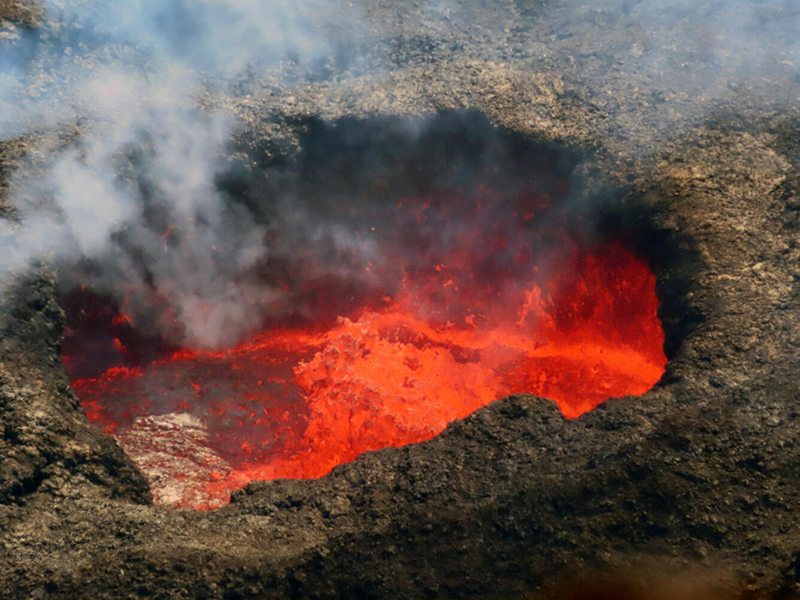 |
Figure 504. Telephoto image of the W vent of Halema’uma’u crater at the summit of Kīlauea taken on 9 November 2021 where spatter bursts in triggered movement on the lava surface. Spattering rose 6-9 m and occasional ejecta fell onto the rim of the cone. Courtesy of USGS, HVO. |
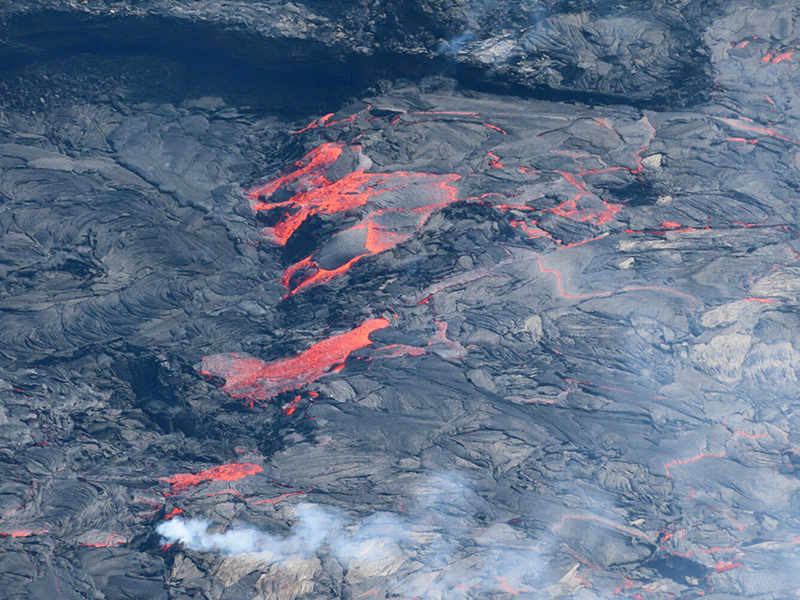 |
Figure 505. Telephoto image of the W lava lake at Halema’uma’u crater at the summit of Kīlauea taken at 1000 on 9 November 2021. The active lava lake (right) is flowing onto an area of cooled solidified crust (left). The inactive part of the lake surface is about 4 m lower than the active one. Courtesy of J. Schmith, USGS. |
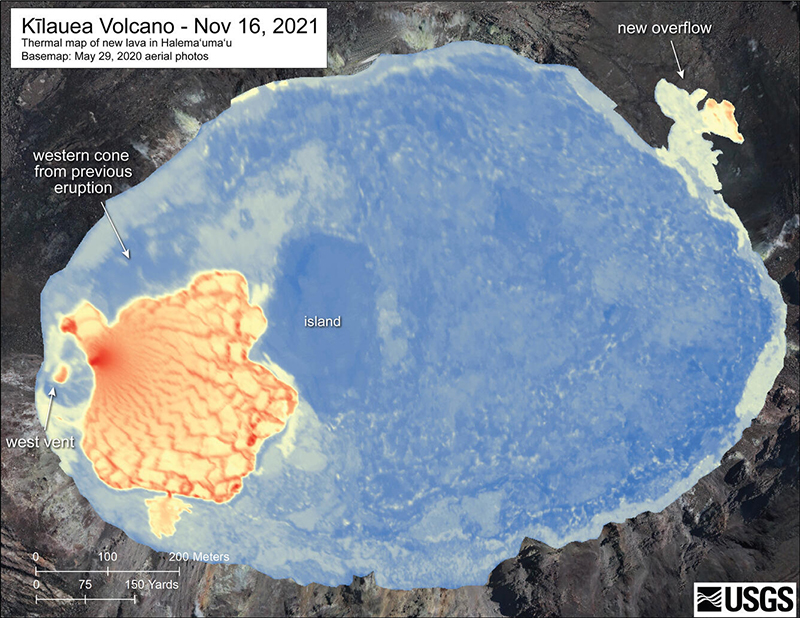 |
Figure 506. Aerial and thermal image of Halema’uma’u crater at the summit of Kīlauea based on observations made during a helicopter overflight on 16 November 2021 at 0830. A crater within the W vent cone contained a small spattering lava pond that was notably warmer. The thermal image shows the extent of the new lava extruded into the lake since the start of the eruption. The active lava lake in the W part of the crater is about 300 m in diameter. The E part of the lake is solidified at the surface, though some lava extrusions can be observed along the perimeter of the lake as the surface continues to rise. The new lava flow due to the new breakouts on the down-dropped block N and E of Halema’uma’u is visibly warmer. Cooler temperatures are blue and warmer are shown in red. Courtesy of HVO, USGS. |
Activity during December 2021. Eruptive activity continued during December in Halema’uma’u crater, where lava effused from the W wall vent. The E end of the lake continued to advance onto the down-dropped block on the caldera floor while the W end stood at an elevation of 809 m, based on data from HVO’s permanent laser rangefinder; the total increase in elevation was about 65 m since 29 September. Spatter and ponded lava within the W vent persisted (figure 507), in addition to occasional oozes of lava along the outer lake margins, according to webcam data. HVO reported that between 1600 and 1800 on 3 December the rate of lava effusion sharply decreased, and around 1700 a small portion of the vent cone collapsed. Only a few small hotspots were visible around the vent area. Lava re-entered the vent and resumed erupting between 1730 and 1800 on 6 December. The rate sulfur dioxide emissions varied from 3,500 t/d on 9 December to 125 t/d on 13 December.
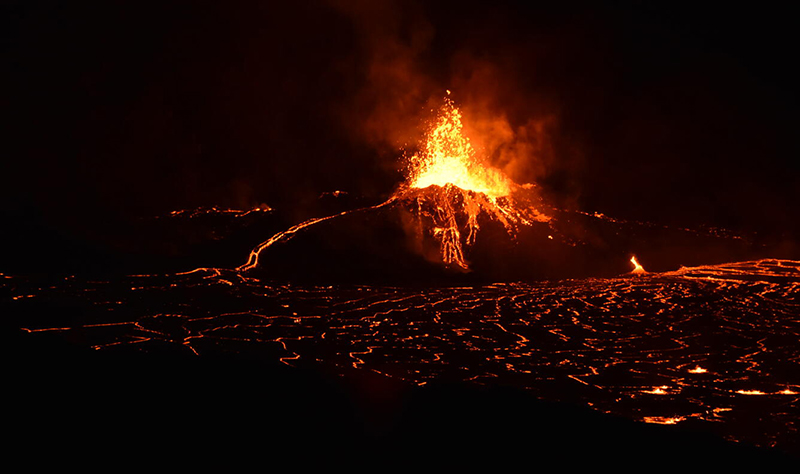 |
Figure 507. Photo of lava erupting from the W vent in Halema’uma’u crater at the summit of Kīlauea, including large spatter bursts on 15 December 2021. Courtesy of B. Carr, USGS. |
On 20 December the lava effusion rate began to decrease following a strong deflationary event. By 21 December lava had stopped erupting from the W vent, though incandescence was still visible. The surface of the lake had mostly crusted over, except for a section N of the vent that was less than 50 m in diameter, following a sequence of partial overturning on 20 December; the lake had risen 69 m since the start of the eruption. Measurements from a helicopter overflight during the morning of 21 December indicated that the total lava volume erupted was 38 million cubic meters (figure 508).
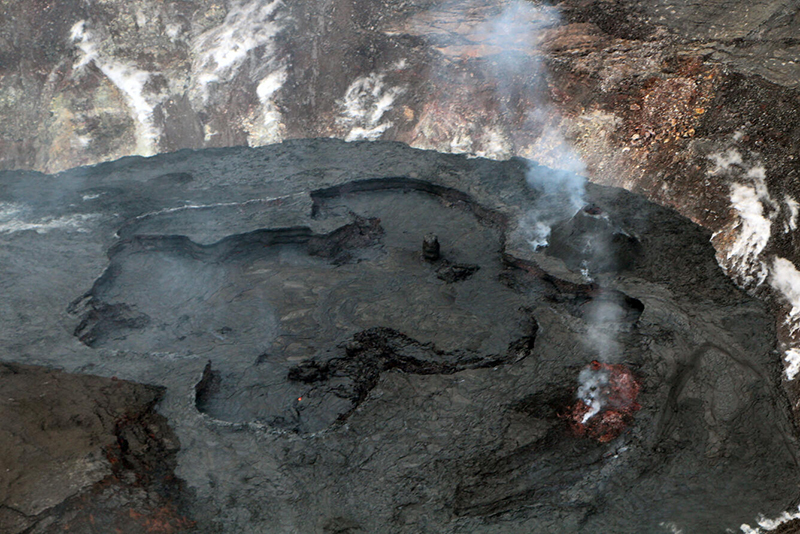 |
Figure 508. Aerial photo of the W part of Halema’uma’u crater at the summit of Kīlauea taken during a helicopter overflight on 21 December 2021. Activity at the lake has paused and only a weak gas-and-steam plume was observed from the W vent (center right). Just N of the vent (toward the bottom of the photo) a small lava pond remained weakly active. The general N direction points to the bottom of the image. Courtesy of D. Downs, USGS. |
Around 2000 on 22 December new breakouts were observed from the W vent in the lava lake following strong volcanic tremor at 1930; 30 minutes later the summit began to deflate. This renewed activity began to overflow and feed substantial lava flows to the SE onto inactive, crusted-over portions of the lake against the crater wall until midnight. On 24 December the rate of sulfur dioxide emissions rose to 5,300 t/d in the summit region. Lava was detected oozing out from the margins along the crusted-over E part of the lake, including one onto the lowermost down-dropped block from the 2018 caldera collapse. Another strong deflationary event was reported on 25 December, followed by another decrease in lava effusion; the W vent had stopped erupting.
New breakouts were reported around 1910 on 27 December, following a strong volcanic tremor around 1850. Lava began to overflow and feed lava flows that moved N and S onto the inactive, crusted-over parts of the lake surface. The sulfur dioxide rate was approximately 5,000 t/d in the summit region on 28 December. Due to the decreased rate of lava effusion, HVO reported a cooler crust on the outer half of the lake. No overflows from the active lake were observed during 28-29 December, but several lava breakouts occurred along the margins of the N and E part of the lake. There was also occasional minor activity at the vent on the N side of the spatter cone during the morning of 30 December. Activity picked up again at 1445 on 30 December, which included several large overflows onto older lava lake crust in the evening. Strong incandescence was also visible at night. The surface of the lake had risen a total of 70 m since the start of the eruption.
Geological Summary. Kilauea overlaps the E flank of the massive Mauna Loa shield volcano in the island of Hawaii. Eruptions are prominent in Polynesian legends; written documentation since 1820 records frequent summit and flank lava flow eruptions interspersed with periods of long-term lava lake activity at Halemaumau crater in the summit caldera until 1924. The 3 x 5 km caldera was formed in several stages about 1,500 years ago and during the 18th century; eruptions have also originated from the lengthy East and Southwest rift zones, which extend to the ocean in both directions. About 90% of the surface of the basaltic shield volcano is formed of lava flows less than about 1,100 years old; 70% of the surface is younger than 600 years. The long-term eruption from the East rift zone between 1983 and 2018 produced lava flows covering more than 100 km2, destroyed hundreds of houses, and added new coastline.
Information Contacts: Hawaiian Volcano Observatory (HVO), U.S. Geological Survey, PO Box 51, Hawai'i National Park, HI 96718, USA (URL: http://hvo.wr.usgs.gov/).