Report on Etna (Italy) — March 2023
Bulletin of the Global Volcanism Network, vol. 48, no. 3 (March 2023)
Managing Editor: Benjamin Andrews.
Edited by Kadie L. Bennis.
Etna (Italy) New vents and lava flows during November 2022-February 2023
Please cite this report as:
Global Volcanism Program, 2023. Report on Etna (Italy) (Bennis, K.L., and Andrews, B., eds.). Bulletin of the Global Volcanism Network, 48:3. Smithsonian Institution.
Etna
Italy
37.748°N, 14.999°E; summit elev. 3357 m
All times are local (unless otherwise noted)
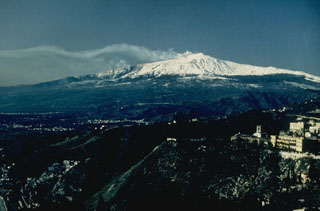
Etna is located on the island of Sicily, Italy, and has had documented records of eruptions dating back to 1500 BCE. Activity frequently originates from multiple cones at the summit, where several craters have formed and evolved. The currently active craters consist of Northeast Crater (NEC), Voragine (VOR), and Bocca Nuova (BN), and the Southeast Crater (SEC); VOR and BN were previously referred to as the “Central Crater”. The original Southeast crater formed in 1978, and a second eruptive site that opened on its SE flank in 2011 was named the New Southeast Crater (NSEC). Another eruptive site between the SEC and NSEC was referred to as the "cono della sella" (saddle cone) and developed during early 2017. The previous eruption period ended in June 2022, which was characterized by Strombolian explosions, ash plumes, lava fountains, and lava flows mainly in the SEC (BGVN 47:07). No activity was reported between July and October 2022. This report covers November 2022 through February 2023 and describes new effusive activity at SEC and gas-and-steam emissions, based on weekly and special reports by the Osservatorio Etneo (OE), part of the Catania Branch of Italy's Istituo Nazionale di Geofisica e Vulcanologica (INGV) and satellite data.
Summary of activity during November 2022-February 2023. A new vent opened on the NE base of Southeast Crater (SEC) at 2.8 km elevation on 27 November 2022 that began to generate a new lava flow that traveled E toward the Valle del Leone. A second vent opened on 30 November, which also began to effuse new lava. As the flows remained active, smaller lava breakouts were detected, branching off from the primary flow. During December the lava flows expanded into both the Valle del Leone and the Valle del Bove, creating a lava flow field. Variable fumarolic degassing was reported at all summit craters (Bocca Nuova (BN), Voragine (VOR), Northeast Crater (NEC), and SEC) throughout the entire reporting period. Modest and sporadic ash emissions were detected at SEC during January through February 2023, though they were rapidly dispersed by the wind. On 6 February 2023, the lava flows stopped, and the flow field began to cool.
A total of 143 MODVOLC thermal alerts were detected during the reporting period: one during November, 16 during December, 106 during January, and 20 during February. Those higher numbers also correlate to spikes that were detected in thermal activity, based on the MIROVA graph, which showed when high thermal activity began, and when it started to decrease (figure 382). The young lava flow that originated from SEC was also visible in Sentinel-2 infrared satellite imagery during late November though early February, moving E and NE (figure 383). Accompanying this strong thermal activity were occasional sulfur dioxide plumes that exceeded 2 Dobson Units (DUs) recorded by the TROPOMI instrument on the Sentinel-5P satellite (figure 384). These plumes generally drifted S, SW, SE, and E.
Table 13. Summary of activity at the four primary crater areas at the summit of Etna during [corrected: November 2022-February 2023]. Information is from INGV weekly reports.
| Month | Bocca Nuova (BN) | Voragine (VOR) | Northeast Crater (NEC) | Southeast Crater (SEC) |
| Nov 2022 | Variable degassing. | Weak fumarolic degassing. | Weak fumarolic degassing. | Variable fumarolic degassing at the crater rim and fractures along the cone. Lava effusions. |
| Dec 2022 | Variable degassing. | Weak fumarolic degassing. | Weak fumarolic degassing. | Weak fumarolic degassing. Lava effusions. |
| Jan 2023 | Variable degassing. | Mild to modest fumarolic degassing. | Mild to modest fumarolic degassing. | Variable fumarolic degassing at the crater rim and fractures along the cone. Lava effusions. Modest and sporadic ash emissions. |
| Feb 2023 | Intense degassing. | Weak degassing. | Weak degassing. | Variable degassing at the crater rim and fractures along the cone. Modest and sporadic ash emissions. |
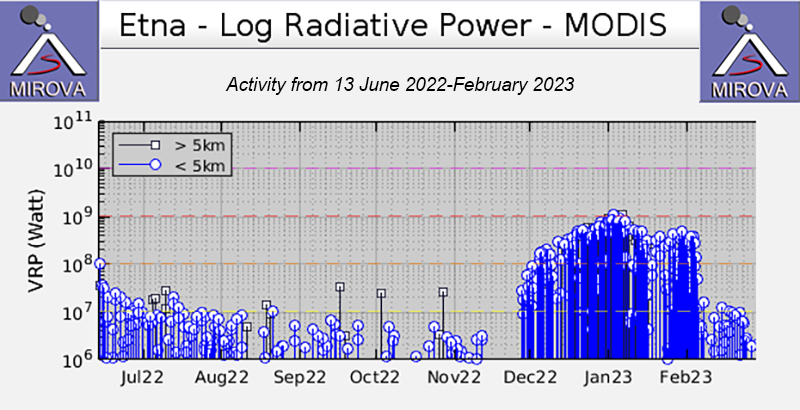 |
Figure 382. A strong pulse in thermal activity at Etna was detected in late November 2022 that continued at high frequency and power through January 2023, based on this MIROVA graph (Log Radiative Power). The sudden spike in activity was represented by a new lava flow that was detected at the NE base of SEC in late November. In early February the lava flows began to stop, which is shown by the visible decrease in thermal activity on this graph. Courtesy of MIROVA. |
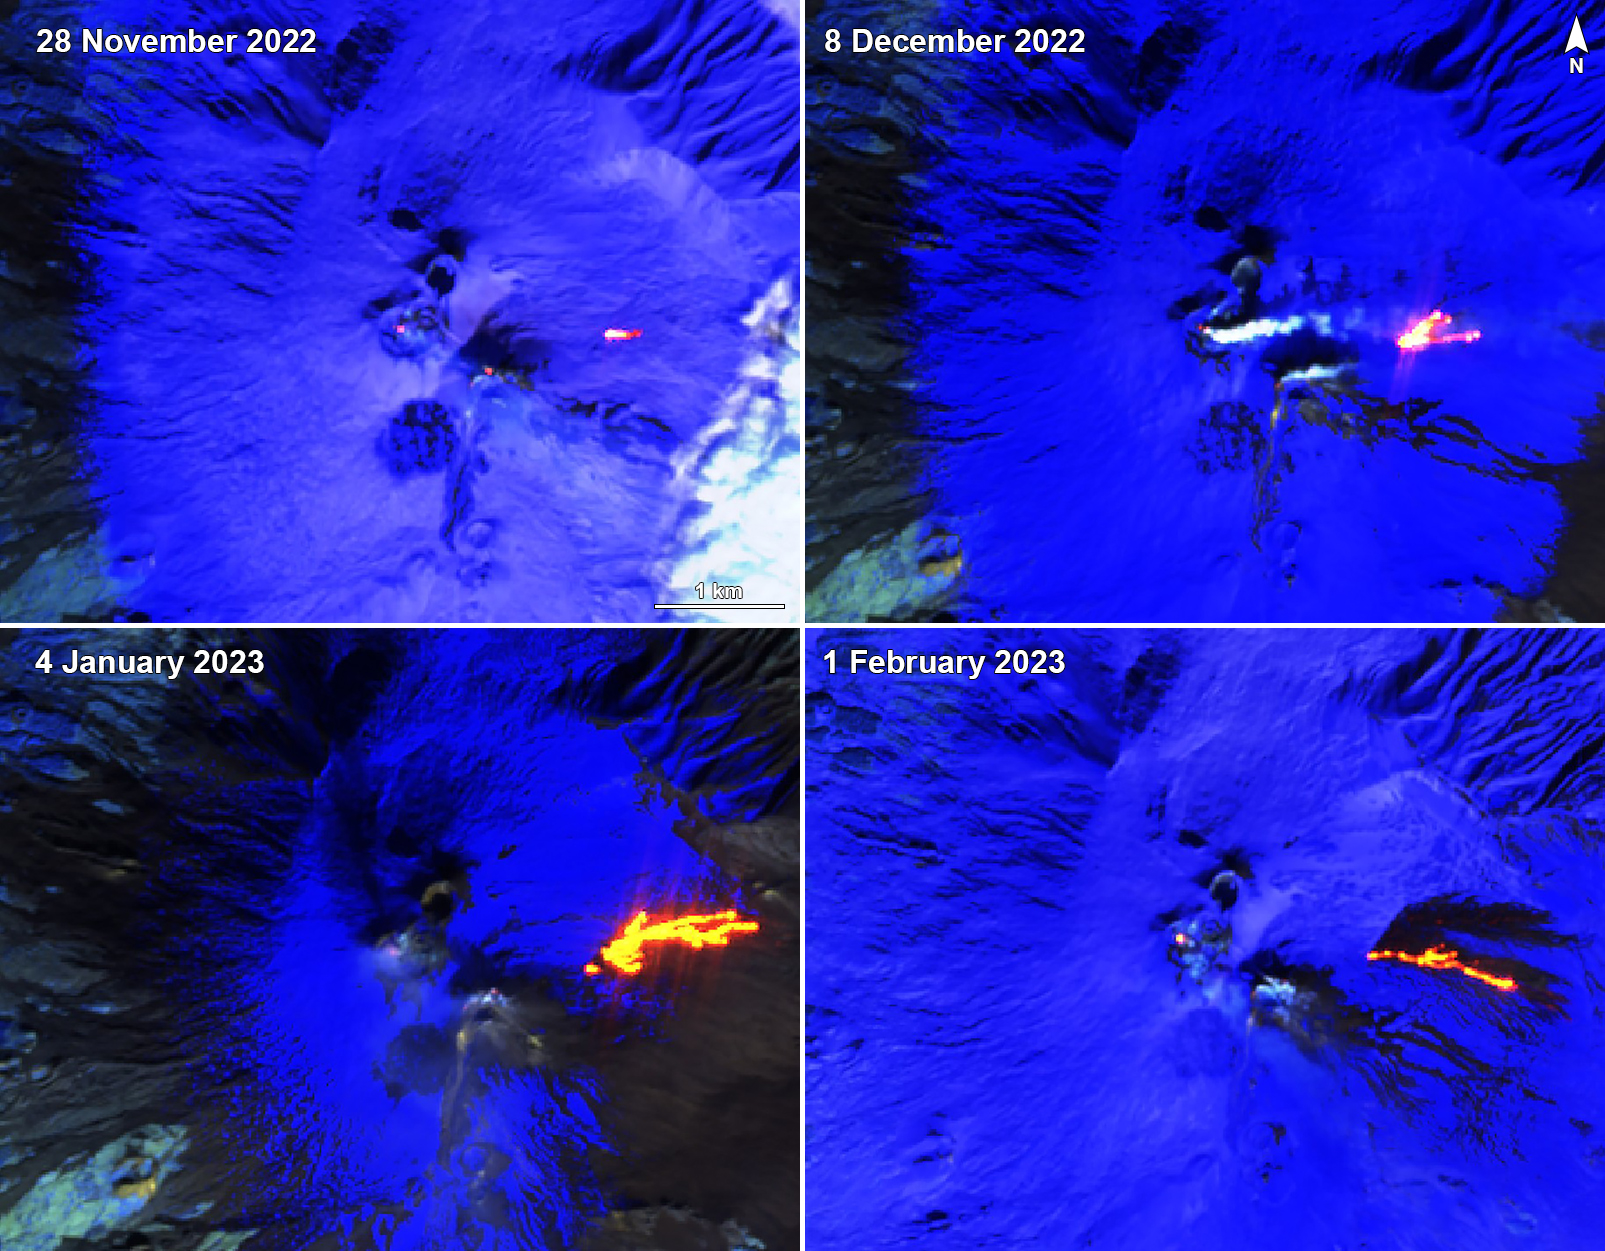 |
Figure 383. Sentinel-2 infrared satellite images showing the beginning of a new lava flow (bright yellow-orange) at Etna’s SEC on 28 November 2022 (top left) that traveled E toward the Valle del Leone. On 8 December 2022 (top right) and 4 January 2023 (bottom left) the lava flow had branched into multiple flows, traveling E and NE. By 1 February 2023 (bottom right) the lava flows continued E, overlapping pre-existing flows, which began to cool (black color). Some hot gas-and-steam emissions were also visible at the other summit craters, as seen on 8 December. Images use “Atmospheric penetration” rendering (bands 12, 11, 8a). Courtesy of Sentinel Hub Playground. |
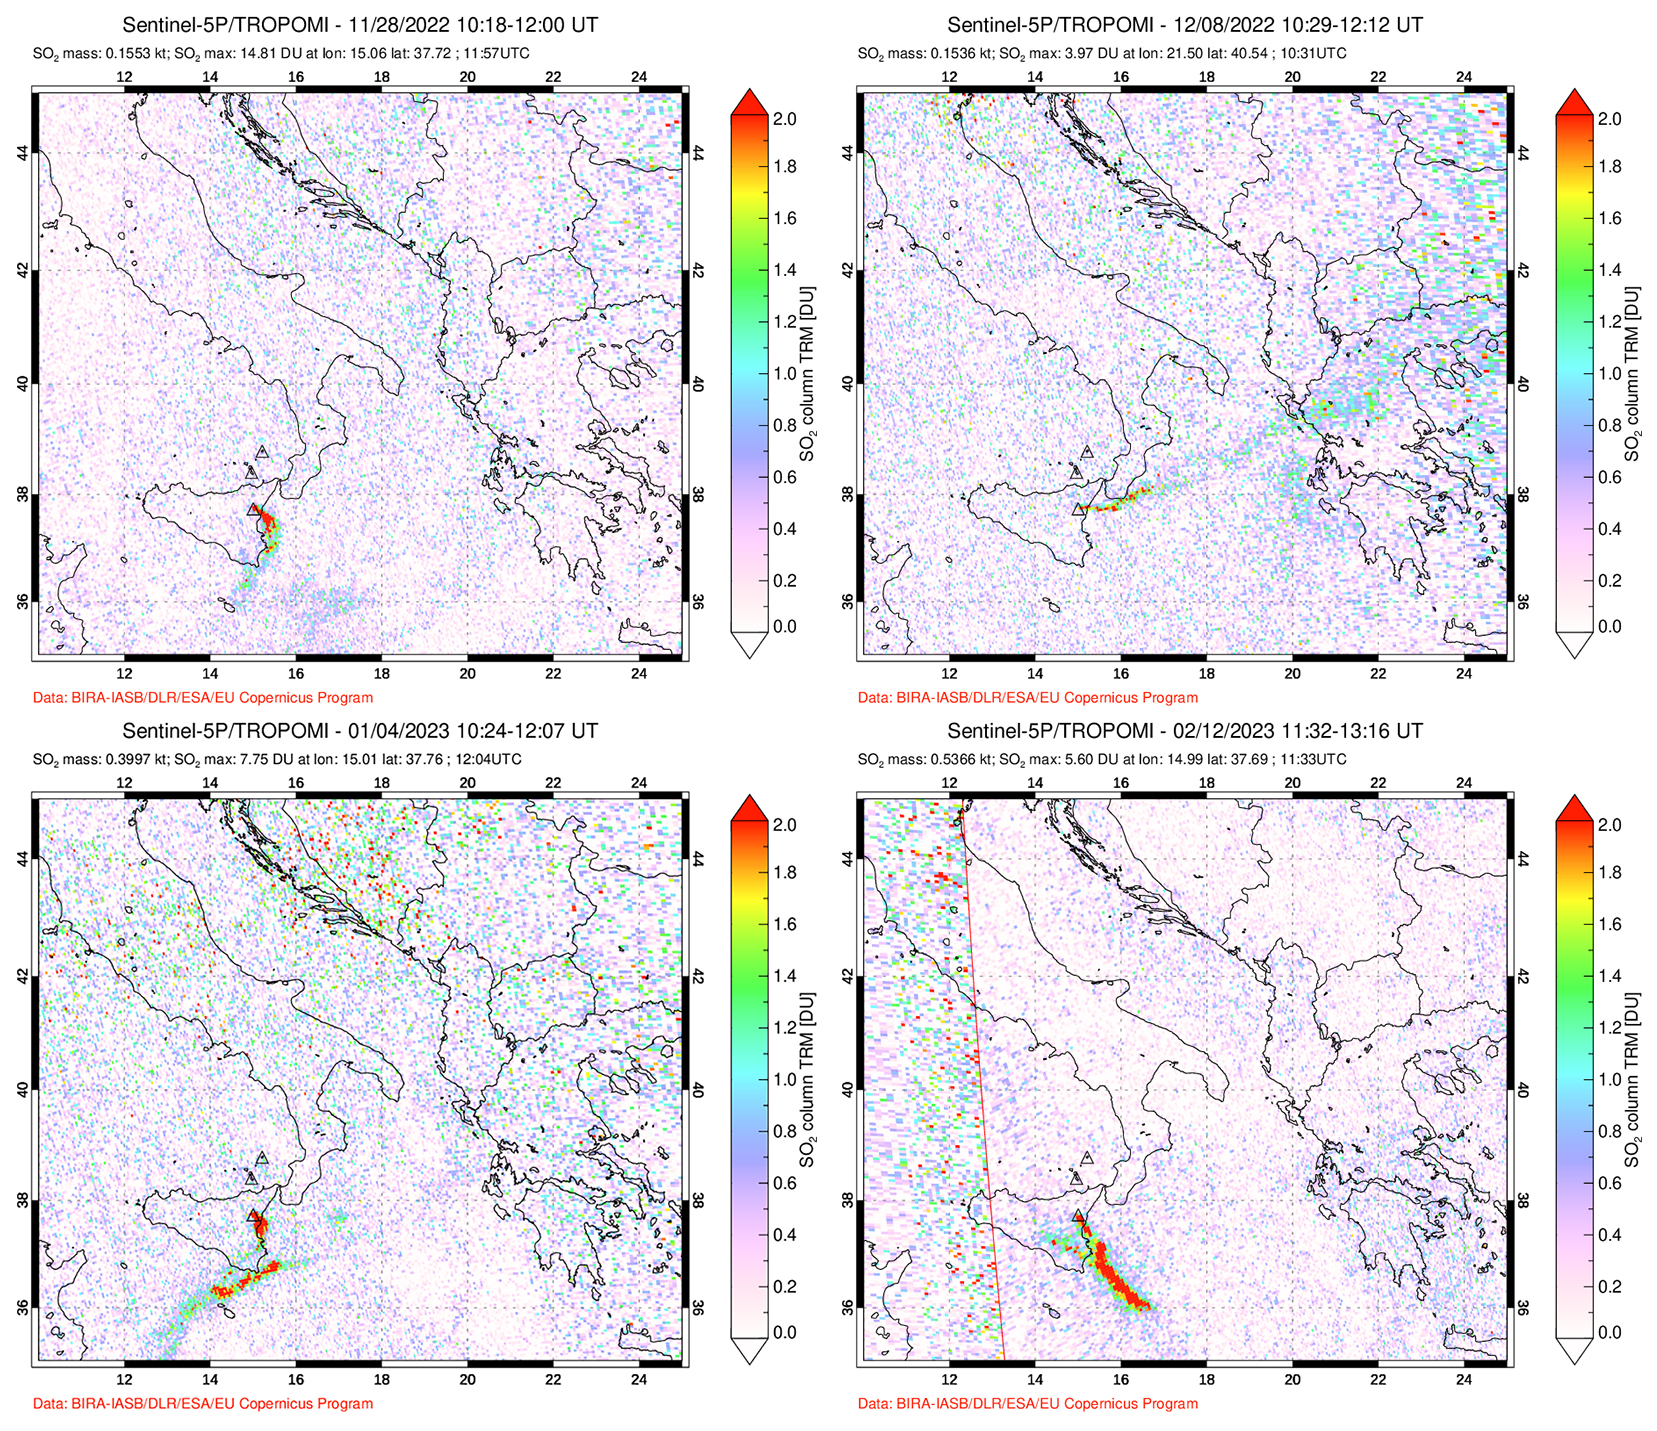 |
Figure 384. Sulfur dioxide plumes that exceeded 2 Dobson Units (DUs) rose above Etna on 28 November 2022 (top left), 8 December 2022 (top right), 4 January 2023 (bottom left), and 12 February 2023 (bottom right). The plumes drifted S, NE, SW, and SE, respectively. Courtesy of NASA Global Sulfur Dioxide Monitoring Page. |
Activity during November 2022. INGV reported that around 1800 on 27 November a vent opened on the NE base of SEC at 2.8 km elevation and produced a lava flow. The flow slowly advanced 300 m E toward the Valle del Leone; additional small lava flows emplaced the first one as it remained active (figure 385). Weather conditions obscured clear views of the activity from 1000 on 28 November through 29 November, though some incandescence was visible through the clouds, which suggested ongoing effusion. On 30 November once weather conditions improved, a second vent was observed upslope from the first vent at about 2.9 km elevation. A lava flow from this second vent traveled parallel to and N of the first flow, reaching about 2.7 km elevation (figure 385).
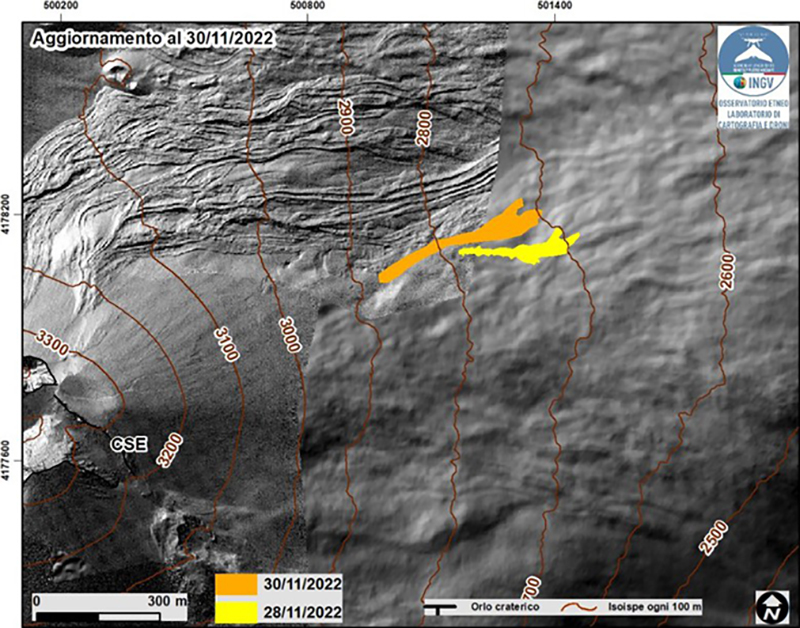 |
Figure 385. Map of the new lava flows at the NE base of SEC (CSE) of Etna updated on 30 November 2022 obtained from the analysis of the Skysat satellite image from 28 November 2022 and images acquired by the Piedimonte Etneo camera. The background image is a shaded model of the terrain of the summit area obtained by processing drone images acquired during several overflights made on 15 and 21 September 2022 and 6, 21, and 23 October 2022, superimposed on the shaded model from a Pleiades image taken on 22 August 2022. The yellow color shows the development of the lava flow on 28 November and the orange color shows a second lava flow on 30 November 2022. Courtesy of INGV (Report M11/2022, ETNA, BOLLETTINO MENSILE, MESE DI RIFERIMENTO NOVEMBRE 2022). |
Activity during December 2022. The vents at the NE base of SEC in the Valle del Leone continued to feed lava flows during December. The active flow field consisted of overlapping lava flows that expanded into the Valle del Leone and the Valle del Bove (figures 386 and 387). A small hornito formed at the vent area and ejected lava during 7-18 December. By 25 December the most active flow had descended to 2,150 m elevation (figure 388). Gas-and-steam emissions rose from the summit craters. The total volume of erupted lava was estimated at one million cubic meters on 30 December.
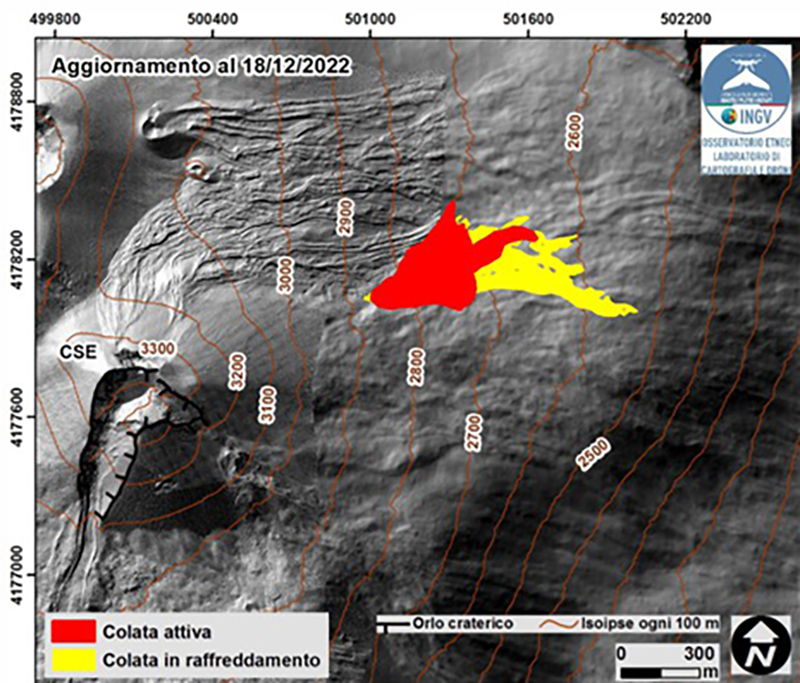 |
Figure 386. Map of the active and cooling lava flows at the base of SEC (CSE) of Etna updated on 18 December 2022, based on Sentinel satellite images. The background image is a shaded model of the terrain of the summit area obtained by processing drone images acquired during several overflights made on 15 and 21 September 2022 and 6, 21, and 23 October 2022, superimposed on the shaded model from a Pleiades image taken on 22 August 2022. The red color shows the active lava flow, and the yellow color shows the cooling lava flow. Courtesy of INGV (Report 51/2022, ETNA, Bollettino Settimanale, 12/12/2022 - 18/12/2022). |
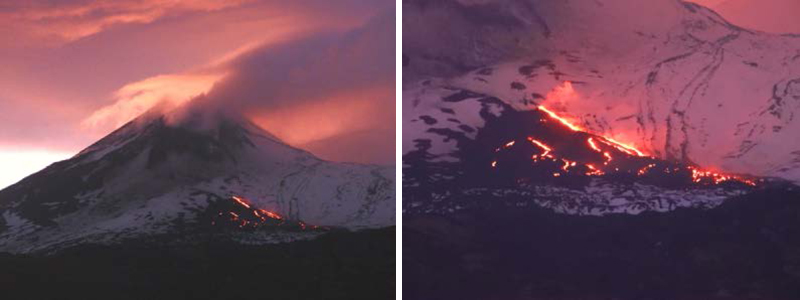 |
Figure 387. Photos of the active lava flow field at Etna taken on 16 December 2022 from the Ripe della Naca area on the ENE side of the volcano. Courtesy of Boris Behncke, INGV (Report 51/2022, ETNA, Bollettino Settimanale, 12/12/2022 - 18/12/2022). |
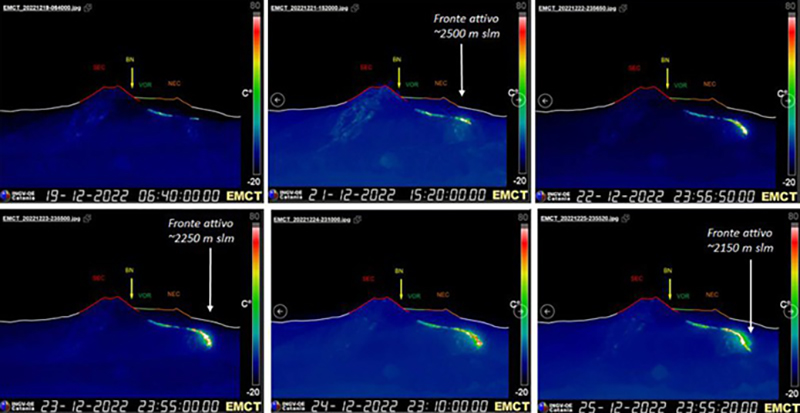 |
Figure 388. Thermal images of the active and advancing lava flow on Etna taken by the Monte Cagliato camera (E side of the volcano) during 19 and 25 December 2022. The images show the progression of the lava flow (bright yellow-green) over time, with the most active lava flow traveling to an elevation of 2,150 m on 25 December. Courtesy of INGV (Report 52/2022, ETNA, Bollettino Settimanale, 19/12/2022 - 25/12/2022). |
Activity during January 2023. The active lava flow field that originated from the NE base of SEC persisted during January, with overlapping flows expanding into the Valle del Leone and the Valle del Bove; the rate of these flows varied (figure 389). On 7 January the most active flow had reached an elevation of 2,170 m and the area of the flow field was an estimated 0.63 km2. Gas-and-steam emissions rose from the summit craters, though primarily at BN. Lava effusion progressively decreased during the night of 16-17 January and according to INGV, had stopped by the late afternoon of 17 January (figure 390). Effusion renewed during the early morning of 18 January, which consisted of two lava flows: one of the flows traveled NE along the W edge of the lava flow field, and the other traveled E onto the steep W wall of the Valle del Bove, which reached the base of the wall on 20 January. On 21 January the rate of effusion was variable. A new lava flow descended the Valle del Bove, almost reaching the base of the W wall at around 2.2 km elevation during the evening of 22 January (figure 390). Intense gas-and-steam emissions rose from BN, and minor to moderate emissions were detected at NEC and VOR (figure 391). Fumarolic activity was localized along the crater rim and from the May-June 2022 eruptive vent at SEC, which also occasionally included flashes of incandescence at night. Modest and diluted ash emissions were also detected at SEC, which dispersed in the wind (figure 391). The area covered by lava flows from 27 November 2022 to 29 January 2023 was estimated to 0.88 km2 and the total volume of material erupted ranged between 4.4-5.6 million cubic meters.
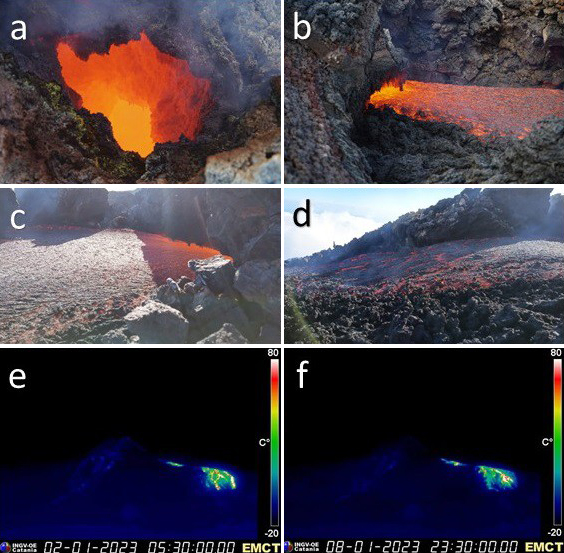 |
Figure 389. Photos of the active lava flow field at Etna taken by a-b) Giorgio Costa on 4 January 2023; c-d) Francesco Ciancitto on 8 January 2023; and INGV-OE EMCT thermal camera on e) 2 January 2023 and f) 8 January 2023. Courtesy of INGV (Report 02/2023, ETNA, Bollettino Settimanale, 02/01/2023 - 08/01/2023). |
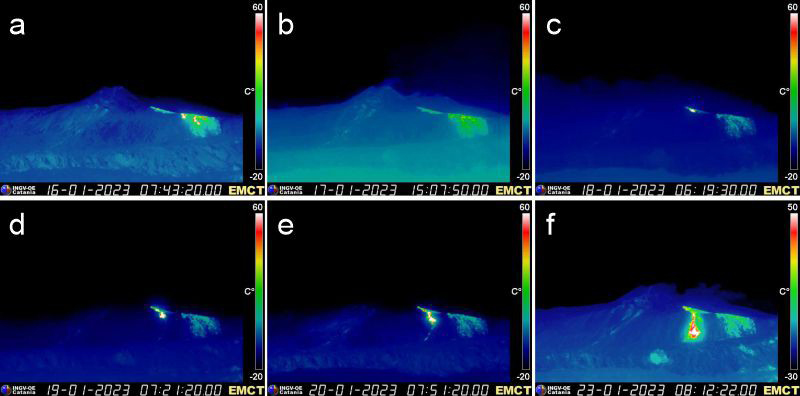 |
Figure 390. Thermal images taken by the Monte Cagliato camera on the E side of Etna during 16-23 January 2023. These images show a) reduced effusive activity (bright yellow-green) during the morning of 16 January; b) the lava flow appeared to have stopped by the afternoon of 17 January; c) effusive activity resumed on the morning of 18 January; d-e) slow advancement of the new lava flow on the W wall of the Valle del Bove during 19-20 January; and f) the new lava flow on 23 January. Courtesy of INGV (Report 04/2023, ETNA, Bollettino Settimanale, 16/01/2023 - 22/01/2023). |
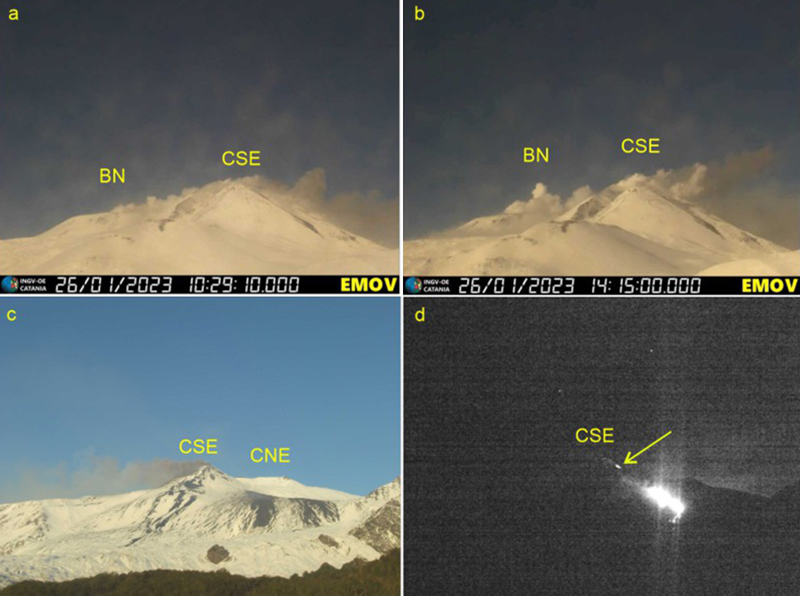 |
Figure 391. Webcam images taken by the La Montagnola camera showing a-b) degassing at Etna’s BN crater and weak ash emissions from SEC on 26 January 2023; and c-d) weak ash emissions from SEC and incandescence associated with SEC on 30 January 2023, as indicated by the yellow arrow. BN = Bocca Nuova; CSE = Southeast Crater; CNE = Northeast Crater. Courtesy of INGV (Report 05/2023, ETNA, Bollettino Settimanale, 23/01/2023 - 29/01/2023). |
Activity during February 2023. During the early morning of 1 February, the effusion rate increased before decreasing during the night of 1-2 February. Then, on the morning of 2 February, the flow stopped. The flow restarted during the early afternoon of 2 February, which produced new overlapping flows onto the pre-existing lava flow field (figure 392). During the afternoon of 4 February through the next day, there was a gradual decrease in effusion rate and the lava flow field started to cool. Intense degassing was reported at BN, weak degassing occurred at VOR and NEC, and variable degassing was reported at SEC along the crater rim and near the May-June 2022 eruptive vent, the latter of which occasionally showed some incandescence at night. Diluted ash emissions were also visible, though winds rapidly dispersed them.
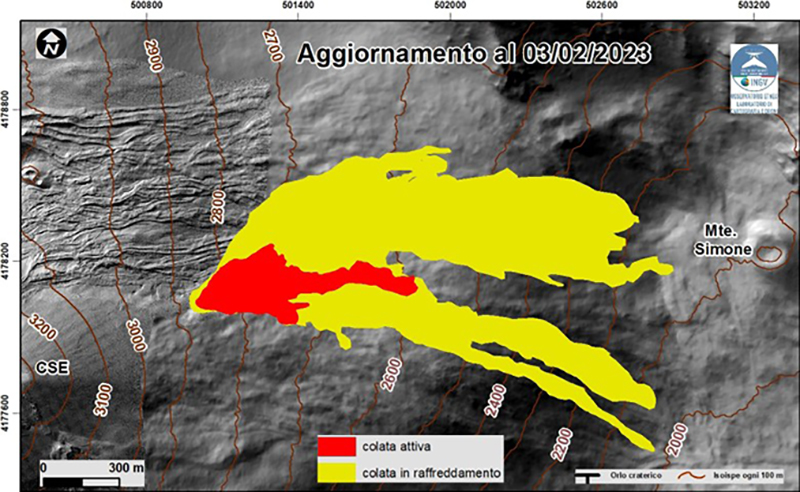 |
Figure 392. Map of the active and cooling lava flows at the base of SEC (CSE) of Etna updated on 3 February 2023 based on Sentinel satellite images. The background image is a shaded model of the terrain of the summit area obtained by processing drone images acquired during several overflights made on 15 and 21 September 2022 and 6, 21, and 23 October 2022, superimposed on the shaded model from a Pleiades image taken on 22 August 2022. The red color shows the active lava flow, and the yellow color shows the cooling lava flow. Courtesy of INGV (Report 06/2023, ETNA, Bollettino Settimanale, 01/30/2023 - 02/05/2023). |
INGV reported that on 6 February the lava effusion from the vent at the NE base of SEC had ended; the total area covered by the flows was an estimated 0.96 km2 and the estimated volume was 4.8-6.1 million cubic meters. A Volcano Observatory Notice for Aviation (VONA) posted on 7 February stated that the Aviation Color Code (ACC) was lowered to Yellow (the second lowest level on a four-color scale), and on 14 February the ACC was lowered to Green, indicating that activity was at background levels. INGV also noted that though the effusion had stopped, unrest was still ongoing.
Geological Summary. Mount Etna, towering above Catania on the island of Sicily, has one of the world's longest documented records of volcanism, dating back to 1500 BCE. Historical lava flows of basaltic composition cover much of the surface of this massive volcano, whose edifice is the highest and most voluminous in Italy. The Mongibello stratovolcano, truncated by several small calderas, was constructed during the late Pleistocene and Holocene over an older shield volcano. The most prominent morphological feature of Etna is the Valle del Bove, a 5 x 10 km caldera open to the east. Two styles of eruptive activity typically occur, sometimes simultaneously. Persistent explosive eruptions, sometimes with minor lava emissions, take place from one or more summit craters. Flank vents, typically with higher effusion rates, are less frequently active and originate from fissures that open progressively downward from near the summit (usually accompanied by Strombolian eruptions at the upper end). Cinder cones are commonly constructed over the vents of lower-flank lava flows. Lava flows extend to the foot of the volcano on all sides and have reached the sea over a broad area on the SE flank.
Information Contacts: Sezione di Catania - Osservatorio Etneo, Istituto Nazionale di Geofisica e Vulcanologia (INGV), Sezione di Catania, Piazza Roma 2, 95123 Catania, Italy (URL: http://www.ct.ingv.it/it/ ); MIROVA (Middle InfraRed Observation of Volcanic Activity), a collaborative project between the Universities of Turin and Florence (Italy) supported by the Centre for Volcanic Risk of the Italian Civil Protection Department (URL: http://www.mirovaweb.it/); Hawai'i Institute of Geophysics and Planetology (HIGP) - MODVOLC Thermal Alerts System, School of Ocean and Earth Science and Technology (SOEST), Univ. of Hawai'i, 2525 Correa Road, Honolulu, HI 96822, USA (URL: http://modis.higp.hawaii.edu/); Sentinel Hub Playground (URL: https://www.sentinel-hub.com/explore/sentinel-playground); NASA Global Sulfur Dioxide Monitoring Page, Atmospheric Chemistry and Dynamics Laboratory, NASA Goddard Space Flight Center (NASA/GSFC), 8800 Greenbelt Road, Goddard MD 20771, USA (URL: https://so2.gsfc.nasa.gov/).