Report on Kilauea (United States) — 31 January-6 February 2024
Smithsonian Institution / US Geological Survey
Weekly Volcanic Activity Report, 31 January-6 February 2024
Managing Editor: Sally Sennert.
Please cite this report as:
Global Volcanism Program, 2024. Report on Kilauea (United States) (Sennert, S, ed.). Weekly Volcanic Activity Report, 31 January-6 February 2024. Smithsonian Institution and US Geological Survey.
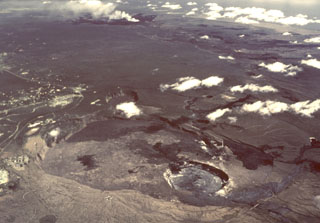
Kilauea
United States
19.421°N, 155.287°W; summit elev. 1222 m
All times are local (unless otherwise noted)
HVO reported that seismicity at Kilauea increased on 27 January and during 27-30 January the locations of the earthquakes became more widespread. Inflation at the summit was ongoing and remained at a high level. Sulfur dioxide gas emission rates were low. Seismicity intensified in the late hours of 30 January, just before midnight. By 0300 on 31 January, the network had recorded 25-30 earthquakes. The earthquakes were located at depths of 1.5-3 km in clusters that had migrated between the area just S of Halema`uma`u Crater and the region SW of the outer caldera boundary. The rate of inflation increased at around 0400. The seismic and deformation data suggested that magma was rising towards the surface, and as a result HVO raised the Volcano Alert Level to Watch (the second highest level on a four-level scale) and the Aviation Color Code to Orange (the second highest level on a four-color scale) at 0441. They noted that the patterns of earthquake activity and ground deformation were concentrated S of the caldera, so new eruptive activity could occur in or near Halema`uma`u Crater or the region S of the caldera.
Seismicity continued to intensify. During 0300-1755 on 31 January, over 500 earthquakes had been located, making a total of more 1,400 earthquakes recorded since 0900 on 27 January. The earthquakes occurred at a rate of 25-40 per hour. The events were located along the Koa’e fault system, SW of the summit. The magnitudes ranged from less than 1 to as high as 3.4; several of the earthquakes were large enough to be felt by HVO staff in the field and neighboring communities. The larger earthquakes triggered rockfalls in Halema`uma`u. About 20 microradians of inflation were detected by deformation instruments.
Seismicity decreased by the morning of 1 February, with 25-30 earthquakes per hour, and throughout the day the rate dropped further to 15-20 earthquakes per hour. The events continued to be located at depths of 1-4 km with epicenters in the vicinity of Pu’ukoa’e, 8-11 km SW of the caldera. Seismic and deformation data suggested that magma continued to move along the fault system. Models suggested that as much as 30 million cubic meters of magma had accumulated in the region SW of the caldera. Instruments detected almost 40 microradians of inflation by the morning on 1 February, but by 2 February the deformation data indicated deflation. Earthquake and ground deformation rates decreased significantly during 2-3 February, suggesting that the intrusion of magma had slowed or stopped and that the likelihood of an eruption had decreased. At 0810 on 3 February the Volcano Alert Level was lowered to Advisory, and the Aviation Color Code was lowered to Yellow.
Geological Summary. Kilauea overlaps the E flank of the massive Mauna Loa shield volcano in the island of Hawaii. Eruptions are prominent in Polynesian legends; written documentation since 1820 records frequent summit and flank lava flow eruptions interspersed with periods of long-term lava lake activity at Halemaumau crater in the summit caldera until 1924. The 3 x 5 km caldera was formed in several stages about 1,500 years ago and during the 18th century; eruptions have also originated from the lengthy East and Southwest rift zones, which extend to the ocean in both directions. About 90% of the surface of the basaltic shield volcano is formed of lava flows less than about 1,100 years old; 70% of the surface is younger than 600 years. The long-term eruption from the East rift zone between 1983 and 2018 produced lava flows covering more than 100 km2, destroyed hundreds of houses, and added new coastline.
Source: US Geological Survey Hawaiian Volcano Observatory (HVO)