
Satellite imagery acquired on 15 January from the Advanced Land Imager (ALI) on NASA's EO-1 satellite showed that the eruption in the northern part of the Zubair Group appeared to have stopped. The S end of the new island is about 500 m NNW of Rugged Island.
Source: NASA Earth Observatory
Two new volcanic islands; Sholan eruption ends January 2012, Jadid emerges in September 2013
The Zubair group in the southern Red Sea had been volcanically quiet since at least 1846 until two new islands formed: Sholan in 2011-12, and Jadid in 2013. The previously reported eruption of Sholan (BGVN 36:11 and 38:04) began in mid-December 2011, and the last day with activity seen in satellite imagery was 12 January 2012. The first evidence for the eruption that formed the island of Jadid was a MODVOLC thermal anomaly recorded on 28 September 2013 and the last satellite imagery indicating activity was 20 November 2013. A Nature Communications article by Xu, Ruch and Jonsson in 2015 provides most of the information discussed below about the 2013 eruption, as well as additional information about the 2011-2012 eruption that formed Sholan island.
Optical satellite imagery indicated cessation of the eruption at the new Sholan Island NW of Rugged Island on 12 January 2012. Subsequently about 30% of the island was eroded in 2012-2013. A new eruption 8 km SE of Sholan, NW of Saba Island, was captured by thermal anomaly and SO2 monitoring satellite instruments beginning 28 September 2013 (local time). The new Jadid Island was clearly visible by 23 October 2013 with a plume rising from it, and the last volcanic activity was observed via satellite on 20 November 2013. Significant seismic swarms in the area preceded both eruptions.
At least six seismic swarms occurred in the southern Red Sea between 1994 and 2014, according to Xu et al. (2015). Three of these were followed by nearby volcanic eruptions; in 2007 at Jebel at Tair (50 km NW of the Zubair group); in 2011 NW of Rugged island, forming Sholan island; and in 2013 NW of Saba, forming Jadid island (figure 7).
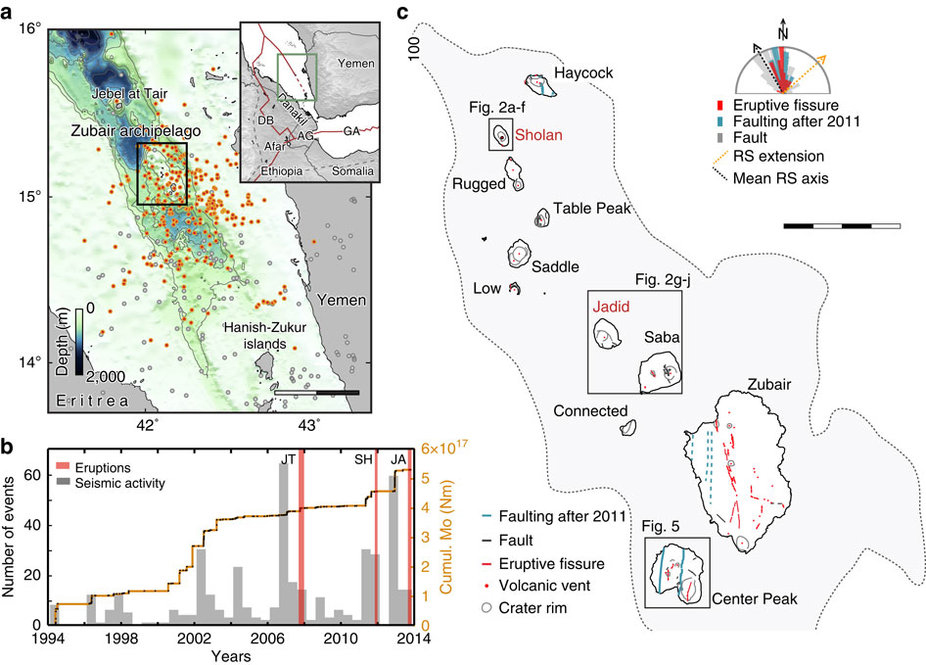 |
Figure 7. The Zubair archipelago and its seismic and volcanic activity during 1994-2014. (a) Earthquake locations (ISC catalogue) in the southern Red Sea with orange dots highlighting events related to seismic swarms. Red lines in the inset delineate the plate boundaries separating the Nubian, Somalian, and Arabian plates. DB, Dabbahu; AG, Asal-Ghoubbet; GA, Gulf of Aden. Scale bar, 50 km. (b) Cumulative seismic moment release (orange line), number of events per 3 months (grey bars) and eruptions (red bars) at Jebel at Tair (JT), Sholan (SH) and Jadid (JA) islands. (c) Map of the Zubair archipelago (the grey dotted line outlines platform depths shallower than 100 m) including the new Sholan and Jadid islands and general structural feature locations and orientations (stereoplot; RS for Red Sea). Scale bar, 4 km. Taken from figure 1 of Xu et al. (2015). |
Activity at Sholan. Three distinct earthquake swarms in April, June, and August 2011 occurred in the area during the eight months prior to the eruption that created Sholan, in addition to the two earthquakes detected by the Yemeni seismological network on 13 December 2011 (reported earlier). A sequence of satellite images between 23 December 2011 and 24 February 2014 show the subaerial eruptive sequence and subsequent erosion of the island (figure 8).
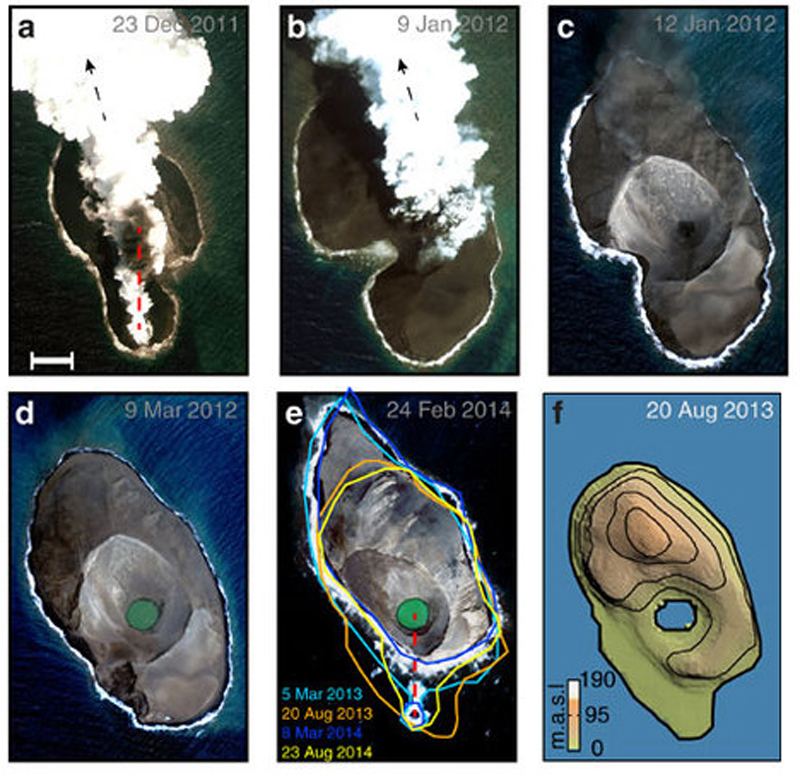 |
Figure 8. Formation and erosion of Sholan island in the Zubair archipelago between 23 December 2011 and 24 February 2014. High-resolution optical satellite images show (a-b) the 2011-2012 Sholan eruption and (c-e) its post-eruptive changes. (f) TanDEM-X (high-resolution InSAR digital elevation model) shaded relief topography of Sholan island with 20-m elevation contours on 20 August 2013. The red dashed line in a and e indicates the 2011-2012 eruptive fissure orientation; the black dashed arrows in a and b indicate the direction of volcanic ash deposits during the construction of the island, and coastline changes are color-coded in e. Scale bar shown in panel (a) is 100 m. Taken from figure 2 of Xu et al. (2015). |
As pointed out by Xu et al. (2015), initially, the eruption appeared to come from a N-S fissure (figure 8a), but later coalesced around a single vent (figure 8b). The image from 12 January 2012 (figure 8c) shows only a narrow dark plume, after which no additional activity was observed. Erosion of the island and formation of a crater lake became apparent by 9 March 2012 (figure 8d). The maximum subaerial area of the island was reported as 0.25 km2 with dimensions of 0.52 x 0.77 km shortly after the end of the eruption. Yemeni scientists who visited on 17 January 2012 found hydromagmatic deposits and witnessed several landslides on the steep, unstable flanks (Jamal Sholan, personal communication, 2013, in Wu et al., 2015). By 24 February 2014 the subaerial area had decreased by ~30% to 0.18 km2 (figure 8e).
Activity at Jadid. Earthquake swarms were recorded in December 2012, May 2013, and September 2013 (figure 7b) in the area around the Zubair islands. Six earthquakes with magnitudes less than 4 were detected to the east of the Zubair islands two days before the eruption was noticed. A MODVOLC thermal alert of a single pixel on 28 September 2013 local time (2320 UTM on 27 September) was followed by an SO2 plume detected by the Ozone Monitoring Instrument (OMI) on 28 and 29 September 2013 (figure 9).
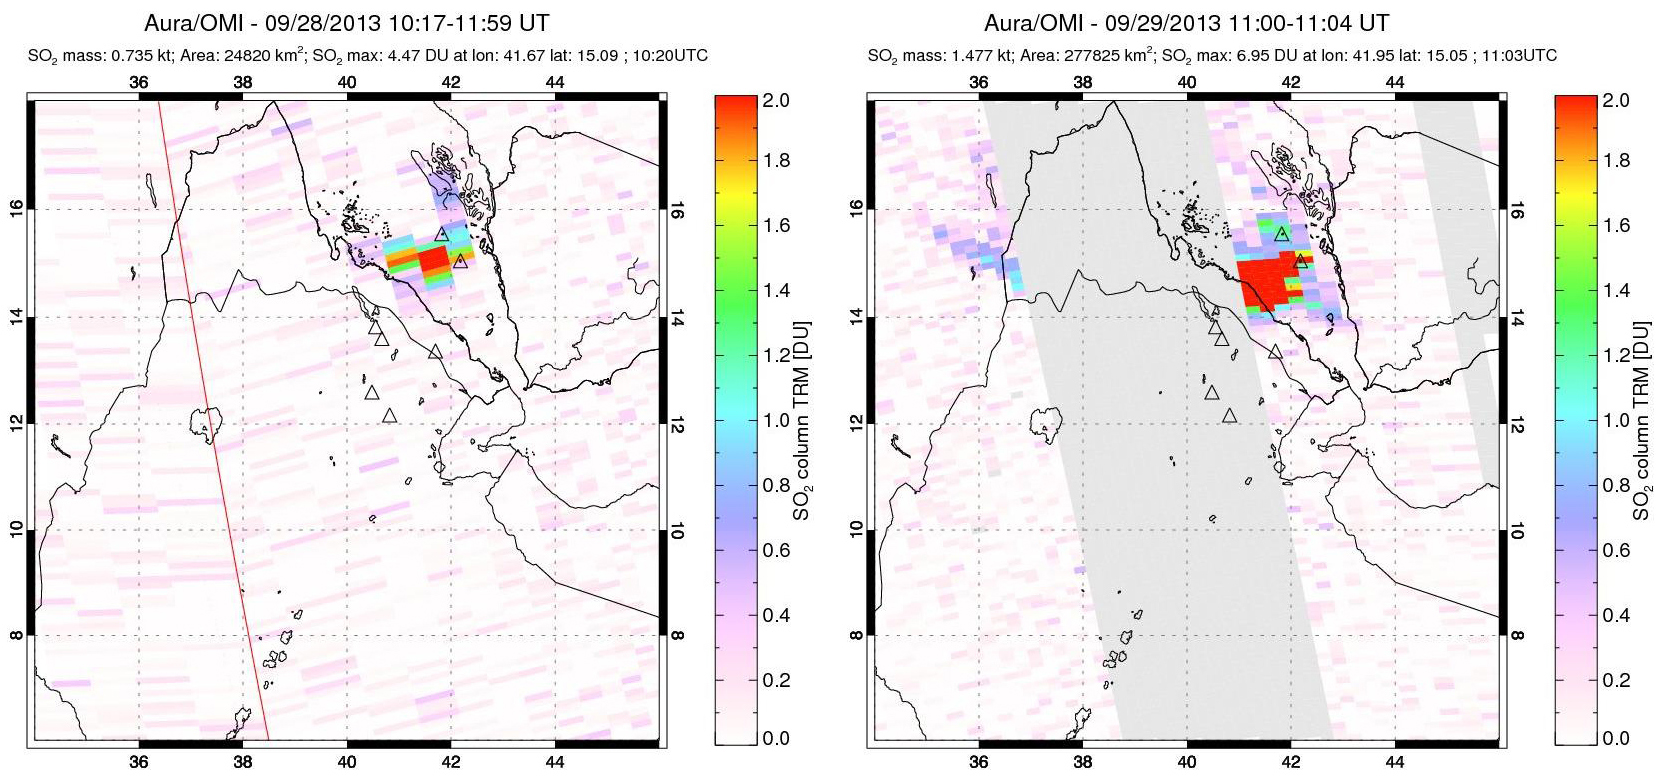 |
Figure 9. The first SO2 plumes from the Jadid Island eruption at Zubair on 28 and 29 September 2013. Courtesy of NASA GSFC (Goddard Space Flight Center). |
The first optical imagery of the eruption (figure 10), reported by Xu et al. (2015), was acquired on 29 September 2013 and shows discolored seawater and a plume rising from the sea surface NW of Saba Island (figure 10g). A new island is visible in a 23 October 2013 image (figure 10h) with a 0.8-km-diameter cone at its center. Its final appearance was a near circular shape with a diameter of ~0.9 km and subaerial size of ~ 0.68 km2 (figure 10j). Its size had decreased slightly from erosion by 24 February 2014 to 0.67 km2.
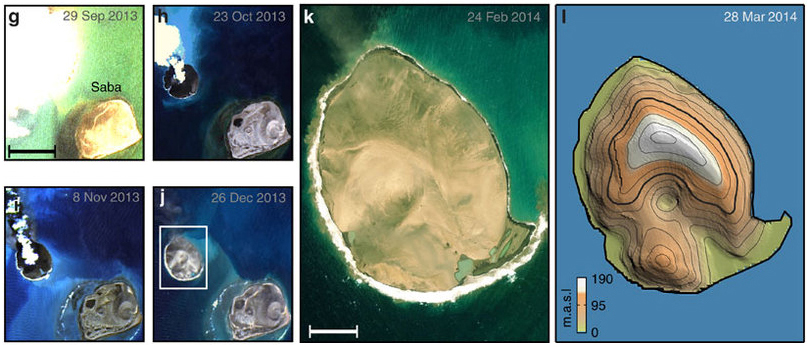 |
Figure 10. High-resolution optical satellite images of the formation of Jadid Island in the Zubair group between 29 September 2013 and 24 February 2014. Scale bar shown in (g) is 1 km. (j) shows post-eruptive change. (k) is a closeup of Jadid from a WorldView-2 image, scale bar: 200 m. (I) is a TanDEM-X (high-resolution InSAR digital elevation model) shaded relief topography of Jadid with 20-m elevation contours. Taken from figure 2 of Xu et al (2015). |
No further MODVOLC thermal alert pixels were recorded in the area, but SO2 anomalies were intermittently observed by the OMI satellite instrument until 16 October 2013. Additional optical imagery that showed the eruption was reported by Xu et al. (2015) until 20 November 2013. Google Earth imagery confirmed the presence of two new islands in the Zubair group by 2014 (figure 11).
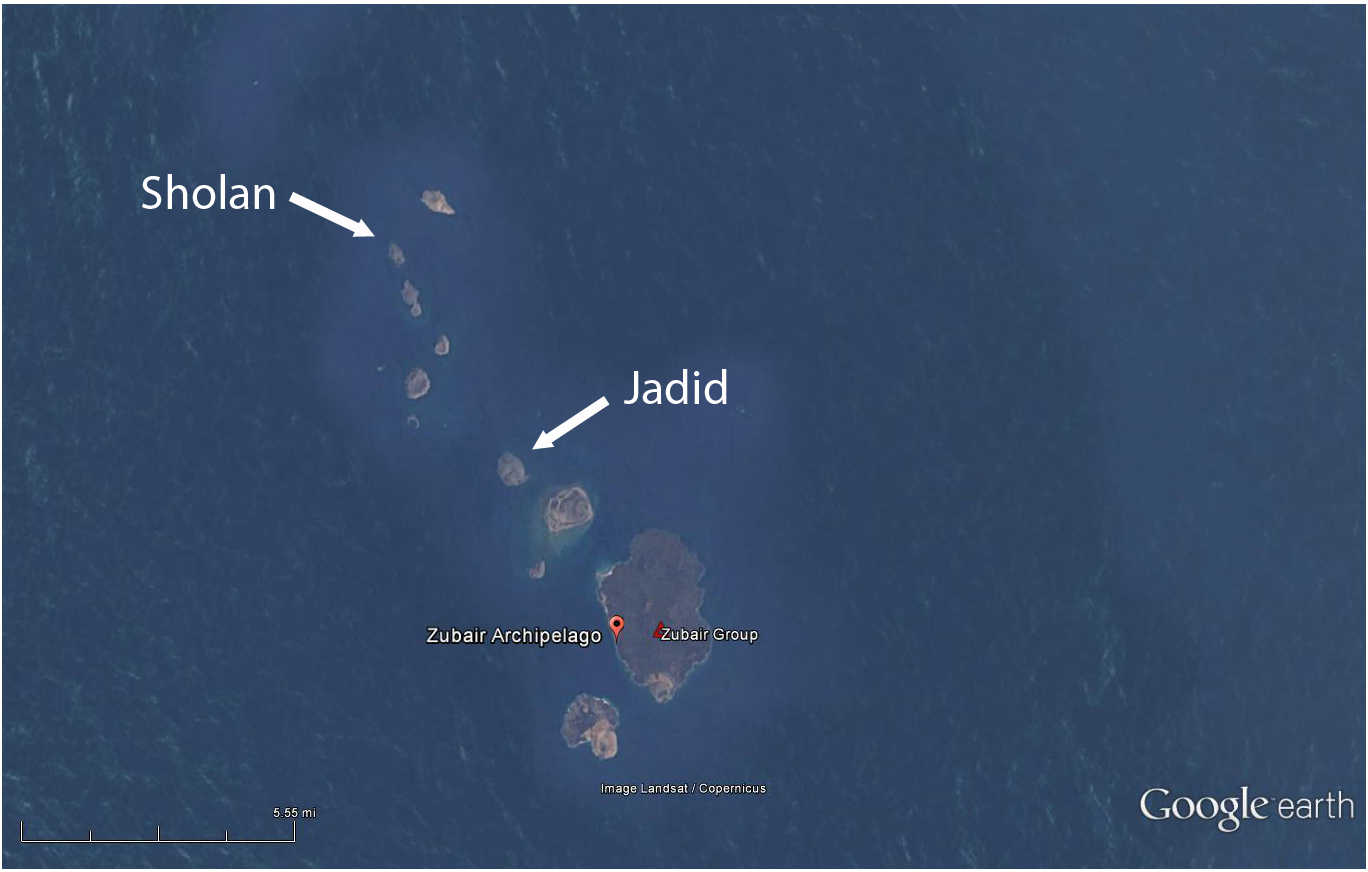 |
Figure 11. Google Earth imagery dated 30 December 2014 showing two new islands in the Zubair Archipelago. Sholan emerged between December 2011 and January 2012, and Jadid emerged between September and November 2013. Courtesy of Google Earth. |
References: Xu, W., Ruch, J., and Jonsson, S., 2015, Birth of two volcanic islands in the southern Red Sea. Nature Communications 6:7104. doi: 10.1038/ncomms8104 (2015).
Information Contacts: Hawai'i Institute of Geophysics and Planetology (HIGP), MODVOLC Thermal Alerts System, School of Ocean and Earth Science and Technology (SOEST), Univ. of Hawai'i, 2525 Correa Road, Honolulu, HI 96822, USA (URL: http://modis.higp.hawaii.edu/, http://modis.higp.hawaii.edu/cgi-bin/modisnew.cgi); NASA Goddard Space Flight Center (NASA/GSFC), Global Sulfur Dioxide Monitoring Page, Atmospheric Chemistry and Dynamics Laboratory, Goddard, Maryland, USA (URL: https://so2.gsfc.nasa.gov/); Google Earth (URL: https://www.google.com/earth/).
Satellite imagery acquired on 15 January from the Advanced Land Imager (ALI) on NASA's EO-1 satellite showed that the eruption in the northern part of the Zubair Group appeared to have stopped. The S end of the new island is about 500 m NNW of Rugged Island.
Source: NASA Earth Observatory
A satellite image acquired on 7 January showed the newly-formed island in the northern part of the Zubair Group. The island had grown to about 530 x 710 m, and a gas-and-steam plume containing ash rose from a distinct cone.
Source: NASA Earth Observatory
An eruption from the northern part of the Zubair Group continued during 21-27 December. MODIS imagery from NASA's satellites on 22 December showed a plume, possibly containing ash, rising from what was thought to be a submarine eruption. Imagery acquired on 23 December from the Advanced Land Imager (ALI) on NASA's EO-1 satellite showed a new island at the location with a plume rising from it, roughly 500 m N of Rugged Island and more than 500 m in diameter. The island was not present in a similar image acquired on 24 October 2007.
Source: NASA Earth Observatory
According to local news, fishermen from the port city of Salif on the western Red Sea coast of Yemen reported an off shore eruption from the island of Jebel Zubair, about 60 km SW, with lava fountains rising 20-30 m above the summit on 19 December. On 19 December a SO2 cloud was detected in an OMI satellite image. MODIS imagery from 20 December shows a plume rising from a submarine eruption about 1.5 km SW of Haycock and N of Rugged (near the N end of the Az-Zubair island group), and about 12 km NE of Jebel Zubair island. A bathymetric sketch map made in 1973 indicates a water depth of about 100 m in that area.
Sources: Toulouse Volcanic Ash Advisory Centre (VAAC); Yemen Observer; NASA Global Sulfur Dioxide Monitoring; NASA Land Atmosphere Near Real-time Capability for EOS (LANCE)
Reports are organized chronologically and indexed below by Month/Year (Publication Volume:Number), and include a one-line summary. Click on the index link or scroll down to read the reports.
December 2011 submarine eruption spotted by fishermen; island emerges
Following two M 3 earthquakes in the region on 13 December 2011, fishermen in Salif City, Yemen, reported an eruption in the Zubair island group that began as late as 18 December 2011. Moderate Resolution Imaging Spectroradiometer (MODIS) images of the area also first revealed a plume on 18 December, and this and later MODIS images fixed the vent's location at a spot in the N portion of Yemen's Jebel Zubair (Zubair Group, figure 1). A new island emerged in this vicinity and was large enough to resolve in satellite imagery by 23 December 2011. The latitude and longitude given in the title for Jebel Zubair (15.05°N, 42.18°E) indicate the largest island of the Zubair Group (figure 1); the new island emerged at approximately 15.158°N, 42.101°E.
 |
Figure 1. Map and index map of the 10 islands of the Zubair Group (Yemen) with our indication of the site of the new eruption and its associated emergent island. The islands emerge in the southern Red Sea, dotting an elongate region of about 8 x 27 km. Islands represented by gray shading; other features identified by legend at left. Plotted earthquake epicenters are given in table 1. The cross section at bottom is along line A-B. Modified from Gass and others (1973); index map modified from MapsOf.net. |
Initial reports. According to an article published in the Yemen Observer on 19 December, the fishermen who first reported the eruption stated that it was near Saba island (figure 1). They stated that they could see the eruption from 3 hours travel time away. The fishermen reported that the volcano had been "popping up red lava that reached 20-30 meters high." The same day, an EOS-AURA Ozone Monitoring Istrument (OMI) image showed an SO2 cloud in the area (figure 2). According to Volcano Discovery, a reader from Yemen confirmed the reported eruption, and added that an earthquake was felt on 19 December. Two other seismic events in the Zubair Group were recorded by the Seismological and Volcanological Observatory Center (SVOC) on 13 December (table 1, figure 1).
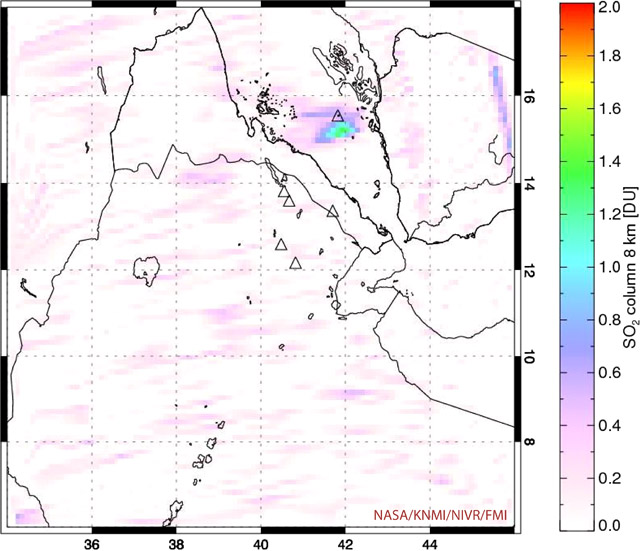 |
Figure 2. An SO2 cloud over the area of the Zubair island group captured by the AURA satellite's OMI imager between 1023 and 1205 on 19 December 2011. Scale at right is in Dobson Units (DU). The mass of SO2 depicted on this image was 0.403 kilotons (kt); the area of the cloud was ~45,352 km2; the maximum SO2 values on the image occured at 15.28°N and 14.28°E and reached 1.4 DU. Courtesy of Simon Carn and NASA Global Sulfur Dioxide Monitoring Aura/OMI. |
Table 1. Seismic events recorded in the Zubair Group in December 2011. Courtesy of the Seismological and Volcanological Observatory Center (SVOC).
| Date | Time | Location | Depth | Magnitude | Distance from eruption site |
| 13 Dec 2011 | 0122 | 15.037°N, 42.176°E | 38 km | 3.7 | 15.6 km |
| 13 Dec 2011 | 0501 | 15.167°N, 42.172°E | 6 km | 3.9 | 7.7 km |
On 20 December, the Toulouse Volcanic Ash Advisory Center (VAAC) reported a white plume that may have contained some unidentifiable ash (as reported that day from an aircraft in the area). Their report included a remark that the eruption seemed to be a continuing submarine eruption that began on 18 December. They stated that the plume was not identifiable in their satellite data. On 22 December, the Emirates News Agency published an article reporting that the head of SVOC stated that, based on preliminary data, there was no danger to marine navigation.
Small plumes were visible on MODIS imagery beginning on 18 December (figure 3). While cloud cover and dust plumes rendered the images speculative on a few days, others provided a clear view of the plumes, and highlighted their origin (figure 3f). The plumes did not appear to originate from one of the Zubair islands, but instead from just N of Rugged and ~ 1.5 km SW of Haycock islands (figure 4; also see "Eruption site" on figure 1). The lack of plumes prior to 18 December 2011, and the persistence of plumes after, indicates that the eruption began breaking the surface of the Red Sea sometime during 17-18 December.
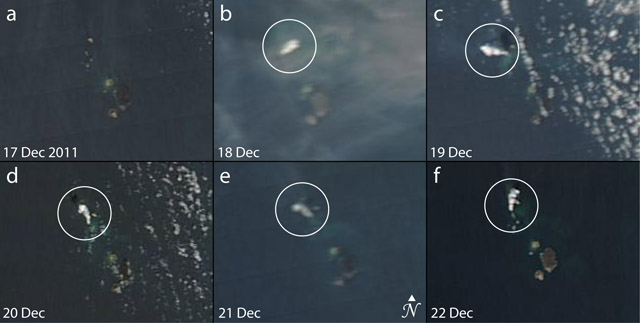 |
Figure 3. Satellite images of the Zubair Group captured during 17-22 December 2011. Images b-f show small plumes (circled) emanating from ~1.5 km SW of Haycock and just N of Rugged. A dust plume somewhat obscures the visibility in (b) and clouds are present in (c) and (d). Pixel resolution in each image is 250 m. All images acquired by the Moderate Resolution Imaging Spectroradiometer (MODIS) instrument aboard NASA's Aqua satellite except (d), which was acquired by the MODIS instrument aboard NASA's Terra satellite. Images courtesy of NASA's Land Atmosphere Near Real-time Capability for EOS (LANCE). |
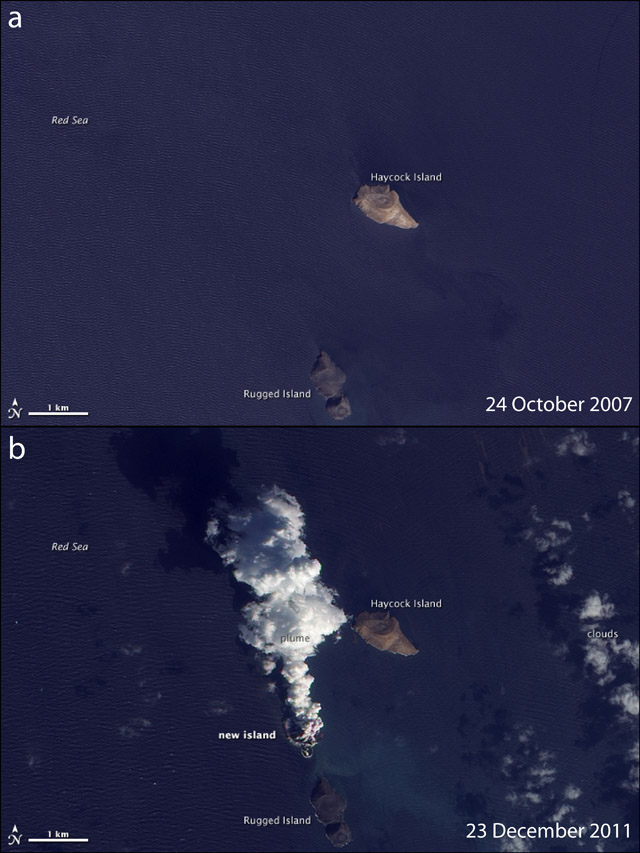 |
Figure 4. NASA Earth Observatory images captured by the Advanced Land Imager (ALI) aboard NASA's Earth Observing-1 (EO-1) satellite on (a) 24 October 2007 and (b) 23 December 2011. The 23 December 2011 image shows that an apparent new island is the eruption site, less than 1 km to the N of Rugged Island. An eruptive plume is seen rising and drifting to the N. Courtesy of Jesse Allen and Michon Scott, NASA Earth Observatory. |
New island. Finally, following approximately a week of widespread speculation on the exact location of the plume's source, NASA Earth Observatory published a high resolution satellite image of a new eruption (acquired 23 December 2011), clearly showing the off-island source of the eruptive plumes (figure 4b). From comparison with an image acquired on 24 October 2007, the 23 December 2011 image clearly shows that the eruption site was less than 1 km due N of Rugged Island, and was an apparent new island (figure 4). Their report stated that "The image . . . shows an apparent island where there had previously been an unbroken water surface." As of 28 December 2011, all information seems to point to the formation of a new, as yet unnamed, island in the Red Sea.
Reference. Gass, I.G., Mallick, D.I.J., and Cox, K.G., 1973, Volcanic islands of the Red Sea, Journal of the Geological Society of London, v. 129, p. 275-310 (DOI: 10.1144/gs
Information Contacts: MapsOf.net (URL: http://mapsof.net/); The Yemen Observer, P.O. Box 19183, Sana'a, Rep. of Yemen (URL: http://www.yobserver.com/); Seismological and Volcanological Observatory Center (SVOC), P.O. Box 87175, Dhamar, Yemen (URL: http://www.nsoc.org.ye/); Simon Carn, NASA Global Sulfur Dioxide Monitoring, Aura/OMI (URL: https://so2.gsfc.nasa.gov/); Toulouse Volcanic Ash Advisory Center (VAAC), Météo France, 42 Avenue Gaspard Coriolis, 31057 Toulouse Cedex 1, France (URL: http://www.meteo.fr/vaac/eindex.html); Emirates News Agency, 3790 Abu Dhabi, United Arab Emirates (URL: http://wam.org.ae/); NASA's Land Atmosphere Near Real-time Capability for EOS (LANCE) (URL: http://lance.nasa.gov/); NASA Earth Observatory (Jesse Allen and Michon Scott), NASA Goddard Space Flight Center (URL: http://earthobservatory.nasa.gov/).
Eruption on new island continues into January 2012
In BGVN 36:11 we reported on an ongoing submarine eruption in the N portion of Yemen's Zubair group of islands in the Red Sea that [produced visible activity on 18 December 2011]. A new island emerged in this vicinity and was large enough to resolve in satellite imagery by 23 December 2011. The latitude and longitude given in the header for this report is for the volcanic island of Jebel Zubair (15.05°N, 42.18°E), the largest island of the Zubair Group (figure 5). The new island emerged approximately 15.158°N, 42.101°E, or ˜10 km NW off the NW coast of Jebel Zabair. A bathymetric sketch map made in 1973 indicated a water depth of about 100 m in that area. The S end of the new island is about 500 m NNW of Rugged Island.
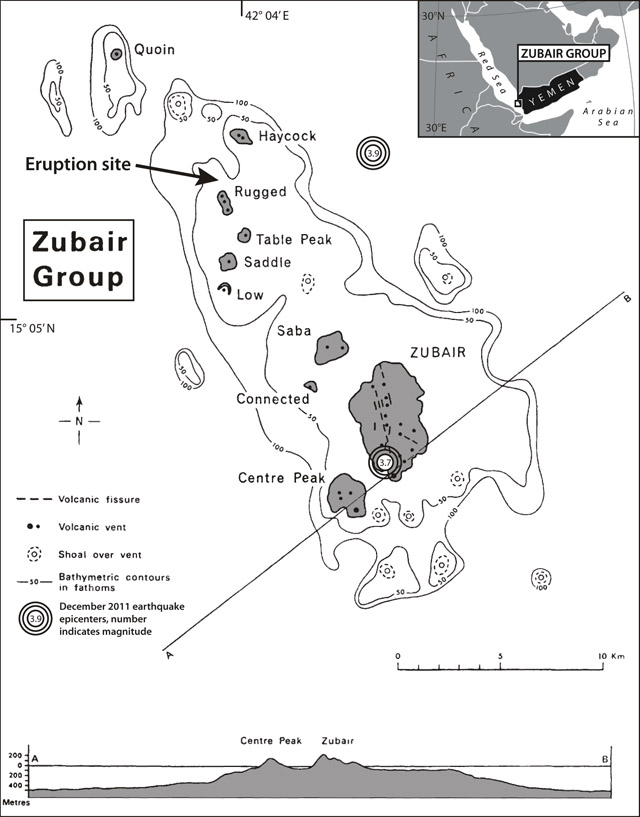 |
Figure 5. Map and index map of the 10 islands of the Zubair Group (Yemen) showing the site of the new eruption and its associated emergent island. Islands are represented by gray shading; other features are identified by the legend at left. The cross section at the bottom is along line A-B through the S portion of the group. Modified from Gass and others (1973); index map modified from MapsOf.net. |
By 7 January 2012, the island had grown to about 530 x 710 m, and a gas-and-steam plume containing ash rose from a distinct cone (figure 6). A video from a Yemeni miliary helicopter uploaded on YouTube on 2 January 2012 showed violent explosions typical of shallow submarine eruptions. The satellite image in figure 6 shows that a new island in the Zubair Group is the source of the volcanic plume.
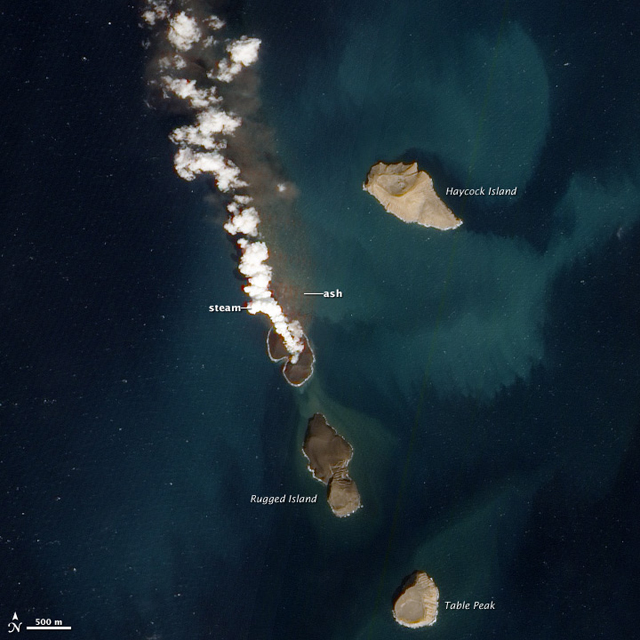 |
Figure 6. This satellite image, acquired 7 January 2012, shows that the island had risen above water. A plume of steam, other volcanic gases, and ash rises from a distinct cone. The land surrounding the vent had grown, and was about 530 by 710 m in dimension. Once above water, past eruptions in the Zubair Islands were primarily effusive, with low viscosity lava forming thin lava flows. This natural-color image was acquired by the Advanced Land Imager (ALI) aboard the Earth Observing-1 (EO-1) satellite. Courtesy of NASA Earth Observatory web site; image by Robert Simmon, using ALI data from the EO-1 Team; caption by Robert Simmon. |
Natural-color images from the Enhanced Thematic Mapper Plus (ETM+) on Landsat-7 on 15 January and 15 February 2012 show the new island, but no plume rising from it or any other indication of eruption continuing.
MODVOLC, using MODIS data from the Aqua satellite, measured a 2-pixel thermal anomaly at 2235 UTC, 11 January 2012, at latitude 15.16°N, longitude 42.10°E, just S of Haycock Island. This was the only thermal alert measured in the area during the December 2011-January 2012 time period.
References: Gass, I.G., Mallick, D.I.J., and Cox, K.G., 1973, Volcanic islands of the Red Sea. Journal of the Geological Society of London, v. 129, no. 3, pp. 275-309.
Vervaeck, A., 2012 (17 January), Surtseyan eruption along the coast of Yemen forms a new island - January 15 new ALI satellite image, Earthquake newsreport web site (URL: http://earthquake-report.com/2011/12/29/surtseyan-eruption-along-the-coast-of-yemen-forms-a-new-island-today-eruption-cloud-stain); accessed 21 May 2013.
YouTube video uploaded by Naif8989889 on 2 January 2012, (http://www.youtube.com/watch?v=YoMLNEJC-Nk&feature=gu&context=G2d0c74aFUAAAAAAAAAA).
Information Contacts: NASA Earth Observatory (URL: http://www.earthobservatory.gov).
Two new volcanic islands; Sholan eruption ends January 2012, Jadid emerges in September 2013
The Zubair group in the southern Red Sea had been volcanically quiet since at least 1846 until two new islands formed: Sholan in 2011-12, and Jadid in 2013. The previously reported eruption of Sholan (BGVN 36:11 and 38:04) began in mid-December 2011, and the last day with activity seen in satellite imagery was 12 January 2012. The first evidence for the eruption that formed the island of Jadid was a MODVOLC thermal anomaly recorded on 28 September 2013 and the last satellite imagery indicating activity was 20 November 2013. A Nature Communications article by Xu, Ruch and Jonsson in 2015 provides most of the information discussed below about the 2013 eruption, as well as additional information about the 2011-2012 eruption that formed Sholan island.
Optical satellite imagery indicated cessation of the eruption at the new Sholan Island NW of Rugged Island on 12 January 2012. Subsequently about 30% of the island was eroded in 2012-2013. A new eruption 8 km SE of Sholan, NW of Saba Island, was captured by thermal anomaly and SO2 monitoring satellite instruments beginning 28 September 2013 (local time). The new Jadid Island was clearly visible by 23 October 2013 with a plume rising from it, and the last volcanic activity was observed via satellite on 20 November 2013. Significant seismic swarms in the area preceded both eruptions.
At least six seismic swarms occurred in the southern Red Sea between 1994 and 2014, according to Xu et al. (2015). Three of these were followed by nearby volcanic eruptions; in 2007 at Jebel at Tair (50 km NW of the Zubair group); in 2011 NW of Rugged island, forming Sholan island; and in 2013 NW of Saba, forming Jadid island (figure 7).
|
Figure 7. The Zubair archipelago and its seismic and volcanic activity during 1994-2014. (a) Earthquake locations (ISC catalogue) in the southern Red Sea with orange dots highlighting events related to seismic swarms. Red lines in the inset delineate the plate boundaries separating the Nubian, Somalian, and Arabian plates. DB, Dabbahu; AG, Asal-Ghoubbet; GA, Gulf of Aden. Scale bar, 50 km. (b) Cumulative seismic moment release (orange line), number of events per 3 months (grey bars) and eruptions (red bars) at Jebel at Tair (JT), Sholan (SH) and Jadid (JA) islands. (c) Map of the Zubair archipelago (the grey dotted line outlines platform depths shallower than 100 m) including the new Sholan and Jadid islands and general structural feature locations and orientations (stereoplot; RS for Red Sea). Scale bar, 4 km. Taken from figure 1 of Xu et al. (2015). |
Activity at Sholan. Three distinct earthquake swarms in April, June, and August 2011 occurred in the area during the eight months prior to the eruption that created Sholan, in addition to the two earthquakes detected by the Yemeni seismological network on 13 December 2011 (reported earlier). A sequence of satellite images between 23 December 2011 and 24 February 2014 show the subaerial eruptive sequence and subsequent erosion of the island (figure 8).
|
Figure 8. Formation and erosion of Sholan island in the Zubair archipelago between 23 December 2011 and 24 February 2014. High-resolution optical satellite images show (a-b) the 2011-2012 Sholan eruption and (c-e) its post-eruptive changes. (f) TanDEM-X (high-resolution InSAR digital elevation model) shaded relief topography of Sholan island with 20-m elevation contours on 20 August 2013. The red dashed line in a and e indicates the 2011-2012 eruptive fissure orientation; the black dashed arrows in a and b indicate the direction of volcanic ash deposits during the construction of the island, and coastline changes are color-coded in e. Scale bar shown in panel (a) is 100 m. Taken from figure 2 of Xu et al. (2015). |
As pointed out by Xu et al. (2015), initially, the eruption appeared to come from a N-S fissure (figure 8a), but later coalesced around a single vent (figure 8b). The image from 12 January 2012 (figure 8c) shows only a narrow dark plume, after which no additional activity was observed. Erosion of the island and formation of a crater lake became apparent by 9 March 2012 (figure 8d). The maximum subaerial area of the island was reported as 0.25 km2 with dimensions of 0.52 x 0.77 km shortly after the end of the eruption. Yemeni scientists who visited on 17 January 2012 found hydromagmatic deposits and witnessed several landslides on the steep, unstable flanks (Jamal Sholan, personal communication, 2013, in Wu et al., 2015). By 24 February 2014 the subaerial area had decreased by ~30% to 0.18 km2 (figure 8e).
Activity at Jadid. Earthquake swarms were recorded in December 2012, May 2013, and September 2013 (figure 7b) in the area around the Zubair islands. Six earthquakes with magnitudes less than 4 were detected to the east of the Zubair islands two days before the eruption was noticed. A MODVOLC thermal alert of a single pixel on 28 September 2013 local time (2320 UTM on 27 September) was followed by an SO2 plume detected by the Ozone Monitoring Instrument (OMI) on 28 and 29 September 2013 (figure 9).
|
Figure 9. The first SO2 plumes from the Jadid Island eruption at Zubair on 28 and 29 September 2013. Courtesy of NASA GSFC (Goddard Space Flight Center). |
The first optical imagery of the eruption (figure 10), reported by Xu et al. (2015), was acquired on 29 September 2013 and shows discolored seawater and a plume rising from the sea surface NW of Saba Island (figure 10g). A new island is visible in a 23 October 2013 image (figure 10h) with a 0.8-km-diameter cone at its center. Its final appearance was a near circular shape with a diameter of ~0.9 km and subaerial size of ~ 0.68 km2 (figure 10j). Its size had decreased slightly from erosion by 24 February 2014 to 0.67 km2.
|
Figure 10. High-resolution optical satellite images of the formation of Jadid Island in the Zubair group between 29 September 2013 and 24 February 2014. Scale bar shown in (g) is 1 km. (j) shows post-eruptive change. (k) is a closeup of Jadid from a WorldView-2 image, scale bar: 200 m. (I) is a TanDEM-X (high-resolution InSAR digital elevation model) shaded relief topography of Jadid with 20-m elevation contours. Taken from figure 2 of Xu et al (2015). |
No further MODVOLC thermal alert pixels were recorded in the area, but SO2 anomalies were intermittently observed by the OMI satellite instrument until 16 October 2013. Additional optical imagery that showed the eruption was reported by Xu et al. (2015) until 20 November 2013. Google Earth imagery confirmed the presence of two new islands in the Zubair group by 2014 (figure 11).
|
Figure 11. Google Earth imagery dated 30 December 2014 showing two new islands in the Zubair Archipelago. Sholan emerged between December 2011 and January 2012, and Jadid emerged between September and November 2013. Courtesy of Google Earth. |
References: Xu, W., Ruch, J., and Jonsson, S., 2015, Birth of two volcanic islands in the southern Red Sea. Nature Communications 6:7104. doi: 10.1038/ncomms8104 (2015).
Information Contacts: Hawai'i Institute of Geophysics and Planetology (HIGP), MODVOLC Thermal Alerts System, School of Ocean and Earth Science and Technology (SOEST), Univ. of Hawai'i, 2525 Correa Road, Honolulu, HI 96822, USA (URL: http://modis.higp.hawaii.edu/, http://modis.higp.hawaii.edu/cgi-bin/modisnew.cgi); NASA Goddard Space Flight Center (NASA/GSFC), Global Sulfur Dioxide Monitoring Page, Atmospheric Chemistry and Dynamics Laboratory, Goddard, Maryland, USA (URL: https://so2.gsfc.nasa.gov/); Google Earth (URL: https://www.google.com/earth/).
This compilation of synonyms and subsidiary features may not be comprehensive. Features are organized into four major categories: Cones, Craters, Domes, and Thermal Features. Synonyms of features appear indented below the primary name. In some cases additional feature type, elevation, or location details are provided.
Synonyms |
||||
| Zebayir, Jebel | ||||
Cones |
||||
| Feature Name | Feature Type | Elevation | Latitude | Longitude |
| Centre Peak | Cone | 145 m | 15° 1' 13" N | 42° 9' 41" E |
| Connected Island | Cone | 101 m | 15° 4' 2" N | 42° 8' 36" E |
| Haycock Island | Cone | 141 m | 15° 10' 22" N | 42° 6' 48" E |
| Jadid Island | Cone | 15° 5' 51" N | 42° 8' 1" E | |
| Low Island | Cone | 15° 6' 41" N | 42° 6' 21" E | |
| Quoin Island | Cone | 15° 12' 28" N | 42° 3' 32" E | |
| Rugged Island | Cone | 104 m | 15° 8' 36" N | 42° 6' 22" E |
| Saba Island | Cone | 86 m | 15° 5' 13" N | 42° 9' 21" E |
|
Saddle Island
Sella |
Cone | 148 m | 15° 7' 7" N | 42° 6' 29" E |
| Sholan Island | Cone | 15° 9' 26" N | 42° 6' 4" E | |
| Table Peak | Cone | 97 m | 15° 7' 56" N | 42° 6' 55" E |
| Zubair Island | Cone | 191 m | 15° 2' 3" N | 42° 10' 48" E |
|
|
||||||||||||||||||||||||
There is data available for 3 confirmed Holocene eruptive periods.
2013 Sep 28 - 2013 Nov 20 Confirmed Eruption Max VEI: 2
| Episode 1 | Submarine Episode | Jadid Island | |||||||||||||||||||||||||||||||||||||||
|---|---|---|---|---|---|---|---|---|---|---|---|---|---|---|---|---|---|---|---|---|---|---|---|---|---|---|---|---|---|---|---|---|---|---|---|---|---|---|---|---|
| 2013 Sep 28 - 2013 Nov 20 | Evidence from Observations: Reported | |||||||||||||||||||||||||||||||||||||||
| Six earthquakes with magnitudes less than 4 were detected to the E of the Zubair islands two days before the eruption was noticed. A single MODVOLC thermal alert was issued on 28 September 2013 (local time). The first optical imagery of the eruption on 29 September (Xu et al., 2015) shows discolored seawater and a plume rising from the ocean surface NW of Saba Island. A new island, later named Jadid, was visible with an 800-m-diameter cone at its center in satellite imagery. Optical imagery that showed eruptive activity until 20 November 2013 (Xu et al., 2015). | ||||||||||||||||||||||||||||||||||||||||
|
List of 6 Events for Episode 1 at Jadid Island
| ||||||||||||||||||||||||||||||||||||||||
2011 Dec 18 - 2012 Jan 12 Confirmed Eruption Max VEI: 2
| Episode 1 | Submarine Episode | Sholan Island | ||||||||||||||||||||||||||||||||||||||||||||||||||||||||||||||||
|---|---|---|---|---|---|---|---|---|---|---|---|---|---|---|---|---|---|---|---|---|---|---|---|---|---|---|---|---|---|---|---|---|---|---|---|---|---|---|---|---|---|---|---|---|---|---|---|---|---|---|---|---|---|---|---|---|---|---|---|---|---|---|---|---|---|
| 2011 Dec 18 - 2012 Jan 12 | Evidence from Observations: Reported | ||||||||||||||||||||||||||||||||||||||||||||||||||||||||||||||||
| An eruption plume was first observed on 18 December 2011, with lava fountains seen the next day. The first satellite image showing a new island was captured on 23 December. Steam and ash emissions were seen in satellite imagery through 12 January 2012. The island was later named Sholan after the first Yemeni geologist to study the eruption. By 24 February 2014 the island was 0.18 km2, eroded from a maximum of 0.25 km2 (0.52 x 0.77 km) at the end of the eruption (Xu et al, 2015). | |||||||||||||||||||||||||||||||||||||||||||||||||||||||||||||||||
|
List of 11 Events for Episode 1 at Sholan Island
| |||||||||||||||||||||||||||||||||||||||||||||||||||||||||||||||||
[ 1846 Aug 14 ] Uncertain Eruption
| Episode 1 | Eruption Episode | Saddle Island | ||||||||||||||||||||||||
|---|---|---|---|---|---|---|---|---|---|---|---|---|---|---|---|---|---|---|---|---|---|---|---|---|---|
| 1846 Aug 14 - Unknown | Evidence from Unknown | ||||||||||||||||||||||||
| Explosive activity or fumarolic activity (CAVW). | |||||||||||||||||||||||||
|
List of 3 Events for Episode 1 at Saddle Island
| |||||||||||||||||||||||||
1824 Confirmed Eruption Max VEI: 2
| Episode 1 | Eruption Episode | Saddle Island | |||||||||||||||||||
|---|---|---|---|---|---|---|---|---|---|---|---|---|---|---|---|---|---|---|---|---|
| 1824 - Unknown | Evidence from Observations: Reported | |||||||||||||||||||
|
List of 2 Events for Episode 1 at Saddle Island
| ||||||||||||||||||||
There is no Deformation History data available for Zubair Group.
There is data available for 1 emission periods. Expand each entry for additional details.
| Start Date: 2011 Dec 18 | Stop Date: 2011 Dec 18 | Method: Satellite (Aura OMI) |
| SO2 Altitude Min: 5 km | SO2 Altitude Max: 5 km | Total SO2 Mass: 1 kt |
Data Details
| Date Start | Date End | Assumed SO2 Altitude | SO2 Algorithm | SO2 Mass |
| 20111218 | 5.2 | 1.000 |
The Global Volcanism Program has no photographs available for Zubair Group.
The maps shown below have been scanned from the GVP map archives and include the volcano on this page. Clicking on the small images will load the full 300 dpi map. Very small-scale maps (such as world maps) are not included. The maps database originated over 30 years ago, but was only recently updated and connected to our main database. We welcome users to tell us if they see incorrect information or other problems with the maps; please use the Contact GVP link at the bottom of the page to send us email.
There are no samples for Zubair Group in the Smithsonian's NMNH Department of Mineral Sciences Rock and Ore collection.
| Copernicus Browser | The Copernicus Browser replaced the Sentinel Hub Playground browser in 2023, to provide access to Earth observation archives from the Copernicus Data Space Ecosystem, the main distribution platform for data from the EU Copernicus missions. |
| MIROVA | Middle InfraRed Observation of Volcanic Activity (MIROVA) is a near real time volcanic hot-spot detection system based on the analysis of MODIS (Moderate Resolution Imaging Spectroradiometer) data. In particular, MIROVA uses the Middle InfraRed Radiation (MIR), measured over target volcanoes, in order to detect, locate and measure the heat radiation sourced from volcanic activity. |
| MODVOLC Thermal Alerts | Using infrared satellite Moderate Resolution Imaging Spectroradiometer (MODIS) data, scientists at the Hawai'i Institute of Geophysics and Planetology, University of Hawai'i, developed an automated system called MODVOLC to map thermal hot-spots in near real time. For each MODIS image, the algorithm automatically scans each 1 km pixel within it to check for high-temperature hot-spots. When one is found the date, time, location, and intensity are recorded. MODIS looks at every square km of the Earth every 48 hours, once during the day and once during the night, and the presence of two MODIS sensors in space allows at least four hot-spot observations every two days. Each day updated global maps are compiled to display the locations of all hot spots detected in the previous 24 hours. There is a drop-down list with volcano names which allow users to 'zoom-in' and examine the distribution of hot-spots at a variety of spatial scales. |
|
WOVOdat
Single Volcano View Temporal Evolution of Unrest Side by Side Volcanoes |
WOVOdat is a database of volcanic unrest; instrumentally and visually recorded changes in seismicity, ground deformation, gas emission, and other parameters from their normal baselines. It is sponsored by the World Organization of Volcano Observatories (WOVO) and presently hosted at the Earth Observatory of Singapore.
GVMID Data on Volcano Monitoring Infrastructure The Global Volcano Monitoring Infrastructure Database GVMID, is aimed at documenting and improving capabilities of volcano monitoring from the ground and space. GVMID should provide a snapshot and baseline view of the techniques and instrumentation that are in place at various volcanoes, which can be use by volcano observatories as reference to setup new monitoring system or improving networks at a specific volcano. These data will allow identification of what monitoring gaps exist, which can be then targeted by remote sensing infrastructure and future instrument deployments. |
| Volcanic Hazard Maps | The IAVCEI Commission on Volcanic Hazards and Risk has a Volcanic Hazard Maps database designed to serve as a resource for hazard mappers (or other interested parties) to explore how common issues in hazard map development have been addressed at different volcanoes, in different countries, for different hazards, and for different intended audiences. In addition to the comprehensive, searchable Volcanic Hazard Maps Database, this website contains information about diversity of volcanic hazard maps, illustrated using examples from the database. This site is for educational purposes related to volcanic hazard maps. Hazard maps found on this website should not be used for emergency purposes. For the most recent, official hazard map for a particular volcano, please seek out the proper institutional authorities on the matter. |
| IRIS seismic stations/networks | Incorporated Research Institutions for Seismology (IRIS) Data Services map showing the location of seismic stations from all available networks (permanent or temporary) within a radius of 0.18° (about 20 km at mid-latitudes) from the given location of Zubair Group. Users can customize a variety of filters and options in the left panel. Note that if there are no stations are known the map will default to show the entire world with a "No data matched request" error notice. |
| UNAVCO GPS/GNSS stations | Geodetic Data Services map from UNAVCO showing the location of GPS/GNSS stations from all available networks (permanent or temporary) within a radius of 20 km from the given location of Zubair Group. Users can customize the data search based on station or network names, location, and time window. Requires Adobe Flash Player. |
| DECADE Data | The DECADE portal, still in the developmental stage, serves as an example of the proposed interoperability between The Smithsonian Institution's Global Volcanism Program, the Mapping Gas Emissions (MaGa) Database, and the EarthChem Geochemical Portal. The Deep Earth Carbon Degassing (DECADE) initiative seeks to use new and established technologies to determine accurate global fluxes of volcanic CO2 to the atmosphere, but installing CO2 monitoring networks on 20 of the world's 150 most actively degassing volcanoes. The group uses related laboratory-based studies (direct gas sampling and analysis, melt inclusions) to provide new data for direct degassing of deep earth carbon to the atmosphere. |
| Large Eruptions of Zubair Group | Information about large Quaternary eruptions (VEI >= 4) is cataloged in the Large Magnitude Explosive Volcanic Eruptions (LaMEVE) database of the Volcano Global Risk Identification and Analysis Project (VOGRIPA). |
| EarthChem | EarthChem develops and maintains databases, software, and services that support the preservation, discovery, access and analysis of geochemical data, and facilitate their integration with the broad array of other available earth science parameters. EarthChem is operated by a joint team of disciplinary scientists, data scientists, data managers and information technology developers who are part of the NSF-funded data facility Integrated Earth Data Applications (IEDA). IEDA is a collaborative effort of EarthChem and the Marine Geoscience Data System (MGDS). |

