
During 19-24 November, the MODIS satellite continued to detect thermal anomalies over the area near Dalaffilla and Alu volcanoes from the eruption that began on 3 November.
Source: Hawai'i Institute of Geophysics and Planetology (HIGP) Thermal Alerts Team
Lava flow-field size unchanged for months; thermal alerts ceased 28 December
The eruption that began on 3 November 2008 (BGVN 33:10) significantly slowed or ceased prior to January 2009. The region is the scene of sporadic fighting, thwarting direct reports from people in the field, and forcing greater reliance on remote-sensing imagery.
Looking at Advanced Spaceborne Thermal Emission and Reflection Radiometer (ASTER) satellite system images for 19 December 2008 and 4 January 2009 (figure 9), Matt Patrick found little significant change in the shape or area of the lava flow field since 8 November 2008 (see image in BGVN 33:10).
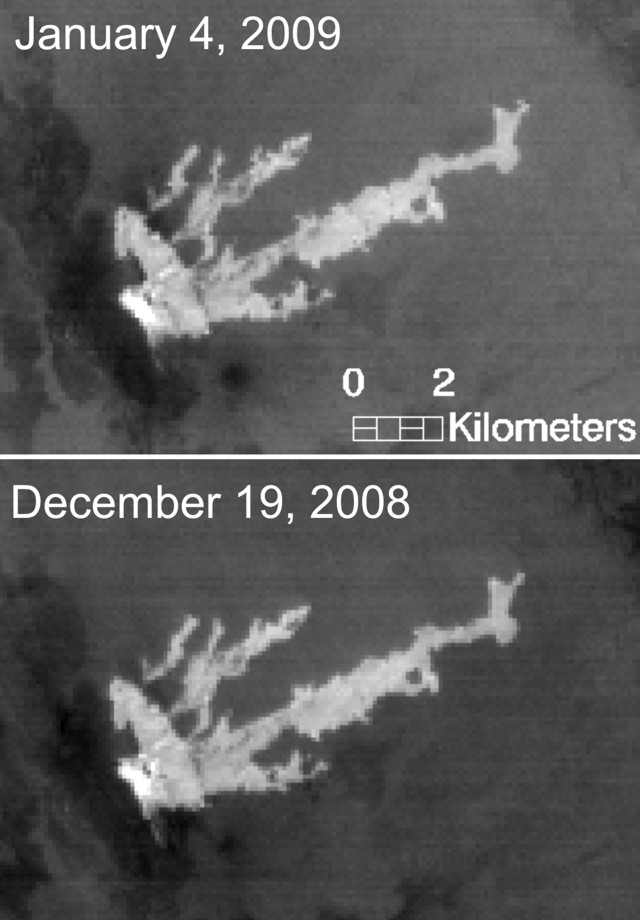 |
Figure 9. Satellite ASTER images over Dalaffilla and Alu volcanoes on 19 December 2008 and 4 January 2009. Shown are nighttime thermal images (band 14, 11-micron wavelength) showing flow to the NE from a fissure or fissure system between the volcanoes. Courtesy of Matt Patrick. |
Thermal alerts over the eruption site reported by the MODVOLC system were absent after 28 December 2008 (figure 10) through at least early February 2009. At the start of the eruption (identified on 3 November at 1920 UTC) there were 148 alerts in a circular pattern well extending outboard but engulfing the densest area of alerts over the main lava field. Following the initial eruption, the alert pixels concentrated primarily on the lava flow. No thermal anomalies were detected for at least several years before the November eruption.
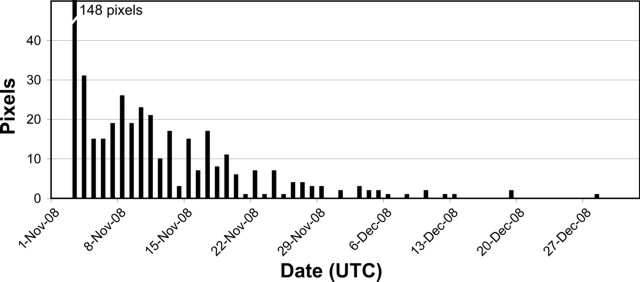 |
Figure 10. A plot of the maximum number of daily MODVOLC thermal alerts at Dalaffilla during November-December 2008. Courtesy of the Hawai'i Institute of Geophysics and Planetology (HIGP) Thermal Alerts System. |
NASA's Earth Observatory (EO) released a true-color image captured by Taiwan's Formosat-2 satellite (figure 11). The image caption, by Ralph Harrington, noted that fresh flows from the recent eruption appear darker than the older weathered flows. Lava spread from the fissure several kilometers to the NE, as well as S and SW. The image also appears to show spatter cones associated with the fissures.
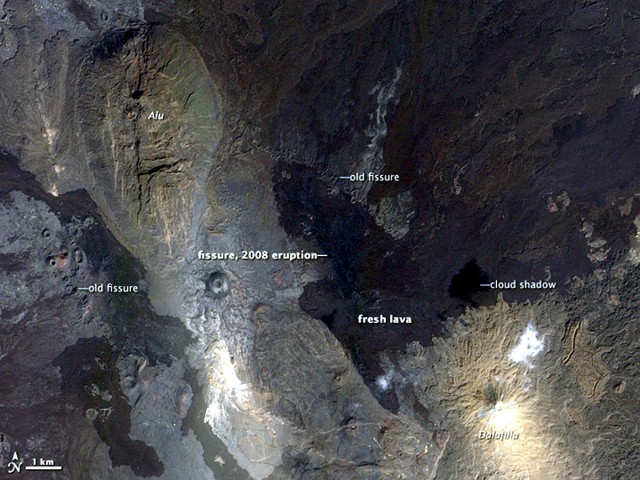 |
Figure 11. A Formosat-2 satellite true-color image (enhanced here) acquired 25 December 2008 of the Alu and Dalaffilla portion of the Erta Ale range of the Afar region. FORMOSAT-2, developed by the National Space Organization (NSPO), launched in 2004 with 2-m panchromatic resolution and 8-m multi-spectral resolution. Courtesy of NASA Earth Observatory, with image provided by Cheng-Chien Liu, National Cheng-Kung University, and An-Ming Wu, NSPO, Taiwan. |
Information Contacts: NASA Earth Observatory (URL: http://earthobservatory.nasa.gov/); Ralph Harrington, The Volcanism Blog (URL: http://volcanism.wordpress.com); Matthew R. Patrick, Hawaiian Volcano Observatory (HVO), U.S. Geological Survey, PO Box 51, Hawai'i National Park, HI 96718, USA; Simon Carn, Department of Geological and Mining Engineering and Sciences, Michigan Technological University, 1400 Townsend Dr., Houghton, MI 49931, USA (URL: https://so2.gsfc.nasa.gov/); Hawai'i Institute of Geophysics and Planetology (HIGP) Thermal Alerts System, School of Ocean and Earth Science and Technology (SOEST), Univ. of Hawai'i, 2525 Correa Road, Honolulu, HI 96822, USA (URL: http://modis.higp.hawaii.edu/).
2008: November
During 19-24 November, the MODIS satellite continued to detect thermal anomalies over the area near Dalaffilla and Alu volcanoes from the eruption that began on 3 November.
Source: Hawai'i Institute of Geophysics and Planetology (HIGP) Thermal Alerts Team
Night-time satellite imagery from 8 November of the eruption that began on 3 November near Dalaffilla and Alu volcanoes revealed a multi-lobed lava-flow field with a primary channelized flow that traveled NE. The source appears to be a one or more NW-SE-trending eruptive fissures NW of Dalaffilla. The flow field on the 8 November image was an estimated 9.3 km long and 3 km wide, with an area of about 15 square kilometers. Thermal anomalies detected by satellites were present during 12-16 November.
Sources: Hawai'i Institute of Geophysics and Planetology (HIGP) Thermal Alerts Team; Simon Carn; US Geological Survey Hawaiian Volcano Observatory (HVO)
An eruption of a volcano NW of Erta Ale in Ethiopia's Afar region began on 3 November. Satellite imagery showed a large sulfur dioxide cloud that drifted E over the Arabian Peninsula. According to news articles, observers reported ground shaking, hearing loud noises and explosions from a distance, and seeing smoke. Widespread lava flows were also noted. Extensive thermal anomalies near Dalafilla and Alu volcanoes were detected, consistent with lava effusion, although the source of the lava flows was not known. Thermal anomalies continued to be detected during 3-11 November.
Sources: Bloomberg; Hawai'i Institute of Geophysics and Planetology (HIGP) Thermal Alerts Team; OMI Sulfur Dioxide Group
Reports are organized chronologically and indexed below by Month/Year (Publication Volume:Number), and include a one-line summary. Click on the index link or scroll down to read the reports.
Satellite data reveals rift axis lavas erupted in November 2008
During November 2008, lava extruded from fissures and by 8 November covered a heavily faulted zone spreading over about 15 km2 in the Afar (or Danakil) depression. This eruption is ~ 25 km NW of Erta Ale volcano, in the Erta Ale volcanic range (figure 1). The range lies along the axis of the the NW-trending Danakil depression, a hot, arid, and desolate rift basin with a floor in places ~ 100 m below sea level. Going NW along the rift from Erta Ale, the named volcanic centers include Bora Le Ale, Dalaffilla, Alu, and Gada Ale. The tectonically active area (figure 2) has extremely low population density and scientists' field reports have yet to emerge. Prior to this event, there were five eruptive episodes in the region since 1967, three of those since September 2005 (table 1).
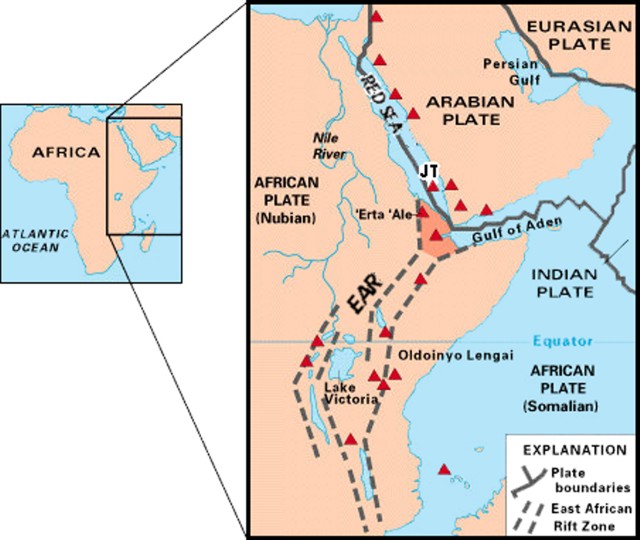 |
Figure 1. Sketch map of the Afar triangle region with highly simplified tectonics and some of the region's volcanoes indicated as triangles. The Afar region (shaded) contains the Afar (rift-rift-rift) triple junction. Continental rifting takes place along the East African rift (EAR), with the Nubian plate on the W, and the Somalian plate on the E. The Arabian plate resides on the N. Note Erta Ale volcano in the N Afar (along the Danakil depression). The volcano Jebel et Tair (location approximate) is indicated with "JT." Revised from a map prepared by the USGS. |
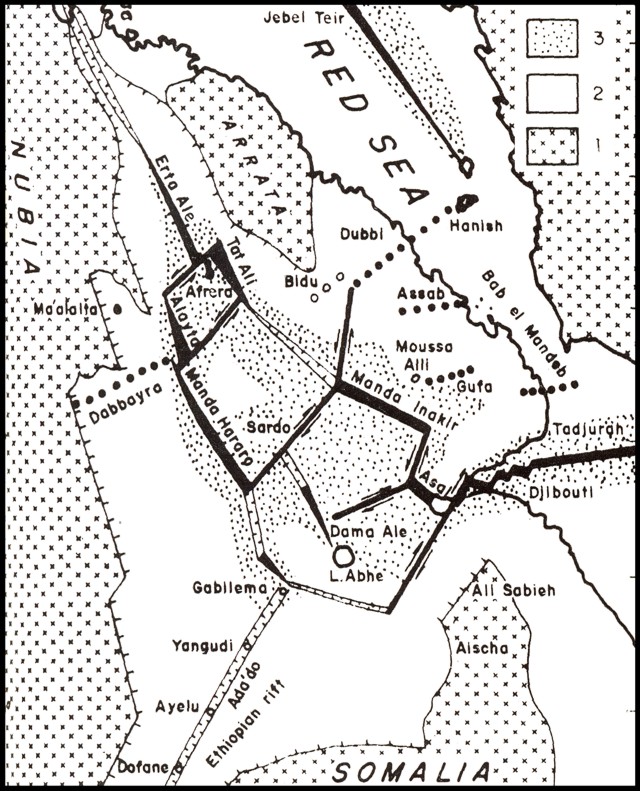 |
Figure 2. A schematic map of the Afar indicating key volcanic and tectonic features including the Erta Ale volcanic range and Jebel at Tair volcano in the Red Sea. Key patterns: 1) Outcropping continental basement, 2) Continental rift material, and 3) Oceanic crust formed during the last 3-4 million years. Modified from Barberi and Varet (1975). |
Table 1. A synopsis of known Afar region eruptions since 1967, including the case at hand, Dalaffilla. Compiled from Smithsonian volcano reports (CSLP and SEAN are Smithsonian BGVN predecessors).
| Volcano (Country) | Location (with respect to Erta Ale) | Eruption dates | Comment |
| Erta Ale (Ethiopia) | -- | 1967-present | Active lava lake(s) ongoing through present [eg. CSLP 22-71, BGVN 33:06]. |
| Ardoukôba (Djbouti) | 300 km SE | 07-14 Nov 1978 | Ardoukôba (Asal rift) produced small cinder cone and lava flows on rift floor [SEAN 03:11, 03:12]. |
| Dabbahu (Ethiopia) | 113 km SE | Sep 2005 | Short-lived explosive eruption with apparent dome in the deep portion of the elongate crater (Also see Wright and others, 2006) [BGVN 30:09]. |
| Manda Hararo (Ethiopia) | 160 km S | 12 Aug-Sep 2007 | Lava flows, numerous small spatter and scoria cones; occasional flames. Recent fault movement. Located in the Karbahi graben between the settlements of Semera and Teru [BGVN 32:07]. |
| Jebel at Tair (Yemen) | 250 km NNE | 30 Sep 2007-01 Jan 2008 | An explosive and effusive eruption of lava on inhabited island in the S-central Red Sea (evacuation and fatalities) [BGVN 32:10, 32:04]. |
| Dalaffilla (Ethiopia) | 25 km NW | 03 Nov 2008 | This is the first BGVN report on either Dalaffilla or adjacent Alu volcanoes (mainly satellite data available thus far in late November 2008). |
The conical summit of Dalafilla (which means "cut neck" in the Afar language) lies about 6 km SE of the center of the elongated summit horst of Alu (figure 3). The current eruption took place from vents between these two rift-axis centers, both of which have extensive vents, fissures, and faults trending along the rift axis. Determination of the provenance of flank vents can be problematical in a rift setting such as this that displays adjacent, but slightly offset elongated, rift-parallel volcanism. Preliminary analysis of satellite imagery suggests that the lava flows originated from fissures or vents extending downslope from the sides of the Dalafilla volcanic center.
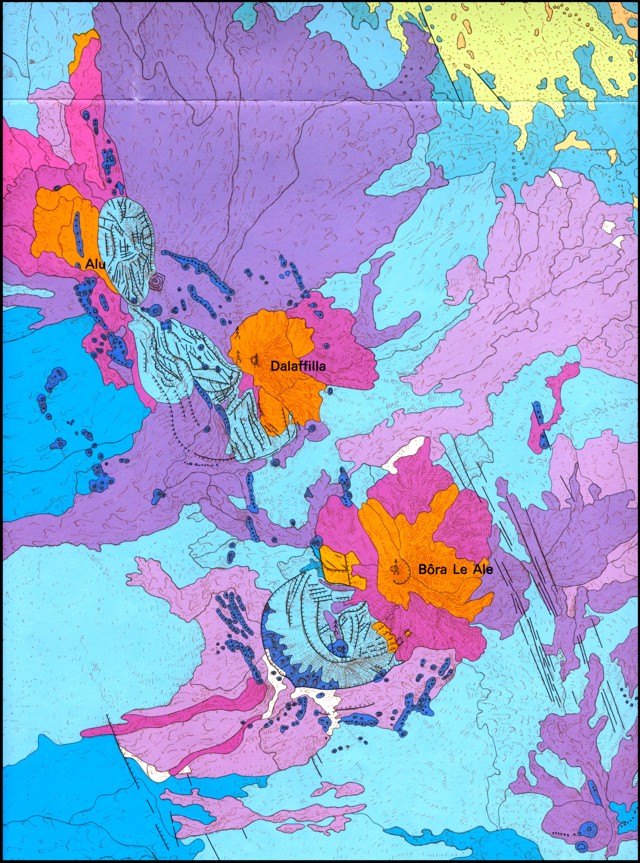 |
Figure 3. Geological map (1972) of a portion of the Erta Ale Volcanic Range (Danakil Depression ? Ethopia) showing the relative locations of volcanoes Alu, Dalaffilla, and Bora Le Ale. The new deposits are most extensive in an area E to SE of Alu, along the axial trend that corresponds with Dalaffilla. N is to the top; the original map was at a scale of 1 to approximately 100,000. In the colored version of this map, orange and brighter purple colors represent silicic rocks and darker purple and blue colors represent basaltic rocks. From Barbari and Varet (1972). |
Thermal radiance remained significant into at least early December. Available news reports claimed the area of new lavas as 20-fold larger than they turned out to be, casting doubt on their other descriptions of the eruption. Still, the plume reached 13-16 km altitude and delivered ~ 10,000-20,000 metric tons of SO2 into the atmosphere.
Geolocation errors. During the early phases of this eruption, while attempting to determine the source volcano, it became apparent that the GVP coordinates for Alu were displaced towards the E in the area with the new flows. Inaccurate volcano locations can result from older, imprecise, base maps, especially in remote areas. They may also be caused by the lack of a global datum, even when precise maps are available. More recent satellite imagery and mapping techniques are gradually improving the situation, and the location for Alu has been corrected (see figure 7 below).
Eruptive activity. Charles Holliday found Meteosat-9 infrared (IR) satellite data to constrain the eruption's start on 3 November 2008. He went on to estimate the plume's maximum height, which first occurred about one hour after any cloud was first visible. He had images every 15 minutes and found no sign of an eruption cloud as late as 1245 UTC (0945 local time). This was followed by a small initial cloud appearing at 1300 UTC, which then grew to larger clouds blowing E. Looking at the Meteosat-7 IR data, Holliday found the eruption at around 1350 UTC.
Holliday determined the sequence of coldest pixels (table 2). He found the coldest pixel of the set in an image representing Meteosat-9 at 1350 UTC, about -73°C, and by comparing an atmospheric sounding made over Abha, Saudi Arabia inferred a maximum plume height of 15.7 km. The coldest pixel, -64°C, was in a Meteosat-7 IR image from 1350 UTC. Comparison with the same OEAB sounding as above obtained a maximum plume height 13.5 km.
Table 2. Times and coldest pixels related to the Dalaffilla eruption seen in Meteosat-9 IR satellite data on 3 November 2008. The last two rows include ancillary data and results used to describe the coldest pixels on the Meteosat-9 and -7 IR data. The data were used to estimate the maximum cloud height (reached around 1400 UTC). The Meteosat-7 IR data for other times was not available but the one entry (at 1350 UTC) was described as the coldest. Courtesy of Charles Holliday.
| Time (UTC) on 3 Nov | Coldest pixel from IR image Meteosat-9 (Meteosat-7) |
| 1300 | -66°C (?) |
| 1315 | -73°C (?) |
| 1330 | -71°C (?) |
| 1345 | -71°C (@1350 UTC, -64°C) |
| 1400 | -73°C (?) |
| 1415 | -73°C (?) |
| 1430 | -71°C (?) |
| Atmospheric sounding at 1200 UTC from Rawinsonde station at Abha, Saudi Arabia, WMO 41112, OEAB; located ~545 km NNE (at 18.24°N, 42.66°E). Equatorial subpoints (IR resolution): Meteosat-7, 57.5°E (5 km); Meteosat-9, 0° (3 km). | |
| Conclusion (Plume top estimates): | Meteosat-9, 15.7 km altitude at 1315 UTC |
| Meteosat-7, 13.5 km altitude at 1350 UTC | |
Activity could also be identified in a MODIS (Moderate-resolution Imaging Spectro-radiometer) image from 4 November (figure 4), a composite using three of 36 available bands, from orange-red and into the IR (bands 7-2-1). Although the areas of high thermal flux may lack detail on this 250-m resolution image, that area lacks the SW-directed spur seen on some later photos.
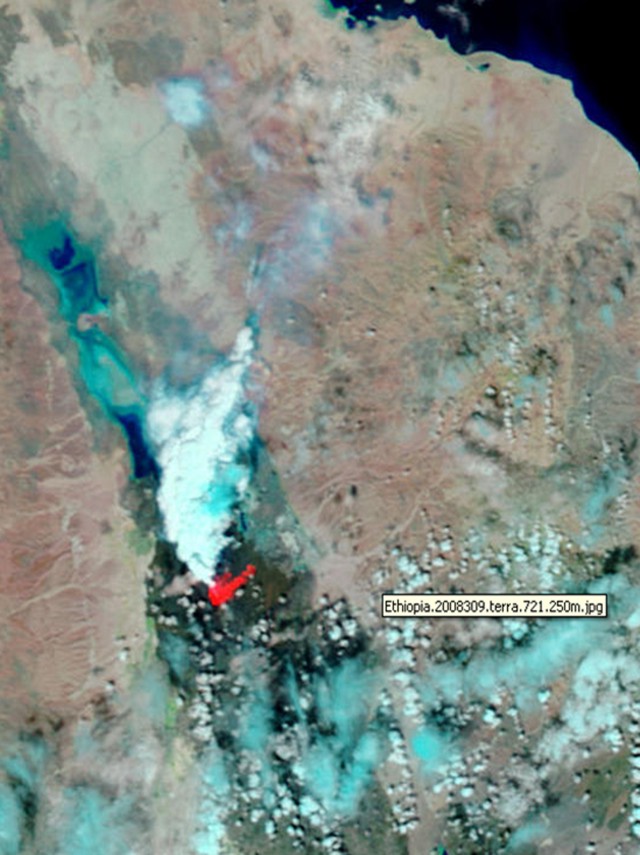 |
Figure 4. The Dalaffilla eruption as it appeared on a MODIS image for 0730 UTC on 4 November 2008. By this time the lava had spread considerably NW but the spur of lava seen later to the SW was not in evidence on this image with pixel size of 250 m. The image compiled bands 7, 2, and 1. Courtesy of NASA. |
In a 6 November message Simon Carn noted that in terms of sulfur dioxide (SO2), the November eruption generated a large cloud. As detected by the Ozone Monitoring Instrument (OMI) and the Atmospheric Infrared Sounder (AIRS), the cloud initially drifted E over the Arabian peninsula. The cloud was clearly linked to the eruption because MODIS/MODVOLC data from the Hawai'i Institute of Geophysics and Planetology (HIGP) Thermal Alerts System confirmed an extensive hotspot.
A total of 0.1-0.2 Tg (tetragram) of SO2 (1 Tg = 1012 g = 109 kg = 106 Tons) was measured in the eruption cloud by OMI at ~ 1100 UTC on 4 November, by which time the SO2 cloud had reached S Iran. The cloud had dissipated and moved east by the next day (figure 5). On 6 November, the plume appeared the same or even stronger than the one the previous day. But on subsequent days the plumes became much smaller.
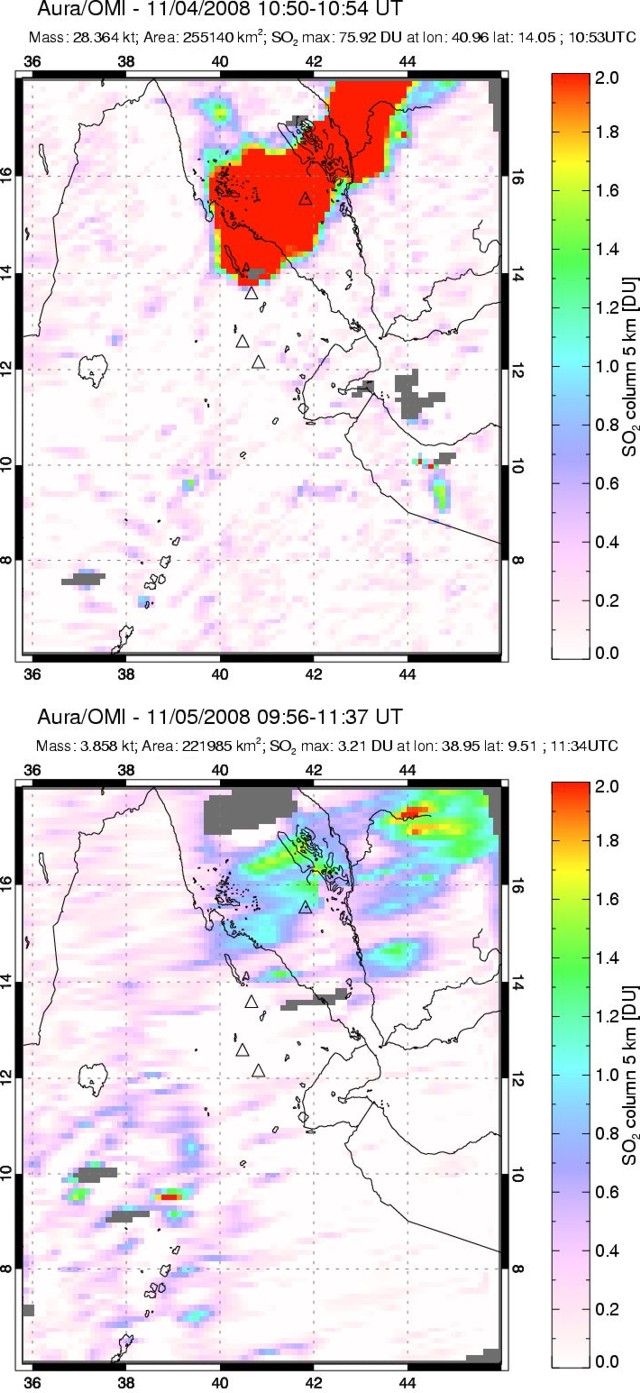 |
Figure 5. OMI snapshots of the Dalafilla SO2 plume stretching NE on 4-5 November 2008. During 1050-1054 UTC on 4 November there was a very dense, broad, and unbroken plume truncated at the image's N margin. For 5 November during 0956-1137 UTC, an often more diffuse and segmented plume with greatest density near the Yemen-Saudi Arabian border. The 2° N-S increments scribed on the margins represent 222 km.Courtesy of Simon Carn and the OMI website. |
NASA's Earth Observatory first discussed this phase of the eruption with reference to a MODIS image captured on 4 November. Owing to an extensive white plume, the analysts could not make out the lava field, but they saw widespread haze towards the N (figure 6) that they and NOAA analysts interpreted as vog (volcanic smog, which results from volcanic gases such as SO2 mixing with water vapor and oxygen in the presence of sunlight).
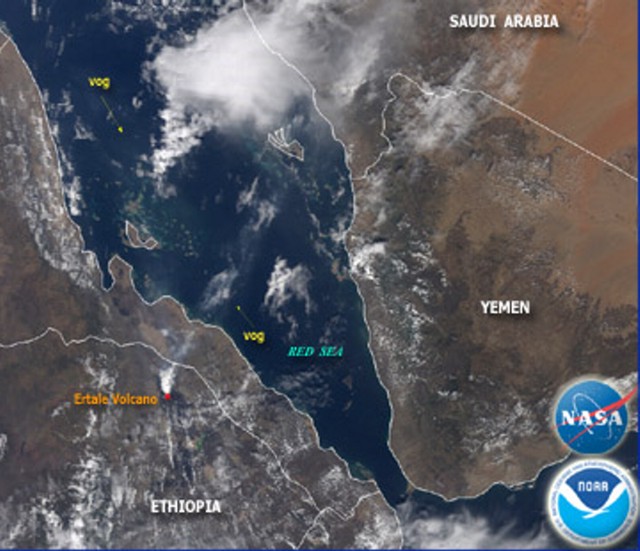 |
Figure 6. A MODIS image from showing widespread haze to the N of the Dalaffilla eruption site at 0735 UTC on 4 November. At this early phase of the eruption analysts incorrectly attributed the eruption to Erta Ale. Courtesy of NOAA/NASA. |
Matthew Patrick of the USGS processed and provided a nighttime ASTER image, taken 8 November 2008 at 1942 UTC, showing the lava flow between Dalaffilla and Alu volcanoes, and Simon Carn superimposed it on Google Earth imagery (figure 7). Carn noted that the underlying pre-eruption Google Earth imagery shows relatively youthful cinder cones and lava flows in this region.
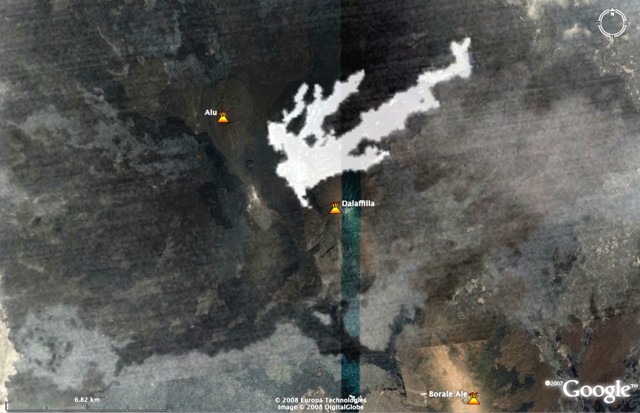 |
Figure 7. The pattern of high thermal flux in the Dalaffilla area superimposed on a Google Earth map with the corrected placemark locations. Courtesy of Matt Patrick and Simon Carn. |
Patrick made these preliminary assessments based on 90-m resolution thermal infrared (TIR) data from 8 November, and on later visible data. The registration between these data sets was imperfect in the E-W direction. The lava flow comprised a multi-lobed field from a fissure or fissure system. Flow direction was transverse to the rift axis, to the NE. The flow field on 8 November was 9.3 km long by ~ 3.0 km wide, and its surface area was 14.9 km2. The flows originated from NW-trending fissures extending over a distance of 2.7 km.
Patrick later noted that the main channel originated along a fissure that cut the surface near a prominent older cinder cone. The cone was visible in the pre-eruption Google Earth imagery. The geologic map by Barberi and Varet (1970), shows similar NW-SE-trending eruptive fissures of likely Holocene age (cutting the youngest basalts) in this same area between Dalafilla and Alu (figure 3).
A second Earth Observatory report featured one ASTER image made before the eruption, and another several weeks after on 16 November (figure 8). That figure presents one of the better images for inspecting the upper lava flow field (which appears dark in the image).
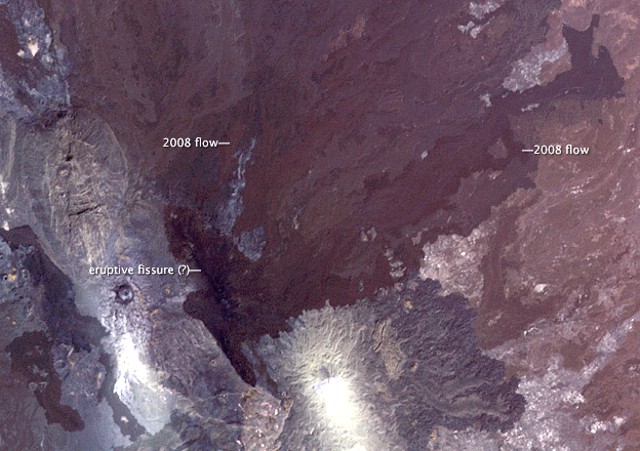 |
Figure 8. Dalaffilla (bottom center) and Alu (ellipse, left center) volcanoes and the new lava flow field that flowed downslope to the NE. Courtesy of NASA Earth Observatory. |
MODVOLC Thermal Alerts. In harmony with the IR data above, satellite thermal alerts (anomalies) measured by the Hawai'i Institute of Geophysics and Planetology (HIGP) Thermal Alerts System swelled. For years before 3 November 2008 they stood at zero. On 3 November they rose to 148 pixels. On passes the next day the number of thermal-alert pixels had dropped and continued to descend (at 0735 UTC, 31 anomalies; at 1040 UTC, 18 anomalies). Thereafter through at least early December, many days had 1 to 10 thermal alert pixels. On occasional days, particularly during 5-17 November, as many as 26 appeared. As of early December, the anomalies were still around several pixels. Spatially, these anomalies typically overlay and extended beyond the flow field.
References. Barberi, F., and Varet, J., 1970, The Erta Ale volcanic range (Danakill depression, Northern Afar, Ethiopia): Bull Volc., v. 34, p. 848-917.
Barberi, F., and Varet, J., 1972, Geological map of the Erta Ale volcanic range (Danakil depression, Northern Afar, Ethiopia): Centre National de la Recherche Scientifique (France) and Consiglio Nazionale delle Ricerche (Italy), approximate scale, 1:100,000, includes explanatory text, ISBN 2-222-01521-9.
Barberi, F., and Varet, J., 1975, Volcanological research in Afar (L.R. Wager Prize Lecture): Bull. Volc., v. 39, no. 2, p. 5-13.
Wright, T.J., Ebinger, C., Biggs, J., Ayele A., Yirgu, G., Keir, D., and Stork, A., 2006, Magma-maintained rift segmentation at continental rupture in the 2005 Afar dyking episode: Nature, v. 442, p. 291-294 (20 July 2006), doi:10.1038/nature04978.
Wood, J., and Guth, A., 2008, East Africa's Great Rift Valley: a complex rift system: Geology.com (URL: http://geology.com/articles/east-africa-rift.shtml)
Information Contacts: Jacques Varet, Geoscience for a Sustainable Earth, BRGM 3, avenue Claude-Guillemin, 45060 Orléans cedex 02, France; Charles Holliday, U.S. Air Force Weather Agency (AFWA)/XOGM, Offutt Air Force Base, NE 68113, USA; Matthew R. Patrick, Hawaiian Volcano Observatory (HVO), U.S. Geological Survey, PO Box 51, Hawai'i National Park, HI 96718, USA (URL: https://volcanoes.usgs.gov/observatories/hvo/); Simon Carn, Dept of Geological and Mining Engineering and Sciences, Michigan Technological University, 1400 Townsend Dr., Houghton, MI 49931, USA (URL: https://so2.gsfc.nasa.gov/); Hawai'i Institute of Geophysics and Planetology (HIGP) Thermal Alerts System, School of Ocean and Earth Science and Technology (SOEST), Univ. of Hawai'i, 2525 Correa Road, Honolulu, HI 96822, USA (URL: http://modis.higp.hawaii.edu/); Gezahegn Yirgu, Dept of Earth Sciences, Addis Ababa University, PO Box 1176, Addis Ababa, Ethiopia; NASA Earth Observatory (URL: http://earthobservatory.nasa.gov/).
Lava flow-field size unchanged for months; thermal alerts ceased 28 December
The eruption that began on 3 November 2008 (BGVN 33:10) significantly slowed or ceased prior to January 2009. The region is the scene of sporadic fighting, thwarting direct reports from people in the field, and forcing greater reliance on remote-sensing imagery.
Looking at Advanced Spaceborne Thermal Emission and Reflection Radiometer (ASTER) satellite system images for 19 December 2008 and 4 January 2009 (figure 9), Matt Patrick found little significant change in the shape or area of the lava flow field since 8 November 2008 (see image in BGVN 33:10).
|
Figure 9. Satellite ASTER images over Dalaffilla and Alu volcanoes on 19 December 2008 and 4 January 2009. Shown are nighttime thermal images (band 14, 11-micron wavelength) showing flow to the NE from a fissure or fissure system between the volcanoes. Courtesy of Matt Patrick. |
Thermal alerts over the eruption site reported by the MODVOLC system were absent after 28 December 2008 (figure 10) through at least early February 2009. At the start of the eruption (identified on 3 November at 1920 UTC) there were 148 alerts in a circular pattern well extending outboard but engulfing the densest area of alerts over the main lava field. Following the initial eruption, the alert pixels concentrated primarily on the lava flow. No thermal anomalies were detected for at least several years before the November eruption.
|
Figure 10. A plot of the maximum number of daily MODVOLC thermal alerts at Dalaffilla during November-December 2008. Courtesy of the Hawai'i Institute of Geophysics and Planetology (HIGP) Thermal Alerts System. |
NASA's Earth Observatory (EO) released a true-color image captured by Taiwan's Formosat-2 satellite (figure 11). The image caption, by Ralph Harrington, noted that fresh flows from the recent eruption appear darker than the older weathered flows. Lava spread from the fissure several kilometers to the NE, as well as S and SW. The image also appears to show spatter cones associated with the fissures.
|
Figure 11. A Formosat-2 satellite true-color image (enhanced here) acquired 25 December 2008 of the Alu and Dalaffilla portion of the Erta Ale range of the Afar region. FORMOSAT-2, developed by the National Space Organization (NSPO), launched in 2004 with 2-m panchromatic resolution and 8-m multi-spectral resolution. Courtesy of NASA Earth Observatory, with image provided by Cheng-Chien Liu, National Cheng-Kung University, and An-Ming Wu, NSPO, Taiwan. |
Information Contacts: NASA Earth Observatory (URL: http://earthobservatory.nasa.gov/); Ralph Harrington, The Volcanism Blog (URL: http://volcanism.wordpress.com); Matthew R. Patrick, Hawaiian Volcano Observatory (HVO), U.S. Geological Survey, PO Box 51, Hawai'i National Park, HI 96718, USA; Simon Carn, Department of Geological and Mining Engineering and Sciences, Michigan Technological University, 1400 Townsend Dr., Houghton, MI 49931, USA (URL: https://so2.gsfc.nasa.gov/); Hawai'i Institute of Geophysics and Planetology (HIGP) Thermal Alerts System, School of Ocean and Earth Science and Technology (SOEST), Univ. of Hawai'i, 2525 Correa Road, Honolulu, HI 96822, USA (URL: http://modis.higp.hawaii.edu/).
This compilation of synonyms and subsidiary features may not be comprehensive. Features are organized into four major categories: Cones, Craters, Domes, and Thermal Features. Synonyms of features appear indented below the primary name. In some cases additional feature type, elevation, or location details are provided.
Cones |
||||
| Feature Name | Feature Type | Elevation | Latitude | Longitude |
|
Dalafilla
Gaolule Gabuli Dala Filla |
Stratovolcano | 578 m | 13° 47' 34" N | 40° 33' 12" E |
Craters |
||||
| Feature Name | Feature Type | Elevation | Latitude | Longitude |
| Alu | Fissure vent | 399 m | 13° 49' 12" N | 40° 30' 41" E |
| Alu-South | Fissure vent | 376 m | 13° 47' 6" N | 40° 32' 17" E |
|
|
||||||||||||||||||||||||
There is data available for 1 confirmed Holocene eruptive periods.
2008 Nov 3 - 2008 Dec 16 (?) ± 15 days Confirmed Eruption Max VEI: 3 (?)
| Episode 1 | Eruption Episode | W and NW of Dalaffilla | |||||||||||||||||||||||||||||
|---|---|---|---|---|---|---|---|---|---|---|---|---|---|---|---|---|---|---|---|---|---|---|---|---|---|---|---|---|---|---|
| 2008 Nov 3 - 2008 Dec 16 (?) ± 15 days | Evidence from Observations: Reported | |||||||||||||||||||||||||||||
|
List of 4 Events for Episode 1 at W and NW of Dalaffilla
| ||||||||||||||||||||||||||||||
There is data available for 3 deformation periods. Expand each entry for additional details.
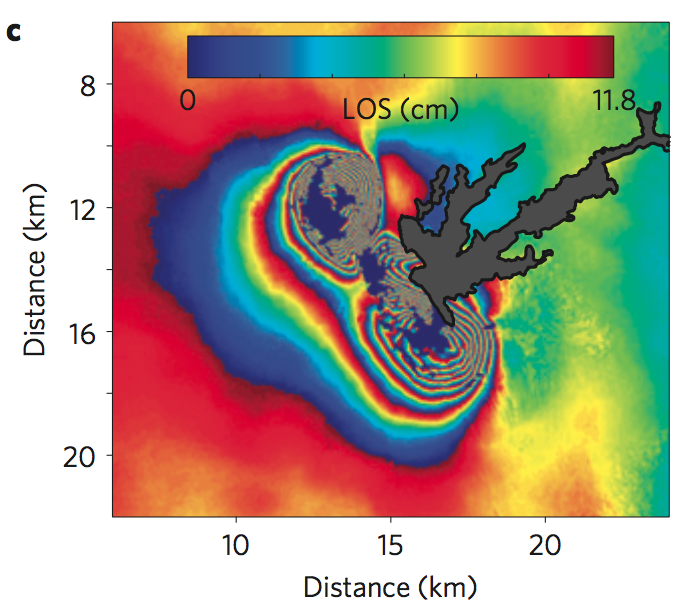
| Start Date: 2008 Nov 19 | Stop Date: 2010 | Direction: Uplift | Method: InSAR |
| Magnitude: Unknown | Spatial Extent: 10.00 km | Latitude: 14.000 | Longitude: 41.000 |
Remarks: Post-eruptive uplift in same pattern as co-eruptive subsidence. Uplift began on 5 November 2008 for the northern portion, and on 19 November 2008 for the southern portion | |||
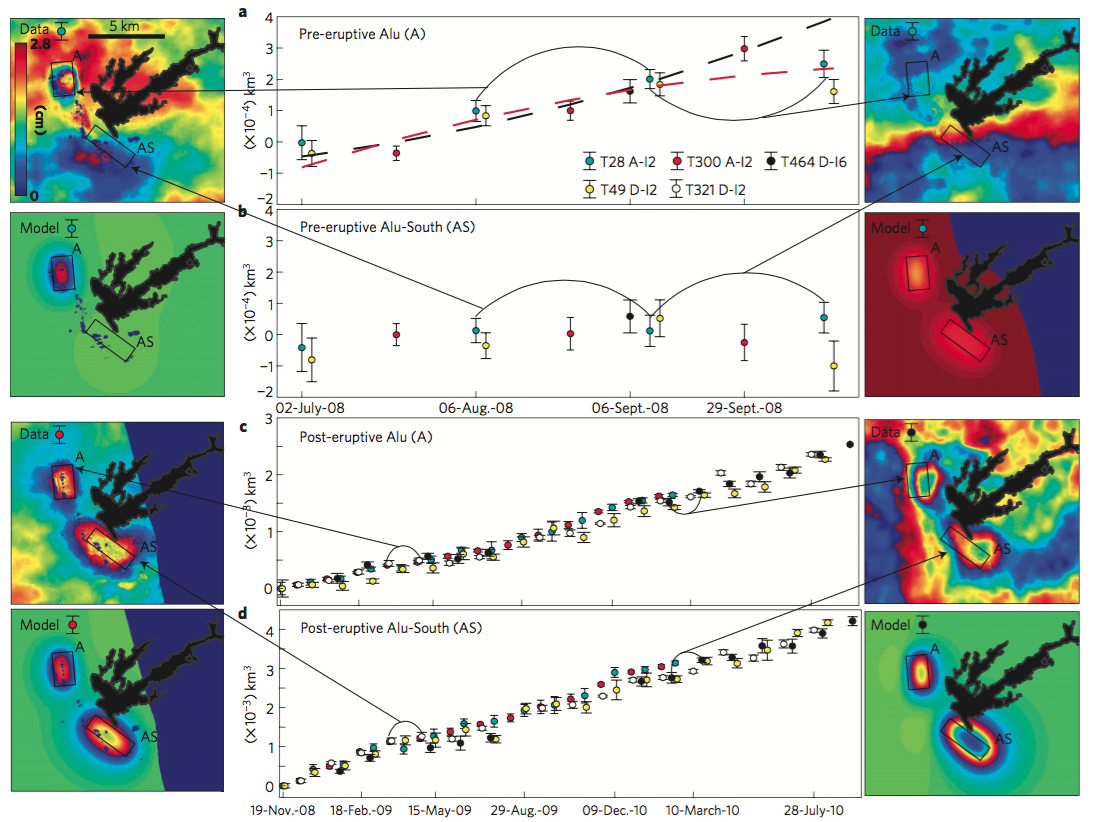 |
Time-evolving cumulative volume changes. a,b, Pre-eruptive and c,d, post-eruptive periods. Circles represent acquisitions colour-coded to satellite track number, orbit and mode (for example A-I2, ascending orbit in mode 2). The red dashed line in a represents the best-fit curve using all the data, whereas the black dashed line is the best-fit curve excluding the last two circles. The lines highlight the different deformation patterns, uplift July?September 2008 but quiescence a month before the eruption. Selected interferograms and their models are shown for given time intervals on the sides. The colour bar shown in the upper left corner applies to all interferograms. From: Pagli et al. 2012. |
||
Reference List: Pagli et al. 2012.
Full References:
Pagli, C., T. J. Wright, C. J. Ebinger, S.H. Yun, J. R. Cann, T. Barnie, and A. Ayele,, 2012. Shallow axial magma chamber at the slow spreading Erta Ale Ridge. Nature Geoscience, 5: 284-288.
| Start Date: 2008 Nov | Stop Date: 2008 Nov | Direction: Subsidence | Method: InSAR |
| Magnitude: 190.000 cm | Spatial Extent: 10.00 km | Latitude: 14.000 | Longitude: 41.000 |
Remarks: Co-eruptive subsidence modeled by a dike, sill, and Mogi source | |||
 |
ALOS ascending co-eruptive interferogram From: Pagli et al. 2012. |
||
Reference List: Pagli et al. 2012.
Full References:
Pagli, C., T. J. Wright, C. J. Ebinger, S.H. Yun, J. R. Cann, T. Barnie, and A. Ayele,, 2012. Shallow axial magma chamber at the slow spreading Erta Ale Ridge. Nature Geoscience, 5: 284-288.
| Start Date: 2008 Jul | Stop Date: 2008 Sep | Direction: Uplift | Method: InSAR |
| Magnitude: 9.000 cm | Spatial Extent: 3.00 km | Latitude: 14.000 | Longitude: 41.000 |
Remarks: Pre-eruptive deformation prior to November 2008 Alu-Dalafilla eruption | |||
|
Time-evolving cumulative volume changes. a,b, Pre-eruptive and c,d, post-eruptive periods. Circles represent acquisitions colour-coded to satellite track number, orbit and mode (for example A-I2, ascending orbit in mode 2). The red dashed line in a represents the best-fit curve using all the data, whereas the black dashed line is the best-fit curve excluding the last two circles. The lines highlight the different deformation patterns, uplift July?September 2008 but quiescence a month before the eruption. Selected interferograms and their models are shown for given time intervals on the sides. The colour bar shown in the upper left corner applies to all interferograms. From: Pagli et al. 2012. |
||
Reference List: Pagli et al. 2012.
Full References:
Pagli, C., T. J. Wright, C. J. Ebinger, S.H. Yun, J. R. Cann, T. Barnie, and A. Ayele,, 2012. Shallow axial magma chamber at the slow spreading Erta Ale Ridge. Nature Geoscience, 5: 284-288.
There is data available for 1 emission periods. Expand each entry for additional details.
| Start Date: 2008 Nov 03 | Stop Date: 2008 Nov 03 | Method: Satellite (Aura OMI) |
| SO2 Altitude Min: 16 km | SO2 Altitude Max: 16 km | Total SO2 Mass: 150 kt |
Data Details
| Date Start | Date End | Assumed SO2 Altitude | SO2 Algorithm | SO2 Mass |
| 20081103 | 16.0 | 150.000 |
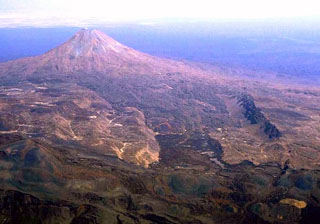 The steep-sided, conical Dalafilla volcano rises 300 m above surrounding lava fields of Alu volcano in the foreground in this view from the NW. This morphology, unusual for the Erta Ale Range volcanoes, results from the extrusion of viscous, silicic lava flows. These silicic flows extend primarily to the east from the 613-m-high summit. On the western side they are blocked by walls of a horst structure along the crest of the Erta Ale Range that forms the linear ridge in the right side of the photo.
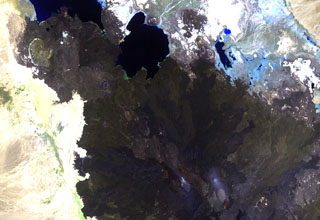 The summit region of Alu volcano is located left of the center of this Landsat image, south of Lake Bakili (top center). Alu lies SE of Gada Ale volcano (upper left), which rises above the western shore of the lake, and NW of Dalafilla volcano (bottom center). Fissure vents west of the horst have fed silicic lava flows, and other fissures to the south have produced voluminous basaltic lava flows that extend north as far as Lake Bakili.
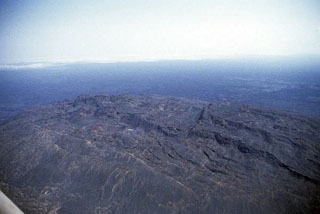 The summit region of Alu volcano is primarily composed of older basaltic lava flows. Major fumarolic activity is located on the numerous parallel faults, some of which have scarps up to 100 m high. Fissure vents west of the horst have fed silicic lava flows, and other fissures to the south have produced voluminous basaltic lava flows that extend north as far as Lake Bakili.
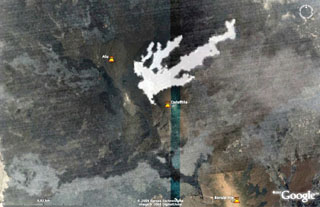 This nighttime ASTER image, taken on 8 November 2008 at 1942 UTC shows in white the lava flows between Dalafilla and Alu volcanoes superimposed on Google Earth imagery. The first historical eruption began on 3 November 2008 from one or more fissures located W and NW, between Dalafilla and Alu volcanoes. An initial sulfur-rich eruption plume was followed by extensive lava flows to the NE. MODIS thermal alerts were detected until 28 December.
The maps shown below have been scanned from the GVP map archives and include the volcano on this page. Clicking on the small images will load the full 300 dpi map. Very small-scale maps (such as world maps) are not included. The maps database originated over 30 years ago, but was only recently updated and connected to our main database. We welcome users to tell us if they see incorrect information or other problems with the maps; please use the Contact GVP link at the bottom of the page to send us email.
There are no samples for Alu-Dalafilla in the Smithsonian's NMNH Department of Mineral Sciences Rock and Ore collection.
| Copernicus Browser | The Copernicus Browser replaced the Sentinel Hub Playground browser in 2023, to provide access to Earth observation archives from the Copernicus Data Space Ecosystem, the main distribution platform for data from the EU Copernicus missions. |
| MIROVA | Middle InfraRed Observation of Volcanic Activity (MIROVA) is a near real time volcanic hot-spot detection system based on the analysis of MODIS (Moderate Resolution Imaging Spectroradiometer) data. In particular, MIROVA uses the Middle InfraRed Radiation (MIR), measured over target volcanoes, in order to detect, locate and measure the heat radiation sourced from volcanic activity. |
| MODVOLC Thermal Alerts | Using infrared satellite Moderate Resolution Imaging Spectroradiometer (MODIS) data, scientists at the Hawai'i Institute of Geophysics and Planetology, University of Hawai'i, developed an automated system called MODVOLC to map thermal hot-spots in near real time. For each MODIS image, the algorithm automatically scans each 1 km pixel within it to check for high-temperature hot-spots. When one is found the date, time, location, and intensity are recorded. MODIS looks at every square km of the Earth every 48 hours, once during the day and once during the night, and the presence of two MODIS sensors in space allows at least four hot-spot observations every two days. Each day updated global maps are compiled to display the locations of all hot spots detected in the previous 24 hours. There is a drop-down list with volcano names which allow users to 'zoom-in' and examine the distribution of hot-spots at a variety of spatial scales. |
|
WOVOdat
Single Volcano View Temporal Evolution of Unrest Side by Side Volcanoes |
WOVOdat is a database of volcanic unrest; instrumentally and visually recorded changes in seismicity, ground deformation, gas emission, and other parameters from their normal baselines. It is sponsored by the World Organization of Volcano Observatories (WOVO) and presently hosted at the Earth Observatory of Singapore.
GVMID Data on Volcano Monitoring Infrastructure The Global Volcano Monitoring Infrastructure Database GVMID, is aimed at documenting and improving capabilities of volcano monitoring from the ground and space. GVMID should provide a snapshot and baseline view of the techniques and instrumentation that are in place at various volcanoes, which can be use by volcano observatories as reference to setup new monitoring system or improving networks at a specific volcano. These data will allow identification of what monitoring gaps exist, which can be then targeted by remote sensing infrastructure and future instrument deployments. |
| Volcanic Hazard Maps | The IAVCEI Commission on Volcanic Hazards and Risk has a Volcanic Hazard Maps database designed to serve as a resource for hazard mappers (or other interested parties) to explore how common issues in hazard map development have been addressed at different volcanoes, in different countries, for different hazards, and for different intended audiences. In addition to the comprehensive, searchable Volcanic Hazard Maps Database, this website contains information about diversity of volcanic hazard maps, illustrated using examples from the database. This site is for educational purposes related to volcanic hazard maps. Hazard maps found on this website should not be used for emergency purposes. For the most recent, official hazard map for a particular volcano, please seek out the proper institutional authorities on the matter. |
| IRIS seismic stations/networks | Incorporated Research Institutions for Seismology (IRIS) Data Services map showing the location of seismic stations from all available networks (permanent or temporary) within a radius of 0.18° (about 20 km at mid-latitudes) from the given location of Alu-Dalafilla. Users can customize a variety of filters and options in the left panel. Note that if there are no stations are known the map will default to show the entire world with a "No data matched request" error notice. |
| UNAVCO GPS/GNSS stations | Geodetic Data Services map from UNAVCO showing the location of GPS/GNSS stations from all available networks (permanent or temporary) within a radius of 20 km from the given location of Alu-Dalafilla. Users can customize the data search based on station or network names, location, and time window. Requires Adobe Flash Player. |
| DECADE Data | The DECADE portal, still in the developmental stage, serves as an example of the proposed interoperability between The Smithsonian Institution's Global Volcanism Program, the Mapping Gas Emissions (MaGa) Database, and the EarthChem Geochemical Portal. The Deep Earth Carbon Degassing (DECADE) initiative seeks to use new and established technologies to determine accurate global fluxes of volcanic CO2 to the atmosphere, but installing CO2 monitoring networks on 20 of the world's 150 most actively degassing volcanoes. The group uses related laboratory-based studies (direct gas sampling and analysis, melt inclusions) to provide new data for direct degassing of deep earth carbon to the atmosphere. |
| Large Eruptions of Alu-Dalafilla | Information about large Quaternary eruptions (VEI >= 4) is cataloged in the Large Magnitude Explosive Volcanic Eruptions (LaMEVE) database of the Volcano Global Risk Identification and Analysis Project (VOGRIPA). |
| EarthChem | EarthChem develops and maintains databases, software, and services that support the preservation, discovery, access and analysis of geochemical data, and facilitate their integration with the broad array of other available earth science parameters. EarthChem is operated by a joint team of disciplinary scientists, data scientists, data managers and information technology developers who are part of the NSF-funded data facility Integrated Earth Data Applications (IEDA). IEDA is a collaborative effort of EarthChem and the Marine Geoscience Data System (MGDS). |

