
According to NASA's Earth Observatory, satellite images of Nabro acquired on 28 September showed heat from the vent in the central crater, and from an area 1.3 km S of the vent that indicated an active lava flow. A small and diffuse plume rose from the vent. A region of seemingly thicker black ash (that completely covered the sparse vegetation) was noted S of the crater and thinner layers of ash (with some areas of visible vegetation) flanked either side of the region.
Source: NASA Earth Observatory
Thermal alerts ended mid-2012; revised 2011 plume heights; uplift mechanisms debated
This report shows satellite thermal alerts from the MODVOLC system showing that they continued for 7 months after the end of coverage in our one report on Nabro's June 2011 eruption (BGVN 36:09), with the last alert occurring on 3 June 2012.
What has emerged regarding the 2011 Nabro eruption since our one previous report is a much more detailed eruptive timeline and some substantially taller plume-height estimates. These new and more carefully assessed details came out in at least eight papers and three technical comments (see References below).
The initial Toulouse Volcanic Ash Advisory Center estimates cited in BGVN 36:09 were made in the time-limited operational setting that identifies volcanic ash for aviation safety. Those altitude estimates, which included maximum plume heights on 13 June 2011 in the range of 9.1-13.7 km altitude, have since been reassessed using an array of satellite and ground-based instruments and processing strategies. The revised heights in the subsequent papers often determined plume altitudes above the 16-18 km tropopause and into the stratosphere. Absent in our earlier report but well documented in the papers was evidence of a 16 June 2011 eruptive pulse.
Overall, Nabro erupted a total SO2 mass of at ~1.5 Tg (Clarisse and others, 2012), making the eruption the largest SO2 emitter of the 2002-2012 interval (Bourassa and others, 2013). The various papers and the technical comments have also framed debate on how and when Nabro's plume entered stratosphere.
Thermal alerts. This report does not contain any new in situ observations at Nabro. Table 1 shows MODVOLC thermal alerts during November 2011 and into 2012 on the basis of the number of days with alerts in these months. Those alerts stem from observations made with the MODIS instrument that flies on the Terra and Aqua satellites. Our previous report discussed alerts as late as 5 November 2011, but additional alerts were issued later in the month. For this table, January 2012 was the month with the largest number of days with alerts, 15 days. As of late 2014, the last posted alert was issued on 3 June 2012.
Table 1. MODVOLC thermal alerts recorded for Nabro from November 2012 through September 2014. Courtesy of MODVOLC.
| Month | Number of days with alerts |
| November 2011 | 11 |
| December 2011 | 08 |
| January 2012 | 15 |
| February 2012 | 12 |
| March 2012 | 07 |
| April 2012 | 11 |
| May 2012 | 11 |
| June 2012 | 01 |
Although the earlier alerts may signify ongoing eruption, some of the later alerts could stem from ongoing post-eruptive thermal radiance from potentially thick lava flows. Absence of alerts could be the result of clouds masking the volcano, although that is unlikely significant in the terminal alert registered in June 2012. It also bears noting that the alerts are at a fairly high threshold.
References. Bourassa, AE, Robock, A, Randel, WJ, Deshler, T, Rieger, LA, Lloyd, ND, Llewellyn, EJ, and Degenstein, DA, 2012, Large Volcanic Aerosol Load in the Stratosphere Linked to Asian Monsoon Transport. Science 337 (6090):78-81. DOI: 10.1126/science.1219371.
Bourassa, AE, Robock, A, Randel, WJ, Deshler, T, Rieger, LA, Lloyd, ND, Llewellyn, EJ, and Degenstein, DA, 2013, Response to Comments on "Large volcanic aerosol load in the stratosphere linked to Asian Monsoon transport. Science, 339 (6120), 647, DOI: 10.1126/science.1227961.
Clarisse, L., P.-F. Coheur, N. Theys, D. Hurtmans, and C. Clerbaux, 2014, The 2011 Nabro eruption, a SO2 plume height analysis using IASI measurements, Atmos. Chem. Phys., 14, 3095-3111,DOI:10.5194/acp-14-3095-2014.
Clarisse, L., Hurtmans, D., Clerbaux, C., Hadji-Lazaro, J., Ngadi, Y., & Coheur, P. F., 2012, Retrieval of sulphur dioxide from the infrared atmospheric sounding interferometer (IASI). Atmospheric Measurement Techniques Discussions, 4, 7241-7275 [13 March 2012; revised from 2011 version] www.atmos-meas-tech.net/5/581/2012/; DOI:10.5194/amt-5-581-2012.
Fairlie, T. D., Vernier, J.-P., Natarajan, M., and Bedka, K. M., 2014, Dispersion of the Nabro volcanic plume and its relation to the Asian summer monsoon, Atmos. Chem. Phys., 14, 7045-7057, DOI:10.5194/acp-14-7045-2014, 2014.
Fromm, M, Nedoluha, G, and Charvat, Z, 2013, Comment on "Large Volcanic Aerosol Load in the Stratosphere Linked to Asian Monsoon Transport." Science 339 (6120). DOI: 10.1126/science.1228605.
Fromm, M, Kablick, G (III), Nedoluha1, G., Carboni, E., Grainger, R., Campbell, J, and Lewis, J., 2014, Correcting the record of volcanic stratospheric aerosol impact: Nabro and Sarychev Peak, Journal of Geophysical Research. Atmospheres. [Early, online version, accessed August 2014] DOI: 10.1002/2014JD021507
Pan, LL, and Munchak, LA, 2011, Relationship of cloud top to the tropopause and jet structure from CALIPSO data. Journal of Geophysical Research: Atmospheres (1984-2012) 116.D12 (2011).
Penning de Vries, M. J. M., Dörner, S., Pukite, J., Hörmann, C., Fromm, M. D., & Wagner, T. (2014). Characterisation of a stratospheric sulfate plume from the Nabro volcano using a combination of passive satellite measurements in nadir and limb geometry. Atmospheric Chemistry and Physics, 14(15), 8149-8163.
Theys, N., Campion, R., Clarisse, L., Brenot, H., van Gent, J., Dils, B., Corradini, S., Merucci, L., Coheur, P.-F., Van Roozendael, M., Hurtmans, D., Clerbaux, C., Tait, S., and Ferrucci, F.: Volcanic SO2 fluxes derived from satellite data: a survey using OMI, GOME-2, IASI and MODIS, Atmos. Chem. Phys., 13, 5945-5968, doi:10.5194/acp-13-5945-2013, 2013.
Vernier, JP, Thomason, LW, Fairlie, TD, Minnis, P., Palikonda, R, and Bedka, K M, 2013. Comment on "Large Volcanic Aerosol Load in the Stratosphere Linked to Asian Monsoon Transport." Science 339 (6120). DOI: 10.1126/science.1227817.
Information Contacts: Hawai'i Institute of Geophysics and Planetology (HIGP) MODVOLC Thermal Alerts System, School of Ocean and Earth Science and Technology (SOEST), Univ. of Hawai'i, 2525 Correa Road, Honolulu, HI (URL: http://modis.higp.hawaii.edu/); and Toulouse Volcanic Ash Advisory Centre (VAAC) (URL: http://www.meteo.fr/vaac/).
According to NASA's Earth Observatory, satellite images of Nabro acquired on 28 September showed heat from the vent in the central crater, and from an area 1.3 km S of the vent that indicated an active lava flow. A small and diffuse plume rose from the vent. A region of seemingly thicker black ash (that completely covered the sparse vegetation) was noted S of the crater and thinner layers of ash (with some areas of visible vegetation) flanked either side of the region.
Source: NASA Earth Observatory
Based on analyses of satellite imagery, the Toulouse VAAC reported that on 16 July an ash plume from Nabro rose to altitudes below 5.5 km (18,000 ft) a.s.l. A weak eruption detected on 17 July decreased through the day then appeared to have stopped.
Source: Toulouse Volcanic Ash Advisory Centre (VAAC)
A satellite image of Nabro acquired on 29 June showed a clear view of the caldera and the vent within the active crater near the middle of the caldera. Lava flows to the W, and within the crater (E and S of the vent), continued to be hot. A brown ash plume rose from the vent and drifted S.
Source: NASA Earth Observatory
A satellite image of Nabro acquired on 22 June showed a gas-and-ash plume rising from the caldera and drifting W. According to a news article, the eruption resulted in at least seven deaths, injured many, and displaced thousands in Eritrea, and affected about 5,000 Ethiopians living near the border. Two satellite images acquired on 24 June show the erupting vent, plumes and emissions, and lava flows in detail. One false-color image highlighted hot areas throughout the lava flow and flow front, as well as hot material above the vent. Gas emissions rising from the lava flow were also detected. A natural-color image showed fresh but cooled lava flows in the N part of the caldera. A dark ash plume rose from the vent, and at higher altitudes a plume composed of water vapor and sulfur dioxide drifted W and obscured the active lava flow. Black ash deposits covered the landscape to the S and W. During 22-26 June large amounts of sulfur dioxide in the region continued to be detected by satellite images. Based on analyses of satellite imagery, the Toulouse VAAC reported that during 26-27 June plumes rose to altitudes up to 6.1 km (20,000 ft) a.s.l.
Sources: Toulouse Volcanic Ash Advisory Centre (VAAC); NASA Global Sulfur Dioxide Monitoring; Sudan Tribune; NASA Earth Observatory
An eruption from Nabro that started on 12 June continued to produce a plume. Based on analyses of satellite imagery, the Toulouse VAAC reported that during 15-20 June plumes comprised mostly of water and sulfur dioxide rose to altitudes of 6.1-7.9 km (20,000-26,000 ft) a.s.l. Ash was occasionally detected near the volcano. Satellite imagery posted on MODIS Web showed a dark brown ash plume fanning out to the SW on 19 June. A thermal satellite image acquired at night on 19 June revealed a 15-km-long lava flow that had traveled NW. A high-altitude plume, likely rich in water vapor, rose from the erupting vents and a diffuse ash-rich plume drifted SW.
News articles stated that ash had covered a well-known mine that produces edible salt, and had contaminated food and water sources. During 15-16 June several airlines cancelled some domestic and international flights, including in and out of Addis Abeba (Ethiopia), neighboring Djibouti, and Khartoum (Sudan).
Sources: Toulouse Volcanic Ash Advisory Centre (VAAC); Addis Fortune; Bloomberg; NASA MODIS Rapid Response System; NASA Earth Observatory
According to the USGS Earthquake Hazards Program, an earthquake swarm was detected during the evening of 12 June on the border of Ethiopia and Eritrea, in the vicinity of Nabro, the most prominent of three volcanoes with large summit calderas aligned in a NE-SW direction SW of Dubbi volcano. The swarm began at 1837 with an M 5.1 earthquake. Several more were detected between M 4.3 and 5.1 over the next few hours. Two M 5.7 earthquakes at depths of 10.1 km and 9.9 km were detected at 2332 on 12 June and 0003 on 13 June, respectively.
The Toulouse VAAC reported that an eruption from Nabro (originally attributed to Dubbi) started between 0000 and 0200 on 13 June. An eruption plume initially rose to altitudes of 9.1-13.7 km (30,000-45,000 ft) a.s.l. then was later detected at altitudes of 6.1-10.7 km (20,000-35,000 ft) a.s.l. during 13-14 June. According to the Eritrean Ministry of Information, ashfall covered hundreds of kilometers and the government evacuated area residents. Witnesses noted that the eruption had started at about 2100 on 13 June. Satellite images that same day showed the plume drifting more than 1,000 km NW, over parts of Sudan. On 14 June a detached ash cloud was detected over southern Israel according to news articles. A plume from Nabro was not obvious on satellite imagery.
Sources: Toulouse Volcanic Ash Advisory Centre (VAAC); The Jerusalem Post; NASA MODIS Rapid Response System; Eritrean Ministry of Information; US Geological Survey Earthquake Hazards Program
Reports are organized chronologically and indexed below by Month/Year (Publication Volume:Number), and include a one-line summary. Click on the index link or scroll down to read the reports.
First historically observed eruption began 13 June 2011
The first documented historical eruption at Nabro began on 13 June 2011. Nabro lies in a belt of active volcanoes that follows the Red Sea and lies in the Afar Triangle in Southern Eritrea near the border with Ethiopia (figure 1). An earthquake swarm began on 12 June 2011. The swarm included an M 5.1 earthquake in the vicinity of Nabro and early the next day, satellite remote sensing revealed a large ash plume. Tensions remain in the war-ravaged border region of Eritrea and Ethopia; despite an official cease fire, access to the region remains limited. Nabro's eruption delivered large and concentrated SO2 plumes, dropped ash over extensive areas, forced thousands of evacuations, and, according to the Eritrean government, led to fatalities.
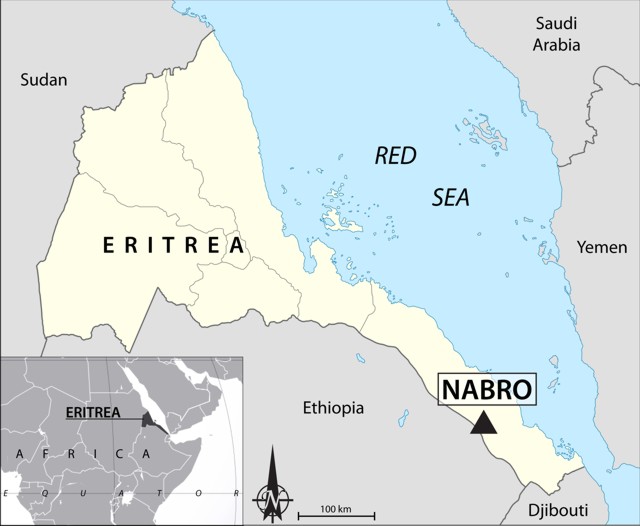 |
Figure 1. Nabro's location in Eritrea and with respect to neighboring countries in East Africa. (Inset) The location of Eritrea in Northeastern Africa along the Red Sea. |
Nabro lies in the midst of a chain of volcanoes (figure 2; dashed lines indicate trends of volcanic ranges). Each of the three main volcanoes on figure 2 contains a prominent summit crater or caldera (figures 3 and 4).
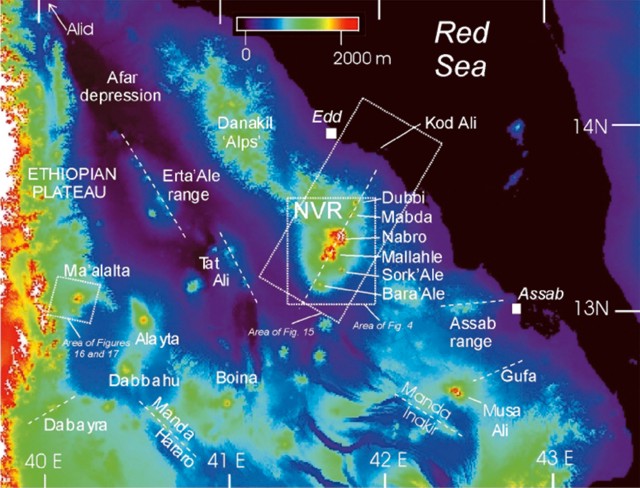 |
Figure 2. A regional map showing Nabro in the volcanic range of the same name (Nabro Volcanic Range, NVR). According to the map's authors (Wiart and Oppenheimer, 2005), the NVR trends with a bearing of N26°E and extends 110 km from the SE margin of the Afar depression at Bara' Ale to islands in the Red Sea. Nabro marks the highest point in the NVR (which the map authors state as 2,248 m, some 30 m higher than the value given in our header, above). Taken from Wiart and Oppenheimer (2005). |
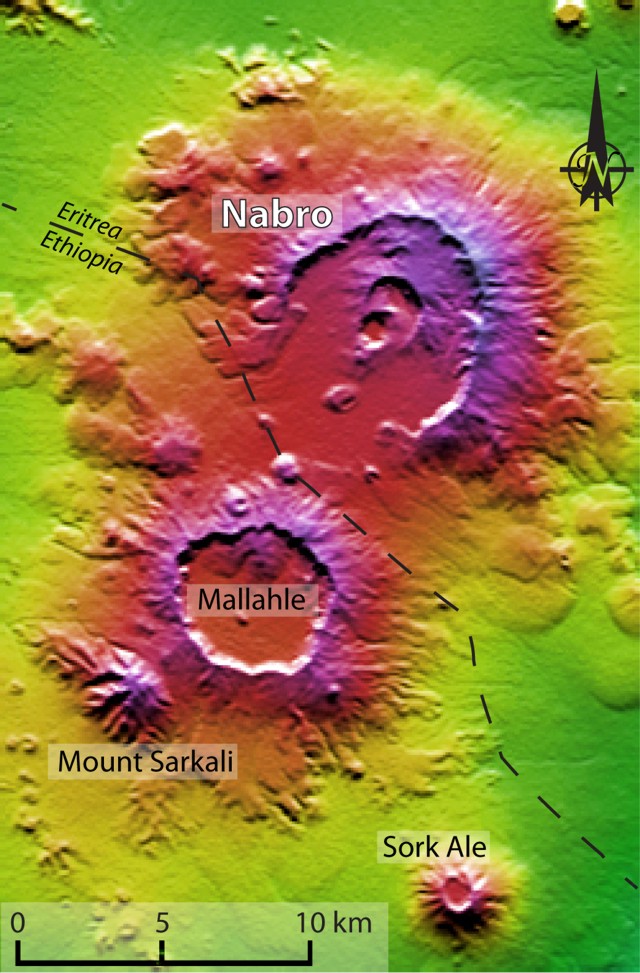 |
Figure 3. Satellite image of the Nabro region taken in February 2000 processed to form a shaded-relief map. When viewed in color, the lower elevations are in green, grading through yellow to red to blue at the highest elevations on the rims of the various nested calderas. Elevation data used in this image was acquired by the Shuttle Radar Topography Mission (SRTM) aboard the NASA Space Shuttle Endeavour. The scale is inexact, and the Eritrean-Ethiopian border is approximate. Courtesy of NASA Jet Propulsion Laboratory. |
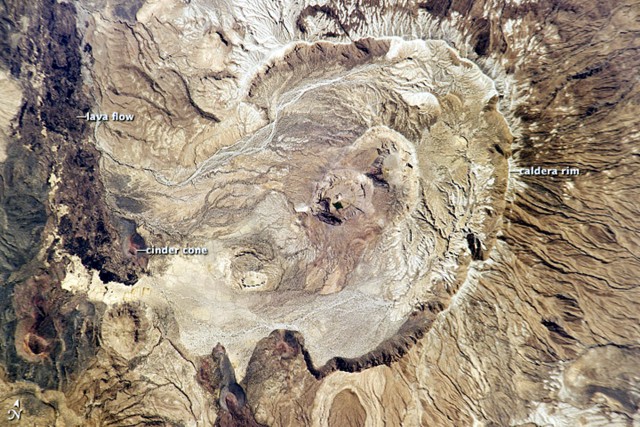 |
Figure 4. Astronauts on the NASA International Space Station took this photograph of Nabro on 30 January 2011, showing the pre-eruption morphology of Nabro and some smaller volcanic centers to the S. Nabro's outer crater is ~8 km across and opens to the SSW. Centered within that larger caldera lie two much smaller craters, one inside the other. The inner wall of the caldera has steep sides, some as high as 400 m. Courtesy of NASA Earth Observatory. |
Seismic precursors. According to an article in the Ethiopian Journal issued on 13 June 2011, a series of moderate earthquakes struck the Eritrea-Ethiopia border region on the evening of 12 June 2011. The U.S. Geological Survey (USGS) reported a total of 14 light-to-moderate earthquakes in the border area, the two strongest being M 5.7, both centered in Eritrea. The series began at 1837 hours when an M 5.1 earthquake struck ~128 km WNW of Assab, a port city in the southern Red Sea region of Eritrea. It occurred at ~10 km depth and was followed by seven smaller ones, between M 4.5 and M 4.8, during the next 2.5 hours. Those were then followed by earthquakes of M 4.7, 4.8, and 5.0. Soon after, at 2332 hours, the first M 5.7 earthquake struck about 123 km WNW of Assab at a depth of 10 km. It was quickly followed by the second M 5.7 earthquake and other smaller earthquakes.
Eruption. The Toulouse Volcanic Ash Advisory Center (VAAC) reported that an eruption from Nabro (originally attributed to Dubbi, ~25 km NNE of Nabro) started between 0300 and 0500 on 13 June 2011. The eruption plume initially rose to altitudes of 9.1-13.7 km; it was detected at altitudes of 6.1-10.7 km during 13-14 June.
According to the Eritrean Ministry of Information, ashfall covered hundreds of square kilometers, and the government evacuated area residents. Eye witnesses first observed the eruption at about 2100 on 13 June. Satellite images that same day showed the plume drifting more than 1,000 km NW, over parts of Sudan. On 14 June 2011 news articles reported that a detached ash cloud was detected over southern Israel. Throughout the eruption, satellite images were nearly the only source of new information about activity.
The Addis Fortune website reported that, although the major eruption took place in Nabro, large quantities of dust from the earthquake occurred in the town of Afambo (~26.5 km N of Nabro). It also reported that the Eritrean government announced that inhabitants had moved to safe areas. The well-known Afdera salt accumulation site in the depression was covered in volcanic ash. The salt, extracted for human and other consumption, had thus become inedible. The ash clouds also caused the cancellation of some domestic and international flights in Eritrea and Ethiopia.
During the week of 15-21 June 2011, Nabro continued to produce plumes. Based on analyses of satellite imagery during that period, the Toulouse VAAC reported that plumes comprised mostly of water and SO2 rose to altitudes of 6.1-7.9 km (figure 5). Ash was occasionally detected near the volcano. Satellite imagery posted on the MODIS/MODVOLC website showed a dark brown ash plume fanning out to the SW on 19 June. By 19 June, the altitude of Nabro's ash plume dropped from a maximum of 14 km to 7.6 km. The ash halted flights in eastern Africa for a time. The eruption killed seven people, according to the Eritrean government, although later reports appeared to discount that. Other reports indicated that thousands were affected in both Eritrea and Ethiopia, though news was sparse.
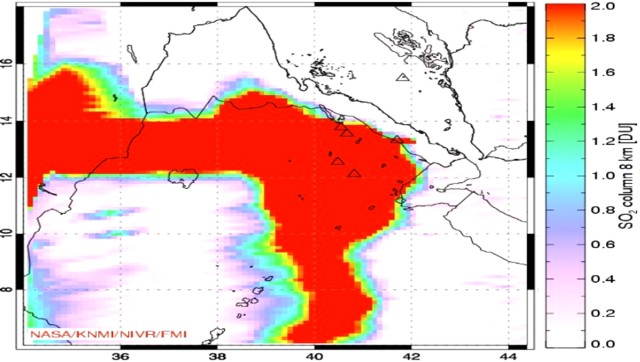 |
Figure 5. This large and intense SO2 gas cloud emitted from Nabro was captured by the OMI satellite's spectrometer during the time interval between 1017 and 1159 UTC on 19 June 2011. The SO2 traveled to the S and the W during the period, and some portions of intense gas clearly extended off this image in those directions. The scale at right is in Dobson Units (DU, a unit common in atmospheric research and widely described in text books). The mass of SO2 depicted on this image was ~103 kilotons (kt); the area of cloud was ~591,000 km2; the maximum SO2 values on the image occurred at the location 40.87°N and 13.14°E and reached 68 DU. Courtesy of Simon Carn, and NASA Global Sulfur Dioxide Monitoring Aura/OMI website. |
A thermal satellite image acquired at night on 19 June revealed a 15-km-long lava flow that had traveled NW (figure 6). A high-altitude plume, likely rich in water vapor, rose from erupting vents; a diffuse ash-rich plume drifted SW. The more restricted plume on 19 June enabled images to reveal a NW-trending lava flow that extended ~15 km from the summit area, although the area of venting remained obscured by a water-rich plume.
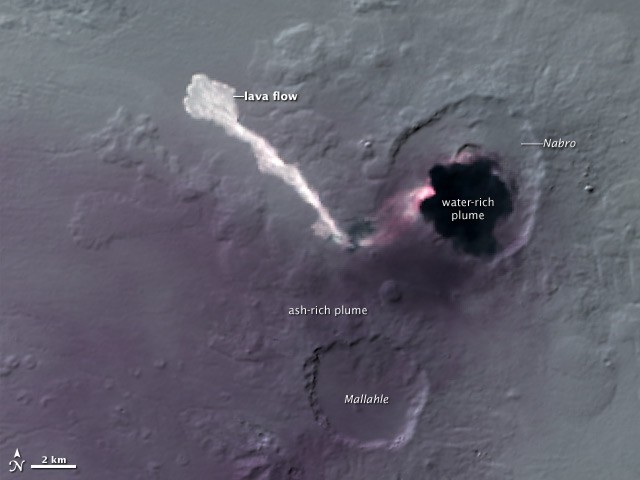 |
Figure 6. A thermal infrared, false-color image of Nabro on 19 June 2011 taken by the Advanced Spaceborne Thermal Emission and Reflection Radiometer (ASTER). Hot areas are bright with new lava flows shown in white, and cold areas are dark. Thermal infrared data were combined with a shaded relief image to show the terrain. Courtesy of NASA Earth Observatory. |
On 22 June a report from the Eritrea Ministry of Energy and Mines stated that the ash and lava covered hundreds of square meters. A satellite image acquired that day showed a gas-and-ash plume rising from the caldera and drifting W. An image from 24 June showed the erupting vent, plumes and emissions, and lava flows (figure 7).
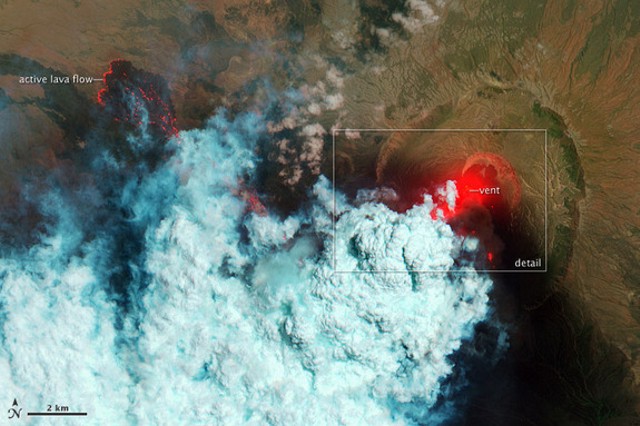 |
Figure 7. A false-color image of Nabro, acquired by the Advanced Land Imager (ALI) aboard the Earth Observing-1 (EO-1) satellite on 24 June 2011, highlighted hot areas throughout the lava flow and flow front, as well as above the vent in the center of the caldera. The bright red portions indicate hot surfaces. To the W, portions of an active lava flow (particularly the flow-front) are also hot. The speckled pattern on upstream portions of the flow is likely due to hardened crust splitting and exposing fluid lava. An ash plume rose from the vent, and at higher altitudes a plume composed of water vapor and SO2 drifted W and obscured the active lava flow. Black ash deposits covered the landscape to the S and W. Courtesy of NASA Earth Observatory. |
During 22-26 June large amounts of SO2 in the region continued to be detected by satellite images. Based on analyses of satellite imagery, the Toulouse VAAC reported that during 26-27 June plumes reached altitudes of up to 6.1 km.
An annotated satellite image acquired on 29 June (figure 8) showed a clear view of the eruption. NASA Earth Observatory analysts labeled what they inferred to be the vent, an area in the main caldera's center and likely engulfing both the two inner craters with either very hot lava or with fresh tephra that probably formed cones or other features whose surface cooled quickly. An ash plume rose from the vent and drifted S. Based on analyses of satellite imagery, the Toulouse VAAC reported that on 16 July an ash plume from Nabro rose to altitudes below 5.5 km. A weak eruption detected on 17 July decreased through the day then appeared to stop.
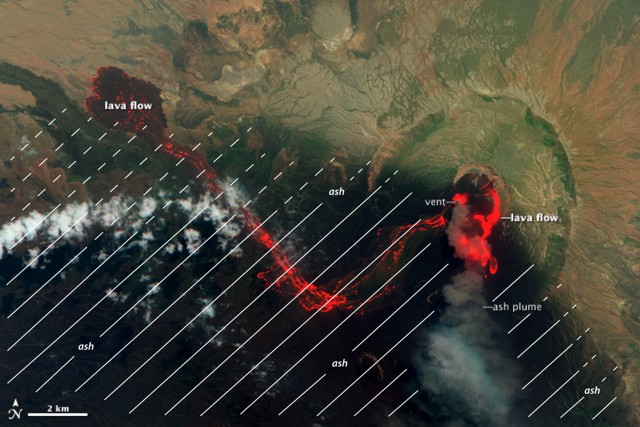 |
Figure 8. A visible and infrared image of Nabro from the Advanced Land Imager (ALI) on the Earth Observing-1 (EO-1) satellite, taken 29 June 2011. The image shows the still-hot lava flow, fresh ash over the lower half of the photo (dark landscape, accentuated by slanting lines or dashes in the lower portion of the image). A diffuse ash plume rose from the vent. The hottest lava is indicated by orange-red, with cooler zones fading to black. The ~15 km long flow on the W side of the volcano is mottled with black, indicating areas with cooler surfaces. The lava to the E and S of the vent appears to be newer, since little of it has cooled. Image and interpretation of NASA Earth Observatory (with lines and additional labels added). |
According to an article by the South Africa Weather and Disaster Information Service (SAWDIS) dated 30 June 2011, a press release from the Eritrean Government disclosed that, though the advancing lava in the nearby village of Sireru had slowed down, a large area of land covered by vegetation was destroyed and river beds were covered within 24 hours.
NASA's Earth Observatory noted that images from 28 September showed heat from the vent in the central crater and from an area 1.3 km S of the vent that indicated an active lava flow. A small and diffuse plume rose from the vent. A region of seemingly thicker black ash (that completely covered the sparse vegetation) was noted S of the crater and thinner layers of ash (with some areas of visible vegetation) flanked either side of the region.
MODVOLC Thermal Alerts. Prior to 12 June 2011 the MODVOLC website indicated that no thermal alerts were measured over at least the past 5 years. The onset of thermal alerts was a 3-pixel area detected at 0115 on 13 June 2011 (2215 on 12 June UTC), followed by nearly daily measurements through 1 September 2011. Since that date, several alerts per week have been measured for Nabro up to 5 November 2011.
Some individual satellite passes measured high numbers of alerts. A 9-pixel alert occurred on 8 September, and as many as 95 pixels were measured for a single satellite pass at 2245 on 17 June. Other single orbital passes during June-August measured alerts of 50 to more than 70 pixels.
Reference. Wiart, P., and Oppenheimer, C., 2005, Large magnitude silicic volcanism in north Afar: the Nabro Volcanic Range and Ma'alalta volcano, Bulletin of Volcanology, v. 67, no. 2, pp. 99-115.
Information Contacts: NASA Earth Observatory (URL: http://earthobservatory.nasa.gov); MODIS/MODVOLC, Hawai'i Institute of Geophysics and Planetology (HIGP) MODVOLC Thermal Alerts System, School of Ocean and Earth Science and Technology (SOEST), Univ. of Hawai'i, 2525 Correa Road, Honolulu, HI (URL: http://modis.higp.hawaii.edu/); Toulouse Volcanic Ash Advisory Centre (VAAC) (URL: http://www.meteo.fr/vaac/); NASA Global Sulfur Dioxide Monitoring (URL: http://so2.gsfc.nasa.gov/index.php); Jet Propulsion Laboratory (URL: http://photojournal.jpl.nasa.gov); S.A. Weather and Disaster Information Service. (SAWDIS) (URL: http://saweatherobserver.blogspot.com); Ethiopian Journal (URL: http://www.ethjournal.com); Addis Fortune (URL: http://www.addisfortune.com); Simon Carn, Dept of Geological and Mining Engineering and Sciences, Michigan Technological University, 1400 Townsend Dr., Houghton, MI 49931, USA (URL: https://so2.gsfc.nasa.gov/).
Thermal alerts ended mid-2012; revised 2011 plume heights; uplift mechanisms debated
This report shows satellite thermal alerts from the MODVOLC system showing that they continued for 7 months after the end of coverage in our one report on Nabro's June 2011 eruption (BGVN 36:09), with the last alert occurring on 3 June 2012.
What has emerged regarding the 2011 Nabro eruption since our one previous report is a much more detailed eruptive timeline and some substantially taller plume-height estimates. These new and more carefully assessed details came out in at least eight papers and three technical comments (see References below).
The initial Toulouse Volcanic Ash Advisory Center estimates cited in BGVN 36:09 were made in the time-limited operational setting that identifies volcanic ash for aviation safety. Those altitude estimates, which included maximum plume heights on 13 June 2011 in the range of 9.1-13.7 km altitude, have since been reassessed using an array of satellite and ground-based instruments and processing strategies. The revised heights in the subsequent papers often determined plume altitudes above the 16-18 km tropopause and into the stratosphere. Absent in our earlier report but well documented in the papers was evidence of a 16 June 2011 eruptive pulse.
Overall, Nabro erupted a total SO2 mass of at ~1.5 Tg (Clarisse and others, 2012), making the eruption the largest SO2 emitter of the 2002-2012 interval (Bourassa and others, 2013). The various papers and the technical comments have also framed debate on how and when Nabro's plume entered stratosphere.
Thermal alerts. This report does not contain any new in situ observations at Nabro. Table 1 shows MODVOLC thermal alerts during November 2011 and into 2012 on the basis of the number of days with alerts in these months. Those alerts stem from observations made with the MODIS instrument that flies on the Terra and Aqua satellites. Our previous report discussed alerts as late as 5 November 2011, but additional alerts were issued later in the month. For this table, January 2012 was the month with the largest number of days with alerts, 15 days. As of late 2014, the last posted alert was issued on 3 June 2012.
Table 1. MODVOLC thermal alerts recorded for Nabro from November 2012 through September 2014. Courtesy of MODVOLC.
| Month | Number of days with alerts |
| November 2011 | 11 |
| December 2011 | 08 |
| January 2012 | 15 |
| February 2012 | 12 |
| March 2012 | 07 |
| April 2012 | 11 |
| May 2012 | 11 |
| June 2012 | 01 |
Although the earlier alerts may signify ongoing eruption, some of the later alerts could stem from ongoing post-eruptive thermal radiance from potentially thick lava flows. Absence of alerts could be the result of clouds masking the volcano, although that is unlikely significant in the terminal alert registered in June 2012. It also bears noting that the alerts are at a fairly high threshold.
References. Bourassa, AE, Robock, A, Randel, WJ, Deshler, T, Rieger, LA, Lloyd, ND, Llewellyn, EJ, and Degenstein, DA, 2012, Large Volcanic Aerosol Load in the Stratosphere Linked to Asian Monsoon Transport. Science 337 (6090):78-81. DOI: 10.1126/science.1219371.
Bourassa, AE, Robock, A, Randel, WJ, Deshler, T, Rieger, LA, Lloyd, ND, Llewellyn, EJ, and Degenstein, DA, 2013, Response to Comments on "Large volcanic aerosol load in the stratosphere linked to Asian Monsoon transport. Science, 339 (6120), 647, DOI: 10.1126/science.1227961.
Clarisse, L., P.-F. Coheur, N. Theys, D. Hurtmans, and C. Clerbaux, 2014, The 2011 Nabro eruption, a SO2 plume height analysis using IASI measurements, Atmos. Chem. Phys., 14, 3095-3111,DOI:10.5194/acp-14-3095-2014.
Clarisse, L., Hurtmans, D., Clerbaux, C., Hadji-Lazaro, J., Ngadi, Y., & Coheur, P. F., 2012, Retrieval of sulphur dioxide from the infrared atmospheric sounding interferometer (IASI). Atmospheric Measurement Techniques Discussions, 4, 7241-7275 [13 March 2012; revised from 2011 version] www.atmos-meas-tech.net/5/581/2012/; DOI:10.5194/amt-5-581-2012.
Fairlie, T. D., Vernier, J.-P., Natarajan, M., and Bedka, K. M., 2014, Dispersion of the Nabro volcanic plume and its relation to the Asian summer monsoon, Atmos. Chem. Phys., 14, 7045-7057, DOI:10.5194/acp-14-7045-2014, 2014.
Fromm, M, Nedoluha, G, and Charvat, Z, 2013, Comment on "Large Volcanic Aerosol Load in the Stratosphere Linked to Asian Monsoon Transport." Science 339 (6120). DOI: 10.1126/science.1228605.
Fromm, M, Kablick, G (III), Nedoluha1, G., Carboni, E., Grainger, R., Campbell, J, and Lewis, J., 2014, Correcting the record of volcanic stratospheric aerosol impact: Nabro and Sarychev Peak, Journal of Geophysical Research. Atmospheres. [Early, online version, accessed August 2014] DOI: 10.1002/2014JD021507
Pan, LL, and Munchak, LA, 2011, Relationship of cloud top to the tropopause and jet structure from CALIPSO data. Journal of Geophysical Research: Atmospheres (1984-2012) 116.D12 (2011).
Penning de Vries, M. J. M., Dörner, S., Pukite, J., Hörmann, C., Fromm, M. D., & Wagner, T. (2014). Characterisation of a stratospheric sulfate plume from the Nabro volcano using a combination of passive satellite measurements in nadir and limb geometry. Atmospheric Chemistry and Physics, 14(15), 8149-8163.
Theys, N., Campion, R., Clarisse, L., Brenot, H., van Gent, J., Dils, B., Corradini, S., Merucci, L., Coheur, P.-F., Van Roozendael, M., Hurtmans, D., Clerbaux, C., Tait, S., and Ferrucci, F.: Volcanic SO2 fluxes derived from satellite data: a survey using OMI, GOME-2, IASI and MODIS, Atmos. Chem. Phys., 13, 5945-5968, doi:10.5194/acp-13-5945-2013, 2013.
Vernier, JP, Thomason, LW, Fairlie, TD, Minnis, P., Palikonda, R, and Bedka, K M, 2013. Comment on "Large Volcanic Aerosol Load in the Stratosphere Linked to Asian Monsoon Transport." Science 339 (6120). DOI: 10.1126/science.1227817.
Information Contacts: Hawai'i Institute of Geophysics and Planetology (HIGP) MODVOLC Thermal Alerts System, School of Ocean and Earth Science and Technology (SOEST), Univ. of Hawai'i, 2525 Correa Road, Honolulu, HI (URL: http://modis.higp.hawaii.edu/); and Toulouse Volcanic Ash Advisory Centre (VAAC) (URL: http://www.meteo.fr/vaac/).
This compilation of synonyms and subsidiary features may not be comprehensive. Features are organized into four major categories: Cones, Craters, Domes, and Thermal Features. Synonyms of features appear indented below the primary name. In some cases additional feature type, elevation, or location details are provided.
Synonyms |
| Nabbeo |
|
|
||||||||||||||||||||||||
There is data available for 1 confirmed Holocene eruptive periods.
2011 Jun 13 - 2012 Jun 3 (?) Confirmed Eruption Max VEI: 4
| Episode 1 | Eruption Episode | Summit crater and NW flank | |||||||||||||||||||||||||||||||||||||||||||||||||||||||||||||||||||||||||||||||||||||||||||||||||||||||||||||||||||||||||||||||||||||||||||||||||||||||||||||||||||||||||||||||||||||||||||||||||||||||||||||||||||||||||||||||||||||||||||||||||||||||||||||||||||||||||||||||||||||||||||||||||||||||||||||||||||||||||||||||||||||||||||||||||||||||||||||||||||||||||||||||||||||||||||||||||||||||||||||||||||||||||
|---|---|---|---|---|---|---|---|---|---|---|---|---|---|---|---|---|---|---|---|---|---|---|---|---|---|---|---|---|---|---|---|---|---|---|---|---|---|---|---|---|---|---|---|---|---|---|---|---|---|---|---|---|---|---|---|---|---|---|---|---|---|---|---|---|---|---|---|---|---|---|---|---|---|---|---|---|---|---|---|---|---|---|---|---|---|---|---|---|---|---|---|---|---|---|---|---|---|---|---|---|---|---|---|---|---|---|---|---|---|---|---|---|---|---|---|---|---|---|---|---|---|---|---|---|---|---|---|---|---|---|---|---|---|---|---|---|---|---|---|---|---|---|---|---|---|---|---|---|---|---|---|---|---|---|---|---|---|---|---|---|---|---|---|---|---|---|---|---|---|---|---|---|---|---|---|---|---|---|---|---|---|---|---|---|---|---|---|---|---|---|---|---|---|---|---|---|---|---|---|---|---|---|---|---|---|---|---|---|---|---|---|---|---|---|---|---|---|---|---|---|---|---|---|---|---|---|---|---|---|---|---|---|---|---|---|---|---|---|---|---|---|---|---|---|---|---|---|---|---|---|---|---|---|---|---|---|---|---|---|---|---|---|---|---|---|---|---|---|---|---|---|---|---|---|---|---|---|---|---|---|---|---|---|---|---|---|---|---|---|---|---|---|---|---|---|---|---|---|---|---|---|---|---|---|---|---|---|---|---|---|---|---|---|---|---|---|---|---|---|---|---|---|---|---|---|---|---|---|---|---|---|---|---|---|---|---|---|---|---|---|---|---|---|---|---|---|---|---|---|---|---|---|---|---|---|---|---|---|---|---|---|---|---|---|---|---|---|---|---|---|---|---|---|---|---|---|---|---|---|---|---|---|---|---|---|---|---|---|---|---|---|---|---|---|---|---|---|---|---|---|---|---|---|---|---|---|---|---|---|---|
| 2011 Jun 13 - 2012 Jun 3 (?) | Evidence from Observations: Reported | |||||||||||||||||||||||||||||||||||||||||||||||||||||||||||||||||||||||||||||||||||||||||||||||||||||||||||||||||||||||||||||||||||||||||||||||||||||||||||||||||||||||||||||||||||||||||||||||||||||||||||||||||||||||||||||||||||||||||||||||||||||||||||||||||||||||||||||||||||||||||||||||||||||||||||||||||||||||||||||||||||||||||||||||||||||||||||||||||||||||||||||||||||||||||||||||||||||||||||||||||||||||||
|
List of 80 Events for Episode 1 at Summit crater and NW flank
| ||||||||||||||||||||||||||||||||||||||||||||||||||||||||||||||||||||||||||||||||||||||||||||||||||||||||||||||||||||||||||||||||||||||||||||||||||||||||||||||||||||||||||||||||||||||||||||||||||||||||||||||||||||||||||||||||||||||||||||||||||||||||||||||||||||||||||||||||||||||||||||||||||||||||||||||||||||||||||||||||||||||||||||||||||||||||||||||||||||||||||||||||||||||||||||||||||||||||||||||||||||||||||
There is data available for 1 deformation periods. Expand each entry for additional details.
| Start Date: 2011 Jul | Stop Date: 2012 Oct | Direction: Subsidence | Method: InSAR |
| Magnitude: Unknown | Spatial Extent: 12.00 km | Latitude: Unknown | Longitude: Unknown |
Remarks: InSAR reveals a concentric subsidence signal centered on Nabro caldera following the June 2011 eruption. | |||
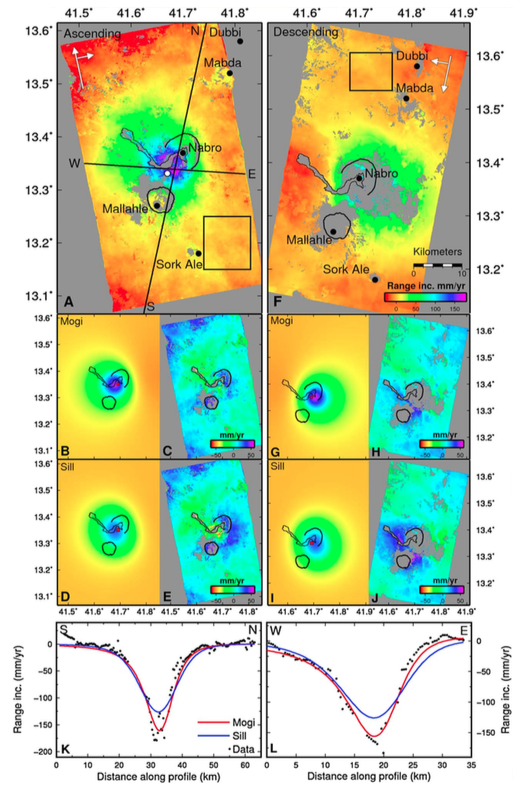 |
Best-fit model assuming Mogi and sill sources. (a) Observed ascending rate map of ground movement, white point: pixel used for time series. (b) Mogi model of deformation for ascending track. (c) Residual motion following Mogi model. (d) Sill model of deformation for ascending track. (e) Residual motion following sill model. (f) Observed descend- ing rate map of ground movement. (g) Mogi model of deformation for descending track. (h) Residual ground motion. (i) Sill model of deformation for descending track. (j) Residual ground motion. (k) Profile of ground displacement along transect N-S on Figure 3a. (l) Profile of ground displacement along transect W-E on Figure 3a. The black squares in Figures 3a and 3f show the far-field regions used to calculate noise for the Monte Carlo analysis. The red points in Figures 3b, 3d, 3g, and 3i, mark the center of the model at depth. The interferograms span 462 days for both the ascending and descending tracks. From: Hamlyn et al. 2014. |
||
Reference List: Hamlyn et al. 2014.
Full References:
Hamlyn, J. E., D. Keir, T. J. Wright, J. W. Neuberg, B. Goitom, J. O.S. Hammond, C. Pagli, C. Oppenheimer, J. Kendall, and R. Grandin., 2014. Seismicity and subsidence following the 2011 Nabro eruption, Eritrea: Insights into the plumbing system of an off-rift volcano. J. Geophys. Res., 119, no. 11: 8267-8282.
There is data available for 1 emission periods. Expand each entry for additional details.
| Start Date: 2011 Jun 13 | Stop Date: 2011 Jun 13 | Method: Satellite (Aura OMI) |
| SO2 Altitude Min: 18 km | SO2 Altitude Max: 18 km | Total SO2 Mass: 3650 kt |
Data Details
| Date Start | Date End | Assumed SO2 Altitude | SO2 Algorithm | SO2 Mass |
| 20110613 | 18.0 | 3650.000 |
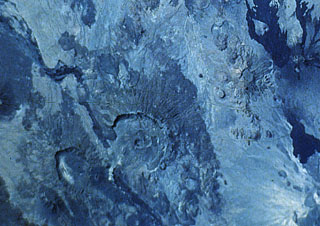 The large caldera below and to the left of the center of this Space Shuttle photo of the Danakil Alps of Ethiopia is Nabro. This volcano is the highest in the Danakil depression and is truncated by nested calderas 10 and 5 km in diameter. The larger caldera is breached to the SW. The 8-km-wide Mallahle caldera is at the lower left, and the dark-colored lava flows at the right are from Dubbi volcano.
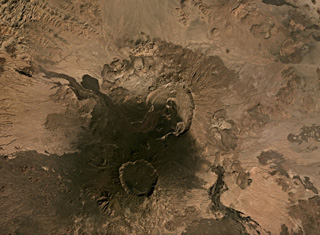 This November 2019 Planet Labs satellite image monthly mosaic shows several calderas and lava flows, with Nabro in the center and Mallahle below it within the Bidu Volcanic Complex (N is at the top). The 8-km-wide Nabro summit caldera opens towards the S, and the darker lava flow towards the NWW was erupted in 2011.
The maps shown below have been scanned from the GVP map archives and include the volcano on this page. Clicking on the small images will load the full 300 dpi map. Very small-scale maps (such as world maps) are not included. The maps database originated over 30 years ago, but was only recently updated and connected to our main database. We welcome users to tell us if they see incorrect information or other problems with the maps; please use the Contact GVP link at the bottom of the page to send us email.
There are no samples for Nabro in the Smithsonian's NMNH Department of Mineral Sciences Rock and Ore collection.
| Copernicus Browser | The Copernicus Browser replaced the Sentinel Hub Playground browser in 2023, to provide access to Earth observation archives from the Copernicus Data Space Ecosystem, the main distribution platform for data from the EU Copernicus missions. |
| MIROVA | Middle InfraRed Observation of Volcanic Activity (MIROVA) is a near real time volcanic hot-spot detection system based on the analysis of MODIS (Moderate Resolution Imaging Spectroradiometer) data. In particular, MIROVA uses the Middle InfraRed Radiation (MIR), measured over target volcanoes, in order to detect, locate and measure the heat radiation sourced from volcanic activity. |
| MODVOLC Thermal Alerts | Using infrared satellite Moderate Resolution Imaging Spectroradiometer (MODIS) data, scientists at the Hawai'i Institute of Geophysics and Planetology, University of Hawai'i, developed an automated system called MODVOLC to map thermal hot-spots in near real time. For each MODIS image, the algorithm automatically scans each 1 km pixel within it to check for high-temperature hot-spots. When one is found the date, time, location, and intensity are recorded. MODIS looks at every square km of the Earth every 48 hours, once during the day and once during the night, and the presence of two MODIS sensors in space allows at least four hot-spot observations every two days. Each day updated global maps are compiled to display the locations of all hot spots detected in the previous 24 hours. There is a drop-down list with volcano names which allow users to 'zoom-in' and examine the distribution of hot-spots at a variety of spatial scales. |
|
WOVOdat
Single Volcano View Temporal Evolution of Unrest Side by Side Volcanoes |
WOVOdat is a database of volcanic unrest; instrumentally and visually recorded changes in seismicity, ground deformation, gas emission, and other parameters from their normal baselines. It is sponsored by the World Organization of Volcano Observatories (WOVO) and presently hosted at the Earth Observatory of Singapore.
GVMID Data on Volcano Monitoring Infrastructure The Global Volcano Monitoring Infrastructure Database GVMID, is aimed at documenting and improving capabilities of volcano monitoring from the ground and space. GVMID should provide a snapshot and baseline view of the techniques and instrumentation that are in place at various volcanoes, which can be use by volcano observatories as reference to setup new monitoring system or improving networks at a specific volcano. These data will allow identification of what monitoring gaps exist, which can be then targeted by remote sensing infrastructure and future instrument deployments. |
| Volcanic Hazard Maps | The IAVCEI Commission on Volcanic Hazards and Risk has a Volcanic Hazard Maps database designed to serve as a resource for hazard mappers (or other interested parties) to explore how common issues in hazard map development have been addressed at different volcanoes, in different countries, for different hazards, and for different intended audiences. In addition to the comprehensive, searchable Volcanic Hazard Maps Database, this website contains information about diversity of volcanic hazard maps, illustrated using examples from the database. This site is for educational purposes related to volcanic hazard maps. Hazard maps found on this website should not be used for emergency purposes. For the most recent, official hazard map for a particular volcano, please seek out the proper institutional authorities on the matter. |
| IRIS seismic stations/networks | Incorporated Research Institutions for Seismology (IRIS) Data Services map showing the location of seismic stations from all available networks (permanent or temporary) within a radius of 0.18° (about 20 km at mid-latitudes) from the given location of Nabro. Users can customize a variety of filters and options in the left panel. Note that if there are no stations are known the map will default to show the entire world with a "No data matched request" error notice. |
| UNAVCO GPS/GNSS stations | Geodetic Data Services map from UNAVCO showing the location of GPS/GNSS stations from all available networks (permanent or temporary) within a radius of 20 km from the given location of Nabro. Users can customize the data search based on station or network names, location, and time window. Requires Adobe Flash Player. |
| DECADE Data | The DECADE portal, still in the developmental stage, serves as an example of the proposed interoperability between The Smithsonian Institution's Global Volcanism Program, the Mapping Gas Emissions (MaGa) Database, and the EarthChem Geochemical Portal. The Deep Earth Carbon Degassing (DECADE) initiative seeks to use new and established technologies to determine accurate global fluxes of volcanic CO2 to the atmosphere, but installing CO2 monitoring networks on 20 of the world's 150 most actively degassing volcanoes. The group uses related laboratory-based studies (direct gas sampling and analysis, melt inclusions) to provide new data for direct degassing of deep earth carbon to the atmosphere. |
| Large Eruptions of Nabro | Information about large Quaternary eruptions (VEI >= 4) is cataloged in the Large Magnitude Explosive Volcanic Eruptions (LaMEVE) database of the Volcano Global Risk Identification and Analysis Project (VOGRIPA). |
| EarthChem | EarthChem develops and maintains databases, software, and services that support the preservation, discovery, access and analysis of geochemical data, and facilitate their integration with the broad array of other available earth science parameters. EarthChem is operated by a joint team of disciplinary scientists, data scientists, data managers and information technology developers who are part of the NSF-funded data facility Integrated Earth Data Applications (IEDA). IEDA is a collaborative effort of EarthChem and the Marine Geoscience Data System (MGDS). |

