
2009 seismic swarm, deformation, and 8 km surface rupture
An intense seismic swarm coupled with surface deformation spurred the evacuation of over 30,000 residents, led to an 8 km long surface rupture, and was consistent with the injection of a shallow dike that never reached the surface. Between April and June 2009 more than 30,000 earthquakes occurred beneath one of the lava fields of Saudi Arabia adjacent the N-central portion of the Red Sea and centered inland ~50 km ENE from the port city of Umm Lajj (figure 1). The field is known as Harrat Lunayyir (the words harrat and haarrat indicate a volcanic field, named and unnamed, respectively). Ultimately a narrow, 8 km long surface rupture developed and the seismicity declined. The event was interpreted as due to a shallow intrusion that did not reach the surface. Table 1 at the end of this report gives an overview of the crisis, which included evacuations.
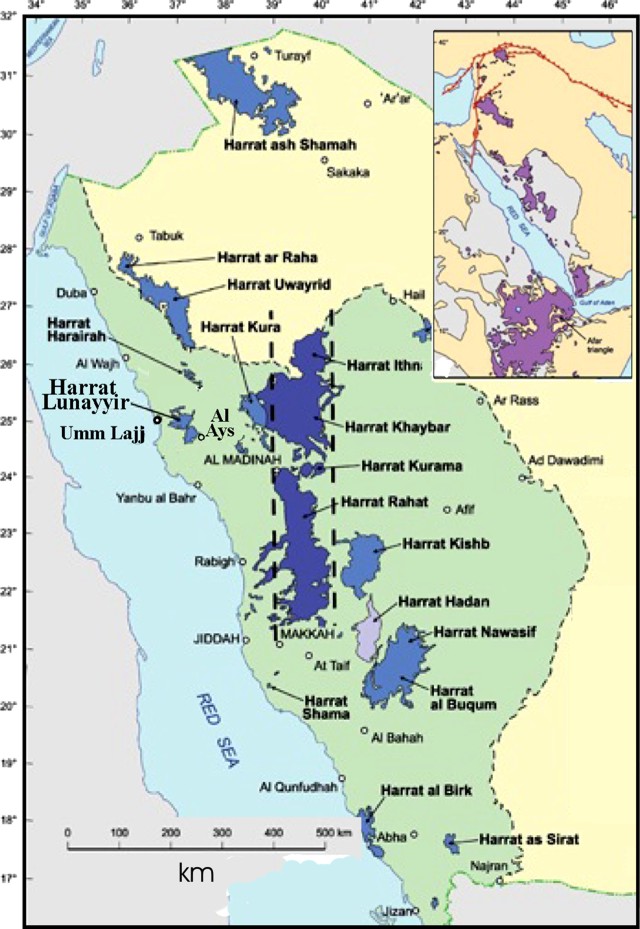 |
Figure 1. Index map (at upper right focused on the Red Sea) and the main map showing numerous named volcanic fields (harrats) in Saudi Arabia, including Lunayyir. The cities of Umm Lajj and Al Ays are discussed in text. Original map taken from SGS (2011). |
This report is based on Pallister and others (2010) as well as a report from scientists from the USGS-USAID Volcano Disaster Assistance Program (VDAP) and the Saudi Geological Survey (SGS). The government of Saudi Arabia evacuated more than 30,000 people from the town of Al Ays on the SE margin of the volcanic field, due to fears that further larger earthquakes could occur or that there could be a volcanic eruption (figures 2 and 3). In response to this situation, SGS increased their presence in the region and installed a permanent telemetered seismic network of seven broadband seismometers in the area to better monitor the seismicity.
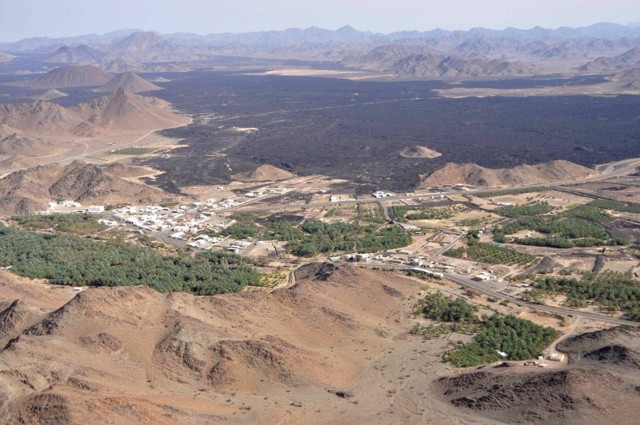 |
Figure 2. The town of Al Ays is shown. About 30,000 people were evacuated from the area due to the earthquake swarm. Previous lava flows of the Harrat Lunayyir volcanic field cover much of the back and central portions of the photo beyond the town. Photograph courtesy of John Pallister (VDAP). |
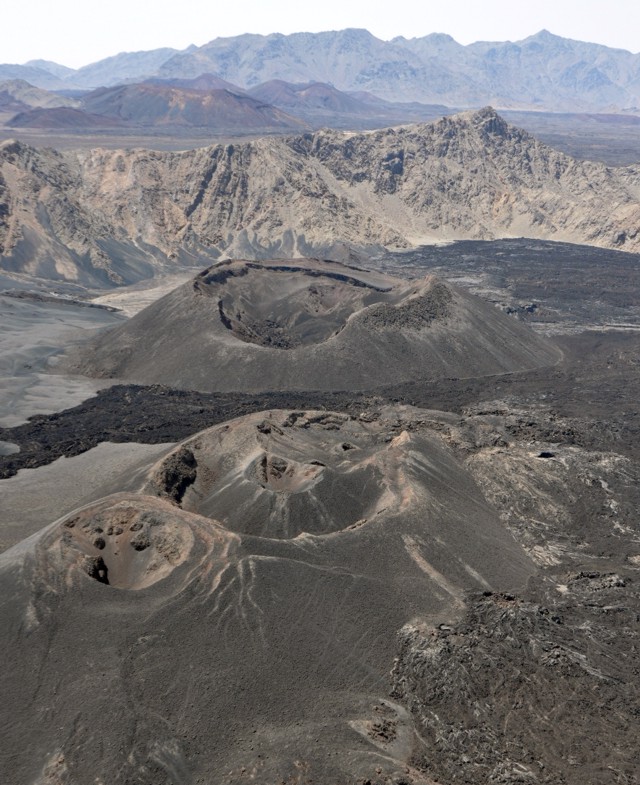 |
Figure 3. Areal view of cinder cones found at Harrat Lunayyir. Photograph courtesy of John Pallister (VDAP). |
A punctuated earthquake swarm began at Harrat Lunayyir in April 2009, with a peak on 19 May when 19 earthquakes of M 4 or greater occurred. The largest of those earthquakes was variably assessed as M 5.4 (SGS) and M 5.7 (USGS National Earthquake Information Center). It struck at 1735 UTC (2035 local time). The earthquake caused minor damage to structures in the town of Al Ays (40 km SE of the epicenter).
Surface rupture. In the northern central part of the lava field the initial surface rupture extended 3 km, trended NW, and appeared during the week preceding 19 May (when maximum earthquake magnitudes exceeded M 4). Associated with the M 5.4 earthquake on 19 May, the rupture lengthened to 8 km. The rupture had local vertical offsets of more than 1 meter and was several meters deep (figures 4 and 5). Event rates decreased dramatically on 20 May and maintained a relatively constant level, except for a few increases in event rate lasting 24 hours.
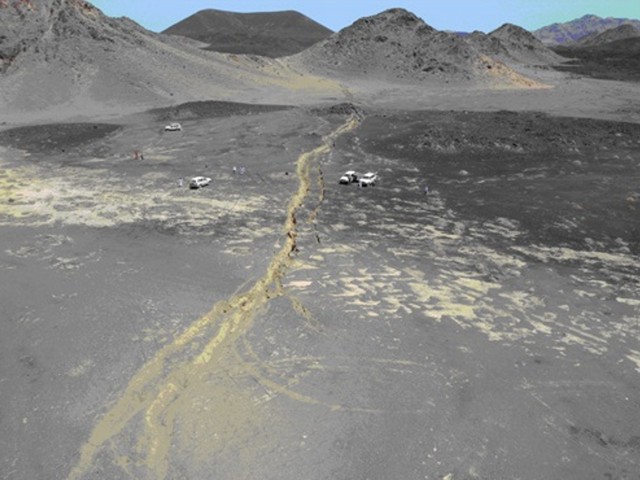 |
Figure 4. The 8-km-long surface rupture that opened on 19 May 2009 seen here cutting across soft sediments in the Harrat Lunayyir region. Taken from SGS (2011). |
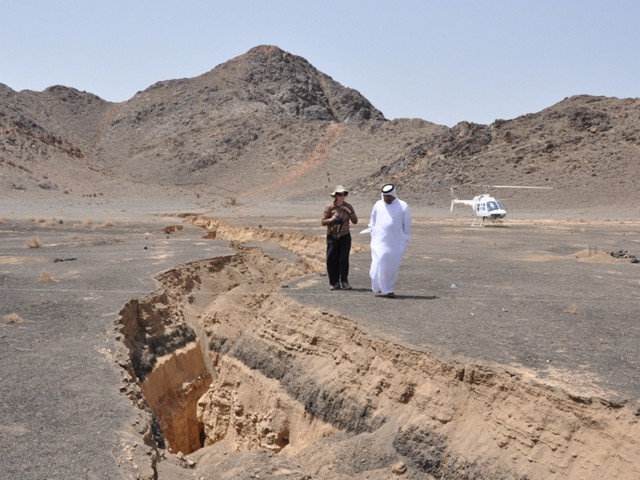 |
Figure 5. Wendy McCausland (USGS-VDAP seismologist) consults with Hani Zahran (Director of Earthquake and Volcanoes Center, Saudi Geological Survey) at the site of the 8 km long surface rupture that opened during the 19 May 2009 earthquake at Lunayyir. Photograph courtesy of John Pallister (VDAP). |
Combining seismic with InSAR and modeling. Results from InSAR data and geodetic modeling were consistent with the timing of the seismic swarm. InSAR data showed that 75% of the deformation occurred during 8-27 May 2009, and 20% occurred during 27 May to 17 June (figure 6). Interferograms from May and June showed a broad area of deformation of about 2,000 km2, which is indicative of dyke intrusion. Envisat interferograms showed about 40 cm of uplift and over 1 m of E-W extension.
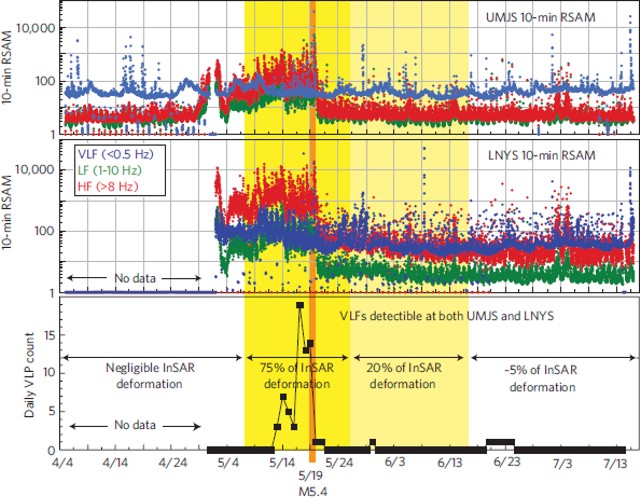 |
Figure 6. For Lunayyir, plots of real-time seismic amplitude (RSAM) for 10-min intervals showing peak seismic energy releases for the vertical component of broadband seismic stations UMGS and LNYS (45 km WSE and 29 km SE from the epicenter of the M 5.4 earthquake on 19 May). The lower graph shows daily counts of very long frequency earthquakes recorded at both stations. InSAR-detected deformation periods are indicated by shading (yellow on colored versions). Taken from Pallister and others (2010). |
Earthquakes suggestive of volcanism. Initially, scientists were unsure if the earthquakes were tectonic or volcanic in origin. On 12 June two members of a VDAP team deployed to Saudia Arabia at the request of the SGS to provide technical assistance. The VDAP and SGS teams determined that the earthquake pattern was that of a volcanic earthquake swarm. It was characterized by several ten's of thousands of small (under M 3) earthquakes during 24 April-31 July 2009, in a pattern of seismicity that waxed and waned. Earthquakes occurred of both varying magnitude and lacking tectonic mainshock-aftershock sequences. RSAM (real-time seismic-amplitude measurement) data showed that energy increased dramatically on 29 April, peaking on 19 May with the previously mentioned largest (M 5.4) event.
Other common volcanic-swarm characteristics included a high rate of occurrence of small compared to large events, and shallow event locations clustered beneath the lava field at around 5-10 km in depth. The event types included those of high-frequency (13-28 Hz), very low-frequency (less than 1 Hz), and high-frequency tremor. The latter contained embedded spasmodic bursts of high-frequency earthquakes (13-28 Hz).
An unusual aspect of the swarm was that both low- and very low-frequency earthquakes occurred, events that are usually associated with movements of fluids (magma, water or gas) and Strombolian explosions, but in this case both gas emissions and explosions were absent.
The VDAP and SGS teams concluded that there were three key lines of evidence that the earthquakes were volcanic. First, the earthquakes were occurring in a volcanically active area. Second, deformation was measured and interpreted to indicate a shallow dyke intrusion. Third, the types of earthquakes that occurred were characteristic of volcano-related seismicity.
The volcanic risk was relatively low due to the small population living near Harrat Lunayyir. On 19 June the team made a forecast that there was a moderate probability of a basaltic eruption and a low probability of additional large earthquakes of M 5 or greater occurring within the following 2 months. The forecast was based on the maximum magnitudes of earthquakes that typically accompany eruptions at other volcanoes, on the proportion of eruptions following multiple intrusions at dozens of volcanoes studied by VDAP, and on initial models of the InSAR anomaly. The team determined that the seismic swarm had ended by August 2009 when there was a decline in seismic activity and InSAR-detected deformation. After the forecast and after the buildings in Al Ays had been assessed for damage, evacuees were permitted to return to their homes.
Table 1. Chronology summarizing the 2009 Lunayyir earthquake swarm, surface rupture, and hazards response.
| Date | Observations and actions taken |
| Apr 2009 | Earthquakes began |
| ~20 Apr 2009 | Evacuation started at Al Ays |
| 29 Apr 2009 | Earthquake energy increased |
| ~12-19 May 2009 | 3-km-long surface rupture opened |
| 19 May 2009 | M 5.4-5.7 earthquake; surface rupture grew to 8 km long |
| 20 May 2009 | Earthquake energy decreased dramatically |
| Aug 2009 | Earthquakes ceased |
| Aug 2009 | Evacuees returned to Al Ays |
References. Pallister, J.S., McCausland, W.A., Jonsson, S., Lu, Z., Zahran, H.M., Hadidy, S.E., Aburukbah, A., Stewart, I.C.F., Lundgren, P.R., White, R.A., and Moufti, M.R.H., 2010, Broad Accommodation of Rift-Related Extension Recorded by Dyke Intrusion in Saudi Arabia. Nature Geoscience, 26 September 2010, pp. 1-8.
SGS, 2011, Volcanism in Saudi Arabia, Saudi Geological Survey (SGS) (URL: http://www.sgs.org.sa/English/NaturalHazards/Pages/Volcanoes.aspx).
Information Contacts: John Pallister, US Geological Survey-USAID Volcano Disaster Assistance Program, 1300 SE Cardinal Court, Building 10, Suite 100, Vancouver, WA 98683-9589, USA (URL: http://volcanoes.usgs.gov/vdap/); Hani M. Zahran, National Centre for Earthquakes and Volcanoes, Saudi Geological Survey (SGS), P.O. Box: 54141, Jeddah, 21514 Saudi Arabia (URL: http://www.sgs.org.sa/English/NaturalHazards/Pages/Earthquakes.aspx).
The Global Volcanism Program has no Weekly Reports available for Harrat Lunayyir.
Reports are organized chronologically and indexed below by Month/Year (Publication Volume:Number), and include a one-line summary. Click on the index link or scroll down to read the reports.
2009 seismic swarm, deformation, and 8 km surface rupture
An intense seismic swarm coupled with surface deformation spurred the evacuation of over 30,000 residents, led to an 8 km long surface rupture, and was consistent with the injection of a shallow dike that never reached the surface. Between April and June 2009 more than 30,000 earthquakes occurred beneath one of the lava fields of Saudi Arabia adjacent the N-central portion of the Red Sea and centered inland ~50 km ENE from the port city of Umm Lajj (figure 1). The field is known as Harrat Lunayyir (the words harrat and haarrat indicate a volcanic field, named and unnamed, respectively). Ultimately a narrow, 8 km long surface rupture developed and the seismicity declined. The event was interpreted as due to a shallow intrusion that did not reach the surface. Table 1 at the end of this report gives an overview of the crisis, which included evacuations.
|
Figure 1. Index map (at upper right focused on the Red Sea) and the main map showing numerous named volcanic fields (harrats) in Saudi Arabia, including Lunayyir. The cities of Umm Lajj and Al Ays are discussed in text. Original map taken from SGS (2011). |
This report is based on Pallister and others (2010) as well as a report from scientists from the USGS-USAID Volcano Disaster Assistance Program (VDAP) and the Saudi Geological Survey (SGS). The government of Saudi Arabia evacuated more than 30,000 people from the town of Al Ays on the SE margin of the volcanic field, due to fears that further larger earthquakes could occur or that there could be a volcanic eruption (figures 2 and 3). In response to this situation, SGS increased their presence in the region and installed a permanent telemetered seismic network of seven broadband seismometers in the area to better monitor the seismicity.
|
Figure 2. The town of Al Ays is shown. About 30,000 people were evacuated from the area due to the earthquake swarm. Previous lava flows of the Harrat Lunayyir volcanic field cover much of the back and central portions of the photo beyond the town. Photograph courtesy of John Pallister (VDAP). |
|
Figure 3. Areal view of cinder cones found at Harrat Lunayyir. Photograph courtesy of John Pallister (VDAP). |
A punctuated earthquake swarm began at Harrat Lunayyir in April 2009, with a peak on 19 May when 19 earthquakes of M 4 or greater occurred. The largest of those earthquakes was variably assessed as M 5.4 (SGS) and M 5.7 (USGS National Earthquake Information Center). It struck at 1735 UTC (2035 local time). The earthquake caused minor damage to structures in the town of Al Ays (40 km SE of the epicenter).
Surface rupture. In the northern central part of the lava field the initial surface rupture extended 3 km, trended NW, and appeared during the week preceding 19 May (when maximum earthquake magnitudes exceeded M 4). Associated with the M 5.4 earthquake on 19 May, the rupture lengthened to 8 km. The rupture had local vertical offsets of more than 1 meter and was several meters deep (figures 4 and 5). Event rates decreased dramatically on 20 May and maintained a relatively constant level, except for a few increases in event rate lasting 24 hours.
|
Figure 4. The 8-km-long surface rupture that opened on 19 May 2009 seen here cutting across soft sediments in the Harrat Lunayyir region. Taken from SGS (2011). |
|
Figure 5. Wendy McCausland (USGS-VDAP seismologist) consults with Hani Zahran (Director of Earthquake and Volcanoes Center, Saudi Geological Survey) at the site of the 8 km long surface rupture that opened during the 19 May 2009 earthquake at Lunayyir. Photograph courtesy of John Pallister (VDAP). |
Combining seismic with InSAR and modeling. Results from InSAR data and geodetic modeling were consistent with the timing of the seismic swarm. InSAR data showed that 75% of the deformation occurred during 8-27 May 2009, and 20% occurred during 27 May to 17 June (figure 6). Interferograms from May and June showed a broad area of deformation of about 2,000 km2, which is indicative of dyke intrusion. Envisat interferograms showed about 40 cm of uplift and over 1 m of E-W extension.
|
Figure 6. For Lunayyir, plots of real-time seismic amplitude (RSAM) for 10-min intervals showing peak seismic energy releases for the vertical component of broadband seismic stations UMGS and LNYS (45 km WSE and 29 km SE from the epicenter of the M 5.4 earthquake on 19 May). The lower graph shows daily counts of very long frequency earthquakes recorded at both stations. InSAR-detected deformation periods are indicated by shading (yellow on colored versions). Taken from Pallister and others (2010). |
Earthquakes suggestive of volcanism. Initially, scientists were unsure if the earthquakes were tectonic or volcanic in origin. On 12 June two members of a VDAP team deployed to Saudia Arabia at the request of the SGS to provide technical assistance. The VDAP and SGS teams determined that the earthquake pattern was that of a volcanic earthquake swarm. It was characterized by several ten's of thousands of small (under M 3) earthquakes during 24 April-31 July 2009, in a pattern of seismicity that waxed and waned. Earthquakes occurred of both varying magnitude and lacking tectonic mainshock-aftershock sequences. RSAM (real-time seismic-amplitude measurement) data showed that energy increased dramatically on 29 April, peaking on 19 May with the previously mentioned largest (M 5.4) event.
Other common volcanic-swarm characteristics included a high rate of occurrence of small compared to large events, and shallow event locations clustered beneath the lava field at around 5-10 km in depth. The event types included those of high-frequency (13-28 Hz), very low-frequency (less than 1 Hz), and high-frequency tremor. The latter contained embedded spasmodic bursts of high-frequency earthquakes (13-28 Hz).
An unusual aspect of the swarm was that both low- and very low-frequency earthquakes occurred, events that are usually associated with movements of fluids (magma, water or gas) and Strombolian explosions, but in this case both gas emissions and explosions were absent.
The VDAP and SGS teams concluded that there were three key lines of evidence that the earthquakes were volcanic. First, the earthquakes were occurring in a volcanically active area. Second, deformation was measured and interpreted to indicate a shallow dyke intrusion. Third, the types of earthquakes that occurred were characteristic of volcano-related seismicity.
The volcanic risk was relatively low due to the small population living near Harrat Lunayyir. On 19 June the team made a forecast that there was a moderate probability of a basaltic eruption and a low probability of additional large earthquakes of M 5 or greater occurring within the following 2 months. The forecast was based on the maximum magnitudes of earthquakes that typically accompany eruptions at other volcanoes, on the proportion of eruptions following multiple intrusions at dozens of volcanoes studied by VDAP, and on initial models of the InSAR anomaly. The team determined that the seismic swarm had ended by August 2009 when there was a decline in seismic activity and InSAR-detected deformation. After the forecast and after the buildings in Al Ays had been assessed for damage, evacuees were permitted to return to their homes.
Table 1. Chronology summarizing the 2009 Lunayyir earthquake swarm, surface rupture, and hazards response.
| Date | Observations and actions taken |
| Apr 2009 | Earthquakes began |
| ~20 Apr 2009 | Evacuation started at Al Ays |
| 29 Apr 2009 | Earthquake energy increased |
| ~12-19 May 2009 | 3-km-long surface rupture opened |
| 19 May 2009 | M 5.4-5.7 earthquake; surface rupture grew to 8 km long |
| 20 May 2009 | Earthquake energy decreased dramatically |
| Aug 2009 | Earthquakes ceased |
| Aug 2009 | Evacuees returned to Al Ays |
References. Pallister, J.S., McCausland, W.A., Jonsson, S., Lu, Z., Zahran, H.M., Hadidy, S.E., Aburukbah, A., Stewart, I.C.F., Lundgren, P.R., White, R.A., and Moufti, M.R.H., 2010, Broad Accommodation of Rift-Related Extension Recorded by Dyke Intrusion in Saudi Arabia. Nature Geoscience, 26 September 2010, pp. 1-8.
SGS, 2011, Volcanism in Saudi Arabia, Saudi Geological Survey (SGS) (URL: http://www.sgs.org.sa/English/NaturalHazards/Pages/Volcanoes.aspx).
Information Contacts: John Pallister, US Geological Survey-USAID Volcano Disaster Assistance Program, 1300 SE Cardinal Court, Building 10, Suite 100, Vancouver, WA 98683-9589, USA (URL: http://volcanoes.usgs.gov/vdap/); Hani M. Zahran, National Centre for Earthquakes and Volcanoes, Saudi Geological Survey (SGS), P.O. Box: 54141, Jeddah, 21514 Saudi Arabia (URL: http://www.sgs.org.sa/English/NaturalHazards/Pages/Earthquakes.aspx).
|
|
||||||||||||||||||||||||||
There is data available for 1 confirmed Holocene eruptive periods.
1000 (in or before) Confirmed Eruption (Explosive / Effusive)
| Episode 1 | Eruption (Explosive / Effusive) | |||||||||||||||
|---|---|---|---|---|---|---|---|---|---|---|---|---|---|---|---|
| 1000 (in or before) - Unknown | Evidence from Observations: Reported | ||||||||||||||
|
List of 1 Events for Episode 1
|
|||||||||||||||
This compilation of synonyms and subsidiary features may not be comprehensive. Features are organized into four major categories: Cones, Craters, Domes, and Thermal Features. Synonyms of features appear indented below the primary name. In some cases additional feature type, elevation, or location details are provided.
Synonyms |
||||
| Lunaiyir, Harrat | ||||
Cones |
||||
| Feature Name | Feature Type | Elevation | Latitude | Longitude |
| Qishr, Jabal al | Pyroclastic cone | |||
 Lava flows radiate down desert valleys away from the center of Harrat Lunayyir, a basaltic volcanic field in NW Saudi Arabia, east of the Red Sea port of Umm Lajj. Harrat Lunayyir contains about 50 volcanic cones that were constructed along a N-S axis. Harrat Lunayyir is one of the smallest of the Holocene lava fields of Saudi Arabia, but individual flow lobes extend up to about 30 km from the center of the Harrat. One of the cones may have erupted around the 10th century CE or earlier.
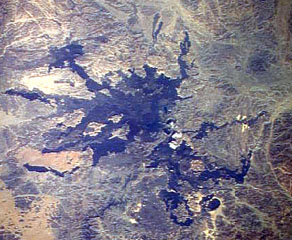
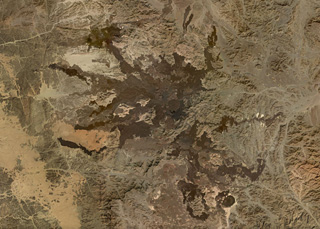 The Harrat Lunayyir volcanic field contains around 50 identified craters with numerous lava flows seen in this November 2019 Planet Labs satellite image monthly mosaic (N is at the top; this image is approximately 89 km across). The scoria cones contain summit craters and many experienced flank collapse or rafting during the eruptions, resulting in horseshoe-shaped craters. The youngest lavas occur in the central part of the field and cover 25 km2.
There are no samples for Harrat Lunayyir in the Smithsonian's NMNH Department of Mineral Sciences Rock and Ore collection.
| Copernicus Browser | The Copernicus Browser replaced the Sentinel Hub Playground browser in 2023, to provide access to Earth observation archives from the Copernicus Data Space Ecosystem, the main distribution platform for data from the EU Copernicus missions. |
| MIROVA | Middle InfraRed Observation of Volcanic Activity (MIROVA) is a near real time volcanic hot-spot detection system based on the analysis of MODIS (Moderate Resolution Imaging Spectroradiometer) data. In particular, MIROVA uses the Middle InfraRed Radiation (MIR), measured over target volcanoes, in order to detect, locate and measure the heat radiation sourced from volcanic activity. |
| MODVOLC Thermal Alerts | Using infrared satellite Moderate Resolution Imaging Spectroradiometer (MODIS) data, scientists at the Hawai'i Institute of Geophysics and Planetology, University of Hawai'i, developed an automated system called MODVOLC to map thermal hot-spots in near real time. For each MODIS image, the algorithm automatically scans each 1 km pixel within it to check for high-temperature hot-spots. When one is found the date, time, location, and intensity are recorded. MODIS looks at every square km of the Earth every 48 hours, once during the day and once during the night, and the presence of two MODIS sensors in space allows at least four hot-spot observations every two days. Each day updated global maps are compiled to display the locations of all hot spots detected in the previous 24 hours. There is a drop-down list with volcano names which allow users to 'zoom-in' and examine the distribution of hot-spots at a variety of spatial scales. |
|
WOVOdat
Single Volcano View Temporal Evolution of Unrest Side by Side Volcanoes |
WOVOdat is a database of volcanic unrest; instrumentally and visually recorded changes in seismicity, ground deformation, gas emission, and other parameters from their normal baselines. It is sponsored by the World Organization of Volcano Observatories (WOVO) and presently hosted at the Earth Observatory of Singapore.
GVMID Data on Volcano Monitoring Infrastructure The Global Volcano Monitoring Infrastructure Database GVMID, is aimed at documenting and improving capabilities of volcano monitoring from the ground and space. GVMID should provide a snapshot and baseline view of the techniques and instrumentation that are in place at various volcanoes, which can be use by volcano observatories as reference to setup new monitoring system or improving networks at a specific volcano. These data will allow identification of what monitoring gaps exist, which can be then targeted by remote sensing infrastructure and future instrument deployments. |
| Volcanic Hazard Maps | The IAVCEI Commission on Volcanic Hazards and Risk has a Volcanic Hazard Maps database designed to serve as a resource for hazard mappers (or other interested parties) to explore how common issues in hazard map development have been addressed at different volcanoes, in different countries, for different hazards, and for different intended audiences. In addition to the comprehensive, searchable Volcanic Hazard Maps Database, this website contains information about diversity of volcanic hazard maps, illustrated using examples from the database. This site is for educational purposes related to volcanic hazard maps. Hazard maps found on this website should not be used for emergency purposes. For the most recent, official hazard map for a particular volcano, please seek out the proper institutional authorities on the matter. |
| IRIS seismic stations/networks | Incorporated Research Institutions for Seismology (IRIS) Data Services map showing the location of seismic stations from all available networks (permanent or temporary) within a radius of 0.18° (about 20 km at mid-latitudes) from the given location of Harrat Lunayyir. Users can customize a variety of filters and options in the left panel. Note that if there are no stations are known the map will default to show the entire world with a "No data matched request" error notice. |
| UNAVCO GPS/GNSS stations | Geodetic Data Services map from UNAVCO showing the location of GPS/GNSS stations from all available networks (permanent or temporary) within a radius of 20 km from the given location of Harrat Lunayyir. Users can customize the data search based on station or network names, location, and time window. Requires Adobe Flash Player. |
| DECADE Data | The DECADE portal, still in the developmental stage, serves as an example of the proposed interoperability between The Smithsonian Institution's Global Volcanism Program, the Mapping Gas Emissions (MaGa) Database, and the EarthChem Geochemical Portal. The Deep Earth Carbon Degassing (DECADE) initiative seeks to use new and established technologies to determine accurate global fluxes of volcanic CO2 to the atmosphere, but installing CO2 monitoring networks on 20 of the world's 150 most actively degassing volcanoes. The group uses related laboratory-based studies (direct gas sampling and analysis, melt inclusions) to provide new data for direct degassing of deep earth carbon to the atmosphere. |
| Large Eruptions of Harrat Lunayyir | Information about large Quaternary eruptions (VEI >= 4) is cataloged in the Large Magnitude Explosive Volcanic Eruptions (LaMEVE) database of the Volcano Global Risk Identification and Analysis Project (VOGRIPA). |
| EarthChem | EarthChem develops and maintains databases, software, and services that support the preservation, discovery, access and analysis of geochemical data, and facilitate their integration with the broad array of other available earth science parameters. EarthChem is operated by a joint team of disciplinary scientists, data scientists, data managers and information technology developers who are part of the NSF-funded data facility Integrated Earth Data Applications (IEDA). IEDA is a collaborative effort of EarthChem and the Marine Geoscience Data System (MGDS). |

