PVMBG reported that the eruption at Lewotolok continued during 17-23 April. White-and-gray ash plumes rose 100-600 m above the summit and drifted SE, W, and NW almost every day; white emissions rose 300-500 m above the summit and drifted W and NW during 19-20 April. The Alert Level remained at 3 (on a scale of 1-4) and the residents of Lamawolo, Lamatokan, and Jontona were warned to stay 2 km away from the vent and 3 km away from the vent on the S and SE flanks.
Source: Pusat Vulkanologi dan Mitigasi Bencana Geologi (PVMBG, also known as CVGHM)
Strombolian eruption continues through April 2023 with intermittent ash plumes
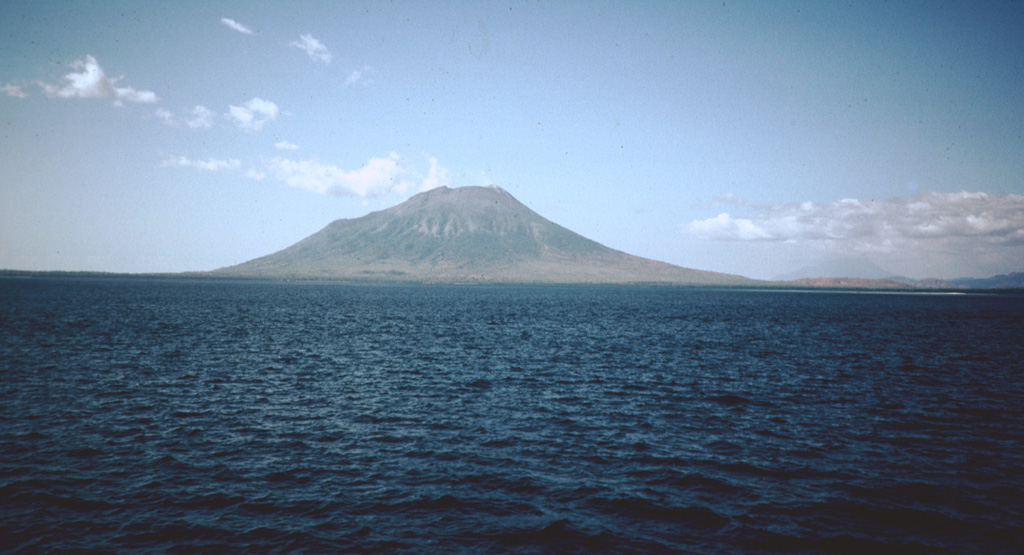
The current eruption at Lewotolok, in Indonesian’s Lesser Sunda Islands, began in late November 2020 and has included Strombolian explosions, occasional ash plumes, incandescent ejecta, intermittent thermal anomalies, and persistent white and white-and-gray emissions (BGVN 47:10). Similar activity continued during October 2022-April 2023, as described in this report based on information provided by Pusat Vulkanologi dan Mitigasi Bencana Geologi (PVMBG, also known as CVGHM, or the Center of Volcanology and Geological Hazard Mitigation), MAGMA Indonesia, the Darwin Volcanic Ash Advisory Centre (VAAC), and satellite data.
During most days in October 2022 white and white-gray emissions rose as high as 200-600 m above the summit. Webcam images often showed incandescence above the crater rim. At 0351 on 14 October, an explosion produced a dense ash plume that rose about 1.2 km above the summit and drifted SW (figure 43). After this event, activity subsided and remained low through the rest of the year, but with almost daily white emissions.
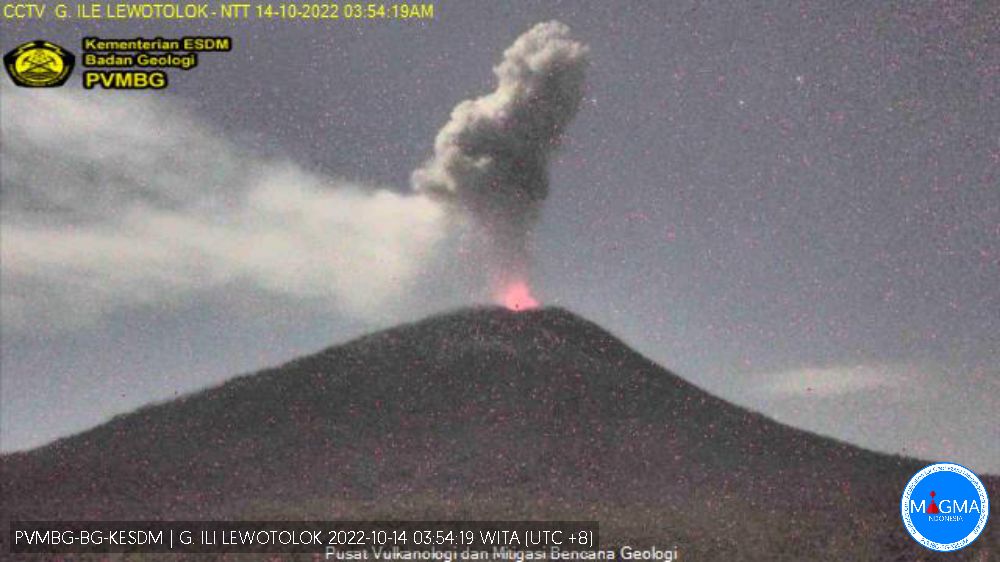 |
Figure 43. Webcam image of Lewotolok on 14 October 2022 showing a dense ash plume and incandescence above the crater. Courtesy of MAGMA Indonesia. |
After more than two months of relative quiet, PVMBG reported that explosions at 0747 on 14 January 2023 and at 2055 on 16 January produced white-and-gray ash plumes that rose around 400 m above the summit and drifted E and SE (figure 44). During the latter half of January through April, almost daily white or white-and-gray emissions were observed rising 25-800 m above the summit, and nighttime webcam images often showed incandescent material being ejected above the summit crater. Strombolian activity was visible in webcam images at 2140 on 11 February, 0210 on 18 February, and during 22-28 March. Frequent hotspots were recorded by the MIROVA detection system starting in approximately the second week of March 2023 that progressively increased into April (figure 45).
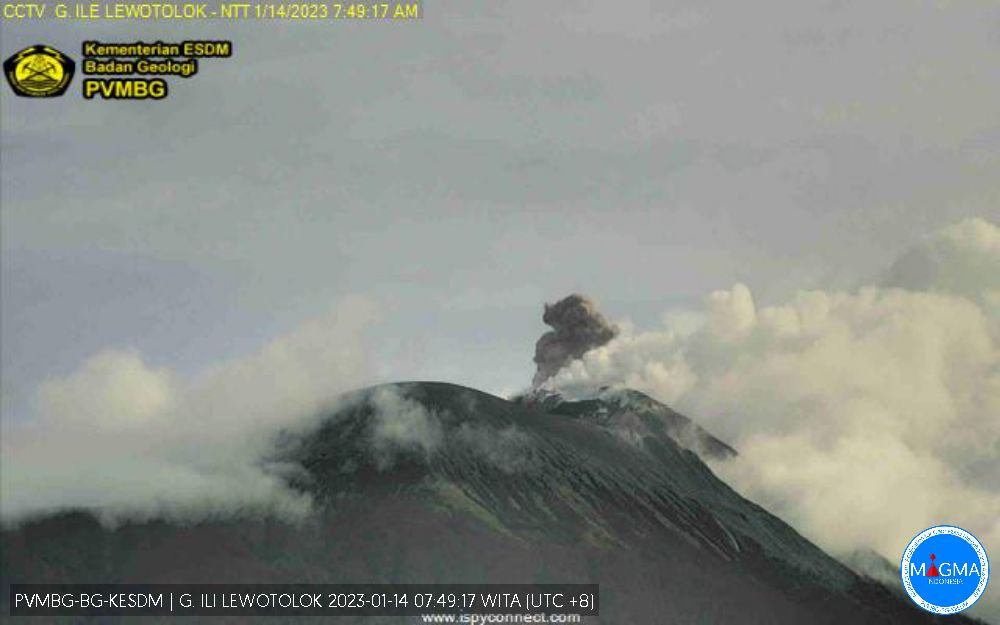 |
Figure 44. Webcam image of an explosion at Lewotolok on 14 January 2023 ejecting a small ash plume along with white emissions. Courtesy of MAGMA Indonesia. |
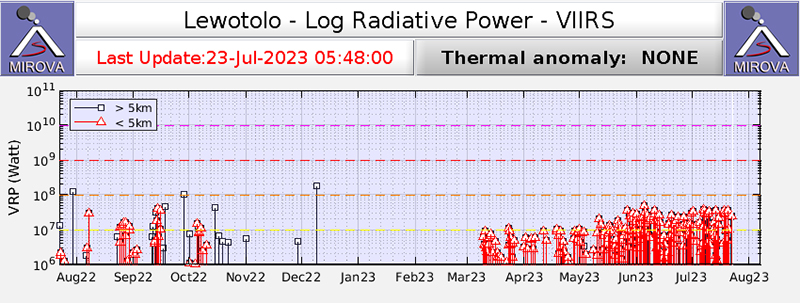 |
Figure 45. MIROVA Log Radiative Power graph of thermal anomalies detected by the VIIRS satellite instrument at Lewotolok’s summit crater for the year beginning 24 July 2022. Clusters of mostly low-power hotspots occurred during August-October 2022, followed by a gap of more than four months before persistent and progressively stronger anomalies began in early March 2023. Courtesy of MIROVA. |
Explosions that produced dense ash plumes as high as 750 m above the summit were described in Volcano Observatory Notices for Aviation (VONA) at 0517, 1623, and 2016 on 22 March, at 1744 on 24 March, at 0103 on 26 March, at 0845 and 1604 on 27 March (figure 46), and at 0538 on 28 March. According to the Darwin VAAC, on 6 April another ash plume rose to 1.8 km altitude (about 370 m above the summit) and drifted N.
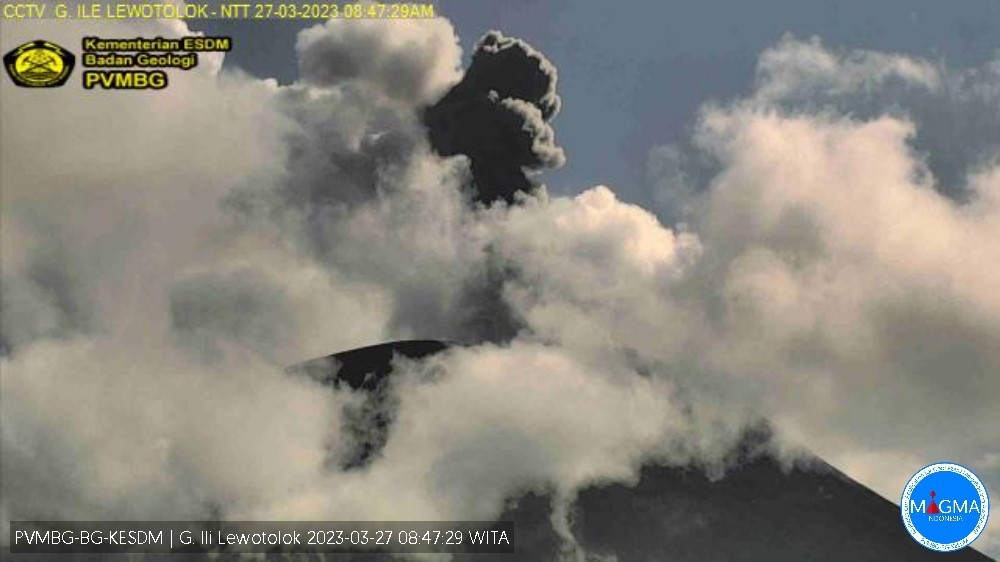 |
Figure 46. Webcam image of Lewotolok at 0847 on 27 March 2023 showing a dense ash plume from an explosion along with clouds and white emissions. Courtesy of MAGMA-Indonesia. |
Sentinel-2 images over the previous year recorded thermal anomalies as well as the development of a lava flow that descended the NE flank beginning in June 2022 (figure 47). The volcano was often obscured by weather clouds, which also often hampered ground observations. Ash emissions were reported in March 2022 (BGVN 47:10), and clear imagery from 4 March 2022 showed recent lava flows confined to the crater, two thermal anomaly spots in the eastern part of the crater, and mainly white emissions from the SE. Thermal anomalies became stronger and more frequent in mid-May 2022, followed by strong Strombolian activity through June and July (BGVN 47:10); Sentinel-2 images on 2 June 2022 showed active lava flows within the crater and overflowing onto the NE flank. Clear images from 23 April 2023 (figure 47) show the extent of the cooled NE-flank lava flow, more extensive intra-crater flows, and two hotspots in slightly different locations compared to the previous March.
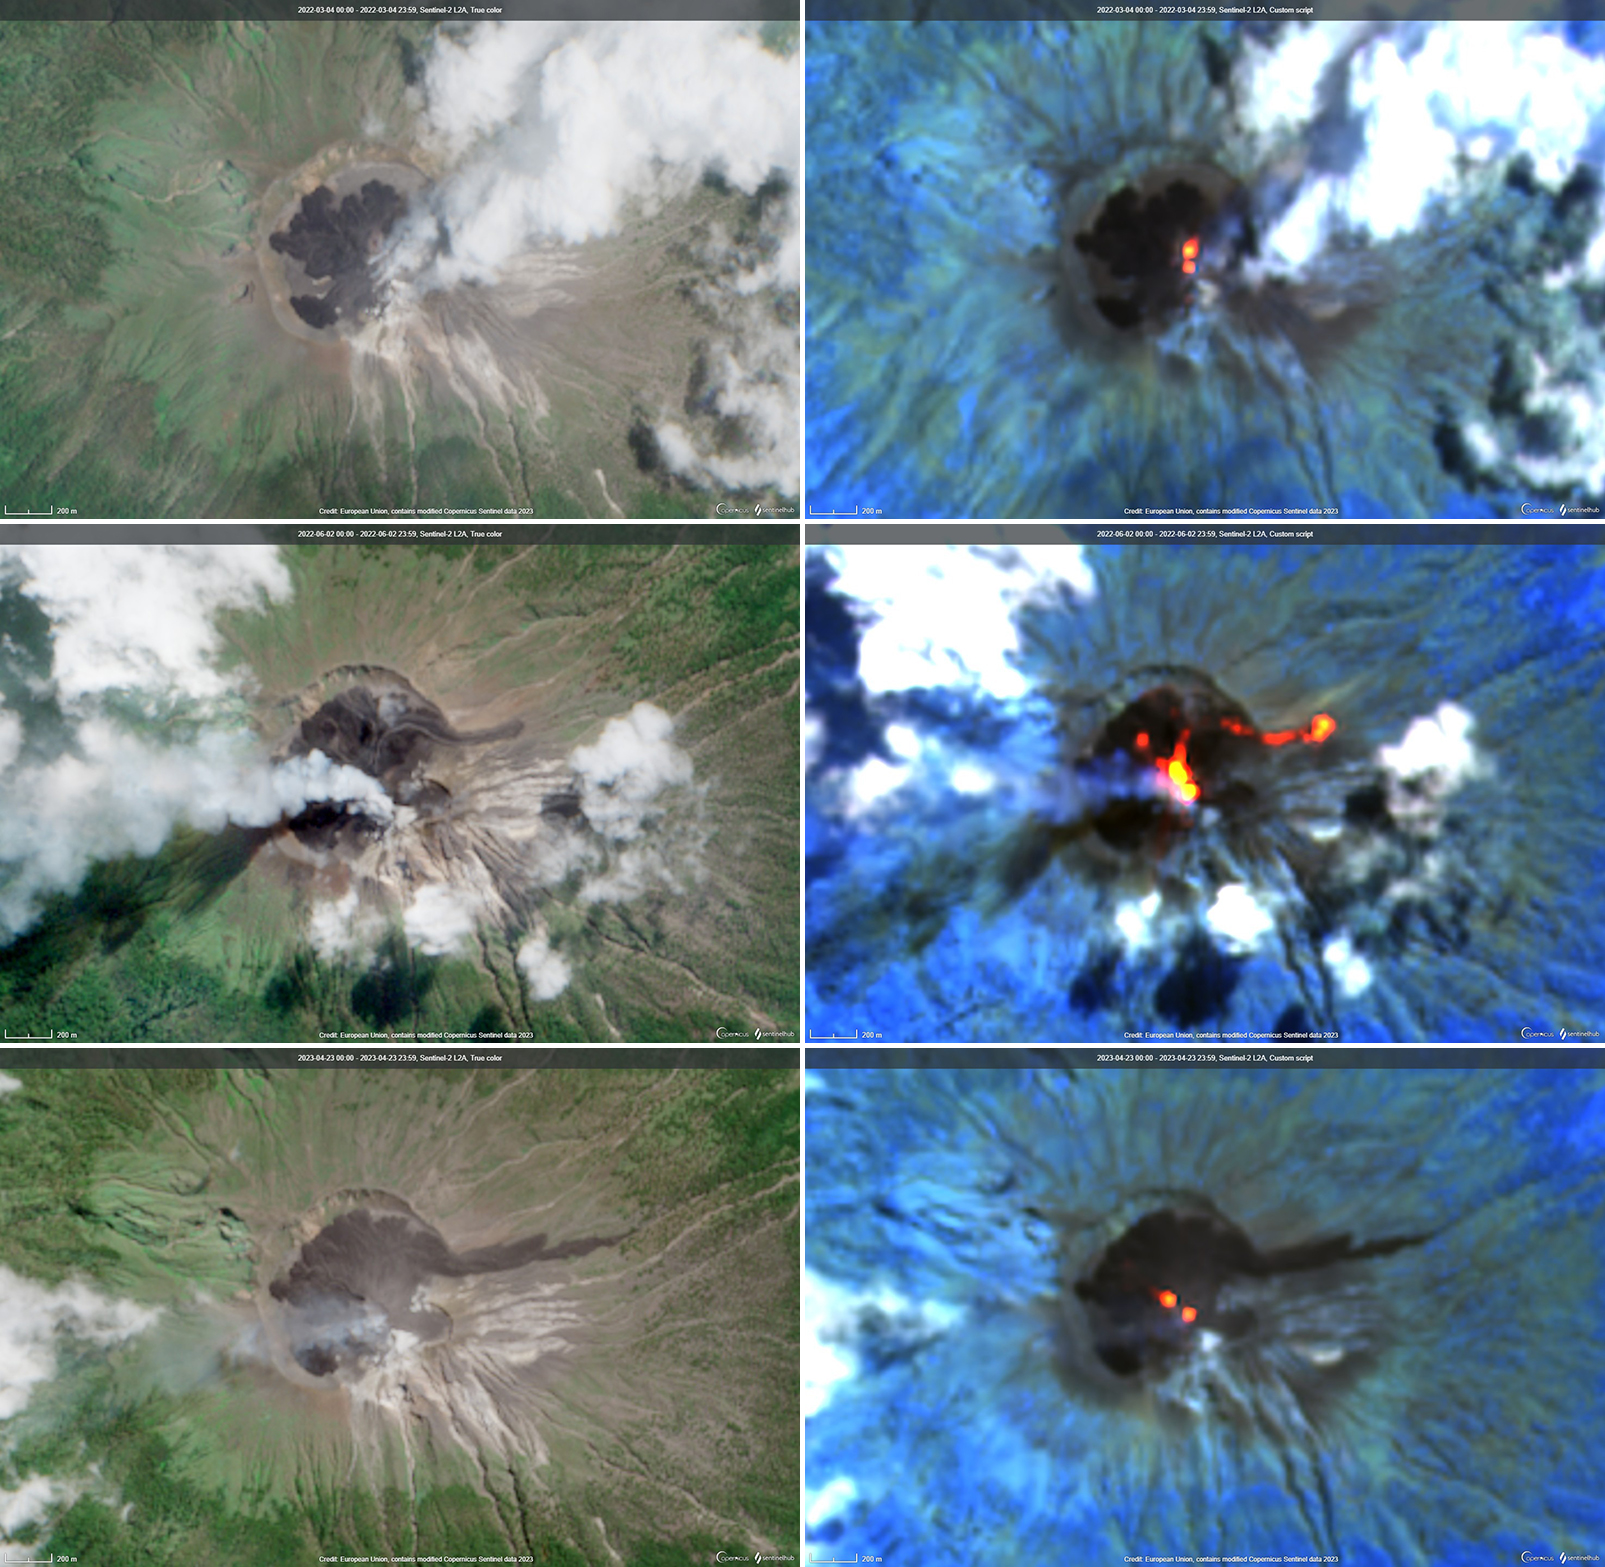 |
Figure 47. Sentinel-2 satellite images of Lewotolok showing sets of visual (true color) and infrared (bands 12, 11, 8a) views on 4 March 2022, 2 June 2022, and 23 April 2023. Courtesy of Copernicus Browser. |
Information Contacts: Pusat Vulkanologi dan Mitigasi Bencana Geologi (PVMBG, also known as Indonesian Center for Volcanology and Geological Hazard Mitigation, CVGHM), Jalan Diponegoro 57, Bandung 40122, Indonesia (URL: http://www.vsi.esdm.go.id/); MAGMA Indonesia, Kementerian Energi dan Sumber Daya Mineral (URL: https://magma.esdm.go.id/v1); Darwin Volcanic Ash Advisory Centre (VAAC), Bureau of Meteorology, Northern Territory Regional Office, PO Box 40050, Casuarina, NT 0811, Australia (URL: http://www.bom.gov.au/info/vaac/); MIROVA (Middle InfraRed Observation of Volcanic Activity), a collaborative project between the Universities of Turin and Florence (Italy) supported by the Centre for Volcanic Risk of the Italian Civil Protection Department (URL: http://www.mirovaweb.it/); Copernicus Browser, Copernicus Data Space Ecosystem, European Space Agency (URL: https://dataspace.copernicus.eu/browser/).
2024: January
| February
| March
| April
2023: January
| February
| March
| April
| May
| June
| July
| August
| September
| October
| November
| December
2022: January
| February
| March
| April
| May
| June
| July
| August
| September
| October
2021: January
| February
| March
| April
| May
| June
| July
| August
| September
| October
| November
| December
2020: November
| December
2017: October
2012: January
2011: December
2004: July
PVMBG reported that the eruption at Lewotolok continued during 17-23 April. White-and-gray ash plumes rose 100-600 m above the summit and drifted SE, W, and NW almost every day; white emissions rose 300-500 m above the summit and drifted W and NW during 19-20 April. The Alert Level remained at 3 (on a scale of 1-4) and the residents of Lamawolo, Lamatokan, and Jontona were warned to stay 2 km away from the vent and 3 km away from the vent on the S and SE flanks.
Source: Pusat Vulkanologi dan Mitigasi Bencana Geologi (PVMBG, also known as CVGHM)
PVMBG reported that the eruption at Lewotolok continued during 10-16 April. White-and-gray ash plumes rose as high as 800 m above the summit and drifted in multiple directions almost every day; white emissions rose 400 m above the summit and drifted W and NW on 15 April. The Alert Level remained at 3 (on a scale of 1-4) and the residents of Lamawolo, Lamatokan, and Jontona were warned to stay 2 km away from the vent and 3 km away from the vent on the S and SE flanks.
Source: Pusat Vulkanologi dan Mitigasi Bencana Geologi (PVMBG, also known as CVGHM)
PVMBG reported that the eruption at Lewotolok continued during 3-9 April. White-and-gray ash plumes rose as high as 350 m above the summit and drifted E and SE on 4 and 7 April. White emissions rose as high as 600 m above the summit and drifted in multiple directions on the other days. The Alert Level remained at 3 (on a scale of 1-4) and the residents of Lamawolo, Lamatokan, and Jontona were warned to stay 2 km away from the vent and 3 km away from the vent on the S and SE flanks.
Source: Pusat Vulkanologi dan Mitigasi Bencana Geologi (PVMBG, also known as CVGHM)
PVMBG reported that the eruption at Lewotolok continued during 27 March-2 April. White-and-gray ash plumes rose as high as 1 km and drifted in multiple directions during 27 and 29-30 March and 1 April. White steam-and-gas plumes rose 100-750 m above the summit and drifted W and NW on 28 and 31 March. According to a 2 April news article, observers heard rumbling and faint banging sounds. Incandescent lava at the summit and on the SE flank was visible in the early morning hours. The Alert Level remained at 3 (on a scale of 1-4) and the residents of Lamawolo, Lamatokan, and Jontona were warned to stay 2 km away from the vent and 3 km away from the vent on the S and SE flanks.
Sources: Pusat Vulkanologi dan Mitigasi Bencana Geologi (PVMBG, also known as CVGHM); Kompas.com
Pusat Vulkanologi dan Mitigasi Bencana Geologi (PVMBG) reported continuing activity at Lewotolok during 20-26 March. White-and-gray emissions were observed daily; plumes rose as high as 1 km above the summit. Seismicity included non-harmonic tremor episodes, frequent gas emission signals, and 6-18 daily eruption events. The Alert Level remained at 3 (on a scale of 1-4) and the public was warned to stay 2-km away from the vent and 3-km away from the summit crater on the S and SE flank.
Source: Pusat Vulkanologi dan Mitigasi Bencana Geologi (PVMBG, also known as CVGHM)
PVMBG reported that the eruption at Lewotolok continued during 13-19 March. White steam-and-gas plumes rose 50-200 m above the summit and drifted E and SE on 15, 17, and 19 March; emissions were not visible on the other days. According to a news report the lava flows on the S and SE flanks remained at 600 m and 1.8 km long, respectively, and had not advanced, though lava effusion was ongoing. Strombolian explosions continued through at least 15 March, ejecting incandescent material as far as 500 m from the crater. The Alert Level remained at 3 (on a scale of 1-4) and the public was warned to stay 2 km away from the vent and 3 km away from the vent on the S and SE flank.
Sources: Pusat Vulkanologi dan Mitigasi Bencana Geologi (PVMBG, also known as CVGHM); Antara News
PVMBG reported that the eruption at Lewotolok continued during 6-10 March. White-and-gray ash plumes rose 100-600 m above the summit and drifted W, E, and SE on 6 March. The next day white, gray, and black ash plumes rose 100-800 m above the summit and drifted E and SE. White emissions rose 100-300 m and drifted E and SE on 8 March; no emissions were visible during 9-10 March. According to a news report the lava flows on the S and SE flanks were 600 m and 1.8 km long, respectively, as of 7 March and had not advanced. The Alert Level remained at 3 (on a scale of 1-4) and the public was warned to stay 2 km away from the vent and 3 km away from the vent on the S and SE flank.
Sources: Pusat Vulkanologi dan Mitigasi Bencana Geologi (PVMBG, also known as CVGHM); Antara News
PVMBG reported that the eruption at Lewotolok continued during 28 February-5 March. Daily white-and-gray ash plumes rose as high as 900 m above the summit and drifted NW, E, and SE. The lava flow on the SE flank was 2 km long and the flow on the S flank was 600 m long; the distal end of the longer flow did not advance, though lava effusion continued, and new flows possibly overlapped the older flows. The Alert Level remained at 3 (on a scale of 1-4) and the public was warned to stay 2 km away from the vent and 3 km away from the vent on the S and SE flank. According to a news article residents were asked to bring their livestock into the villages.
Sources: Pusat Vulkanologi dan Mitigasi Bencana Geologi (PVMBG, also known as CVGHM); Antara News; Antara News
PVMBG reported that the eruption at Lewotolok continued during 15-27 February. White-and-gray ash plumes generally rose 200-800 m above the summit though some rose as high as 1 km above the summit and were dense. The seismic network recorded 3,615 signals indicating emissions during 16-26 February, according to a news article. Avalanches were detected but not visually observed during 15-23 February, and seismicity fluctuated but the data indicated an upward trend. Explosions continued to be recorded but began to intensify, ejecting incandescent material as far as 500 m from the crater rim and producing taller ash plumes.
Lava flows advanced over the crater rim on 15 February and traveled 400 m from the vent down the S and SE flanks. The flows continued to advance and by 23 February the SE flow was 1 km long and the S flow was 600 m long. The public was warned to stay at least 2 km away from the summit and 3 km away on the S and SE flanks. According to news articles activity significantly increased during 24-26 February; ash plumes continued to rise as high as 1 km above the summit and avalanches of material descended the SE and S flanks as far as 1 km. The SE lava flow advanced relatively fast, reaching 2 km long by 26 February. At 1000 on 27 February PVMBG raised the Alert Level to 3 (on a scale of 1-4) and the exclusion zone on the S and SE flanks was increased to 4 km. Though evacuations were not mandatory in Jontona, there were plans to assist residents who chose to evacuate; the lava flow was 2 km from the village.
Sources: Pusat Vulkanologi dan Mitigasi Bencana Geologi (PVMBG, also known as CVGHM); Antara News; Antara News; Antara News
PVMBG reported that the eruption at Lewotolok continued during 31 January-6 February. White gas-and-steam plumes rose as high as 700 m above the summit and drifted NW, E, and SE during 14-19 February. A dense white-and-gray ash plume rose 1 km above the summit and drifted SE at 1639 on 19 February according to a news report. Emissions were not visible on 20 February. The Alert Level remained at 2 (on a scale of 1-4) and the public was warned to stay at least 2 km away from the summit crater.
Sources: Pusat Vulkanologi dan Mitigasi Bencana Geologi (PVMBG, also known as CVGHM); Antara News
PVMBG reported that Lewotolok continued to erupt during 7-13 February. White emissions rose 5-100 m above the summit during 7 February, and 50-100 m above the summit during 10 and 13 February. A seismograph recorded explosive eruptive events at 1754 on 8 February, and 1657 on 9 February; white to gray ash plumes rose approximately 300-500 m above the summit and drifted E and SE. The Alert Level remained at 2 (on a scale of 1-4) and the public was warned to stay at least 2 km away from the summit crater.
Source: Pusat Vulkanologi dan Mitigasi Bencana Geologi (PVMBG, also known as CVGHM)
PVMBG reported that the eruption at Lewotolok continued during 31 January-6 February. White gas-and-steam plumes rose as high as 200 m above the summit and drifted NE, E, and SE on most days. Ejected incandescent material fell around the crater area on 2 February. White-and-gray plumes rose 50-100 m above the summit and drifted E on 5 February. The Alert Level remained at 2 (on a scale of 1-4) and the public was warned to stay at least 2 km away from the summit crater.
Source: Pusat Vulkanologi dan Mitigasi Bencana Geologi (PVMBG, also known as CVGHM)
PVMBG reported that the eruption at Lewotolok continued during 24-30 January. White gas-and-steam plumes rose 50-100 m above the summit and drifted NE, E, and SE on 27 and 29 January. White-and-gray plumes rose 50-200 m above the summit and drifted SE on 28 January. Emissions were not visible on the other days. The Alert Level remained at 2 (on a scale of 1-4) and the public was warned to stay at least 2 km away from the summit crater.
Source: Pusat Vulkanologi dan Mitigasi Bencana Geologi (PVMBG, also known as CVGHM)
PVMBG reported that the eruption at Lewotolok continued during 17-23 January. White gas-and-steam plumes rose 300 m above the summit and drifted NE, E, and SE during 17-20 January; emissions were not visible on the other days. Incandescent material was occasionally ejected above the vent, sometimes as high as 400 m. The Alert Level remained at 2 (on a scale of 1-4) and the public was warned to stay at least 2 km away from the summit crater.
Source: Pusat Vulkanologi dan Mitigasi Bencana Geologi (PVMBG, also known as CVGHM)
PVMBG reported that the eruption at Lewotolok continued during 10-16 January. White-and-gray ash plumes rose 150 m above the summit and drifted E on 12 January. White steam-and-gas plumes rose as high as 200 m above the summit and drifted NE, E, and SE on the other days, though no emissions were visible on 12 January. Incandescent lava was occasionally ejected about the vent. The Alert Level remained at 2 (on a scale of 1-4) and the public was warned to stay at least 2 km away from the summit crater.
Source: Pusat Vulkanologi dan Mitigasi Bencana Geologi (PVMBG, also known as CVGHM)
PVMBG reported that the eruption at Lewotolok continued during 3-9 January. White-and-gray ash plumes rose 300-350 m above the summit and drifted NW on 3 and 6 January. White steam-and-gas plumes rose 400-500 m above the summit and drifted NW on the other days. Incandescent lava was occasionally ejected about the vent. The Alert Level remained at 2 (on a scale of 1-4) and the public was warned to stay at least 2 km away from the summit crater.
Source: Pusat Vulkanologi dan Mitigasi Bencana Geologi (PVMBG, also known as CVGHM)
PVMBG reported that the eruption at Lewotolok continued during 27 December 2023-2 January 2024. White-and-gray ash plumes rose 250-400 m during 27-28 December, 31 December, and 1 January, and drifted NW, E, NW, and SE. White steam-and-gas plumes rose 100-600 m above the summit on the other days and drifted W, NW, NE, and E. Incandescent lava was occasionally ejected about the vent. The Alert Level remained at 2 (on a scale of 1-4) and the public was warned to stay at least 2 km away from the summit crater.
Source: Pusat Vulkanologi dan Mitigasi Bencana Geologi (PVMBG, also known as CVGHM)
PVMBG reported that the eruption at Lewotolok continued during 20-26 December. White-and-gray ash plumes rose 500-700 m during 21-23 December and drifted E, NW, and W. White steam-and-gas plumes rose 100-600 m above the summit on the other days and drifted W, NW, NE, and E. Incandescent lava was occasionally ejected about the vent. The Alert Level remained at 2 (on a scale of 1-4) and the public was warned to stay at least 2 km away from the summit crater.
Source: Pusat Vulkanologi dan Mitigasi Bencana Geologi (PVMBG, also known as CVGHM)
PVMBG reported that the eruption at Lewotolok continued during 13-19 December. White-and-gray ash plumes rose 100 m on 13 December and drifted E. White steam-and-gas plumes rose 100-200 m above the summit on the other days and drifted E, NE, and NW. Incandescence lava was ejected 200 m from the vent on 15 and 18 December and summit incandescence was visible in webcam images on 16 and 19 December. The Alert Level remained at 2 (on a scale of 1-4) and the public was warned to stay at least 2 km away from the summit crater.
Source: Pusat Vulkanologi dan Mitigasi Bencana Geologi (PVMBG, also known as CVGHM)
PVMBG reported that the eruption at Lewotolok continued during 6-12 December. White steam-and-gas plumes rose 300-500 m above the summit and drifted in multiple directions on 6, 9, and 12 December. White-and-gray ash plumes rose 300-400 m during 7-8 and 10-11 December and drifted E, N, and W. Ejections of incandescence lava at the summit were visible on 6 and 12 December. The Alert Level remained at 2 (on a scale of 1-4) and the public was warned to stay at least 2 km away from the summit crater.
Source: Pusat Vulkanologi dan Mitigasi Bencana Geologi (PVMBG, also known as CVGHM)
PVMBG reported that eruptive activity continued at Lewotolok during 29 November-5 December. Daily white and sometimes white-to-gray emissions rose 25-600 m above the active vent. Seismic signals associated with both eruption and gas emission events were recorded daily. Volcano Observatory Notices for Aviation (VONAs) and Volcanic Eruption Notices (VENs) were issued during 30 November through 5 December for eruptions that produced white, gray, and white-to-gray ash plumes that rose as high as 550 m above the active vent and drifted W and NW. The Alert Level remained at 2 (on a scale of 1-4) and the public was warned to stay at least 2 km away from the summit crater.
Source: Pusat Vulkanologi dan Mitigasi Bencana Geologi (PVMBG, also known as CVGHM)
PVMBG reported that the eruption at Lewotolok continued during 22-28 November. White steam-and-gas plumes rose 300-400 m above the summit and drifted W and NW during 22 and 24-26 November. White-and-gray ash plumes rose as high as 1.9 km during 23 and 27-28 November and drifted W and NW. Incandescence at the summit was visible on 22 and 26 November. The Alert Level remained at 2 (on a scale of 1-4) and the public was warned to stay at least 2 km away from the summit crater.
Source: Pusat Vulkanologi dan Mitigasi Bencana Geologi (PVMBG, also known as CVGHM)
PVMBG reported that the eruption at Lewotolok continued during 15-21 November. Daily white steam-and-gas plumes rose 50-800 m above the summit and drifted W, NW, NE, and E. White-and-gray ash plumes rose as high as 300 m and drifted NW, N, and E on 17 and 19 November. Incandescent material being ejected above the summit was occasionally visible. The Alert Level remained at 2 (on a scale of 1-4) and the public was warned to stay at least 2 km away from the summit crater.
Source: Pusat Vulkanologi dan Mitigasi Bencana Geologi (PVMBG, also known as CVGHM)
PVMBG reported that the eruption at Lewotolok continued during 8-14 November. White-and-gray ash plumes rose 50-500 m above the summit and drifted N, W, and NW on 10 and 13 November. White steam-and-gas plumes rose 50-400 m and drifted W and NW on the other days during the week. Incandescent material being ejected above the summit was observed on 9 and 12 November; on the 12th it was captured in a webcam image at 0357. According to Antara News the local Mountain Monitoring Officer also noted that many of the explosions on 13 November were accompanied by rumbling or thumping noises, and crater incandescence was still observed. The Alert Level remained at 2 (on a scale of 1-4) and the public was warned to stay at least 2 km away from the summit crater.
Sources: Pusat Vulkanologi dan Mitigasi Bencana Geologi (PVMBG, also known as CVGHM); Antara News
PVMBG reported that the eruption at Lewotolok continued during 1-7 November. White-and-gray ash plumes rose 100-400 m above the summit and drifted W and NW on 1 November. White steam-and-gas plumes rose 50-400 m and drifted W, NW, and E on the other days during the week. Webcam images captured at 1853 on 1 November and 0350 on 3 November showed incandescent material being ejected above the summit. Incandescence at the summit was visible in a webcam image at 2128 on 4 November. The Alert Level remained at 2 (on a scale of 1-4) and the public was warned to stay at least 2 km away from the summit crater.
Source: Pusat Vulkanologi dan Mitigasi Bencana Geologi (PVMBG, also known as CVGHM)
PVMBG reported that the eruption at Lewotolok continued during 25-31 October. White-and-gray ash plumes rose 350-500 m above the summit and W and NW during 26-27 and 29 October. White steam-and-gas plumes rose 300-400 m and drifted W and NW on the other days during the week. Webcam images captured at 2102 on 25 October and 2224 on 26 October showed incandescent material being ejected above the summit. The Alert Level remained at 2 (on a scale of 1-4) and the public was warned to stay at least 2 km away from the summit crater.
Source: Pusat Vulkanologi dan Mitigasi Bencana Geologi (PVMBG, also known as CVGHM)
PVMBG reported that the eruption at Lewotolok continued during 18-24 October. White-and-gray ash plumes rose 400-600 m above the summit and W and NW during 19-21 and 23-24 October. White steam-and-gas plumes rose 200-300 m and drifted W and NW on the other days during the week. The Alert Level remained at 2 (on a scale of 1-4) and the public was warned to stay at least 2 km away from the summit crater.
Source: Pusat Vulkanologi dan Mitigasi Bencana Geologi (PVMBG, also known as CVGHM)
PVMBG reported that the eruption at Lewotolok continued during 11-17 October. White-and-gray ash plumes rose as high as 400 m above the summit and W, NW, and E during 11-12 and 14 October. On the other days during the week white steam-and-gas plumes rose as high as 500 m and drifted NW. At 2047 on 14 October a webcam image captured incandescent material that was ejected above the summit. The Alert Level remained at 2 (on a scale of 1-4) and the public was warned to stay at least 2 km away from the summit crater.
Source: Pusat Vulkanologi dan Mitigasi Bencana Geologi (PVMBG, also known as CVGHM)
PVMBG reported that the eruption at Lewotolok continued during 4-10 October. White-and-gray ash plumes rose 250 m above the summit and drifted N and NW on 4 October. The next day a Volcano Observatory Notices for Aviation (VONA) was issued for a gray ash plume that rose as high as 700 m and drifted W. Ash plumes rose 200-500 m and drifted N, NW, and W on 8 and 10 October. On the other days during the week white steam-and-gas plumes were visible rising as high as 500 m and drifting N, NW, and W. At 2024 on 9 October a webcam image captured incandescent material being ejected above the summit. The Alert Level remained at 2 (on a scale of 1-4) and the public was warned to stay at least 2 km away from the summit crater.
Source: Pusat Vulkanologi dan Mitigasi Bencana Geologi (PVMBG, also known as CVGHM)
PVMBG reported that the eruption at Lewotolok continued during 27 September-3 October. Daily white steam-and-gas plumes rose as high as 500 m above the summit and drifted W, NW, and E. Dense gray or white-and-gray ash plumes 600-700 m above the summit and drifted W during 28-29 September and 1 and 3 October. The Alert Level remained at 2 (on a scale of 1-4) and the public was warned to stay at least 2 km away from the summit crater.
Source: Pusat Vulkanologi dan Mitigasi Bencana Geologi (PVMBG, also known as CVGHM)
PVMBG reported that the eruption at Lewotolok continued during 20-26 September. White-and-gray plumes of variable densities rose as high as 800 m above the summit and drifted in multiple directions on all days except 25 September when only white plumes were visible. A webcam image captured incandescent material being ejected above the summit at 2346 on 23 September. The Alert Level remained at 2 (on a scale of 1-4) and the public was warned to stay at least 2 km away from the summit crater.
Source: Pusat Vulkanologi dan Mitigasi Bencana Geologi (PVMBG, also known as CVGHM)
PVMBG reported that the eruption at Lewotolok continued during 12-19 September. According to the Darwin VAAC an ash plume rose 600 m above the summit and drifted WNW on 12 September. PVMBG noted that white-and-gray plumes rose 250-400 m above the summit and drifted W and NW on 13 and 16 September. White steam-and-gas plumes rose as high as 300 m and drifted W and NW on the other days. Webcam images captured incandescent material being ejected above the summit at 0101 on 13 September and summit incandescence at 1830 on 16 September. The Alert Level remained at 2 (on a scale of 1-4) and the public was warned to stay at least 2 km away from the summit crater.
Sources: Pusat Vulkanologi dan Mitigasi Bencana Geologi (PVMBG, also known as CVGHM); Darwin Volcanic Ash Advisory Centre (VAAC)
PVMBG reported that the eruption at Lewotolok continued during 6-12 September. White-and-gray plumes rose 100-500 m above the summit and drifted W and NW during 4-6 September. White steam-and-gas plumes rose as high as 400 m and drifted W and NW each day during the rest of the week. The Alert Level remained at 2 (on a scale of 1-4) and the public was warned to stay at least 2 km away from the summit crater.
Source: Pusat Vulkanologi dan Mitigasi Bencana Geologi (PVMBG, also known as CVGHM)
PVMBG reported that the eruption at Lewotolok continued during 30 August-5 September. Almost daily white steam-and-gas plumes rose as high as 700 m above the summit and drifted W and NW. White-and-gray ash plumes rose as high as 700 m and drifted E, SW, and W on 1 September. A Volcano Observatory Notices for Aviation (VONA) described an ash plume rising 500 m and drifting SE on 3 September; a webcam image showed incandescent material at the crater and on the upper flank. The Alert Level remained at 2 (on a scale of 1-4) and the public was warned to stay at least 2 km away from the summit crater.
Source: Pusat Vulkanologi dan Mitigasi Bencana Geologi (PVMBG, also known as CVGHM)
PVMBG reported that the eruption at Lewotolok continued during 23-29 August. Daily white steam-and-gas plumes rose as high as 500 m above the summit and drifted W and NW, though the plumes in the webcam images in the reports appeared to contain ash. White-and-gray ash plumes rose as high as 500 m and drifted on 28 August. Volcano Observatory Notices for Aviation (VONAs) described ash plumes rising 700 m and drifting W and NW at 1409 on 23 August and 1603 on 24 August. The Alert Level remained at 2 (on a scale of 1-4) and the public was warned to stay at least 2 km away from the summit crater.
Source: Pusat Vulkanologi dan Mitigasi Bencana Geologi (PVMBG, also known as CVGHM)
PVMBG reported that the eruption at Lewotolok continued during 16-22 August. On most days white steam-and-gas plumes rose as high as 500 m above the summit and drifted W and NW. White-and-gray ash plumes rose 100-300 m and drifted W and NW on 16 August. Incandescence at the summit was visible in a webcam image from 19 August. Possible ash plumes were visible in webcam images on most days, especially in an image from 1735 on 20 August. The Alert Level remained at 2 (on a scale of 1-4) and the public was warned to stay at least 2 km away from the summit crater.
Source: Pusat Vulkanologi dan Mitigasi Bencana Geologi (PVMBG, also known as CVGHM)
PVMBG reported that the eruption at Lewotolok continued during 9-15 August. On most days white steam-and-gas plumes rose as high as 500 m above the summit and drifted W and NW. Incandescence at the summit was visible in a webcam image from 11 August. Variable density gray ash plumes rose 500-800 m and drifted W and NW during 11-12 August. The Alert Level remained at 2 (on a scale of 1-4) and the public was warned to stay at least 2 km away from the summit crater.
Source: Pusat Vulkanologi dan Mitigasi Bencana Geologi (PVMBG, also known as CVGHM)
PVMBG reported that the eruption at Lewotolok continued during 2-8 August. Daily white steam-and-gas plumes rose as high as 400 m above the summit and drifted W and NW. On 7 August white-and-gray plumes rose as high as 200 m and drifted W and NW. Incandescent material being ejected above the summit was visible in a few of the webcam images posted during the week. The Alert Level remained at 2 (on a scale of 1-4) and the public was warned to stay at least 2 km away from the summit crater.
Source: Pusat Vulkanologi dan Mitigasi Bencana Geologi (PVMBG, also known as CVGHM)
PVMBG reported that the eruption at Lewotolok continued during 26 July through 1 August. Daily white-and-gray plumes rose 5-500 m above the summit and drifted E, SE, NW, and W. On 27 July gray ash plumes rose 500 m above the summit and drifted NW. The Alert Level remained at 2 (on a scale of 1-4) and the public was warned to stay at least 2 km away from the summit crater.
Source: Pusat Vulkanologi dan Mitigasi Bencana Geologi (PVMBG, also known as CVGHM)
PVMBG reported that the eruption at Lewotolok continued during 19-25 July. Daily dense white steam-and-gas plumes rose as high as 500 m above the summit and drifted SE, NW, W, and SW. On 21 July white-and-gray plumes rose as high as 500 m and drifted SW, W, and NW. The Alert Level remained at 2 (on a scale of 1-4) and the public was warned to stay at least 2 km away from the summit crater.
Source: Pusat Vulkanologi dan Mitigasi Bencana Geologi (PVMBG, also known as CVGHM)
PVMBG reported that the eruption at Lewotolok continued during 12-18 July. Daily dense white steam-and-gas plumes rose as high as 500 m above the summit and drifted NW, W, and SW. A small plume possibly containing ash was visible in a posted webcam image from 1101 on 13 July. Incandescence at the summit was visible in webcam images from 2129 on 12 July, 1957 on 15 July, and 2205 on 16 July. The Alert Level remained at 2 (on a scale of 1-4) and the public was warned to stay at least 2 km away from the summit crater.
Source: Pusat Vulkanologi dan Mitigasi Bencana Geologi (PVMBG, also known as CVGHM)
PVMBG reported that the eruption at Lewotolok continued during 28 June-4 July. Emissions mainly consisted of dense white steam-and-gas plumes that rose as high as 800 m above the summit and drifted NW, W, SW, and SE. During 30 June-1 July white-and-gray ash plumes rose 200-700 m above the summit and drifted E, SE, S, and SW. Incandescent material being ejected above the summit was visible in webcam images from 1859 on 29 June, 2227 on 30 June, 0103 on 2 July, and 2339 on 3 July. The Alert Level remained at 2 (on a scale of 1-4) and the public was warned to stay at least 2 km away from the summit crater.
Source: Pusat Vulkanologi dan Mitigasi Bencana Geologi (PVMBG, also known as CVGHM)
PVMBG reported that the eruption at Lewotolok continued during 21-27 June. Emissions mainly consisted of white steam-and-gas plumes that rose as high as 800 m above the summit and drifted W and NW; white-and-gray ash plumes rose as high as 800 m above the main crater and drifted W and NW during 22-23 June. Incandescence was visible at the summit during 24-26 June, and a webcam image taken at 2257 on 25 June showed incandescent ejecta at the summit. The Alert Level remained at 2 (on a scale of 1-4) and the public was warned to stay at least 2 km away from the summit crater.
Source: Pusat Vulkanologi dan Mitigasi Bencana Geologi (PVMBG, also known as CVGHM)
PVMBG reported that the eruption at Lewotolok continued during 14-20 June. White-and-gray ash plumes rose as high as 400 m above the summit and drifted W and NW during 15 and 17-18 June; white steam-and-gas emissions were visible on the other days. Strombolian explosions at the summit crater were visible in webcam images at 2242 on 14 June, 2137 on 17 June, and 2213 on 18 June. The Alert Level remained at 2 (on a scale of 1-4) and the public was warned to stay at least 2 km away from the summit crater in all directions.
Source: Pusat Vulkanologi dan Mitigasi Bencana Geologi (PVMBG, also known as CVGHM)
PVMBG reported that the eruption at Lewotolok continued during 7-13 June. Daily white-and-gray ash plumes rose as high as 700 m above the summit and drifted SW, W, and NW. The Alert Level remained at 2 (on a scale of 1-4) and the public was warned to stay at least 2 km away from the summit crater in all directions.
Source: Pusat Vulkanologi dan Mitigasi Bencana Geologi (PVMBG, also known as CVGHM)
PVMBG reported that the eruption at Lewotolok continued during 31 May-6 June. Ash plumes were periodically visible through the week. Dense white-and-gray ash plumes rose as high as 600 m above the summit and drifted W and NW on 1 June. Ash plumes on 2 June rose as high as 1 km and drifted W and SW. A dense ash plume rose 550 m and drifted SW on 5 June. The Alert Level remained at 2 (on a scale of 1-4) and the public was warned to stay at least 2 km away from the summit crater in all directions.
Source: Pusat Vulkanologi dan Mitigasi Bencana Geologi (PVMBG, also known as CVGHM)
PVMBG reported that the eruption at Lewotolok continued during 24-30 May. Daily white-to-gray plumes of variable densities rose as high as 800 m above the summit and drifted E, NE, N, and NW. At 2037 on 27 May a webcam image showed an explosion of incandescent material above the summit. At 0613 on 29 May a dense gray-and-black ash plume rose 800 m above the summit and drifted NE and E. The Alert Level remained at 2 (on a scale of 1-4) and the public was warned to stay at least 2 km away from the summit crater in all directions.
Source: Pusat Vulkanologi dan Mitigasi Bencana Geologi (PVMBG, also known as CVGHM)
PVMBG reported that the eruption at Lewotolok was ongoing during 17-23 May. Almost daily white-and-gray ash plumes rose as high as 700 m above the summit and drifted in variable directions; only white gas-and-steam plumes were visible on 19 May. A nighttime webcam image of incandescent material being ejected above the summit was captured at 1844 on 17 May. The Alert Level remained at 2 (on a scale of 1-4) and the public was warned to stay 2 km away from the summit crater.
Source: Pusat Vulkanologi dan Mitigasi Bencana Geologi (PVMBG, also known as CVGHM)
PVMBG reported that the eruption at Lewotolok was ongoing during 9-16 May. Almost daily white-and-gray ash plumes generally rose as high as 500 m above the summit and drifted in variable directions. At 0632 on 11 May a white-to-gray ash plume rose 500 m and drifted SW. At 0645 and 0957 on 11 May white-to-gray ash plumes rose 400-600 m and drifted E and SE, respectively. Nighttime webcam images of incandescent material being ejected above the summit were posted in daily reports during 10-13 May. The Alert Level remained at 2 (on a scale of 1-4) and the public was warned to stay 2 km away from the summit crater.
Source: Pusat Vulkanologi dan Mitigasi Bencana Geologi (PVMBG, also known as CVGHM)
PVMBG reported that the eruption at Lewotolok was ongoing during 3-9 May. Daily white-and-gray or dark gray ash plumes rose as high as 800 m above the summit and drifted NW, W, and SW. Webcam images of incandescent material being ejected above the summit were posted in daily reports during 7-8 May. The Alert Level remained at 2 (on a scale of 1-4) and the public was warned to stay 2 km away from the summit crater.
Source: Pusat Vulkanologi dan Mitigasi Bencana Geologi (PVMBG, also known as CVGHM)
PVMBG reported that the eruption at Lewotolok was ongoing during 26 April-2 May. Almost daily white-and-gray plumes rose as high as 500 m above the summit and drifted NW, W, and SW. White gas-and-steam plumes rose 300 m and drifted SW on 28 April. Crater incandescence was visible in webcam images posted with the 27 April report. The Alert Level remained at 2 (on a scale of 1-4) and the public was warned to stay 2 km away from the summit crater.
Source: Pusat Vulkanologi dan Mitigasi Bencana Geologi (PVMBG, also known as CVGHM)
PVMBG reported that the eruption at Lewotolok was ongoing during 19-25 April. On 19, 21, and 23 April white-and-gray plumes rose 200-700 m and drifted E, NE, N, and NW. White steam-and-gas plumes of variable densities were seen during 20, 22, and 24-25 April rising as high as 500 m above the summit and drifting SW, W, and NW. Crater incandescence was visible in webcam images posted with the reports during 21-22 April. The Alert Level remained at 2 (on a scale of 1-4) and the public was warned to stay 2 km away from the summit crater.
Source: Pusat Vulkanologi dan Mitigasi Bencana Geologi (PVMBG, also known as CVGHM)
PVMBG reported that the eruption at Lewotolok was ongoing during 12-17 April. White steam-and-gas plumes of variable densities were seen on most days rising as high as 700 m above the summit and drifting NE, E, and SE. On 13, 15, and 17 April white-and-gray plumes rose as high as 500 m and drifted NW, NE, E, and SE. The Alert Level remained at 2 (on a scale of 1-4) and the public was warned to stay 2 km away from the summit crater.
Source: Pusat Vulkanologi dan Mitigasi Bencana Geologi (PVMBG, also known as CVGHM)
PVMBG reported that the eruption at Lewotolok was ongoing during 5-11 April. White steam-and-gas plumes were seen on most days rising as high as 500 m above the summit and drifting in multiple directions. According to the Darwin VAAC an ash plume rose to 1.8 km (6,000 ft) a.s.l., or about 370 m above the summit, on 6 April and drifted N. On 7 April white-and-gray plumes of variable densities rose 100-400 m and drifted SE and W; similar plumes on 9 April rose 200-350 m and drifted NE and E. The Alert Level remained at 2 (on a scale of 1-4) and the public was warned to stay 2 km away from the summit crater.
Sources: Pusat Vulkanologi dan Mitigasi Bencana Geologi (PVMBG, also known as CVGHM); Darwin Volcanic Ash Advisory Centre (VAAC)
PVMBG reported that the eruption at Lewotolok was ongoing during 29 March-4 April. White gas plumes rose as high as 700 m above the summit and drifted in multiple directions during 29 March and 1-2 April. White-and-gray ash plumes of variable densities rose 100-750 m above the summit and drifted in multiple directions during 30-31 March and during 3-4 April. A webcam image from 0050 on 4 April showed summit incandescence. The Alert Level remained at 2 (on a scale of 1-4) and the public was warned to stay 2 km away from the summit crater.
Source: Pusat Vulkanologi dan Mitigasi Bencana Geologi (PVMBG, also known as CVGHM)
PVMBG reported that the eruption at Lewotolok was ongoing during 22-28 March. Daily ash plumes, sometimes dense, were visible rising as high as 800 m above the summit and drifting mainly W and NW. VONAs issued on most days described dense gray or gray-to-white ash plumes at 0517, 1623, and 2016 on 22 March, at 1744 on 24 March, at 0103 on 26 March, at 0845 and 1604 on 27 March, and at 0538 on 28 March. A webcam image at 2220 on 22 March showed incandescent material around the summit area and being ejected above the summit. Another webcam images at 0103 on 26 March captured a Strombolian explosion at the summit. The Alert Level remained at 2 (on a scale of 1-4) and the public was warned to stay 2 km away from the summit crater.
Source: Pusat Vulkanologi dan Mitigasi Bencana Geologi (PVMBG, also known as CVGHM)
PVMBG reported that the eruption at Lewotolok was ongoing during 15-21 March. White gas-and-steam plumes rose as high as 500 m above the summit and drifted in multiple directions during 15-19 March. White-and-gray ash plumes rose 400-600 m above the summit and drifted W and NW during 20-21 March. The Alert Level remained at 2 (on a scale of 1-4) and the public was warned to stay 2 km away from the summit crater.
Source: Pusat Vulkanologi dan Mitigasi Bencana Geologi (PVMBG, also known as CVGHM)
PVMBG reported that the eruption at Lewotolok was ongoing during 8-14 March. Daily white gas-and-steam plumes rose as high as 700 m above the summit and drifted in multiple directions. A few webcam images posted with the observatory reports showed incandescence at the summit. The Alert Level remained at 2 (on a scale of 1-4) and the public was warned to stay 2 km away from the summit crater.
Source: Pusat Vulkanologi dan Mitigasi Bencana Geologi (PVMBG, also known as CVGHM)
PVMBG reported that the eruption at Lewotolok was ongoing during 1-7 March. White-and-gray plumes rose as high as 400 m above the summit and drifted E and SE on 2 and 7 March. On most of the other days white gas plumes were seen rising as high as 100 m and drifting E and SE. The Alert Level remained at 2 (on a scale of 1-4) and the public was warned to stay 2 km away from the summit crater.
Source: Pusat Vulkanologi dan Mitigasi Bencana Geologi (PVMBG, also known as CVGHM)
PVMBG reported that the eruption at Lewotolok was ongoing during 15-21 February. Minor crater incandescence at the summit was visible in most of the nighttime webcam images posted with the daily PVMBG reports. A webcam image captured at 0210 on 18 February showed Strombolian activity and incandescent material on the flank. White-and-gray plumes rose as high as 400 m above the summit and drifted E and SE during 16-17 February. A white-and-gray plume rose 700 m and drifted E on 19 February. The Alert Level remained at 2 (on a scale of 1-4) and the public was warned to stay 2 km away from the summit crater.
Source: Pusat Vulkanologi dan Mitigasi Bencana Geologi (PVMBG, also known as CVGHM)
PVMBG reported that the eruption at Lewotolok was ongoing during 7-14 February. Minor crater incandescence at the summit was visible in most of the daily webcam images posted with the daily PVMBG reports. A webcam image captured at 2140 on 11 February showed Strombolian activity. White-and-gray plumes rose as high as 300 m above the crater rim and drifted NE, E, and SE on each day except 9-10 and 14 February due to weather clouds. The Alert Level remained at 2 (on a scale of 1-4) and the public was warned to stay 2 km away from the summit crater.
Source: Pusat Vulkanologi dan Mitigasi Bencana Geologi (PVMBG, also known as CVGHM)
PVMBG reported that the eruption at Lewotolok was ongoing during 1-7 February. Incandescence above the crater was visible in a 1 February webcam image. White-and-gray plumes rose as high as 400 m above the crater rim and drifted E and SE on 1 and 5 February. White plumes of variable densities were visible on other days of the week. The Alert Level remained at 2 (on a scale of 1-4) and the public was warned to stay 2 km away from the summit crater.
Source: Pusat Vulkanologi dan Mitigasi Bencana Geologi (PVMBG, also known as CVGHM)
PVMBG reported that the eruption at Lewotolok was ongoing during 24-31 January. Nighttime webcam images captured near-daily incandescent material that was ejected above the summit crater. Almost daily emissions that were white and gray and had variable densities rose as high as 600 m above the summit and drifted SE, E, and NE. The Alert Level remained at 2 (on a scale of 1-4) and the public was warned to stay 2 km away from the summit crater.
Source: Pusat Vulkanologi dan Mitigasi Bencana Geologi (PVMBG, also known as CVGHM)
PVMBG reported that the eruption at Lewotolok was ongoing during 17-24 January. Nighttime webcam images captured almost daily showed incandescent material being ejected above the summit crater. White steam-and-gas plumes were visible on most days rising as high has 250 m above the summit. Emissions during 18-20 January were white-and-gray and rose as high as 400 m and drifted NE and E. The Alert Level remained at 2 (on a scale of 1-4) and the public was warned to stay 2 km away from the summit crater.
Source: Pusat Vulkanologi dan Mitigasi Bencana Geologi (PVMBG, also known as CVGHM)
PVMBG reported that at 0747 on 14 January an eruption at Lewotolok produced a white-and-gray ash plume that rose around 400 m above the summit and drifted E. At 2055 on 16 January a white-and-gray ash plume of variable density rose around 400 m above the summit and drifted SE. A photo posted with the report showed incandescence emanating from the summit, possibly from ejected material. The Alert Level remained at 2 (on a scale of 1-4) and the public was warned to stay 2 km away from the summit crater.
Source: Pusat Vulkanologi dan Mitigasi Bencana Geologi (PVMBG, also known as CVGHM)
PVMBG reported that the eruption at Lewotolok continued during 18-25 October. Daily white emissions rose as high as 600 m above the summit and drifted in multiple directions. During 22-23 October white-and-gray plumes rose as high as 500 m and drifted W. The Alert Level remained at 3 (on a scale of 1-4) and the public was warned to stay 3 km away from the summit crater and 4 km away from the crater on the SE flank.
Source: Pusat Vulkanologi dan Mitigasi Bencana Geologi (PVMBG, also known as CVGHM)
PVMBG reported that the Strombolian eruption at Lewotolok continued during 11-18 October. White emissions rose as high as 500 m above the summit almost daily and drifted in multiple directions. At 0351 on 14 October an eruptive event produced a dense gray ash plume that rose about 1.2 km above the summit and drifted SW. The Alert Level remained at 3 (on a scale of 1-4) and the public was warned to stay 3 km away from the summit crater and 4 km away from the crater on the SE flank.
Source: Pusat Vulkanologi dan Mitigasi Bencana Geologi (PVMBG, also known as CVGHM)
PVMBG reported that the Strombolian eruption at Lewotolok continued during 5-11 October. Daily white emissions rose as high as 500 m above the summit and drifted W, NW, and NE. White-and-gray plumes rose as high 200 m and drifted NW and W during 9-10 October. Webcam images posted with the daily observatory reports often showed incandescence above the crater rim. The Alert Level remained at 3 (on a scale of 1-4) and the public was warned to stay 3 km away from the summit crater and 4 km away from the crater on the SE flank.
Source: Pusat Vulkanologi dan Mitigasi Bencana Geologi (PVMBG, also known as CVGHM)
PVMBG reported that the eruption at Lewotolok continued during 27 September-4 October. White emissions rose as high as 350 m above the summit and drifted E, SE, W, and NW on most days. White-and-gray plumes rose as high 500 m and drifted NW, W, and E during 29-30 September and 1-2 October. The Alert Level remained at 3 (on a scale of 1-4) and the public was warned to stay 3 km away from the summit crater and 4 km away from the crater on the SE flank.
Source: Pusat Vulkanologi dan Mitigasi Bencana Geologi (PVMBG, also known as CVGHM)
PVMBG reported that the eruption at Lewotolok continued during 20-27 September. Daily white emissions rose as high as 350 m above the summit and drifted in multiple directions. At 0350 on 23 September an eruptive event produced an ash plume that rose 800 m and drifted W. An image captured at that time showed Strombolian activity with incandescent material being ejected above the summit. White-and-gray plumes generally rose as high 500 m and drifted NW, W, and S that same day. The Alert Level remained at 3 (on a scale of 1-4) and the public was warned to stay 3 km away from the summit crater and 4 km away from the crater on the SE flank.
Source: Pusat Vulkanologi dan Mitigasi Bencana Geologi (PVMBG, also known as CVGHM)
PVMBG reported that the eruption at Lewotolok continued during 13-20 September. Daily white emissions rose as high as 300 m above the summit and drifted in multiple directions. During 16-19 September white-and-gray or white, gray, and black plumes rose as high 1 km and drifted W and NW. Incandescence above the crater rim was visible in some webcam photographs posted during 14-15 September. The Alert Level remained at 3 (on a scale of 1-4) and the public was warned to stay 3 km away from the summit crater and 4 km away from the crater on the SE flank.
Source: Pusat Vulkanologi dan Mitigasi Bencana Geologi (PVMBG, also known as CVGHM)
PVMBG reported that the eruption at Lewotolok continued during 6-13 September. Daily white emissions rose as high as 500 m above the summit and drifted in multiple directions. During 7-8 and 10-11 September white-and-gray plumes rose as high as 700 m and 400 m above the summit, respectively, and drifted W and NW. Incandescence above the crater rim was visible in a webcam photograph captured on 13 September. The Alert Level remained at 3 (on a scale of 1-4) and the public was warned to stay 3 km away from the summit crater and 4 km away from the crater on the SE flank.
Source: Pusat Vulkanologi dan Mitigasi Bencana Geologi (PVMBG, also known as CVGHM)
PVMBG reported that the eruption at Lewotolok continued during 30 August-6 September. Daily white emissions rose as high as 500 m above the summit and drifted NW, W, and SW. During 1-2 September white, gray, and black plumes rose as high as 1.5 km above the summit. The Alert Level remained at 3 (on a scale of 1-4) and the public was warned to stay 3 km away from the summit crater and 4 km away from the crater on the SE flank.
Source: Pusat Vulkanologi dan Mitigasi Bencana Geologi (PVMBG, also known as CVGHM)
PVMBG reported that the Strombolian eruption at Lewotolok continued during 23-30 August. Daily white emissions rose as high as 700 m above the summit and drifted in multiple directions. Photos posted with daily reports showed crater incandescence and occasional Strombolian activity. The Alert Level remained at 3 (on a scale of 1-4) and the public was warned to stay 3 km away from the summit crater and 4 km away from the crater on the SE flank.
Source: Pusat Vulkanologi dan Mitigasi Bencana Geologi (PVMBG, also known as CVGHM)
PVMBG reported that the Strombolian eruption at Lewotolok continued during 17-23 August. Daily white emissions rose as high as 500 m above the summit and drifted in multiple directions. White-and-gray plumes rose as high as 300 m on 19 August. Photos in some daily reports showed Strombolian activity. The Alert Level remained at 3 (on a scale of 1-4) and the public was warned to stay 3 km away from the summit crater and 4 km away from the crater on the SE flank.
Source: Pusat Vulkanologi dan Mitigasi Bencana Geologi (PVMBG, also known as CVGHM)
PVMBG reported that the Strombolian eruption at Lewotolok continued during 2-9 August. Daily white or white-and-gray emissions rose as high as 400 m above the summit and drifted in multiple directions. Photos in some posted reports showed Strombolian activity. The Alert Level remained at 3 (on a scale of 1-4) and the public was warned to stay 3 km away from the summit crater and 4 km away from the crater on the SE flank.
Source: Pusat Vulkanologi dan Mitigasi Bencana Geologi (PVMBG, also known as CVGHM)
PVMBG reported that the eruption at Lewotolok continued during 20-26 July. Daily white or white-and-gray emissions rose as high as 500 m above the summit and drifted in multiple directions. Photos in some posted reports showed Strombolian activity at the active vent. The Alert Level remained at 3 (on a scale of 1-4) and the public was warned to stay 3 km away from the summit crater and 4 km away from the crater on the SE flank.
Source: Pusat Vulkanologi dan Mitigasi Bencana Geologi (PVMBG, also known as CVGHM)
PVMBG reported that the eruption at Lewotolok continued during 12-19 July. Daily white or white-and-gray emissions rose as high as 800 m above the summit and drifted in multiple directions. Photos in some posted reports showed Strombolian activity from the crater. The Alert Level remained at 3 (on a scale of 1-4) and the public was warned to stay 3 km away from the summit crater and 4 km away from the crater on the SE flank.
Source: Pusat Vulkanologi dan Mitigasi Bencana Geologi (PVMBG, also known as CVGHM)
PVMBG reported that the eruption at Lewotolok continued during 6-12 July. Daily white-and-gray or white, gray, and black emissions rose as high as 700 m above the summit and drifted in multiple directions. Photos in posted reports showed Strombolian activity from the crater. The Alert Level remained at 3 (on a scale of 1-4) and the public was warned to stay 3 km away from the summit crater and 4 km away from the crater on the SE flank.
Source: Pusat Vulkanologi dan Mitigasi Bencana Geologi (PVMBG, also known as CVGHM)
PVMBG reported that the eruption at Lewotolok continued during 28 June-5 July. Daily white-and-gray or white, gray, and black emissions rose as high as 1.3 km above the summit and drifted NW, W, and SW. Photos posted in reports showed Strombolian activity from the crater. The Alert Level remained at 3 (on a scale of 1-4) and the public was warned to stay 3 km away from the summit crater and 4 km away from the crater on the SE flank.
Source: Pusat Vulkanologi dan Mitigasi Bencana Geologi (PVMBG, also known as CVGHM)
PVMBG reported that the eruption at Lewotolok continued during 22-28 June. An eruptive event was recorded at 2235 on 24 June by the seismic network, though the event was not visually observed. The Alert Level remained at 3 (on a scale of 1-4) and the public was warned to stay 3 km away from the summit crater, and 3.5 and 4 km away from the crater on the SE flank and E and NE flanks, respectively.
Source: Pusat Vulkanologi dan Mitigasi Bencana Geologi (PVMBG, also known as CVGHM)
PVMBG reported that the eruption at Lewotolok continued during 14-22 June. An eruptive event at 1501 on 16 June produced a white-to-gray ash plume that rose about 700 m above the summit and drifted W and NW. Another event at 1127 on 17 June generated a dense gray ash plume that rose about 1 km and drifted W. The Alert Level remained at 3 (on a scale of 1-4) and the public was warned to stay 3 km away from the summit crater, and 3.5 and 4 km away from the crater on the SE flank and E and NE flanks, respectively.
Source: Pusat Vulkanologi dan Mitigasi Bencana Geologi (PVMBG, also known as CVGHM)
PVMBG reported that the eruption at Lewotolok continued during 8-14 June. Daily white-and-gray emissions rose as high as 1 km above the summit and drifted in multiple directions. The summit crater was often incandescent, and a 200-m-long lava flow was active W of the summit. The Alert Level remained at 3 (on a scale of 1-4) and the public was warned to stay 3 km away from the summit crater and 4 km away from the crater on the SE flank.
Source: Pusat Vulkanologi dan Mitigasi Bencana Geologi (PVMBG, also known as CVGHM)
PVMBG reported that the eruption at Lewotolok continued during 1-7 June. Daily white-and-gray emissions rose as high as 1.3 km above the summit and drifted in multiple directions. The summit crater was often incandescent, and the lava flow on the E flank was incandescent during 1-4 June, based on photos in the reports. The Alert Level remained at 3 (on a scale of 1-4) and the public was warned to stay 3 km away from the summit crater and 4 km away from the crater on the SE flank.
Source: Pusat Vulkanologi dan Mitigasi Bencana Geologi (PVMBG, also known as CVGHM)
PVMBG reported that the eruption at Lewotolok continued during the month of May. White, gray, and black plumes rose as high as 1.2 km above the summit crater, and white-and-gray plumes rose 100-500 m. Lava flows were active on the crater floor. On 31 May lava flow breached the E crater rim and traveled 500 m E, towards the Jontona Village, located 4 km E of the summit. The Alert Level remained at 3 (on a scale of 1-4) and the public was warned to stay 3 km away from the summit crater.
Source: Pusat Vulkanologi dan Mitigasi Bencana Geologi (PVMBG, also known as CVGHM)
PVMBG reported that the eruption at Lewotolok continued during 17-24 May. Daily white steam plumes were visible rising 50-800 m above the summit and drifted multiple directions. White-and-gray emissions were visible on 19 and 21 May rose as high as 500 m above the summit and drifted SE, W, and NW. The Alert Level remained at 3 (on a scale of 1-4) and the public was warned to stay 3 km away from the summit crater and 4 km away from the crater on the SE flank.
Source: Pusat Vulkanologi dan Mitigasi Bencana Geologi (PVMBG, also known as CVGHM)
PVMBG reported that the eruption at Lewotolok continued during 10-17 May. An increase in gas emissions along with continuing ash emissions was observed on 14 and 17 May. The ash emissions rose to 1-2.4 km above the summit and drifted W, N, and NE. The Alert Level remained at 3 (on a scale of 1-4) and the public was warned to stay 3 km away from the summit crater and 4 km away from the crater on the SE flank.
Source: Pusat Vulkanologi dan Mitigasi Bencana Geologi (PVMBG, also known as CVGHM)
PVMBG reported that the eruption at Lewotolok continued during 4-10 May. Eruptive events at 1245 on 4 May and 0544 on 6 May produced ash plumes that rose 600 m above the summit and drifted W. The Alert Level remained at 3 (on a scale of 1-4) and the public was warned to stay 3 km away from the summit crater and 4 km away from the crater on the SE flank.
Source: Pusat Vulkanologi dan Mitigasi Bencana Geologi (PVMBG, also known as CVGHM)
PVMBG reported that the eruption at Lewotolok continued during 26 April-4 May. Daily white-and-gray ash plumes rose 50-600 m above the summit and drifted in multiple directions. Images of the volcano showed incandescent material being ejected above the crater rim. The Alert Level remained at 3 (on a scale of 1-4) and the public was warned to stay 3 km away from the summit crater and 4 km away from the crater on the SE flank.
Source: Pusat Vulkanologi dan Mitigasi Bencana Geologi (PVMBG, also known as CVGHM)
PVMBG reported that the eruption at Lewotolok continued during 19-26 April. Daily white-and-gray ash plumes rose 50-400 m above the summit and drifted W, NW, and E. The Alert Level remained at 3 (on a scale of 1-4) and the public was warned to stay 3 km away from the summit crater and 4 km away from the crater on the SE flank.
Source: Pusat Vulkanologi dan Mitigasi Bencana Geologi (PVMBG, also known as CVGHM)
PVMBG reported that the eruption at Lewotolok continued during 12-19 April. Daily white-and-gray ash plumes rose as high as 50-500 m above the summit and drifted W, NW, and E. The Alert Level remained at 3 (on a scale of 1-4) and the public was warned to stay 3 km away from the summit crater and 4 km away from the crater on the SE flank.
Source: Pusat Vulkanologi dan Mitigasi Bencana Geologi (PVMBG, also known as CVGHM)
The eruption at Lewotolok continued during 5-12 April according to PVMBG. Daily white-and-gray ash plumes with variable densities rose as high as 500 m above the summit and drifted E, NW, and W. Photos posted by PVMBG showed nighttime crater incandescence and incandescent material being ejected. The Alert Level remained at 3 (on a scale of 1-4) and the public was warned to stay 3 km away from the summit crater.
Source: Pusat Vulkanologi dan Mitigasi Bencana Geologi (PVMBG, also known as CVGHM)
The eruption at Lewotolok continued during 25-31 March according to PVMBG. White-and-gray emissions rose 50-500 m above the summit and drifted W and NW. Ash emissions rose 200-500 m above the summit. On 31 March at 1204 an ash plume rose 800 m above the summit and drifted NW according to a ground observer. The Alert Level remained at 3 (on a scale of 1-4) and the public was warned to stay 3 km away from the summit crater.
Source: Pusat Vulkanologi dan Mitigasi Bencana Geologi (PVMBG, also known as CVGHM)
The eruption at Lewotolok continued during 15-22 March according to PVMBG. Almost daily white-and-gray ash plumes rose as high as 600 m above the summit and drifted in multiple directions. Crater incandescence, lava effusion, and rumbling sounds were reported on most days. The Alert Level remained at 3 (on a scale of 1-4) and the public was warned to stay 3 km away from the summit crater and 4 km away from the crater on the SE flank.
Source: Pusat Vulkanologi dan Mitigasi Bencana Geologi (PVMBG, also known as CVGHM)
The eruption at Lewotolok continued during 8-15 March according to PVMBG. Daily white-and-gray ash plumes rose as high as 1 km above the summit and drifted E, W, and NW. Crater incandescence, lava effusion, and rumbling sounds were reported during 7-10 March. The Alert Level remained at 3 (on a scale of 1-4) and the public was warned to stay 3 km away from the summit crater and 4 km away from the crater on the SE flank.
Source: Pusat Vulkanologi dan Mitigasi Bencana Geologi (PVMBG, also known as CVGHM)
PVMBG reported that the eruption at Lewotolok continued during 15-19 February. Daily white-and-gray ash plumes rose as high as 600 m above the summit and drifted E, W, and NW. The Alert Level remained at 3 (on a scale of 1-4) and the public was warned to stay 3 km away from the summit crater and 4 km away from the crater on the SE flank.
Source: Pusat Vulkanologi dan Mitigasi Bencana Geologi (PVMBG, also known as CVGHM)
PVMBG reported that the eruption at Lewotolok continued during 8-15 February. Daily white-and-gray ash plumes rose as high as 1.2 km above the summit and drifted E and W. Incandescent material was ejected 300-350 m in multiple directions, and rumbling and weak banging noises were heard. The Alert Level remained at 3 (on a scale of 1-4) and the public was warned to stay 3 km away from the summit crater and 4 km away from the crater on the SE flank.
Source: Pusat Vulkanologi dan Mitigasi Bencana Geologi (PVMBG, also known as CVGHM)
PVMBG reported that the eruption at Lewotolok continued during 1-7 February, though weather conditions sometimes prevented visual confirmation. Rumbling and weak banging noises were heard throughout the week. Crater incandescence from active lava effusion was periodically observed. White, gray, and black ash plumes rose 100-400 m above the summit during 3-4 and 6-8 February. Incandescent material was ejected 300 m SE during 7-8 February. The Alert Level remained at 3 (on a scale of 1-4) and the public was warned to stay 3 km away from the summit crater and 4 km away from the crater on the SE flank.
Source: Pusat Vulkanologi dan Mitigasi Bencana Geologi (PVMBG, also known as CVGHM)
PVMBG reported that white-and-gray ash plumes from Lewotolok rose 200 m above the summit and drifted E and SE during 30-31 January. The Alert Level remained at 3 (on a scale of 1-4) and the public was warned to stay 3 km away from the summit crater.
Source: Pusat Vulkanologi dan Mitigasi Bencana Geologi (PVMBG, also known as CVGHM)
PVMBG reported that the eruption at Lewotolok continued during 11-16 January. Ash plumes rose as high as 700 m above the summit and drifted E, SE, and W during 11-14 January. Incandescent material ejected up to 300-700 m SE from the vent was accompanied by rumbling and banging noises. Eruption noises persisted through 16 January but weather prevented visual confirmation of activity during 15-16 January. The Alert Level remained at 3 (on a scale of 1-4) and the public was warned to stay 3 km away from the summit crater.
Source: Pusat Vulkanologi dan Mitigasi Bencana Geologi (PVMBG, also known as CVGHM)
PVMBG reported that the eruption at Lewotolok continued during 5-10 January. Variable density white-and-gray ash plumes rose as high as 600 m above the summit and drifted E and SE. Incandescent material was occasionally ejected up to 300 m from the vent and accompanied by rumbling. At 0848 on 11 January an ash plume rose 700 m above the volcano and drifted E. The Alert Level remained at 3 (on a scale of 1-4) and the public was warned to stay 3 km away from the summit crater.
Source: Pusat Vulkanologi dan Mitigasi Bencana Geologi (PVMBG, also known as CVGHM)
PVMBG reported that the eruption at Lewotolok continued during 31 December 2021 to 4 January 2022. White-and-gray ash plumes that were sometimes dense rose as high as 600 m above the summit. Incandescent material was occasionally ejected from the vent up to 300 m from the vent and rumbling was sometimes heard. The Alert Level remained at 3 (on a scale of 1-4) and the public was warned to stay 3 km away from the summit crater.
Source: Pusat Vulkanologi dan Mitigasi Bencana Geologi (PVMBG, also known as CVGHM)
PVMBG reported that the eruption at Lewotolok continued during 21-25 December. White-and-gray ash plumes that were sometimes dense rose as high as 600 m above the summit. Incandescent material was ejected from the vent up to 300 m in multiple directions. Rumbling, roaring, and booming were often heard. The Alert Level remained at 3 (on a scale of 1-4) and the public was warned to stay 3 km away from the summit crater.
Source: Pusat Vulkanologi dan Mitigasi Bencana Geologi (PVMBG, also known as CVGHM)
PVMBG reported that the eruption at Lewotolok continued during 14-21 December. White, gray, and black ash plumes that were sometimes dense rose as high as 1 km above the summit. Incandescent material was ejected from the vent up to 300 m often to the E and SE, but sometimes in all directions. Rumbling and booming sounds were often heard. The Alert Level remained at 3 (on a scale of 1-4) and the public was warned to stay 3 km away from the summit crater.
Source: Pusat Vulkanologi dan Mitigasi Bencana Geologi (PVMBG, also known as CVGHM)
PVMBG reported that the eruption at Lewotolok continued during 8-14 December. Daily white-and-gray ash plumes that were sometimes dense rose as high as 700 m above the summit, though weather conditions prevented visual confirmation during 11-12 December. Incandescent material was ejected from the vent up to 300 m during 7-11 December, and was accompanied by faint rumbling. The Alert Level remained at 3 (on a scale of 1-4) and the public was warned to stay 3 km away from the summit crater.
Source: Pusat Vulkanologi dan Mitigasi Bencana Geologi (PVMBG, also known as CVGHM)
PVMBG reported that the eruption at Lewotolok continued during 1-7 December. Daily white-and-gray ash plumes that were sometimes dense rose as high as 800 m above the summit. Incandescent material was ejected from the vent on most days, and up to 300 m during 6-7 December, accompanied by roaring and rumbling. The Alert Level remained at 3 (on a scale of 1-4) and the public was warned to stay 3 km away from the summit crater.
Source: Pusat Vulkanologi dan Mitigasi Bencana Geologi (PVMBG, also known as CVGHM)
PVMBG reported that the eruption at Lewotolok continued during 24-30 November. Daily white-and-gray ash plumes rose as high as 1 km above the summit. Crater incandescence was visible each day, with eruptions accompanied by rumbling and roaring sounds. Incandescent material was ejected 300-500 m E and SE from the vent during 24-25 November. The Alert Level remained at 3 (on a scale of 1-4) and the public was warned to stay 3 km away from the summit crater.
Source: Pusat Vulkanologi dan Mitigasi Bencana Geologi (PVMBG, also known as CVGHM)
PVMBG reported that the eruption at Lewotolok continued during 17-23 November. White-and-gray plumes that were sometimes dense rose as high as 2 km above the summit. Incandescent material was ejected 200 m E from the vent during 19-20 November. Crater incandescence was visible during 22-23 November. The Alert Level remained at 3 (on a scale of 1-4) and the public was warned to stay 3 km away from the summit crater.
Source: Pusat Vulkanologi dan Mitigasi Bencana Geologi (PVMBG, also known as CVGHM)
PVMBG reported that the eruption at Lewotolok continued during 26 October-2 November. White-and-gray plumes rose as high as 1 km above the summit and drifted in multiple directions. Rumbling and banging noises were heard daily. Crater incandescence was visible on 28 October and incandescent material was ejected 100-200 m from the vent on 29 October and 1 November. The Alert Level remained at 3 (on a scale of 1-4) and the public was warned to stay 3 km away from the summit crater.
Source: Pusat Vulkanologi dan Mitigasi Bencana Geologi (PVMBG, also known as CVGHM)
PVMBG reported that the eruption at Lewotolok continued during 20-26 October. White-and-gray plumes generally rose as high as 600 m above the summit and drifted in multiple directions. The Alert Level remained at 3 (on a scale of 1-4) and the public was warned to stay 3 km away from the summit crater.
Source: Pusat Vulkanologi dan Mitigasi Bencana Geologi (PVMBG, also known as CVGHM)
PVMBG reported that the eruption at Lewotolok continued during 13-19 October. White, gray, and black plumes generally rose as high as 1 km above the summit and drifted in multiple directions. Rumbling and banging sounds were reported almost daily. Incandescent material was ejected most days as far as 100 m from the vent and as high as 300 m above the vent. The Alert Level remained at 3 (on a scale of 1-4) and the public was warned to stay 3 km away from the summit crater.
Source: Pusat Vulkanologi dan Mitigasi Bencana Geologi (PVMBG, also known as CVGHM)
PVMBG reported that the eruption at Lewotolok continued during 6-12 October. White-and-gray plumes generally rose as high as 800 m above the summit and drifted in multiple directions. A VONA stated that on 7 October and ash plume rose 1.9 km above the summit and drifted W. Rumbling and banging sounds were reported daily. Incandescent material was ejected daily as far as 300 m away from the vent in multiple directions, though during 5-6 October incandescent material was ejected as far as 1 km SE. BNPB noted that 25-26 eruptive events per day were sometimes recorded before activity increased in October. The Alert Level remained at 3 (on a scale of 1-4) and the public was warned to stay 3 km away from the summit crater.
Sources: Pusat Vulkanologi dan Mitigasi Bencana Geologi (PVMBG, also known as CVGHM); Badan Nacional Penanggulangan Bencana (BNPB)
PVMBG reported that the eruption at Lewotolok continued during 28 September-4 October. White-and-gray plumes rose as high as 800 m above the summit and drifted NW, W, and SW. Rumbling sounds were reported almost daily. During 30 September-1 October and 3-4 October incandescent material was ejected as far as 700 m away from the vent in multiple directions. The Alert Level remained at 3 (on a scale of 1-4) and the public was warned to stay 3 km away from the summit crater.
Source: Pusat Vulkanologi dan Mitigasi Bencana Geologi (PVMBG, also known as CVGHM)
PVMBG reported that the eruption at Lewotolok continued during 21-28 September. White-and-gray plumes rose as high as 700 m above the summit and drifted NW, W, and SW. Rumbling sounds were reported almost daily. The Alert Level remained at 3 (on a scale of 1-4) and the public was warned to stay 3 km away from the summit crater.
Source: Pusat Vulkanologi dan Mitigasi Bencana Geologi (PVMBG, also known as CVGHM)
PVMBG reported that the eruption at Lewotolok continued during 7-14 September. White-and-gray plumes rose as high as 700 m above the summit and drifted NWW, SW, and S. The Alert Level remained at 3 (on a scale of 1-4) and the public was warned to stay 3 km away from the summit crater.
Source: Pusat Vulkanologi dan Mitigasi Bencana Geologi (PVMBG, also known as CVGHM)
PVMBG reported that the eruption at Lewotolok continued during 31 August-7 September. White and gray plumes rose as high as 600 m above the summit and drifted W and NW. Rumbling and banging were heard on most days. Incandescent material was ejected 300 m on 1 September, as far as 1 km SE during 4-5 September, and 200 m during 6-7 September. The Alert Level remained at 3 (on a scale of 1-4) and the public was warned to stay 3 km away from the summit crater.
Source: Pusat Vulkanologi dan Mitigasi Bencana Geologi (PVMBG, also known as CVGHM)
PVMBG reported that the eruption at Lewotolok continued during 25-30 August. White, gray, and sometimes black plumes rose as high as 1.2 km above the summit and drifted W and NW. The Alert Level remained at 3 (on a scale of 1-4) and the public was warned to stay 3 km away from the summit crater.
Source: Pusat Vulkanologi dan Mitigasi Bencana Geologi (PVMBG, also known as CVGHM)
PVMBG reported that daily white, gray, and sometimes black plumes from Lewotolok rose 50-1,500 m above the summit and drifted SW, NW, and W during 18-24 August. Eruptive activity on 18 and 22 August generated an ash plume that rose 1 and 1.5 km above the summit, respectively, both of which drifted W. Material was ejected as far as 500 m SE on 18 August. On 22 August at 1244 an ash plume was reported 1.5 km above the summit and drifted generally W. The Alert Level remained at 3 (on a scale of 1-4) and the public was warned to stay 3 km away from the summit crater.
Source: Pusat Vulkanologi dan Mitigasi Bencana Geologi (PVMBG, also known as CVGHM)
PVMBG reported that the Strombolian eruption at Lewotolok continued during 11-17 August. White, gray, and sometimes black plumes rose as high as 2 km above the summit and drifted S, NW, and W during 10-12 August. Incandescent lava was ejected 200-350 m radially on 10 August, accompanied by banging noises. Ash plumes rose 100-300 m during 13-17 August and drifted NE and W. Incandescence from the SW part of the crater was visible during 15-16 August. The Alert Level remained at 3 (on a scale of 1-4) and the public was warned to stay 3 km away from the summit crater.
Source: Pusat Vulkanologi dan Mitigasi Bencana Geologi (PVMBG, also known as CVGHM)
PVMBG reported that the Strombolian eruption at Lewotolok continued during 3-10 August. Daily white, gray, and sometimes black plumes rose as high as 1.5 km above the summit and drifted in multiple directions. Banging noises associated with eruptions were reported almost daily. The Alert Level remained at 3 (on a scale of 1-4) and the public was warned to stay 3 km away from the summit crater.
Source: Pusat Vulkanologi dan Mitigasi Bencana Geologi (PVMBG, also known as CVGHM)
PVMBG reported that the Strombolian eruption at Lewotolok continued during 27 July-2 August. Daily white, gray, and black plumes rose as high as 1 km above the summit and drifted in multiple directions. At 0023 on 28 July an eruptive event accompanied by a loud bang ejected incandescent lava 700-800 m from the crater. At 0722 another event ejected incandescent lava 1 km SE. Vegetated areas on the S and SW flanks caught fire, which quickly spread to the SE and W flanks due to dry conditions, burning forest as far as 2 km from the crater. At 0840 on 30 July lava was again ejected 1 km SE and loud rumbling was reported. By the morning of 30 July, the fire on the flanks was less intense and declining, but remained active at least through 1 August. Banging noises were reported on 31 July and 2 August. The Alert Level remained at 3 (on a scale of 1-4) and the public was warned to stay 3 km away from the summit crater.
Sources: Pusat Vulkanologi dan Mitigasi Bencana Geologi (PVMBG, also known as CVGHM); Badan Nacional Penanggulangan Bencana (BNPB)
PVMBG reported that daily white-and-gray plumes from Lewotolok rose as high as 800 m and drifted in multiple directions during 20-25 July. The Alert Level remained at 3 (on a scale of 1-4) and the public was warned to stay 3 km away from the summit crater.
Source: Pusat Vulkanologi dan Mitigasi Bencana Geologi (PVMBG, also known as CVGHM)
PVMBG reported that daily white-and-gray plumes from Lewotolok rose as high as 1 km and drifted W, NW, NE, and E during 13-20 July. Rumbling was heard daily. Incandescent material was ejected as far as 1 km from the summit vent in various directions during 16-18 July. The Alert Level remained at 3 (on a scale of 1-4) and the public was warned to stay 3 km away from the summit crater.
Source: Pusat Vulkanologi dan Mitigasi Bencana Geologi (PVMBG, also known as CVGHM)
PVMBG reported that daily white-and-gray plumes from Lewotolok rose as high as 1.1 km and drifted SW, W, and NW during 6-12 July. Incandescent material was ejected from the summit vent on 6, 8, and 10 July; on 6 July material landed as far as 300 m away. The Darwin VAAC noted that on 7 July an ash plume rose 2.7 km (9,000 ft) a.s.l. and drifted E, based on satellite data and information from PVMBG. The Alert Level remained at 3 (on a scale of 1-4) and the public was warned to stay 3 km away from the summit crater.
Sources: Pusat Vulkanologi dan Mitigasi Bencana Geologi (PVMBG, also known as CVGHM); Darwin Volcanic Ash Advisory Centre (VAAC)
PVMBG reported that daily white-and-gray plumes from Lewotolok rose as high as 1 km and drifted in multiple directions during 29 June-6 July. Incandescent material was ejected from the summit vent in various directions during 2-5 July; on 3 July material landed as far as 1 km SW and started vegetation fires. On 5 July an ash plume rose 1 km and drifted SE. The Alert Level remained at 3 (on a scale of 1-4) and the public was warned to stay 3 km away from the summit crater.
Source: Pusat Vulkanologi dan Mitigasi Bencana Geologi (PVMBG, also known as CVGHM)
PVMBG reported that daily white-and-gray plumes from Lewotolok during 22-29 June rose as high as 600 m and drifted W. The Alert Level remained at 3 (on a scale of 1-4) and the public was warned to stay 3 km away from the summit crater.
Source: Pusat Vulkanologi dan Mitigasi Bencana Geologi (PVMBG, also known as CVGHM)
PVMBG reported that white-and-gray plumes from Lewotolok rose as high as 1 km and drifted W and NW daily during 16-22 June. Incandescent material was ejected as high as 500 m above the summit and 300-500 m away from the vent in multiple directions almost daily. The Alert Level remained at 3 (on a scale of 1-4) and the public was warned to stay 3 km away from the summit crater.
Source: Pusat Vulkanologi dan Mitigasi Bencana Geologi (PVMBG, also known as CVGHM)
PVMBG reported that white-and-gray plumes from Lewotolok rose as high as 800 m and drifted W and E almost daily during 9-15 June. Incandescent material was ejected 200-500 m SE during 8-10 June. The Alert Level remained at 3 (on a scale of 1-4) and the public was warned to stay 3 km away from the summit crater.
Source: Pusat Vulkanologi dan Mitigasi Bencana Geologi (PVMBG, also known as CVGHM)
PVMBG reported that white-and-gray plumes from Lewotolok rose as high as 500 m and drifted W and E almost daily during 1-8 June. Rumbling was heard every day. Crater incandescence was visible during 1 and 3-4 June. Incandescent material was ejected as far as 300 m in all directions during 3-4 June and as far as 1 km NW during 5-6 June. The Alert Level remained at 3 (on a scale of 1-4) and the public was warned to stay 3 km away from the summit crater.
Source: Pusat Vulkanologi dan Mitigasi Bencana Geologi (PVMBG, also known as CVGHM)
PVMBG reported that white-and-gray plumes from Lewotolok rose as high as 1 km and drifted W and E during 27-28 and 30-31 May. Rumbling was sometimes heard. Crater incandescence was visible on 31 May. The Alert Level remained at 3 (on a scale of 1-4) and the public was warned to stay 3 km away from the summit crater.
Source: Pusat Vulkanologi dan Mitigasi Bencana Geologi (PVMBG, also known as CVGHM)
PVMBG reported that white-and-gray plumes from Lewotolok rose as high as 800 m and drifted W and E during 18-24 May. Rumbling was heard almost daily. Crater incandescent was visible on 18 May and on 22 May incandescent material was ejected 400-700 m to the SE. The Alert Level remained at 3 (on a scale of 1-4) and the public was warned to stay 3 km away from the summit crater.
Source: Pusat Vulkanologi dan Mitigasi Bencana Geologi (PVMBG, also known as CVGHM)
PVMBG reported that white-and-gray plumes from Lewotolok rose as high as 600 m and drifted W and NW during 12-17 May. Incandescent material was ejected 100-300 m above the summit during 14-16 May and 300 m SE on 15 May. Rumbling and thumping sounds were heard during 14-17 May. The Alert Level remained at 3 (on a scale of 1-4) and the public was warned to stay 3 km away from the summit crater.
Source: Pusat Vulkanologi dan Mitigasi Bencana Geologi (PVMBG, also known as CVGHM)
PVMBG reported that mostly white plumes from Lewotolok rose as high as 600 m and drifted SE, W, and NW during 4-11 May. Gray-and-white plumes rose 500 m and drifted W, NW, and SE on 6 and 8 May. The Alert Level remained at 3 (on a scale of 1-4) and the public was warned to stay 3 km away from the summit crater.
Source: Pusat Vulkanologi dan Mitigasi Bencana Geologi (PVMBG, also known as CVGHM)
PVMBG reported that white plumes from Lewotolok rose as high as 500 m and drifted SE, SW, and W on most days during 27 April-3 May. Gray-and-white plumes rose 500 m and drifted W on 30 April and 2 May. The Alert Level remained at 3 (on a scale of 1-4) and the public was warned to stay 3 km away from the summit crater.
Source: Pusat Vulkanologi dan Mitigasi Bencana Geologi (PVMBG, also known as CVGHM)
PVMBG reported that the eruption at Lewotolok continued during 20-27 April. Black, gray, and white plumes rose as high as 1 km above the summit and drifted E, SE, and W on most days. The Alert Level remained at 3 (on a scale of 1-4) and the public was warned to stay 3 km away from the summit crater.
Source: Pusat Vulkanologi dan Mitigasi Bencana Geologi (PVMBG, also known as CVGHM)
PVMBG reported that the eruption at Lewotolok continued during 13-19 April. Gray-and-white ash plumes rose as high as 1.5 km above the summit and drifted E and W. Rumbling was often audible. Incandescent material was ejected 300-1,000 m above the summit during 14-16 April. Incandescent material was ejected to the E during 9 and 11-12 April. The Alert Level remained at 3 (on a scale of 1-4) and the public was warned to stay 4 km away from the summit crater.
Source: Pusat Vulkanologi dan Mitigasi Bencana Geologi (PVMBG, also known as CVGHM)
PVMBG reported that the Strombolian eruption at Lewotolok continued during 6-13 April. Gray-and-white ash plumes rose as high as 750 m above the summit and drifted in multiple directions. Incandescent material was ejected 300-500 m above the summit on most days and 500 m SE on 8 April. Incandescent material was ejected to the E during 9 and 11-12 April. Rumbling was occasionally audible. The Alert Level remained at 3 (on a scale of 1-4) and the public was warned to stay 4 km away from the summit crater.
Source: Pusat Vulkanologi dan Mitigasi Bencana Geologi (PVMBG, also known as CVGHM)
PVMBG reported that the Strombolian eruption at Lewotolok continued during 30 March-6 April. Gray-and-white ash plumes rose as high as 700 m above the summit and drifted in multiple directions, though rainy weather conditions prevented visual observations during 2-3 and 5 April. Incandescent material was ejected 300-500 m above the summit and 500 m SE during 30-31 March; eruptive events were recorded by the seismic network on the other days but not visually confirmed. Rumbling was occasionally noted. According to news articles secondary lahars from Cyclone Seroja destroyed homes, and impacted as many as 300, in several villages to the SW; mud-and-debris flows and flooding severely impacted other parts of Indonesia and killed at least 70 people. The Alert Level remained at 3 (on a scale of 1-4) and the public was warned to stay 4 km away from the summit crater.
Sources: Pusat Vulkanologi dan Mitigasi Bencana Geologi (PVMBG, also known as CVGHM); Reuters; South China Morning Post
PVMBG reported that the Strombolian eruption at Lewotolok continued during 24-30 March. Daily gray-and-white ash plumes rose as high as 800 m above the summit and drifted in different directions. Incandescent material was ejected 500 m above the summit on 23, 27, and 30 March, and 300 m above the summit on 25 March. On 26 and 28 March incandescence was observed up to 100 m above the summit, accompanied by incandescent ejecta as far as 350 m to the SE. The eruptive events were accompanied by rumbling and banging sounds. The Alert Level remained at 3 (on a scale of 1-4) and the public was warned to stay 3 km away from the summit crater.
Source: Pusat Vulkanologi dan Mitigasi Bencana Geologi (PVMBG, also known as CVGHM)
PVMBG reported that the Strombolian eruption at Lewotolok continued during 17-23 March. Daily gray-and-white ash plumes rose as high as 700 m above the summit and drifted mainly E and SE. Incandescent material was ejected 300 m E of the summit on 20 March. The next day incandescent material was ejected 100 m above the summit and as far as 200 m E. On 22 March explosions ejected incandescent material 250-350 m SE. The eruptive events were accompanied by rumbling and banging sounds. The Alert Level remained at 3 (on a scale of 1-4) and the public was warned to stay 4 km away from the summit crater.
Source: Pusat Vulkanologi dan Mitigasi Bencana Geologi (PVMBG, also known as CVGHM)
PVMBG reported that the Strombolian eruption at Lewotolok continued during 10-16 March. Daily gray-and-white ash plumes rose as high as 1.5 km above the summit and drifted mainly E and SE. The eruptive events were accompanied by rumbling and banging sounds. Visual observations were hindered by weather on 10 March; each day during 11-16 March incandescent material was ejected as high as 500 m above the crater. Almost daily incandescent material was ejected 500-1,300 m E and SE from the crater. The Alert Level remained at 3 (on a scale of 1-4) and the public was warned to stay 4 km away from the summit crater.
Source: Pusat Vulkanologi dan Mitigasi Bencana Geologi (PVMBG, also known as CVGHM)
PVMBG reported that the eruption at Lewotolok continued during 3-9 March; weather conditions sometimes hindered visual observations. Gray-and-white ash plumes rose 100-1,000 m above the summit and drifted E, SE, SW, and W. Incandescent material was ejected 300-800 m SE from the crater during 3-6 March. Rumbling and occasional thumping sounds were reported. The Alert Level remained at 3 (on a scale of 1-4) and the public was warned to stay 4 km away from the summit crater.
Source: Pusat Vulkanologi dan Mitigasi Bencana Geologi (PVMBG, also known as CVGHM)
PVMBG reported that the eruption at Lewotolok continued during 24 February-2 March; weather conditions sometimes hindered visual observations. Gray-and-white ash plumes rose 100-700 m above the summit and drifted N, E, SE, and W. The Alert Level remained at 3 (on a scale of 1-4) and the public was warned to stay 4 km away from the summit crater.
Source: Pusat Vulkanologi dan Mitigasi Bencana Geologi (PVMBG, also known as CVGHM)
PVMBG reported that the eruption at Lewotolok continued during 16-23 February; weather conditions sometimes hindered visual observations. Gray-and-white ash plumes rose 50-500 m above the summit and drifted E and SE. The Alert Level remained at 3 (on a scale of 1-4) and the public was warned to stay 4 km away from the summit crater.
Source: Pusat Vulkanologi dan Mitigasi Bencana Geologi (PVMBG, also known as CVGHM)
PVMBG reported that the eruption at Lewotolo continued during 9-15 February. Gray-and-white ash plumes rose 400-1,000 m above the summit and drifted E and SE. Strombolian explosions ejected material 500 m SE on 13 February. The Alert Level remained at 3 (on a scale of 1-4) and the public was warned to stay 4 km away from the summer crater.
Source: Pusat Vulkanologi dan Mitigasi Bencana Geologi (PVMBG, also known as CVGHM)
PVMBG reported that the eruption at Lewotolo continued during 3-9 February. Gray-and-white ash plumes rose 200-700 m above the summit and drifted E and SE. During 5-9 February Strombolian explosions ejected material 100-350 m above the summit and incandescent material was ejected 300-500 m SE from the crater. Rumbling and occasional banging sounds were reported. The Alert Level remained at 3 (on a scale of 1-4) and the public was warned to stay 4 km away from the summit crater.
Source: Pusat Vulkanologi dan Mitigasi Bencana Geologi (PVMBG, also known as CVGHM)
PVMBG reported that the eruption at Lewotolo continued at least during 26-28 January. Gray-and-white ash plumes rose 500 m above the summit and drifted E, SE, and W. Strombolian explosions ejected material 500 m above the summit, and incandescent material was ejected as far as 500-600 m SE from the crater. Rumbling was reported during 29-30 January; weather conditions prevented visual observations of the crater during 29 January-2 February. The Alert Level remained at 3 (on a scale of 1-4) and the public was warned to stay 4 km away from the summit crater.
Source: Pusat Vulkanologi dan Mitigasi Bencana Geologi (PVMBG, also known as CVGHM)
PVMBG reported that a Strombolian eruption at Lewotolo continued during 19-26 January. Gray-and-white ash plumes rose 200-1,000 m above the summit daily and drifted E, SE, and W. Rumbling sounds were occasionally reported. Strombolian explosions ejected material 100-600 m above the summit, and incandescent material was sometimes ejected as far as 500 m E, SE, and W from the crater. The Alert Level remained at 3 (on a scale of 1-4) and the public was warned to stay 4 km away from the summit crater.
Source: Pusat Vulkanologi dan Mitigasi Bencana Geologi (PVMBG, also known as CVGHM)
PVMBG reported that a Strombolian eruption at Lewotolo continued during 13-19 January. Gray-and-white ash plumes rose 200-700 m above the summit daily and rumbling sounds were reported. Strombolian explosions ejected material 100-500 m above the summit, and incandescent material was ejected as far as 1.5 km SE from the crater. The Alert Level remained at 3 (on a scale of 1-4) and the public was warned to stay 4 km away from the summit crater.
Source: Pusat Vulkanologi dan Mitigasi Bencana Geologi (PVMBG, also known as CVGHM)
PVMBG reported that a Strombolian eruption at Lewotolo continued during 6-12 January. Gray-and-white ash plumes rose 200-700 m above the summit and rumbling and banging sounds were reported. Incandescent material was ejected as far as 700 m SE from the crater during 6-8 January. Strombolian explosions ejected material 100-200 m above the summit crater on 7 January. The Alert Level remained at 3 (on a scale of 1-4) and the public was warned to stay 4 km away from the summit crater.
Source: Pusat Vulkanologi dan Mitigasi Bencana Geologi (PVMBG, also known as CVGHM)
PVMBG reported that a Strombolian eruption at Lewotolo continued during 30 December-5 January. Gray-and-white ash plumes were visible daily, rising as high as 1 km above the summit. Rumbling and banging sounds were reported almost daily, and incandescent material was ejected as far as 1 km SE from the crater during 30-31 December and 4-5 January. Strombolian explosions ejected material 100-200 m above the summit crater during 1-5 January. The Alert Level was remained at 3 (on a scale of 1-4) and the public was warned to stay 4 km away from the summit crater.
Sources: Pusat Vulkanologi dan Mitigasi Bencana Geologi (PVMBG, also known as CVGHM); Badan Nacional Penanggulangan Bencana (BNPB)
PVMBG reported that the eruption at Lewotolo continued during 23-29 December. Gray-and-white ash plumes were visible daily, rising as high as 1 km above the summit. Strombolian explosions were visible most nights ejecting material 100-300 m above the summit crater. Rumbling and banging noises were reported. Incandescent material was ejected as far as 1 km from the crater to the E and SE during 24-25 and 27-29 December. The Alert Level remained at 3 (on a scale of 1-4) and the public was warned to stay 4 km away from the summit crater.
Source: Pusat Vulkanologi dan Mitigasi Bencana Geologi (PVMBG, also known as CVGHM)
PVMBG reported that the eruption at Lewotolo continued during 16-22 December. Gray-and-white ash plumes were visible daily, rising as high as 800 m above the summit. Strombolian explosions were visible most nights ejecting material 100-200 m above the summit crater. Rumbling was heard most days. The Alert Level was remained at 3 (on a scale of 1-4) and the public was warned to stay 4 km away from the summit crater.
Source: Pusat Vulkanologi dan Mitigasi Bencana Geologi (PVMBG, also known as CVGHM)
PVMBG reported that the eruption at Lewotolo continued during 9-15 December. Black, gray, and brown ash plumes were visible daily, rising as high as 1 km above the summit. Strombolian explosions were visible most nights ejecting material above the summit crater. The Alert Level was remained at 3 (on a scale of 1-4) and the public was warned to stay 4 km away from the summit crater.
Source: Pusat Vulkanologi dan Mitigasi Bencana Geologi (PVMBG, also known as CVGHM)
PVMBG reported that the eruption at Lewotolo continued during 1-8 December. Black-and-gray ash plumes were visible daily, rising as high as 1.5 km abo e the summit. Incandescence at the summit was visible nightly and material was sometimes ejected as high as 20 m above the summit. BNPB noted that by 5 December there were a total of 9,028 people housed in 11 evacuation centers. The Alert Level was remained at 3 (on a scale of 1-4) and the public was warned to stay 4 km away from the summit crater.
Sources: Pusat Vulkanologi dan Mitigasi Bencana Geologi (PVMBG, also known as CVGHM); Badan Nacional Penanggulangan Bencana (BNPB)
According to PVMBG continuous tremor at Lewotolo began to be recorded at 1943 on 26 November, and a series of volcanic earthquakes began at 1947. A new eruption started at 0557 on 27 November, producing dense blackish gray ash plumes that rose 500 m above the summit and drifted W. Incandescence at the summit was visible, and the emissions turned white around 0630. Seismicity slightly decreased after the eruption, though continuous tremor persisted for a period of time. Dense white plumes rose as high as 400 m and nighttime incandescence was noted during 27-28 November.
During the morning of 29 November seismicity again increased, characterized by six deep volcanic earthquakes; continuous tremor appeared around 0930. At 0945 a 10-minute eruption sent dense gray-to-black ash plumes 4 km above the summit that drifted W and NW at lower heights and SE and E near the top of the plume. Ashfall was reported in several surrounding villages and video posted on social media showed tephra falling on roofs in residential areas. According to BNPB, Badan Penanggulangan Bencana Daerah (BPBD) evacuated almost 4,500 residents from 26 villages to seven evacuation centers. At 1300, the Alert Level was raised to 3 (on a scale of 1-4) and the public was warned to stay 4 km away from the summer crater.
Ash plumes continued to rise on at least six more occasions, and around 1900 Strombolian activity was visible. A pungent sulfur odor was noted at the Lewotolo observation post. Satellite data showed that a sulfur dioxide plume had drifted over the N half of Australia by 30 November. Ash plumes continued to be emitted during 30 November-1 December, with dense white-and-gray ash plumes rising 700-2,000 m above the summit. Lava flows near the summit were visible and incandescent material traveled down the flanks.
Sources: Pusat Vulkanologi dan Mitigasi Bencana Geologi (PVMBG, also known as CVGHM); Badan Nacional Penanggulangan Bencana (BNPB); Advanced geospatial Data Management Platform (ADAM)
PVMBG reported that white plumes rose as high as 50 m above Lewotolo’s summit crater rim. The Alert Level remained at 2 (on a scale of 1-4).
Source: Pusat Vulkanologi dan Mitigasi Bencana Geologi (PVMBG, also known as CVGHM)
The number of shallow and deep volcanic earthquakes at Lewotolo recently increased, prompting PVMBG to raise the Alert Level from 1 to 2 (on a scale of 1-4) on 7 October. The report noted that the public should not enter the 2-km-radius exclusion zone around the crater. Solfatara emissions rose as high as 500 m above the crater rim on 9 October; emissions during 1 August-6 October rose 50-600 m. BNPB reported that five earthquakes recorded by Badan Meteorologi, Klimatologi, dan Geofisika (BMKG) on 10 October ranged in magnitude between 3.9 and 4.9, and were located 10-30 km below Lewotolo. The events were felt by local populations, causing an evacuation of 723 people. Preliminary data suggested that five homes were damaged from rock avalanches, triggered by the earthquakes.
Sources: Pusat Vulkanologi dan Mitigasi Bencana Geologi (PVMBG, also known as CVGHM); Badan Nacional Penanggulangan Bencana (BNPB)
On 25 January CVGHM lowered the Alert Level for Lewotolo from 3 to 2 (on a scale of 1-4) based on decreased seismicity and visual observations during 5-15 January. During 5-15 January fumarolic plumes rose 200-500 m above the summit and incandescence was observed.
Source: Pusat Vulkanologi dan Mitigasi Bencana Geologi (PVMBG, also known as CVGHM)
According to news articles, 500 people have evacuated their homes on 6 January because of increased activity at Lewotolo. Black smoke rose from the crater and rumbling sounds were reported. On 2 January CVGHM raised the Alert Level from 2 to 3 (on a scale of 1-4).
Sources: BNO News; Jakarta Globe
CVGHM reported that white plumes rose 50-250 m above the summit of Lewotolo during the month of December. Seismicity increased on 31 December and intensified on 2 January, the same day incandescence was observed. Based on visual and seismic observations, CVGHM raised the Alert Level from 1 to 2 (on a scale of 1-4) on 2 January, then later that day raised the Alert Level to 3.
Source: Pusat Vulkanologi dan Mitigasi Bencana Geologi (PVMBG, also known as CVGHM)
DVGHM stated that the pilot report of a plume emitted from Lewotolo on 25 June was false. Further investigation revealed that the emission was actually from Egon.
Source: Pusat Vulkanologi dan Mitigasi Bencana Geologi (PVMBG, also known as CVGHM)
A pilot reported that a thin plume emitted from Lewotolo was at a height of ~300 m above the summit on 25 July. Ash was not visible on satellite imagery.
Source: Darwin Volcanic Ash Advisory Centre (VAAC)
Reports are organized chronologically and indexed below by Month/Year (Publication Volume:Number), and include a one-line summary. Click on the index link or scroll down to read the reports.
December 2011-January 2012 seismicity, incandescence, and evacuations
Plumes and seismic activity at Lewotolo volcano, Indonesia, increased during December 2011 and early January 2012. Lewotolo has erupted potassic calc-alkaline lavas containing as an accessary phase in vessicle fillings, the rare, complex zirconium-titanium-oxide mineral zirconolite (Ca0.8 Ce0.2 Zr Ti1.5 Fe2+0.3 Nb0.1 Al0.1 O7; de Hoog and van Bergen, 2000). Lewotolo last erupted in 1951. All historical eruptions were small (Volcanic Explosivity Index, VEI 2) with the exception of the first recorded eruption, which took place in 1660 and was as large as VEI 3. According to de Hoog and van Bergen (2000), strong fumarolic activity at the summit of Lewotolo indicates the presence and degassing of a shallow magma chamber.
December 2011-January 2012 activity increase. According to the Center of Volcanology and Geological Hazard Mitigation (CVGHM), Lewotolo produced thick white plumes reaching 50-250 m above the summit during December 2011. Seismicity increased on 31 December, and intensified on 2 January 2012 with tremor commencing at 1400. Accordingly, CVGHM raised the Alert Level from 1 to 2 (on a scale from 1-4) at 1800 on 2 January. Between 1800 and 2300 the same day, the maximum amplitude of recorded seismicity increased, and at 2000, incandescence was noticed at the summit.
At 2330 on 2 January, CVGHM increased the Alert Level to 3. Under the recommendation of CVGHM, access was prohibited within 2 km of Lewotolo (Hazard Zone III, figure 1), and residents in villages SE of the volcano were advised to keep vigilant and secure a safe place to flee to one of the towns to the N, W, or S in the event of an eruption.
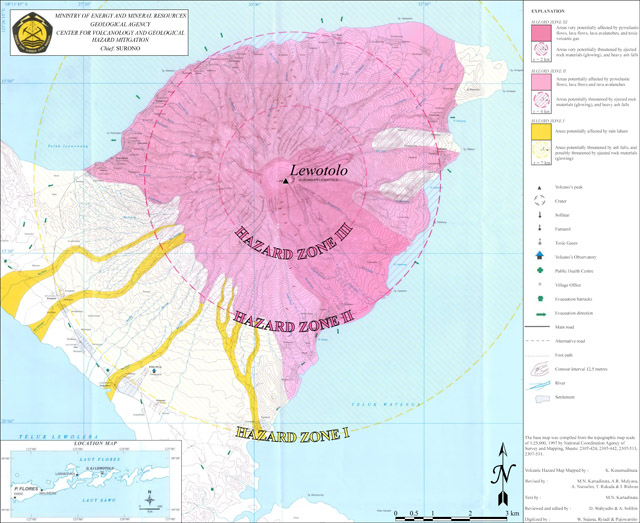 |
Figure 1. Map of areas around Lewotolo showing Hazards Zones I-III. Hazard Zone I includes areas possibly threatened by ash fall and incandescent bombs (within 7 km of Lewotolo, yellow dashed circle) and areas possibly affected by lahars (shaded yellow). Hazard Zone II includes areas possibly threatened by heavy ash-fall and incandescent bombs (within 4 km of Lewotolo, dark pink dashed circle) and areas possibly affected by pyroclastic flows, lava flows, and lava avalanches (shaded light pink). Hazard Zone III includes areas very likely to be threatened by heavy ash fall and incandescent bombs (within 2 km of Lewotolo, light pink dashed circle) and areas very likely to be affected by pyroclastic flows, lava flows, lava avalanches, and volcanic gases (shaded dark pink). Other symbols are explained in the legend at the right. Authorities prohibited access to Hazard Zone III on 2 January 2012. Modified from CVGHM. |
Residents decide to evacuate. According to Antara News, evacuations began on 4 January spurred by increased activity of the previous few days, as well as minor ash falling in the villages. Antara News stated that most of the residents went to Lewoleba, the closest city to the volcano (~15 km to the SW of the summit). Of the evacuees in Lewoleba, all but about 50 people were reported to have found temporary housing with other residents of the city.
On 5 January, Channel 6 News reported that around 500 residents had evacuated leaving their homes in villages surrounding Lewotolo. They noted that residents who evacuated did so on their own accord, as the government had not yet called for evacuation. The Deputy District Chief of Lembata, Viktor Mado Watun, said "Black smoke columns are coming out of the mountain's crater, the air is filled with the smell of sulfur while rumbling sounds are heard around the mountain."
According to UCA News on 9 January, the health of the evacuees was cause for concern. Father Philipus da Gomez stated that "there are many refugees who have started suffering from acute respiratory infections."
Alert Level lowered. On 25 January 2012, CVGHM lowered the Alert Level of Lewotolo from 3 to 2 following decreased activity after 2 January. The lowered Alert Level restricted access to the summit craters only. CVGHM stated that the observed seismicity (table 1) showed a declining trend, tending towards normal conditions after 23 January. Visual observation revealed thick, white plumes reaching 400 m above the summit during 2-14 January (and a dim crater glow), and thin white plumes reaching no more than 50 m above the summit during 16-24 January (with no accompanying crater glow).
Table 1. Seismicity at Lewotolo during 3-24 January 2012, showing a declining trend in seismicity prior to CVGHM's lowering of the Alert Level from 3-2 on 25 January. Data courtesy of CVGHM.
| Dates | Hot-air blasts (avg./day) | Shallow volcanic | Deep volcanic | Local tectonic | Distant tectonic |
| 03-07 Jan 2012 | 368 | 107 | 28 | 14 | 7 |
| 08-12 Jan 2012 | 349 | 4 | 5 | 2 | 2 |
| 13-17 Jan 2012 | 346 | 3 | -- | 3 | -- |
| 18-22 Jan 2012 | 314 | -- | 1 | 7 | 3 |
| 23-24 Jan 2012 | 308 | -- | -- | 4 | 1 |
On 15 January, direct observation of the crater was made, and revealed incandescence in solfataras, a weak sulfur smell, and hissing sounds in both the N and S side of the crater. CVGHM especially noted that the N side of the crater was quite different than when it was last observed in June 2010, when no solfataras were present. Differential Optical Absorption Spectroscopy (DOAS) measurements revealed fluctuating and increasing SO2 flux between 11-90 tons/day during 8-16 January.
References. de Hoog, J.C.M. and van Bergen, M.J., 2000, Volatile-induced transport of HFSE, REE, Th, and U in arc magmas: evidence from zirconolite-bearing vesicles in potassic lavas of Lewotolo volcano (Indonesia), Contributions to Mineralogy and Petrology, v. 139, no. 4, p. 485-502 (DOI: 10.1007/s004100000146).
Information Contacts: Center for Volcanology and Geological Hazard Mitigation (CVGHM), Jl. Diponegoro 57, Bandung, West Java, Indonesia, 40 122 (URL: http://www.vsi.esdm.go.id/); Channel 6 News (URL: http://channel6newsonline.com/); Antara News, Wisma ANTARA 19th Floor, Jalan Merdeka Selatan No. 17, Jakarta Pusat (URL: http://www.antaranews.com/); UCA News, Yayasan UCINDO, Gedung Usayana Holding, Lt.3, Jl. Matraman Raya No.87, Jakarta Timur 13140 (URL: http://www.ucanews.com/).
Thermal hotspots during 27 September-4 October 2015
During December 2011-January 2012, Lewotolo's seismic activity increased and the volcano produced thick, white plumes that rose as high as 250 m above the summit before subsiding (BGVN 36:12). Since that episode, no further activity was observed through 31 December 2016, except for several thermal anomalies during 27 September 2015-4 October 2015, as recorded by MODIS satellite instruments analyzed using the MODVOLC algorithm (figure 2).
 |
Figure 2. The MODIS/MODVOLC composite image that indicates the location of thermal anomalies at Lewotolo between 27 September and 4 October 2015. One is N of the summit (27 September), the others are somewhat E. One of the two hotspots on 4 October appears on the E summit rim. The daily thermal alert maps indicated that the five hotspots were all weak. |
Information Contacts: Hawai'i Institute of Geophysics and Planetology (HIGP), MODVOLC Thermal Alerts System, School of Ocean and Earth Science and Technology (SOEST), Univ. of Hawai'i, 2525 Correa Road, Honolulu, HI 96822, USA (URL: http://modis.higp.hawaii.edu/, http://modis.higp.hawaii.edu/).
New eruption in late November 2020 consisting of ash plumes, crater incandescence, and ashfall
Lewotolok (also known as Lewotolo) is located on the eastern end of a peninsula connected to Lembata (formerly Lomblen) that extends north into the Flores Sea. Eruptions date back to 1660, characterized by explosive activity in the summit crater. Typical activity has consisted of seismicity and thermal anomalies near the summit crater (BGVN 36:12 and 41:09). A new eruption that began in late November 2020 was characterized by increased seismicity, dense, gray ash plumes, nighttime crater incandescence, and ashfall. This report covers activity through January 2021 using information primarily from the Pusat Vulkanologi dan Mitigasi Bencana Geologi (PVMBG, also known as CVGHM, or the Center of Volcanology and Geological Hazard Mitigation), MAGMA Indonesia, and satellite data.
Summary of activity during February 2012-October 2020. Activity from February 2012 to November 2020 was relatively low and consisted primarily of a persistent thermal anomaly in the summit crater since at least March 2016 and occasional white gas-and-steam emissions. During January 2012 intermittent white gas-and-steam plumes rose 15-500 m above the crater, accompanied by crater incandescence; no thermal anomalies were reported during 16-24 January. On 6 January there were 500 people in the Lembata district evacuated due to reports of ash plumes that were observed by local residents, the smell of sulfur, and the sound of rumbling (BGVN 36:12).
Thermal activity dates back to 13 October 2014 using MODIS data in MODVOLC satellite data (BGVN 41:09; figure 3). According to the MODVOLC algorithm, a total of seven thermal alerts were detected on 13 October 2014 (1), 27 September 2015 (1), 2, 3, and 4 (2) October 2015, and 5 November 2017 (1). The number of thermal alerts in both MODVOLC and Sentinel-2 satellite data had increased slightly in 2020 compared to 2018 and 2019, though cloud cover often prevented visual confirmation for the latter (figure 3). Sentinel-2 thermal satellite imagery captured occasional thermal anomalies in the summit crater during 2016-2019 (figure 4). White gas-and-steam plumes were intermittently reported from September 2017 through 2 March 2018 that rose as high as 500 m above the crater and drifted dominantly E and W, according to PVMBG.
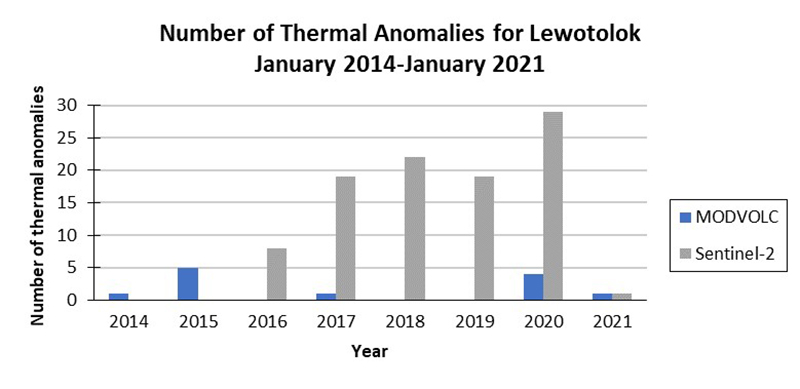 |
Figure 3. Graph comparing the number of thermal anomalies using MODVOLC alerts and Sentinel-2 satellite data for Lewotolok during January 2014-January 2021 for MODVOLC and 20 March 2016-January 2021 for Sentinel-2 thermal satellite data. Data courtesy of HIGP - MODVOLC Thermal Alerts System and Sentinel Hub Playground. |
Brief seismicity, which included shallow and deep volcanic earthquakes was detected during October 2017. On 9 October 2017 PVMBG issued a VONA (Volcano Observatory Notice for Aviation) reporting that white gas-and-steam emissions rose 500 m above the crater. On 10 October BNPB (Badan Nacional Penanggulangan Bencana) reported that five earthquakes 10-30 km below Lewotolok and ranging in magnitude of 3.9-4.9 as recorded by Badan Meteorologi, Klimatologi, dan Geofisika (BMKG). These seismic events were felt by local populations and resulted in an evacuation of 723 people. The only activity reported between January 2018 and October 2020 was white gas-and-steam plumes that rose 5-100 m above the crater drifting primarily E and W and an occasional thermal anomaly in the summit crater (figure 4).
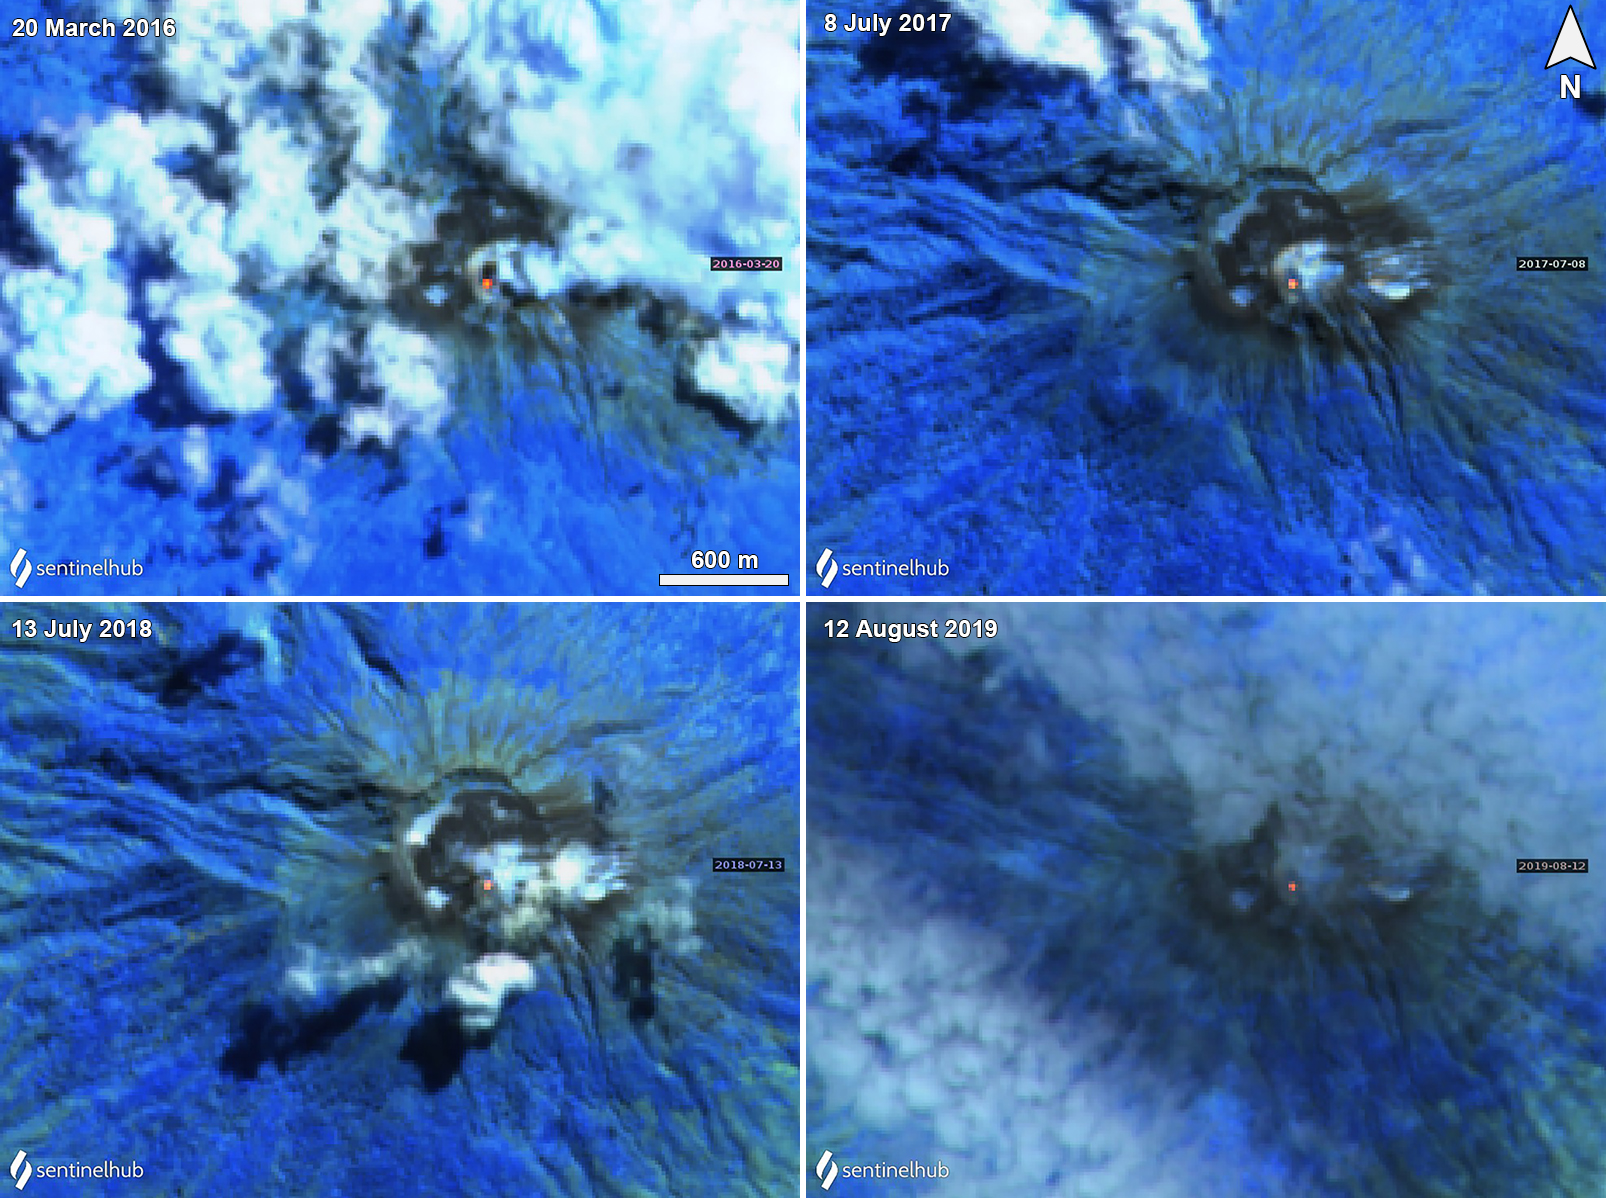 |
Figure 4. Sentinel-2 thermal satellite imagery shows a thermal anomaly in the summit crater of Lewotolok during 20 March 2016 (top left), 8 July 2017 (top right), 13 July 2018 (bottom left), and 12 August 2019 (bottom right). Sentinel-2 satellite images with “Atmospheric penetration” (bands 12, 11, 8A) rendering. Courtesy of Sentinel Hub Playground. |
New eruption starting in November 2020. On 26 November 2020 a continuous tremor began at 1943, followed by a series of volcanic earthquakes at 1947 and deep volcanic earthquakes at 1951, 1952, 1953, and 2255; white gas-and-steam emissions rose 20 m above the crater. Deep volcanic earthquakes were again recorded at 0242, 0537, 0556 on 27 November. At 0557 an explosion produced a gray ash plume that rose 500 m above the crater and drifted W; by 0630 the plume turned white, according to PVMBG (figure 5). Seismicity decreased slightly after the explosion, but tremor continued. During 27-28 November dense white gas-and-steam plumes rose as high as 500 m above the crater and nighttime crater incandescence was observed.
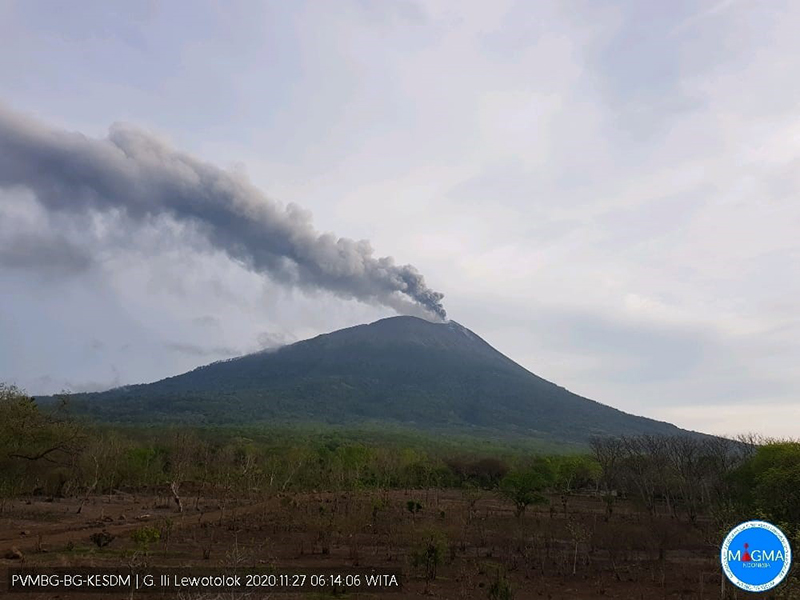 |
Figure 5. Webcam image of a dense gray ash plume rising 500 m above the crater of Lewotolok on 27 November 2020. Courtesy of MAGMA Indonesia. |
During the morning of 29 November seismicity increased again and consisted of six deep volcanic earthquakes, continuous tremor occurred around 0930. A second explosion was recorded at 0945 that produced an ash plume 4 km above the crater, accompanied by incandescent material that was ejected above the crater (figure 6). The ash plume consisted of two levels: the lower-level drifted W and NW and the upper-level drifted E and SE. The large, gray ash plume was captured in a satellite image as it spread generally E and W (figure 7). Ashfall and a sulfur odor was reported in several surrounding villages; videos from social media showed tephra falling onto the roofs of residential areas. BPBD evacuated residents in 28 villages in two sub-districts; by 29 November at 1300 about 900 people had been evacuated. At 1900 Strombolian activity was observed and during the night, crater incandescence was visible.
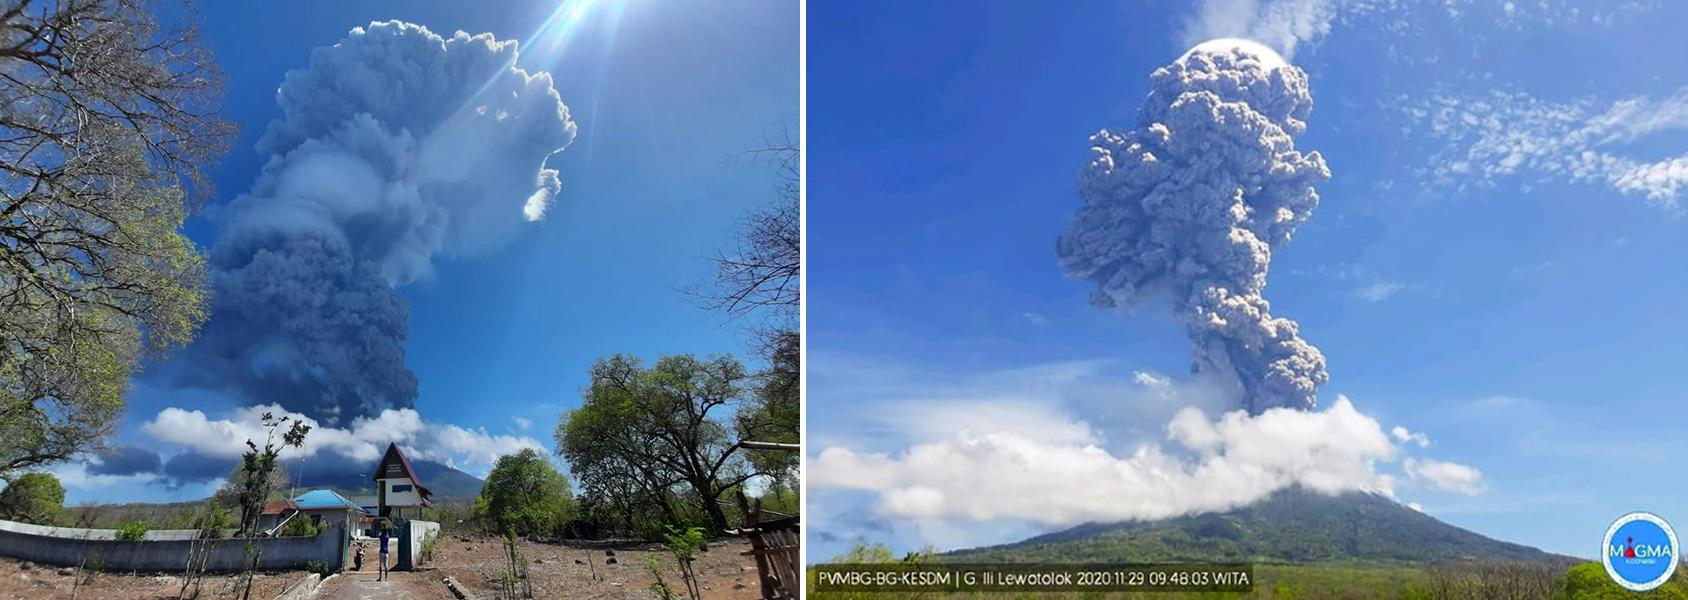 |
Figure 6. Photos of the eruption at Lewotolok on 29 November 2020 that produced a dense, gray ash plume 4 km above the crater. Courtesy of Devy Kamil Syahbana, PVMBG (left) and MAGMA Indonesia (right). |
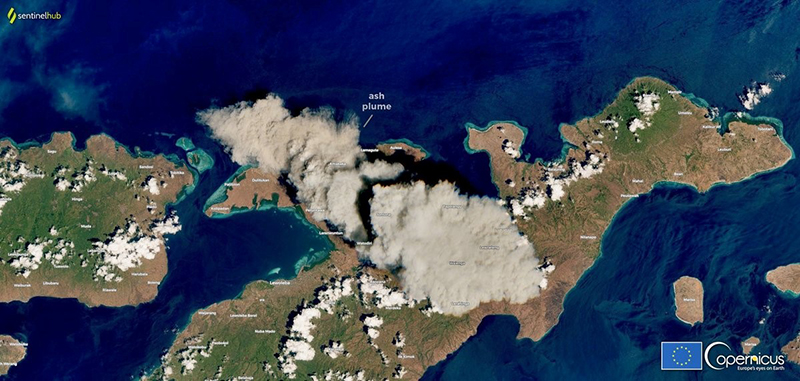 |
Figure 7. Satellite image showing a strong gray ash plume above Lewotolok on 29 November 2020, expanding roughly E and W. Courtesy of Sentinel Hub Playground and the European Space Agency, Copernicus. |
The eruption continued from 29 November into 1 December, where the white-and-gray ash plumes rose 700-2,000 m above the crater and drifted SE and W, accompanied by incandescent material that was ejected above the crater and the smell of sulfur, according to PVMBG (figure 8). A large sulfur dioxide plume was reported drifting SE and extending over the N half of Australia by 30 November (figure 9). By 1300 that day, 4,628 people had been evacuated. Incandescent lava flows near the summit were visible and incandescent material traveled down the flanks during 30 November and 1 December.
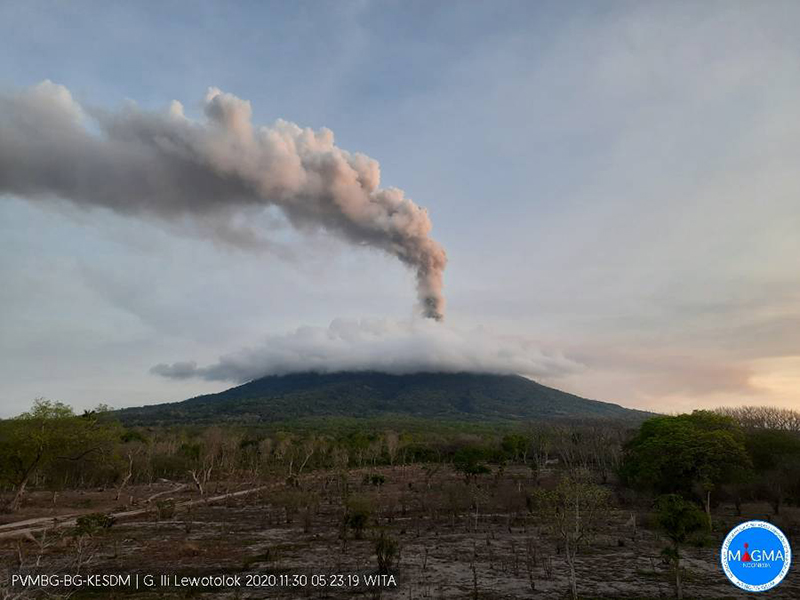 |
Figure 8. Webcam image of the continuous eruption at Lewotolok showing a dense gray ash plume rising above the cloud-covered summit on 30 November 2020. Courtesy of MAGMA Indonesia. |
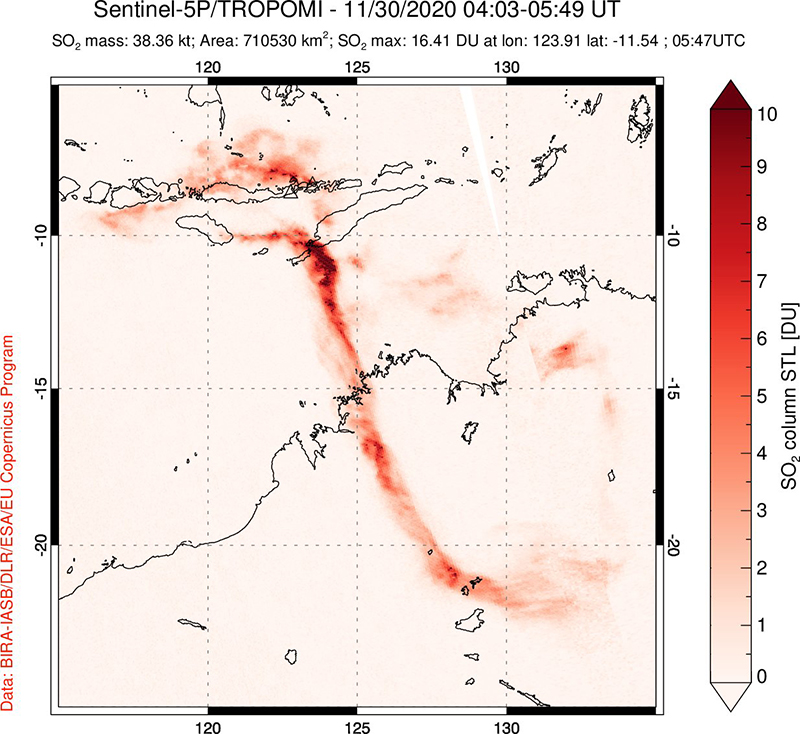 |
Figure 9. SO2 plume from Lewotolok captured by the Sentinel-5P/TROPOMI instrument on 30 November 2020 drifting SE and along the N part of Australia. Courtesy of Simon Carn and the NASA Global Sulfur Dioxide Monitoring Page. |
White-and-gray plumes continued frequently through January 2021, rising 100-1,500 m above the crater, drifting in multiple directions, accompanied by nighttime crater incandescence and occasional incandescent ejecta (figure 10). During 1-8 December gray plumes rose 100-1,000 m above the crater and drifted E, W, and SW accompanied by nightly crater incandescence and incandescent material ejected as high as 20 m above the crater. By 5 December at 2200 about 9,028 residents had been evacuated to 11 evacuation centers, according to BNPB. Black, gray, and brown ash plumes were visible daily during 9-15 December, rising 1 km above the crater, accompanied by nightly Strombolian explosions that ejected material above the crater. More Strombolian explosions on most nights over 16-29 December ejected material 100-300 m above the crater; in addition, the sounds of rumbling and banging could be heard. The material was deposited as far as 1 km from the crater E and SE during 24-25 and 27-31 December and 4-7 January 2021. Strombolian activity continued into January, accompanied by frequent gray-and-white ash plumes, rumbling and banging sounds, and incandescent ejecta up to 600 above the crater that extended as far as 500 m E, SE, and W. Crater incandescence was visible up to 600 m above the crater.
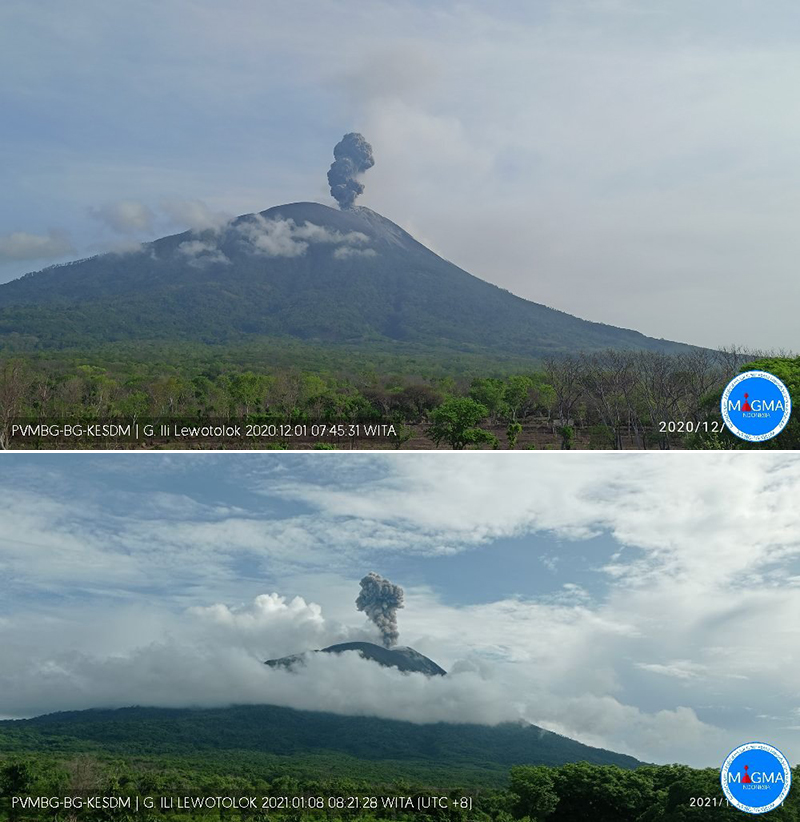 |
Figure 10. Webcam images showing continuing dense gray ash plumes from Lewotolok on 1 December 2020 (top) and 8 January 2021 (bottom). Courtesy of MAGMA Indonesia. |
A consistent level of thermal activity was recorded in the Sentinel-2 MODIS Thermal Volcanic Activity from February 2019 through October 2020; in early December 2020 a slight increase in thermal anomalies were detected (figure 11). This data reflects the start of the new eruption in late November 2020. According to the MODVOLC thermal algorithm, five thermal hotspots were detected between January 2020 and January 2021 on 3 September (1), 29 November (2), 24 December (1), and 5 January 2021 (1). Some of this thermal activity was also observed in Sentinel-2 thermal satellite imagery in the summit crater (figure 12).
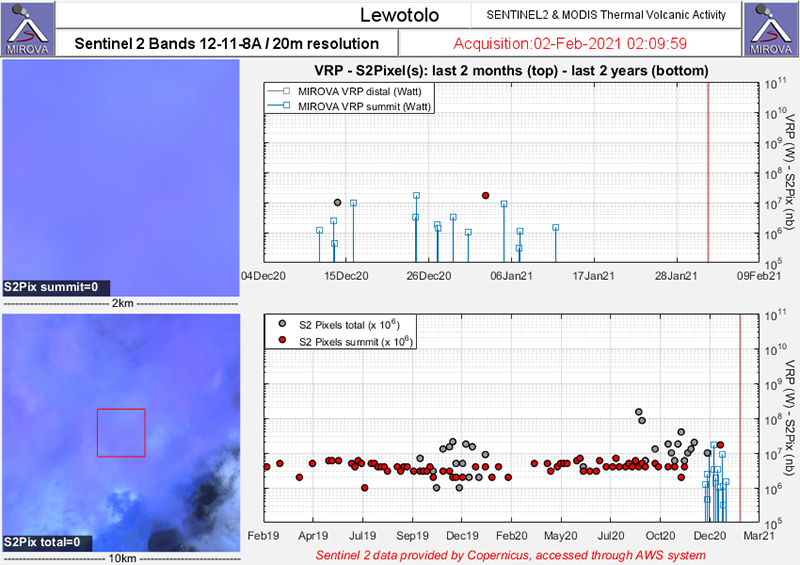 |
Figure 11. Sentinel-2 MODIS Thermal Volcanic Activity data (bands 12, 11, 8A) shows consistent thermal activity (red dots) at Lewotolok during February 2020 through December 2020. Stronger thermal anomalies in early December is likely due to the new eruption that began in late November 2020. Courtesy of MIROVA. |
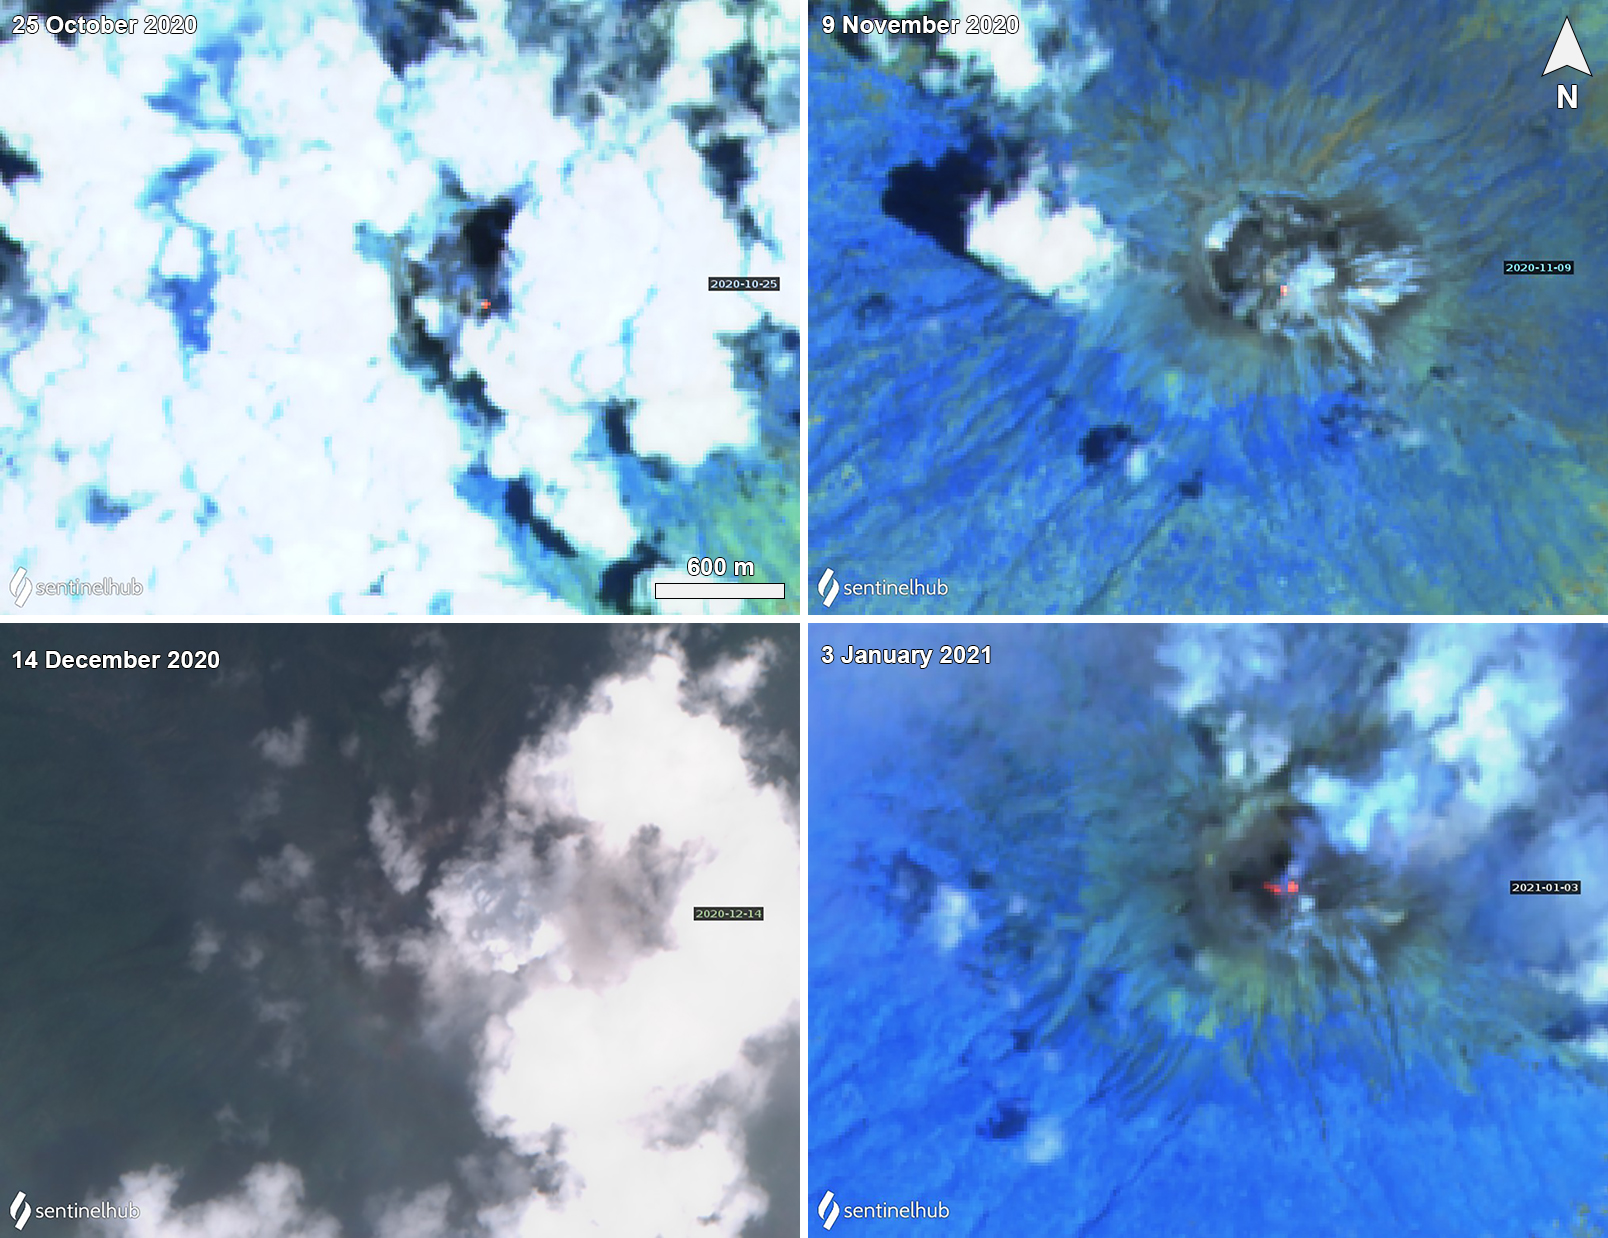 |
Figure 12. Sentinel-2 thermal satellite imagery showing a thermal anomaly in the summit crater of Lewotolok on 25 October (top left), 9 November (top right), and 3 January 2021 (bottom right). On 14 December (bottom left) a Natural Color image showed a gray ash emission above the clouds and drifted E. On 3 January 2021 (bottom right) two thermal anomalies were visible in the summit crater accompanied by gas-and-steam emissions drifting NE. Sentinel-2 satellite images with “Natural Color” rendering (bands 4, 3, 2) on 14 December 2020, all other images use “Atmospheric penetration” (bands 12, 11, 8A) rendering. Courtesy of Sentinel Hub Playground. |
Information Contacts: Pusat Vulkanologi dan Mitigasi Bencana Geologi (PVMBG, also known as Indonesian Center for Volcanology and Geological Hazard Mitigation, CVGHM), Jalan Diponegoro 57, Bandung 40122, Indonesia (URL: http://www.vsi.esdm.go.id/); Badan Nasional Penanggulangan Bencana (BNPB), National Disaster Management Agency, Graha BNPB - Jl. Scout Kav.38, East Jakarta 13120, Indonesia (URL: http://www.bnpb.go.id/); MAGMA Indonesia, Kementerian Energi dan Sumber Daya Mineral (URL: https://magma.vsi.esdm.go.id/); MIROVA (Middle InfraRed Observation of Volcanic Activity), a collaborative project between the Universities of Turin and Florence (Italy) supported by the Centre for Volcanic Risk of the Italian Civil Protection Department (URL: http://www.mirovaweb.it/); Hawai'i Institute of Geophysics and Planetology (HIGP) - MODVOLC Thermal Alerts System, School of Ocean and Earth Science and Technology (SOEST), Univ. of Hawai'i, 2525 Correa Road, Honolulu, HI 96822, USA (URL: http://modis.higp.hawaii.edu/); Sentinel Hub Playground (URL: https://www.sentinel-hub.com/explore/sentinel-playground); European Space Agency (ESA), Copernicus (URL: http://www.esa.int/Our_Activities/Observing_the_Earth/Copernicus); NASA Global Sulfur Dioxide Monitoring Page, Atmospheric Chemistry and Dynamics Laboratory, NASA Goddard Space Flight Center (NASA/GSFC), 8800 Greenbelt Road, Goddard, Maryland, USA (URL: https://so2.gsfc.nasa.gov/); Simon Carn, Dept of Geological and Mining Engineering and Sciences, Michigan Technological University, 1400 Townsend Dr., Houghton, MI 49931, USA (URL: https://so2.gsfc.nasa.gov/).
Ash plumes and frequent Strombolian activity during February-July 2021
A brief period of ash emissions in January 2012 was the first documented activity in over 50 years (BGVN 36:12) at Lewotolok (also known as Lewotolo), on the island of Lembata (Lomblen) in the Lesser Sunda Islands of Indonesia. Between then and November 2020, intermittent thermal activity was identified using MODVOLC and Sentinel-2 infrared data (BGVN 41:09, 46:02) and a single episode of increased seismicity was noted by PVMBG in October 2017. The only emissions reported were white steam and gas plumes rising up to 500 m above the summit crater. Increased seismicity at the end of November 2020 was accompanied by explosions with ash plumes and incandescent ejecta (BGVN 46:02) that resulted in ashfall and evacuations from surrounding communities. Explosions with ash emissions rising up to 1,500 m and incandescent ejecta rising 600 m above the crater were reported through the end of January 2021. This report covers similar explosive activity that continued from February-July 2021 with information provided by Pusat Vulkanologi dan Mitigasi Bencana Geologi (PVMBG, also known as CVGHM, or the Center of Volcanology and Geological Hazard Mitigation), MAGMA Indonesia, and satellite data.
Multiple daily explosions were reported throughout February-July 2021 except for a brief pause during late April and early May (figure 13). Multi-day periods of incandescent ejecta rising hundreds of meters above the summit and extending a similar distance from the crater continued in February and increased to near-daily during June and July; multiple episodes of ejecta fell 1 km from the crater rim. Dense gray and black ash plumes were infrequent in January and February but increased to multiple times a day in mid-March, rising 1,000-1,500 m above the summit; the highest plume of the period reached over 3 km above the summit on 13 June. Daily explosive activity with ash plumes and incandescent ejecta continued through the end of July. Thermal anomalies in MIROVA data indicated pulses of higher activity during March-early April and late June-July (figure 14). Satellite imagery provided thermal and visual evidence of fresh lava flow activity inside the summit crater on multiple occasions.
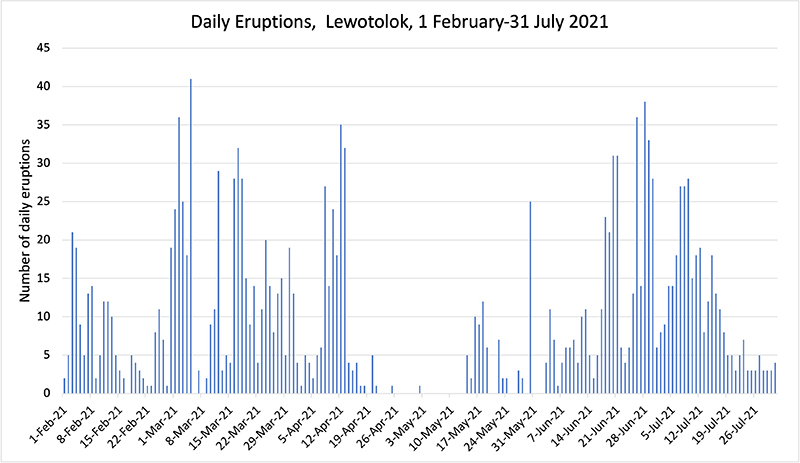 |
Figure 13. The number of daily explosions at Lewotolok during 1 February-31 July 2021 ranged from 0-41. Data compiled from PVMBG daily reports. |
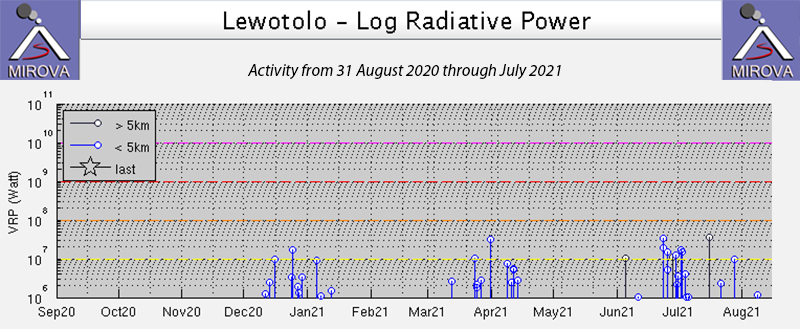 |
Figure 14. Periods of increased thermal activity at Lewotolok were recorded by the MIROVA project during December-2020-early January 2021, March-early April 2021, and late June-July 2021. Courtesy of MIROVA. |
Activity during February-April 2021. PVMBG reported daily white and gray emissions that rose 200-700 m above the summit, and occasionally higher, during February 2021. Explosions occurred virtually every day with a maximum of 21 reported on 3 February, but 5-10 per day were typical. During 5-9 February loud noises accompanied bursts of incandescent ejecta that rose 300 m above the summit and extended 300-500 m SE (figure 15). MAGMA Indonesia reported an eruption on 10 February that produced an ash plume that rose 700 m and drifted E (figure 16). Thermal anomalies appeared in satellite images on 7, 12, 17, and 22 February.
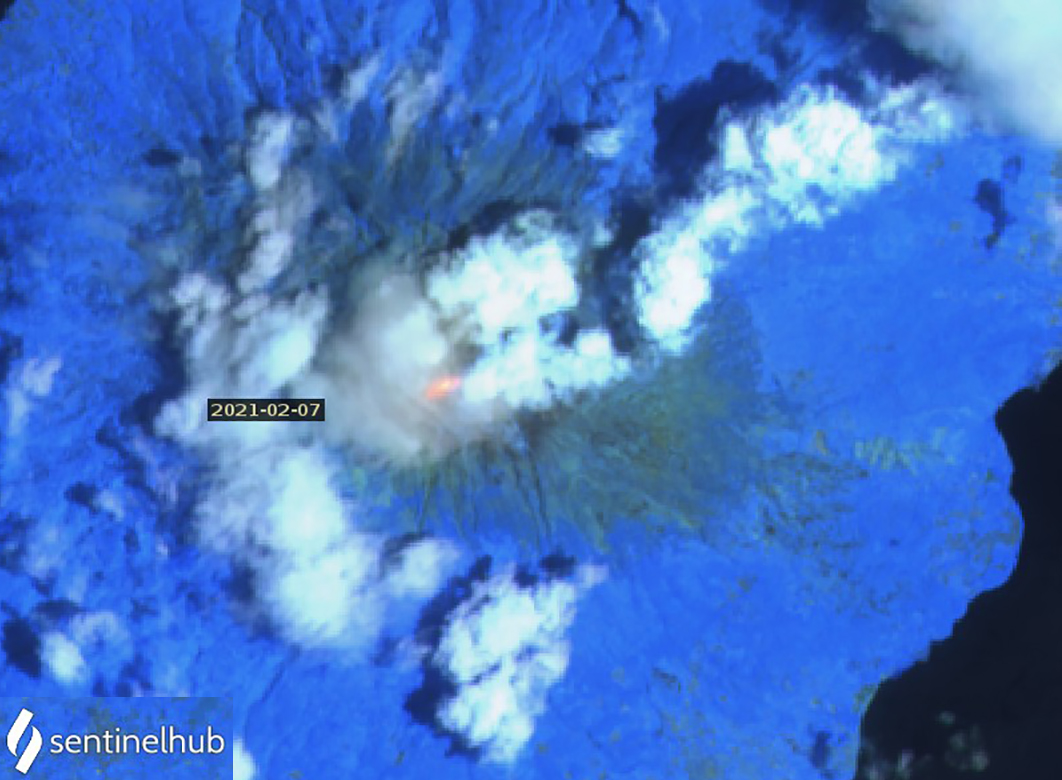 |
Figure 15. A strong thermal anomaly recorded at the summit of Lewotolok on 7 February 2021 was likely due to the incandescent ejecta reported by PVMBG that rose 300 m high and sent material 500 m SE. Sentinel-2 satellite imagery uses Atmospheric penetration rendering (bands 12, 11, 8a). Courtesy of Sentinel Hub Playground. |
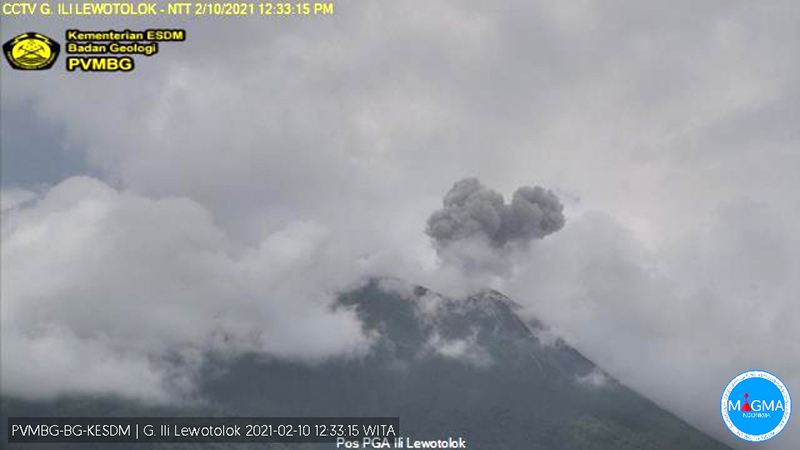 |
Figure 16. An ash plume rose 700 m above the summit of Lewotolok and drifted E on 10 February 2021. Courtesy of MAGMA Indonesia and PVMBG. |
The abrupt increase in the number of daily explosions at the beginning of March 2021 was accompanied by loud rumbling noises and observations of incandescent ejecta. During 2-5 March incandescent ejecta rose 200-800 m above the summit towards the SE. On 9 March the ejecta was reported 1,300 m E and SE of the summit. From 11-15 March the incandescent ejecta rose 500 m above the crater rim and was ejected as far as 1,000 m E and SE. The Darwin VAAC reported ash plumes on 13 and 14 March that drifted SW at 1.2 km altitude. MAGMA Indonesia reported two explosions, one on 14 March that rose 1,300 m above the summit and drifted S (figure 17) and one on 15 March that rose 1,000 m and drifted E. During 19-31 March there were 4-20 explosions each day that produced audible booms and rumbling; incandescent ejecta rose as high as 500 m and was thrown the same distance E and SE. Thermal anomalies at the center of the summit crater were apparent in Sentinel-2 satellite imagery on 4 and 19 March.
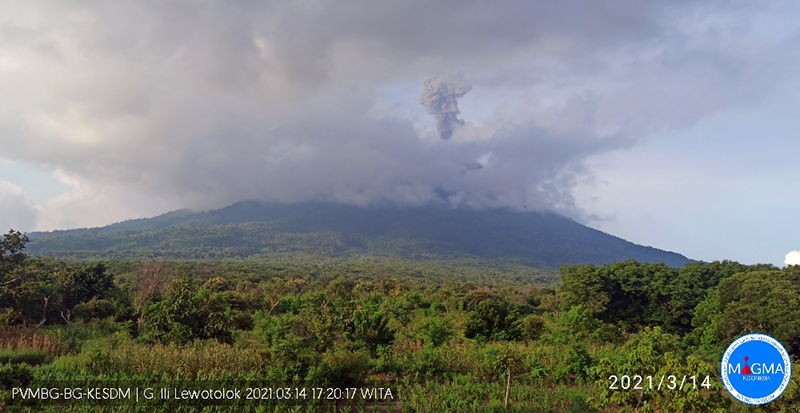 |
Figure 17. An explosion at Lewotolok on 14 March 2021 produced an ash plume that rose 1,300 m above the summit and drifted S. Courtesy of MAGMA Indonesia and PVMBG. |
Cloudy weather obscured views of the summit for several days in early April 2021, but during 5-17 April multiple daily explosions produced incandescent ejecta often reaching 500 m high, loud noises, and dense gray and black ash plumes (figure 18). Sentinel-2 imagery indicated thermal anomalies inside the summit crater likely caused by fresh lava flows on 8 April. The thermal anomalies and visual imagery from 13 April revealed a new dark area, still hot around the edges, that also likely represented fresh lava (figure 19). Ejecta reached 300-500 m E and SE of the summit during 8-12 April; on 16 April PVMBG reported incandescent ejecta 1,000 m above the summit. MAGMA Indonesia noted one to five eruptions each day during 12-18 April; dense white, gray, and black ash plumes rose 500-1,500 m above the summit and drifted W or SW most days. The Darwin VAAC reported ash emissions on 15 and 16 April which rose 400-700 m above the summit and drifted WNW, and a plume that rose to 3,000 m altitude (1,500 m above the summit) on 18 April and drifted W (figure 20). Additional explosions were reported on 20-21 and 24-25 April, producing gray and black ash plumes that rose 600-1,000 m above the summit. By 28 April only steam emissions were observed, and no thermal anomalies were present around the fresh dark flow visible inside the summit crater.
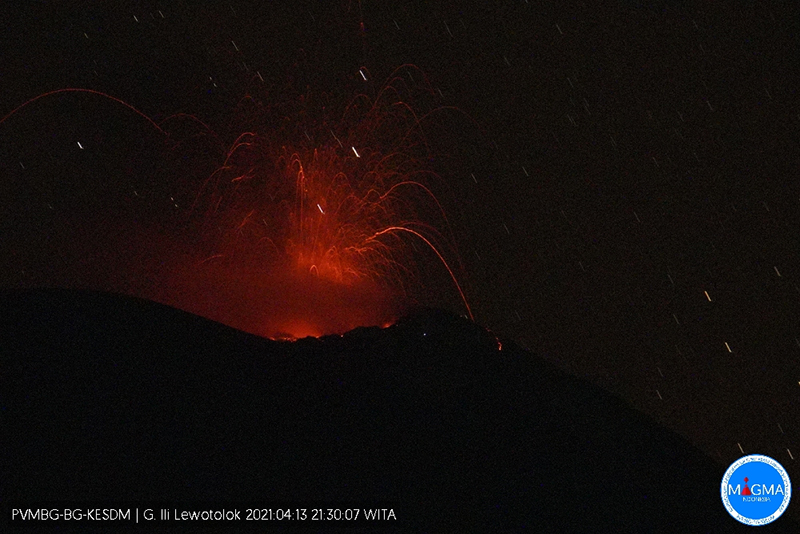 |
Figure 18. Incandescent ejecta rose several hundred meters above the summit of Lewotolok on 13 April 2021. Courtesy of MAGMA Indonesia and PVMBG. |
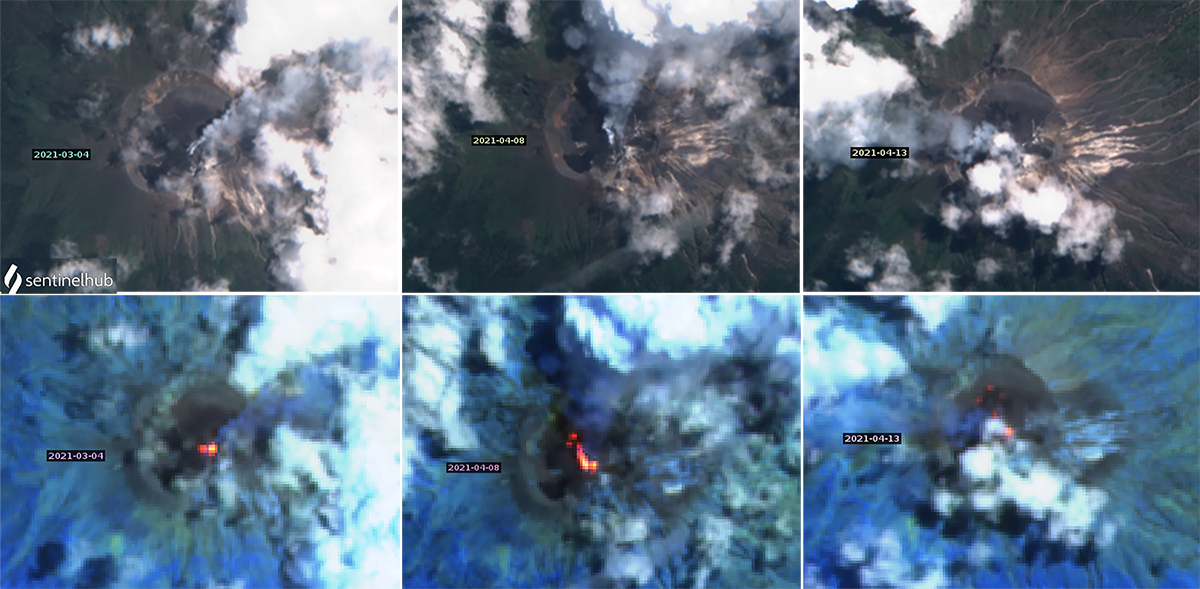 |
Figure 19. A comparison of visual and thermal imagery of Lewotolok from 4 March (left), 8 (middle) and 13 April 2021 (right) shows the appearance of fresh dark lava (natural color images, top) and thermal anomalies (Atmospheric penetration images, bottom) in the 8 and 13 April images that were not present in the 4 March images. Two plumes of steam and ash rose from the summit crater of Lewotolok on 8 April 2021 (top center) and corresponded with two thermal anomalies inside the crater (bottom center). The NW -trending linear anomaly was likely caused by a fresh lava flow. Small anomalies around the dark area on 13 April (bottom right) suggested cooling lava. Natural color images use bands 4, 3, and 2; Atmospheric penetration rendering uses bands 12, 11, and 8a. Courtesy of Sentinel Hub Playground. |
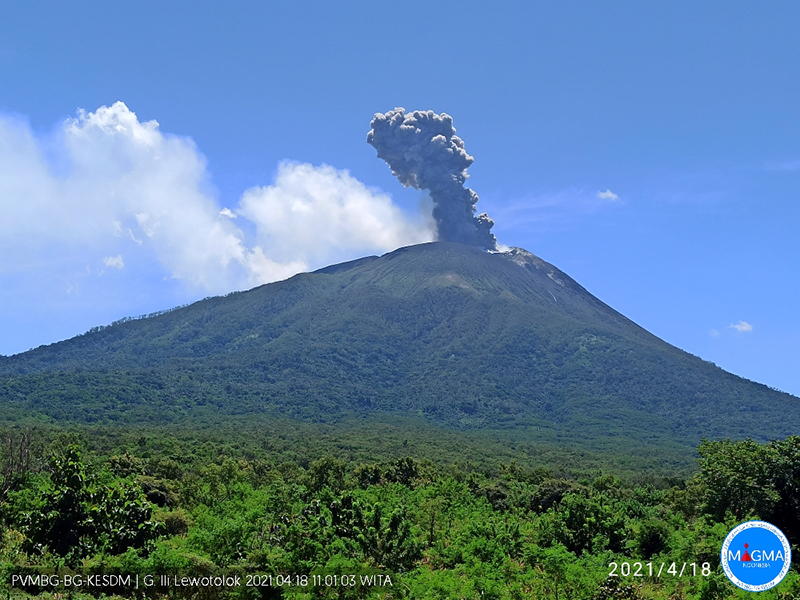 |
Figure 20. A dense gray and black ash plume rose 1,500 m above the summit of Lewotolok and drifted S and SW on 18 April 2021. |
Activity during May-July 2021. A single explosion reported by PVMBG and Magma Indonesia on 2 May caused a VONA and a VAAC report to be issued. The ash plume rose 500-600 m above the summit and drifted W. Lewotolok was quiet with white and gray emissions, and no explosions reported, until 14 May when incandescent ejecta and ash emissions resumed for the rest of the month. Strombolian activity accompanied by loud noises sent incandescent ejecta 300 m high and 400-700 m SE from the summit; satellite imagery from 18 May showed a small thermal anomaly inside the summit crater. The ash plumes from the multiple explosions were dense and gray, and rose 400-800 m high. The Darwin VAAC reported multiple ash emissions during 21-25 and 28-29 May that were clearly seen in satellite imagery extending SE, S, or SW at 2,100 m altitude; the plume on 28 May (figure 21) rose 1,000 m above the summit to about 2,400 m altitude and drifted SW.
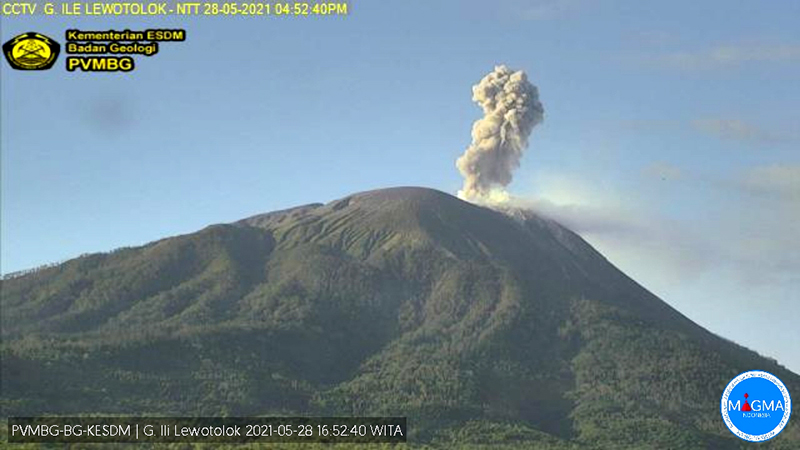 |
Figure 21. An ash plume at Lewotolok on 28 May 2021 rose 1,000 m above the summit and drifted SW. Courtesy of PVMBG and MAGMA Indonesia. |
Multiple explosions with either ash plumes or Strombolian activity were reported daily throughout June 2021. During 1-9 June incandescent ejecta fell at least 300 m in all directions from the summit with loud noises reported (figure 22). On 5 June the 300-m-high ejecta reached 1,000 m NW and 200 m SE. During 8-16 June eruptions with ash plumes were reported by MAGMA Indonesia; both VONA’s and VAAC reports were issued each day. The white and gray ash emissions generally rose 500-800 m above the summit. On 10, 14, and 21 June the plumes were reported 2,000 m above the summit drifting W and NW. An explosion on 13 June produced an ash plume to 3 km above the summit, the highest of the period, that was observed drifting W in satellite imagery at 4.9 km altitude. Rumbling reported during 16-20 June accompanied incandescent ejecta sent 300-500 m in all directions from the crater. On 2, 7, 12, and 27 June thermal anomalies appeared in Sentinel-2 imagery inside the summit crater; the strong anomaly on 27 June suggested new flow activity (figure 23).
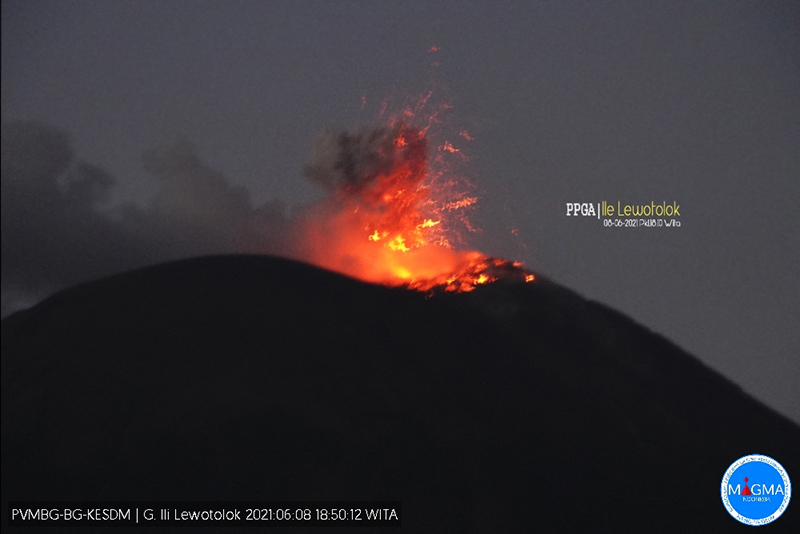 |
Figure 22. Incandescent ejecta rose several hundred meters above the summit of Lewotolok on 8 June 2021 and many other days during the month. Courtesy of PVMBG and MAGMA Indonesia. |
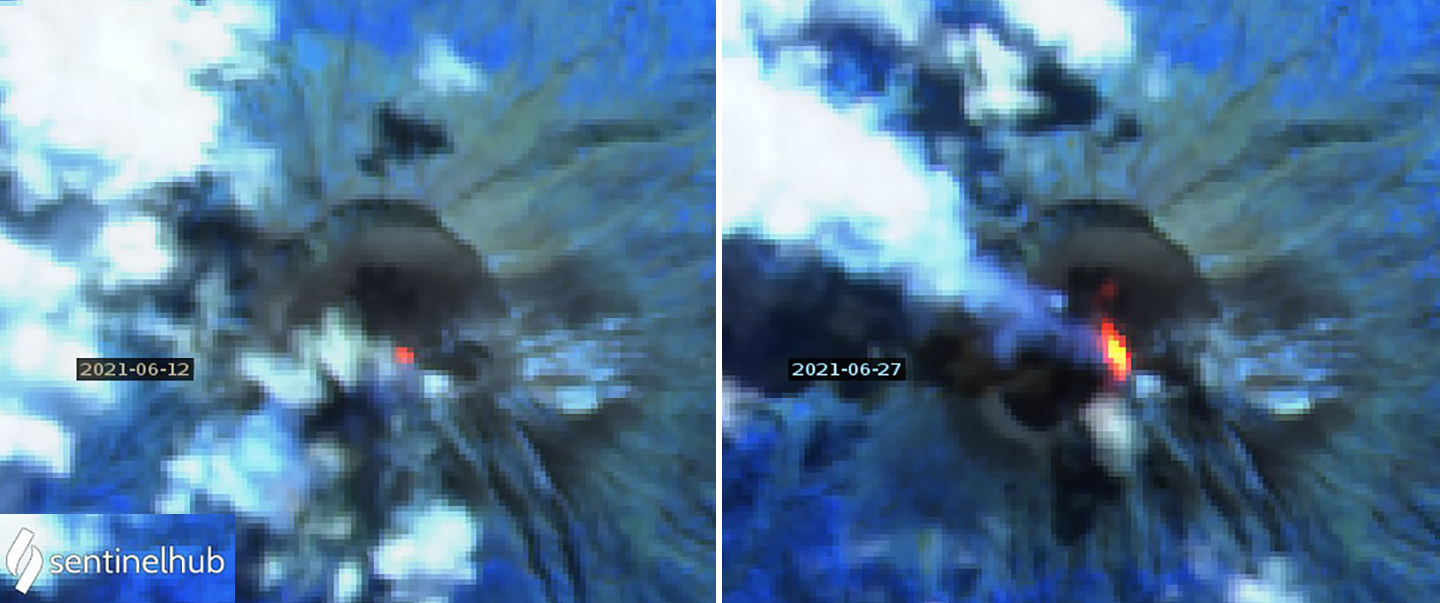 |
Figure 23. Thermal anomalies appeared inside the summit crater at Lewotolok on multiple days during June 2021 including 12 (left) and 27 June (right). The strong anomaly on 27 June suggested new flow activity with a weaker anomaly just off the N end of the larger one. Images use Atmospheric penetration rendering (bands 12, 11, 8a). Courtesy of Sentinel Hub Playground. |
Heightened levels of activity continued throughout July 2021. Thermal and visual evidence of fresh lava flows inside the summit crater appeared in satellite images on 2 July (figure 24). Additional thermal anomalies were recorded on 12, 22, and 27 July. Bursts of incandescent ejecta frequently caused loud noises. Vegetation caught fire around the summit from incandescent material on 3 and 28 July (figure 25). The tephra was usually reported 300-500 m from the crater but was sent 1,000 m SW on 3 July, and 1,000 m SE on 12, 18, 28, and 30 July. Five or more explosions were reported daily by PVMBG during 1-20 July, with a maximum of 28 reported on 9 July. The dense gray or gray-and-black ash emissions consistently rose 800-1,000 m above the summit, usually drifting W or NW (figure 26). The tallest plume on 7 July was reported by MAGMA Indonesia at 1,100 m above the summit, drifting E.
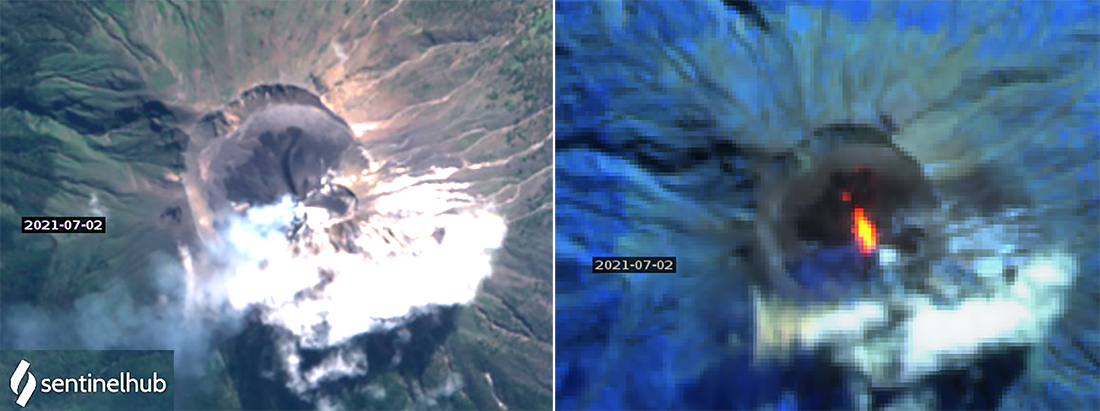 |
Figure 24. Evidence of fresh lava flow activity at Lewotolok appeared in Sentinel-2 satellite imagery on 2 July 2021. A thin line of dark material seen in natural color rendering (left, bands 4,3,2) is the area of strongest thermal anomaly seen in the Atmospheric penetration rendering image (right, bands 12, 11, 8a). Courtesy of Sentinel Hub Playground. |
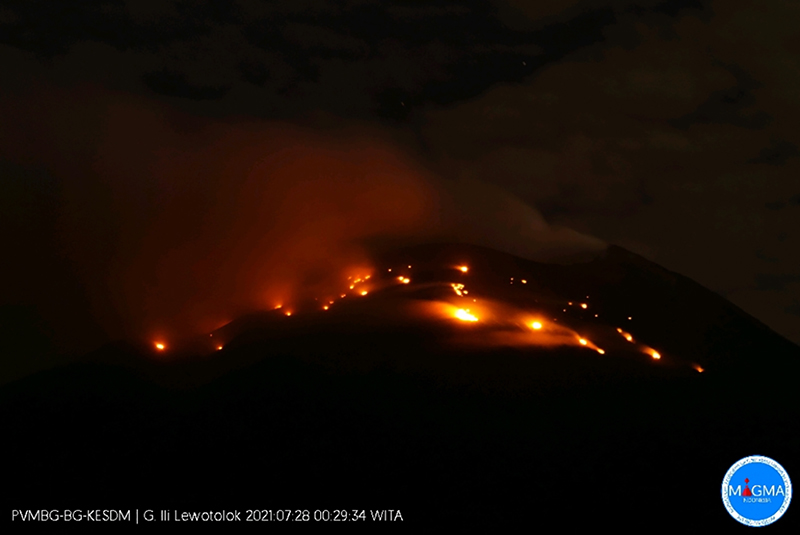 |
Figure 25. Vegetation near the summit of Lewotolok caught fire from incandescent ejecta on 28 July 2021. Courtesy of PVMBG and MAGMA Indonesia. |
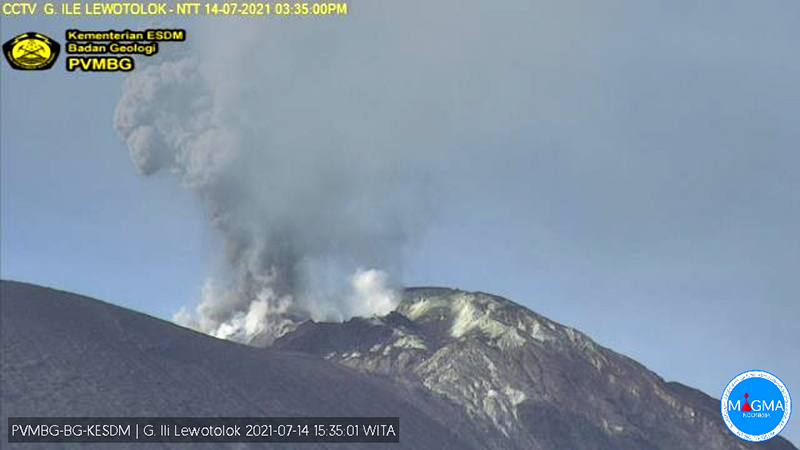 |
Figure 26. Gray ash and steam plumes rose 800 m from a pyroclastic cone-like feature inside the summit of Lewotolok on 14 July 2021. Courtesy of PVMBG and MAGMA Indonesia. |
Information Contacts: Pusat Vulkanologi dan Mitigasi Bencana Geologi (PVMBG, also known as Indonesian Center for Volcanology and Geological Hazard Mitigation, CVGHM), Jalan Diponegoro 57, Bandung 40122, Indonesia (URL: http://www.vsi.esdm.go.id/); MAGMA Indonesia, Kementerian Energi dan Sumber Daya Mineral (URL: https://magma.esdm.go.id/v1); MIROVA (Middle InfraRed Observation of Volcanic Activity), a collaborative project between the Universities of Turin and Florence (Italy) supported by the Centre for Volcanic Risk of the Italian Civil Protection Department (URL: http://www.mirovaweb.it/); Sentinel Hub Playground (URL: https://www.sentinel-hub.com/explore/sentinel-playground).
Strombolian activity persisted with ash plumes during August 2021-January 2022
Lewotolok (also known as Lewotolo) is located on the island of Lembata (Lomblen) in the Lesser Sunda Islands of Indonesia. The current eruption period began in late November 2020 and has been recently characterized by explosions with ash emissions rising up to 1.5 km above the summit and incandescent ejecta. A cone had formed in the summit crater over the SE rim, which contains a smaller crater. Intermittent thermal activity was also visible in satellite imagery according to MIROVA data, MODVOLC, and Sentinel-2 infrared data. This report covers similar explosive activity during August 2021 through January 2022 with information provided by Pusat Vulkanologi dan Mitigasi Bencana Geologi (PVMBG, also known as CVGHM, or the Center of Volcanology and Geological Hazard Mitigation), MAGMA Indonesia, and satellite data.
Intermittent ash plumes were reported rising to a maximum of 2.1 km above the summit; incandescent ejecta was also observed rising hundreds of meters above the summit and extending a similar distance from the crater. Thermal anomalies in MIROVA data indicated pulses of higher activity during late June to early July, and again in October through November (figure 27). Sentinel-2 infrared satellite imagery provided thermal and visual evidence of thermal activity inside the summit crater on multiple occasions (figure 28). According to data from the MODVOLC thermal algorithm, a total of eight hotspots were detected on 8, 13, 15, 17, 20, and 22 October, and 9 November.
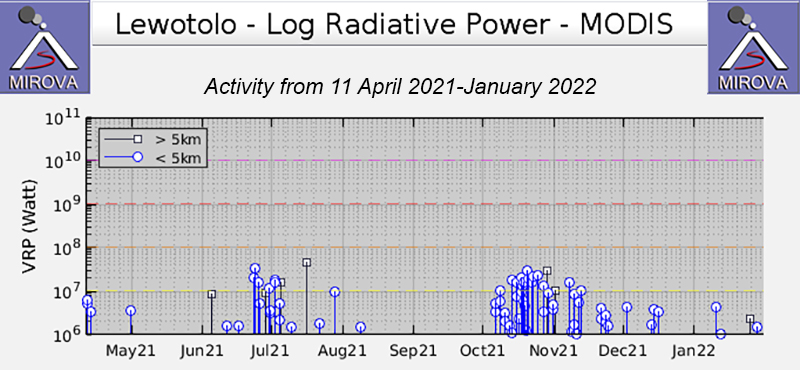 |
Figure 27. Periods of increased thermal activity at Lewotolok were shown on the MIROVA graph (Log Radiative Power) during late June-early July and October-November 2021. Few low-power anomalies were also detected during January 2022. Courtesy of MIROVA. |
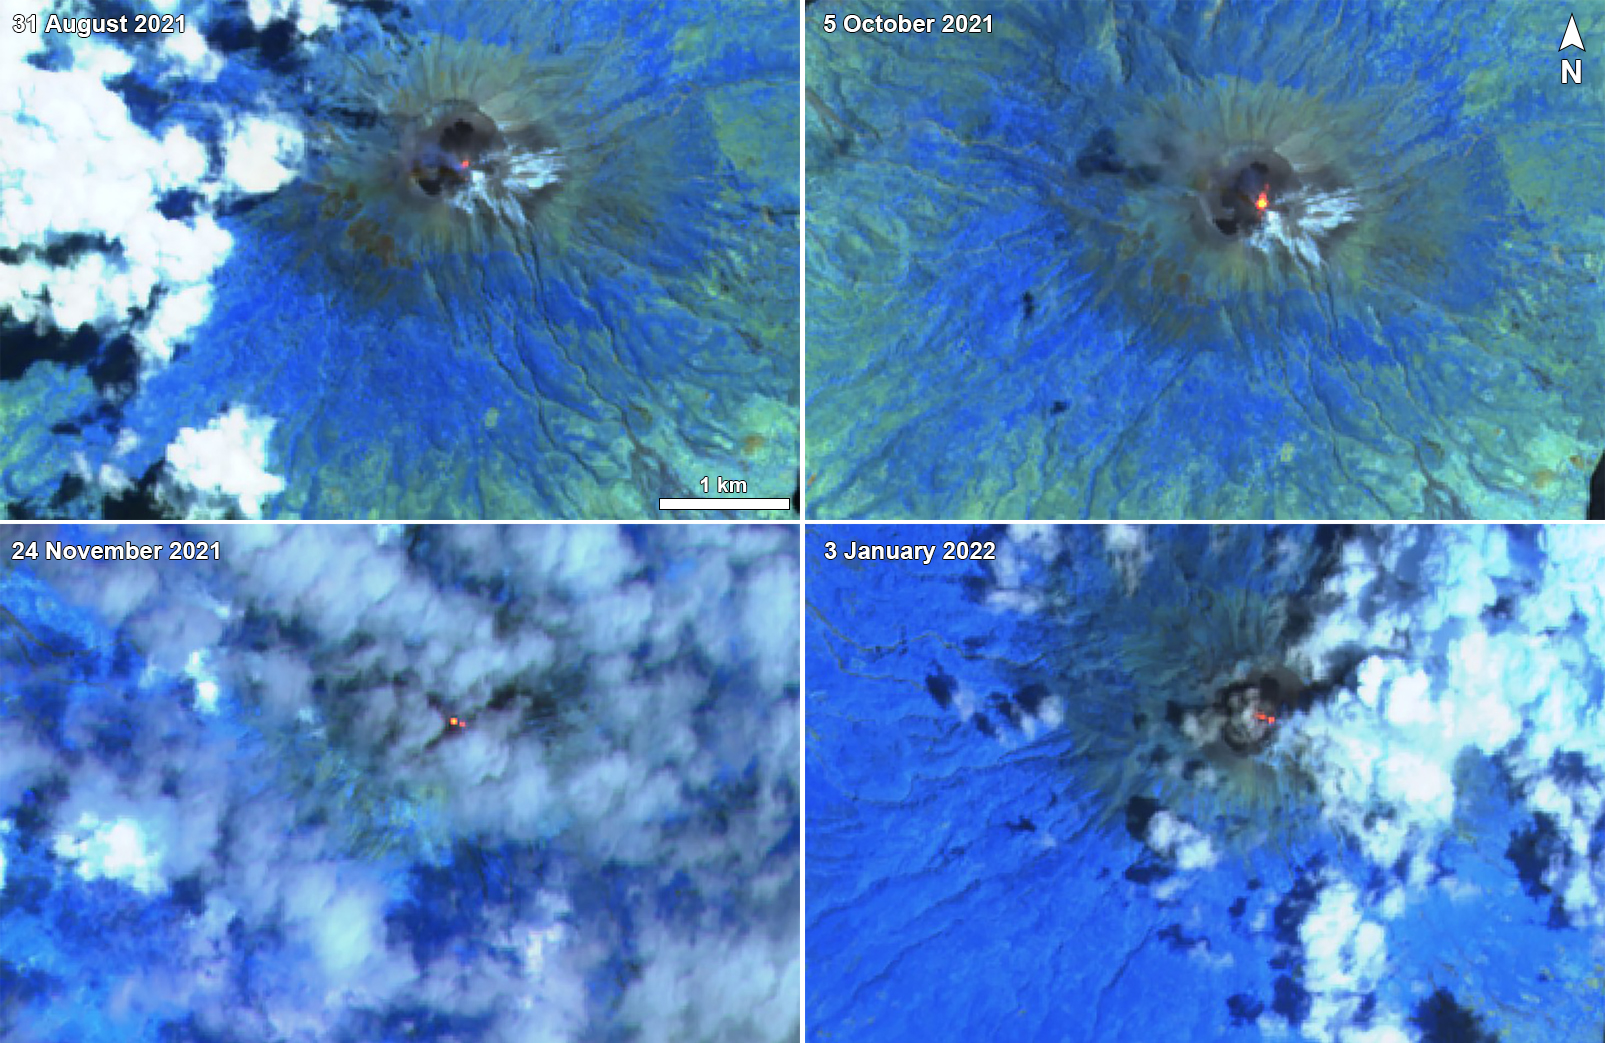 |
Figure 28. Occasional thermal anomalies were detected at the summit of Lewotolok on 31 August (top left), 5 October (top right), 24 November (bottom left) 2021, and 3 January (bottom right) 2022. Two distinct anomalies were present on 24 November and 3 January. Sentinel-2 satellite imagery uses Atmospheric penetration rendering (bands 12, 11, 8a). Courtesy of Sentinel Hub Playground. |
Daily white, gray, and black emissions rose 50-2,000 m above the summit during August. Occasional banging noises were also reported. On 10 August an eruption at 0729 produced an ash plume that rose 1.5 km above the summit and drifted S (figure 29). Incandescent material was ejected 200-350 m radially from the summit and was accompanied by banging noises. Ash plumes on 11 and 13 August rose 2 km and 1 km above the summit, respectively, both of which drifted W. During 15-16 August incandescence was observed from the SW part of the crater. On 18 August an ash plume at 1820 rose 1 km above the summit and drifted W and material was ejected 500 m SE. Ash plumes rose 1.2-1.5 km above the summit and drifted generally W on 22, 24, and 26 August.
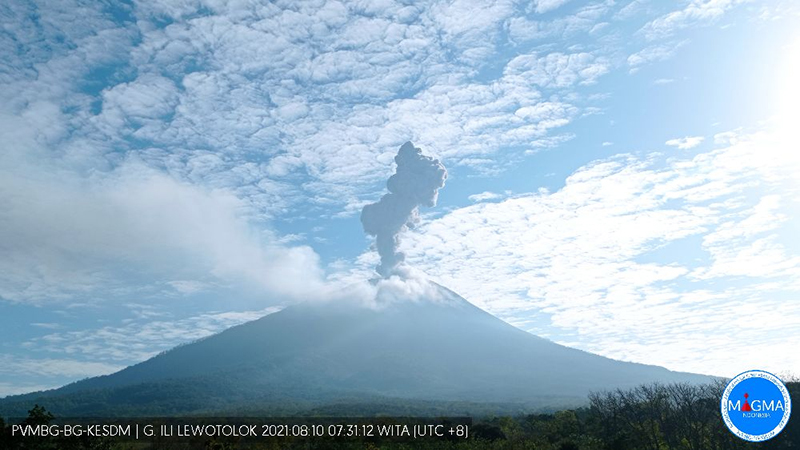 |
Figure 29. An ash plume rose 1.5 km above the summit of Lewotolok and drifted S on 10 August 2021. Courtesy of MAGMA Indonesia and PVMBG. |
Similar activity during September was characterized by daily white, gray, and black emissions rising 50-700 m above the summit. Ash plumes rose 200-600 m above the summit. Incandescent material was ejected as high as 300 m above the summit during 1-2 September. Some incandescent material traveled as far as 1 km to the SE on 5 September (figure 30). On 15 September an ash plume rose 600 m above the summit and during 15-16 September incandescent material was ejected 100-300 m above the summit to the E (figure 31). Crater incandescence was visible on 17 September, followed by incandescent ejecta as high as 300 m above the summit that was reported on 18, 19, and 21 September.
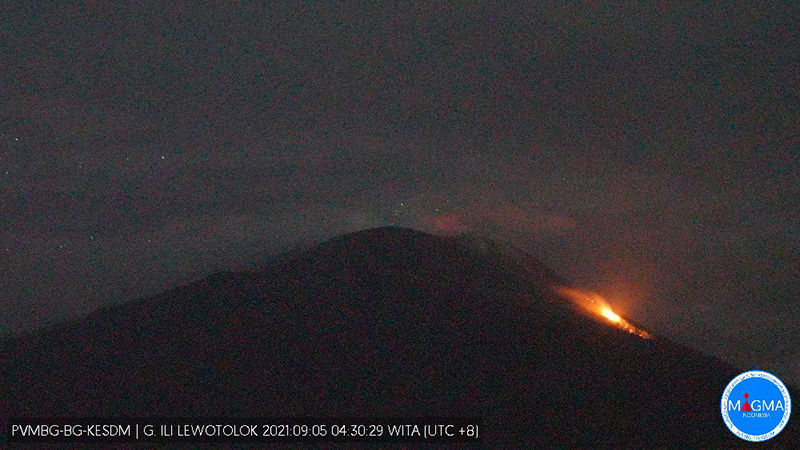 |
Figure 30. Incandescent material from Lewotolok traveled as far as 1 km to the SE on 5 September 2021. Courtesy of MAGMA Indonesia and PVMBG. |
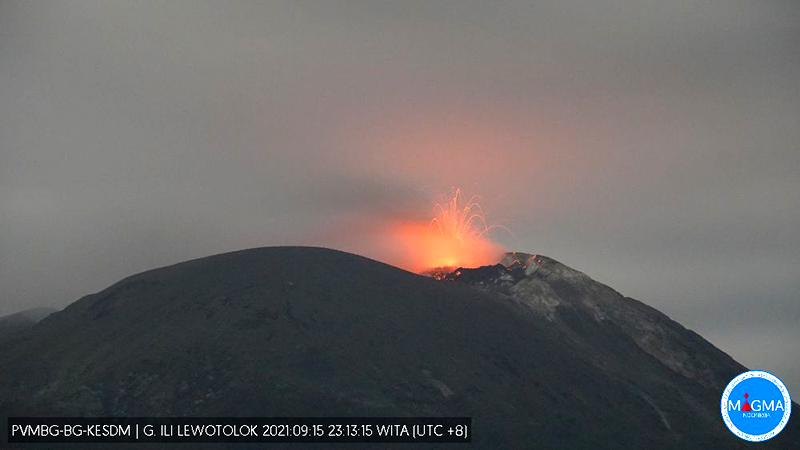 |
Figure 31. Incandescent material from Lewotolok was ejected 100-300 m above the summit to the E on 15 September 2021. Courtesy of MAGMA Indonesia and PVMBG. |
During October white, gray, and black emissions rose 50-1,000 m above the summit. Ash plumes were reported rising as high as 1 km above the summit. Rumbling and banging sounds were reported daily. On 1 October an ash plume rose 800 m above the summit and drifted W and incandescent ejecta during 1-2 October rose 300 m above the summit (figure 32). During 3-5 October incandescent material was ejected as far as 700 m from the vent in multiple directions. On 6 October material was ejected as far as 1 km to the SE and 300 m to the SW; an associated ash plume at 1723 rose 600 m above the summit. A VONA stated that on 7 October an ash plume rose 1.9 km above the summit and drifted W. Daily incandescent ejecta were detected during 8-16 October rising up to 300 m above the crater, one event of which moved to the SE. On 11 October there were 24 eruption events reported with ash emissions rising 200 m above the summit, and during 13-15 October there were a total of 77 eruption events with similar ash emissions up to 1 km above the summit. An ash plume at 0548 on 25 October rose 2.1 km above the summit. Incandescent pulses and weak rumbling sounds were reported on 30 October.
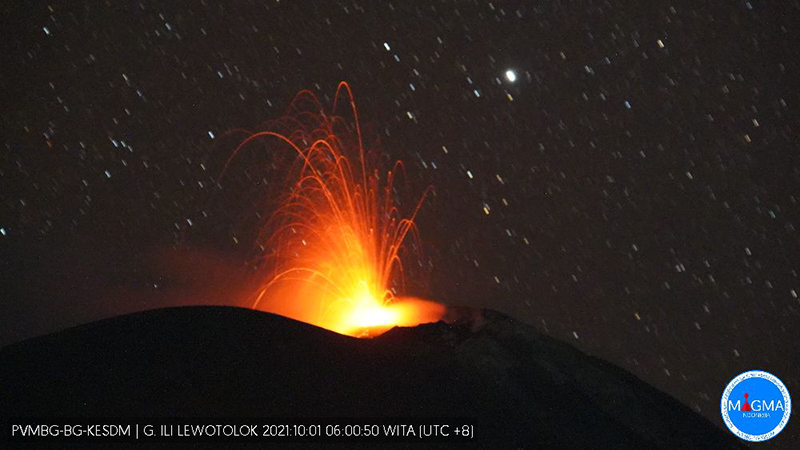 |
Figure 32. Incandescent ejecta rose as high as 300 m above the summit of Lewotolok on 1 October 2021. Courtesy of MAGMA Indonesia and PVMBG. |
White, gray, and black emissions persisted in November, rising 50-2,000 m above the summit. During 1-3 November incandescent material was ejected 100-200 m above the summit, and frequent rumbling and banging sounds were reported. On 6 October there were 16 eruption events that produced white and gray emissions 200-300 m above the summit; rock avalanches and crater incandescence were also observed (figure 33). Incandescent material was frequently ejected as far as 400 m away from the vent in multiple directions. During 19-20 November incandescent material was ejected 200 m E from the vent and crater incandescence remained visible during 22-30 November. On 24-25 and 30 November incandescent material was ejected 200-500 m above the summit to the E and SE.
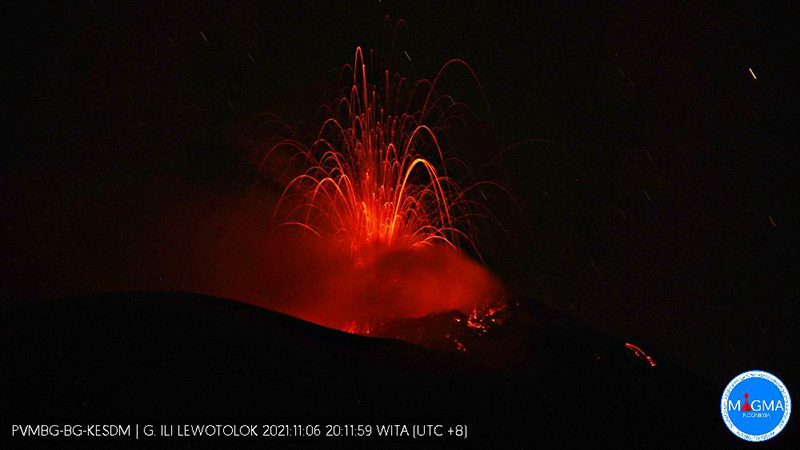 |
Figure 33. Incandescent material and rock avalanches were visible above the Lewotolok summit on 6 October 2021. Courtesy of MAGMA Indonesia and PVMBG. |
Activity continued during December, with white, gray, and black emissions rising 50-800 m above the summit. During 7-8 December incandescent material was ejected 300 m above the summit; faint rumbling accompanied this activity. On 13, 14, and 15 December ash plumes rose to 500 m, 700 m, and 600 m above the summit, respectively (figure 34). Incandescent material was ejected on multiple days during 15-29 December as high as 300 m in different directions. Ash plumes on 25 and 27 December rose 500 m and 400 m above the summit, respectively.
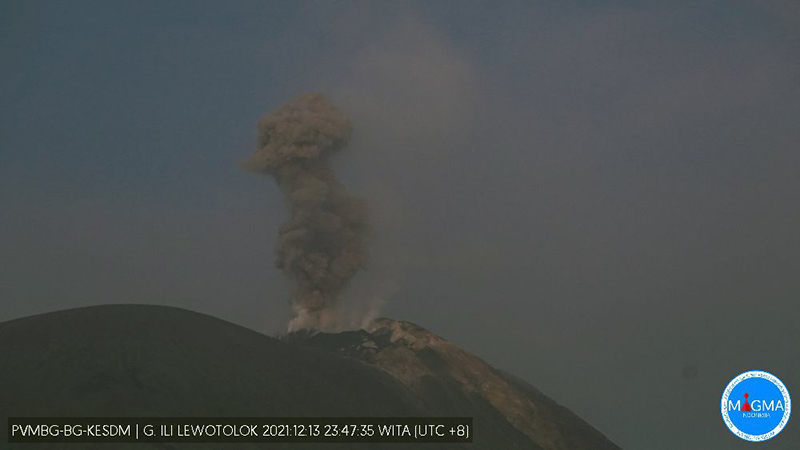 |
Figure 34. An ash plume rose 500 m above the summit of Lewotolok on 13 December 2021. Courtesy of MAGMA Indonesia and PVMBG. |
During January 2022, white, gray, and black emissions rose as high as 600 m above the summit and drifted E and SE and incandescent material was ejected 300 m from the vent, accompanied by rumbling. At 0848 on 11 January an ash plume rose 700 m above the summit and drifted E (figure 35). During 11-14 January ash plumes also rose as high as 700 m above the summit, drifting E, SE, and W.
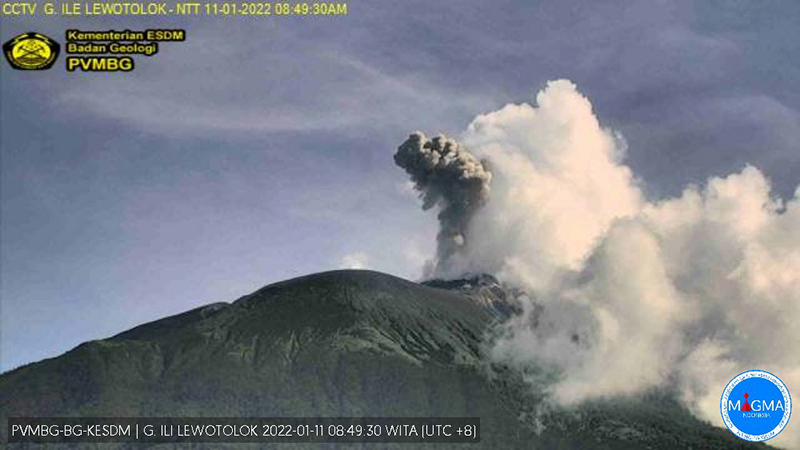 |
Figure 35. An ash plume rose 700 m above the summit and drifted E from Lewotolok on 11 January 2022. Courtesy of MAGMA Indonesia and PVMBG. |
Information Contacts: Pusat Vulkanologi dan Mitigasi Bencana Geologi (PVMBG, also known as Indonesian Center for Volcanology and Geological Hazard Mitigation, CVGHM), Jalan Diponegoro 57, Bandung 40122, Indonesia (URL: http://www.vsi.esdm.go.id/); MAGMA Indonesia, Kementerian Energi dan Sumber Daya Mineral (URL: https://magma.esdm.go.id/v1); MIROVA (Middle InfraRed Observation of Volcanic Activity), a collaborative project between the Universities of Turin and Florence (Italy) supported by the Centre for Volcanic Risk of the Italian Civil Protection Department (URL: http://www.mirovaweb.it/); Hawai'i Institute of Geophysics and Planetology (HIGP) - MODVOLC Thermal Alerts System, School of Ocean and Earth Science and Technology (SOEST), Univ. of Hawai'i, 2525 Correa Road, Honolulu, HI 96822, USA (URL: http://modis.higp.hawaii.edu/); Sentinel Hub Playground (URL: https://www.sentinel-hub.com/explore/sentinel-playground).
Strombolian explosions, ash plumes, and crater incandescence during February-September 2022
Lewotolok (also known as Lewotolo) is located on the island of Lembata (Lomblen) in the Lesser Sunda Islands of Indonesia. Eruptions have been recorded since 1660, consisting primarily of explosive activity from the summit crater. The current eruption period began in late November 2020 and has been recently characterized by Strombolian explosions, intermittent ash plumes, and incandescent ejecta (BGVN 47:03). This report covers similar explosive activity during February through September 2022 using information from Pusat Vulkanologi dan Mitigasi Bencana Geologi (PVMBG, also known as CVGHM, or the Center of Volcanology and Geological Hazard Mitigation), MAGMA Indonesia, and various satellite data.
Strong Strombolian explosions occurred throughout the reporting period and were often visible on clear nights; accompanying incandescent ejecta rose above the summit crater and extended away from the vent. Intermittent ash plumes were reported rising to a maximum of 3.8 km altitude on 14 May. Thermal activity based on MIROVA (Middle InfraRed Observation of Volcanic Activity) data showed a period of infrequent, low-power anomalies during February through mid-May 2022 (figure 36). During February one anomaly was detected, during mid-March three anomalies were detected, and during April seven were detected. By early-to-mid May there was a distinctive increase in both power and frequency of the thermal anomalies, which continued through mid-July. After this heightened activity, there was a brief break during late July to early August, in which only one low-power anomaly was registered. During early August and late August, there was a small cluster of anomalies that were detected, as well as during mid-September. The heightened thermal activity during May through mid-July was also recorded in data from the MODVOLC Thermal Algorithm; a total of 18 hotspots were detected on 15 March, 13, 16, 27, and 30 May, 1, 5, 15, 19, and 28 June, 5 July, and 9 and 27 August. Sentinel-2 infrared satellite imagery provided thermal and visual evidence of thermal activity at the summit crater on clear weather days throughout the reporting period (figure 37).
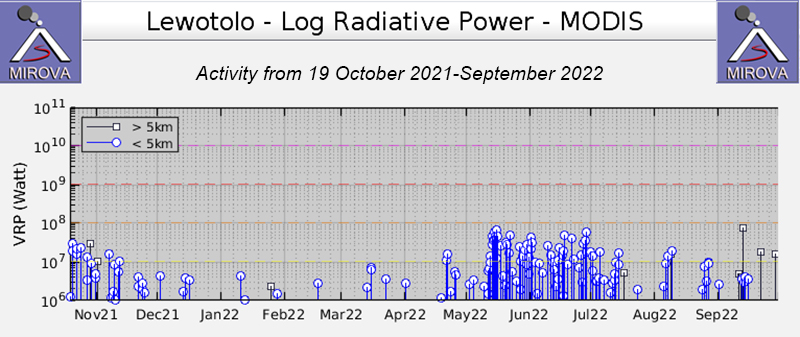 |
Figure 36. A period of low thermal activity was detected at Lewotolok during February through mid-May 2022, as shown by this MIROVA plot of Log Radiative Power. One anomaly was detected during mid-February, three during mid-March, and seven during April. Then, during early-to-mid May activity increased in both frequency and strength and continued at a higher level through mid-July 2022. A few strong anomalies were also recorded during early and late August, and then during mid-September. Courtesy of MIROVA. |
 |
Figure 37. Sentinel-2 infrared satellite images showed a small-to-moderate sized thermal anomaly at the summit crater of Lewotolok during 7 February 2022 (top left), 24 March (top right), 23 April (middle left), 23 May (middle right), 12 June (bottom left), and 2 July (bottom right). Some incandescent material was also visible on the flanks. On 7 February material was distributed to the SE. On 24 March and 23 April material moved to the NW. On 23 May and 12 June incandescent material was on the N and NE flanks. On 2 July material could be seen at the base of the NE flank. Sentinel-2 satellite imagery uses Atmospheric penetration rendering (bands 12, 11, 8a). Courtesy of Sentinel Hub Playground. |
During February Strombolian explosions, incandescent ejecta, and minor crater incandescence at the summit was visible during the night in webcam images (figure 38). White, gray, and black plumes rose 25-1,200 m above the summit and drifted in different directions. On 11 February at 0743 an eruption of ash emissions rose to 2.6 km altitude and drifted E, according to a ground observer. Similar ash emissions were reported in VONA (Volcano Observatory Notice for Aviation) notices on 12 and 14 February, where the ash emissions rose to 2.2 and 2.1 km altitude and drifted E and SW, respectively (figure 39). A webcam image captured at 0210 on 18 February showed Strombolian activity and incandescent material on the flank. A white and-gray plume rose 700 m high above the crater and drifted E on 19 February. During March white-and-gray plumes rose 10-1,000 m above the main summit crater and drifted in different directions. Some webcam images recorded incandescence at the summit. On 10 and 11 March a ground observer reported ash emissions rising to 2 and 2.4 km altitude and drifting W and SW, respectively (figure 39). On 31 March an ash emission rose to 2.2 km altitude and drifted NW.
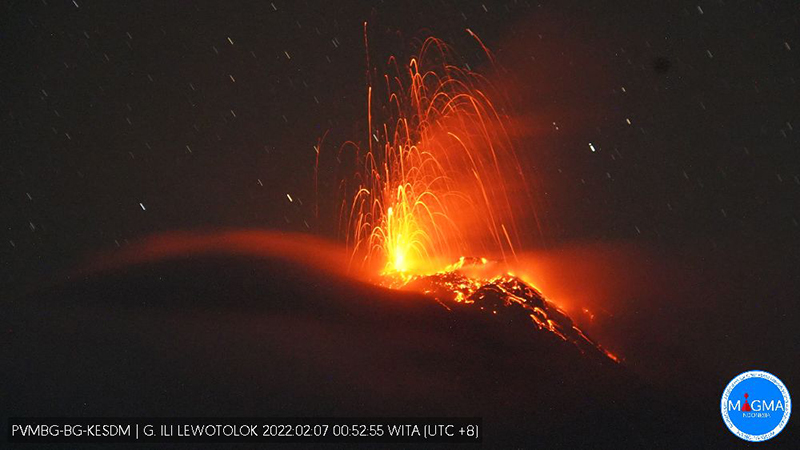 |
Figure 38. Webcam image of a Strombolian explosion at Lewotolok on 7 February 2022 ejecting incandescent material from the crater and accompanied by incandescent material on the nearby flanks. Courtesy of MAGMA Indonesia. |
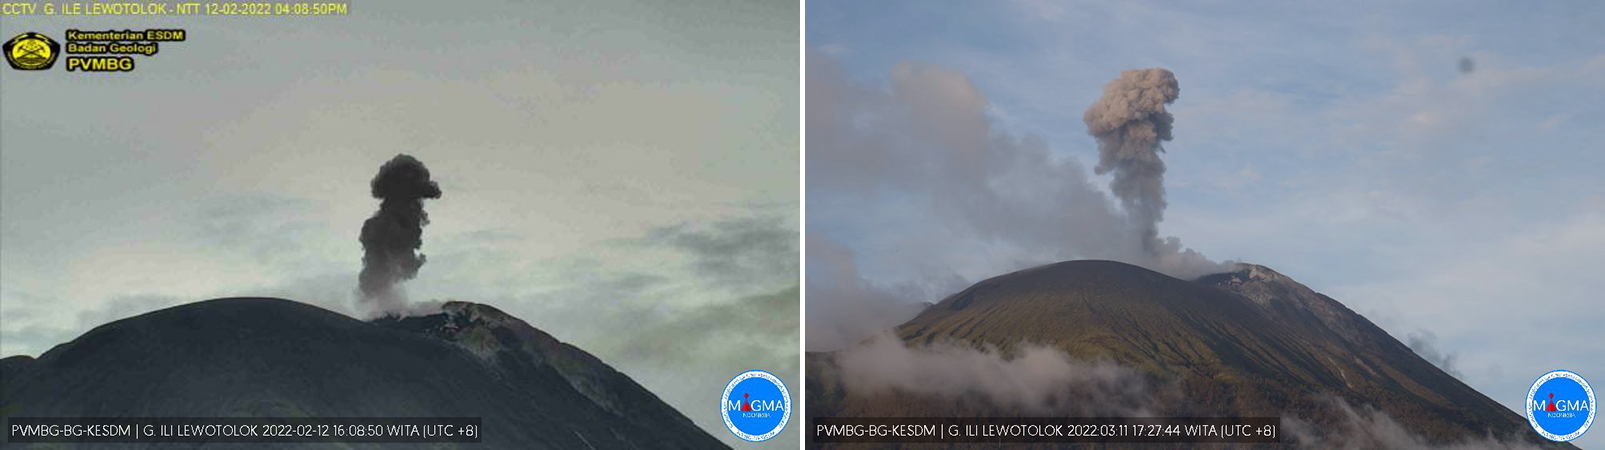 |
Figure 39. Webcam images of ash plumes rising to 2.2 and 2.4 km altitude from Lewotolok at 1608 on 12 February 2022 (left) and at 1727 on 11 March 2022 (right). Courtesy of MAGMA Indonesia. |
Similar activity with intermittent Strombolian explosions, incandescent ejecta, and ash plumes continued during April and May (figure 40). White-and-gray gas-and-steam plumes rose 25-1,200 m above the summit and drifted in different directions. During 29-30 April ash emissions rose to 1.9-2 km altitude and drifted NW and W. Ash emissions during 4-6 May rose to 2 km altitude and drifted W. On 14 May MAGMA Indonesia reported that degassing had increased, and continuing ash emissions were rising to around 3.8 km altitude and drifting N and NE. Similar activity was also reported on 16 May where ash emissions rose to 2.4 km altitude and drifted W.
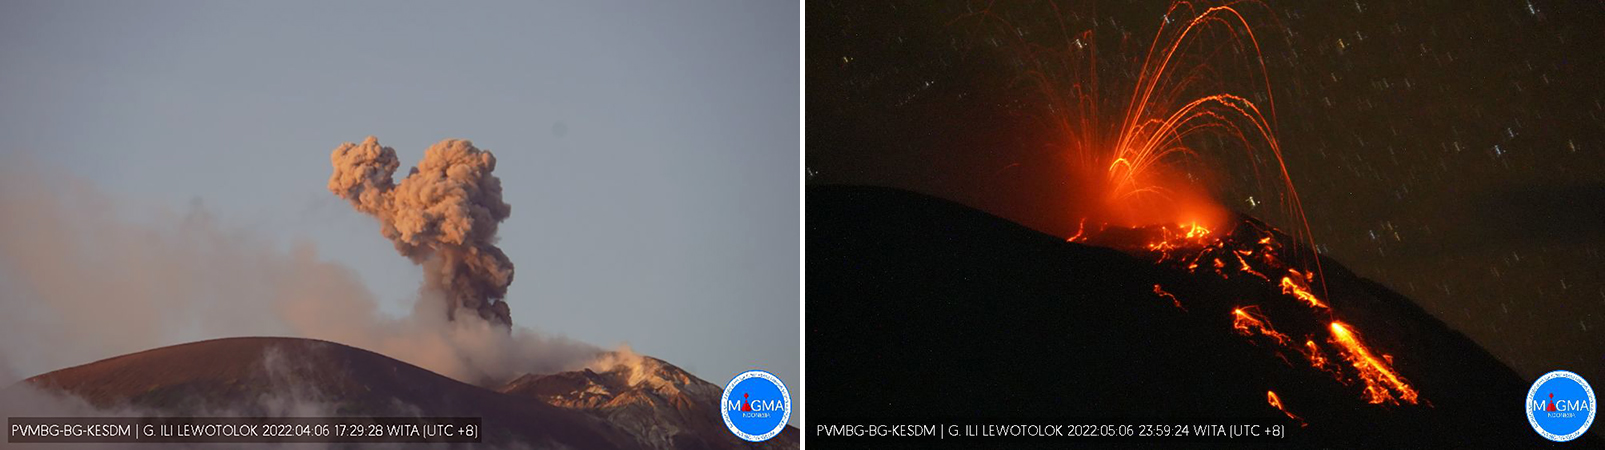 |
Figure 40. Webcam images of an ash plume (left) and Strombolian explosions (right) rising above Lewotolok on 6 April 2022 and 6 May 2022, respectively. Incandescent material was visible on the flanks of the volcano at night. Courtesy of MAGMA Indonesia. |
Strong Strombolian explosions persisted during June and July, with occasional ash plumes rising to 2.7 km altitude and drifting generally W, NW, and SE. Incandescence in the summit crater and incandescent material were often visible in webcam images. White-and-gray gas-and-steam plumes rose 10-1,300 m above the summit and drifted in different directions during June and July. On 8 June an ash emission rose to 2.2 km altitude and drifted NW. Another ash emission on 17 June rose to 2.4 km altitude and drifted W (figure 41). During 1-2 and 7 July ash emissions rose as high as 2.7 km altitude and drifted W, NW, and SE (figure 41).
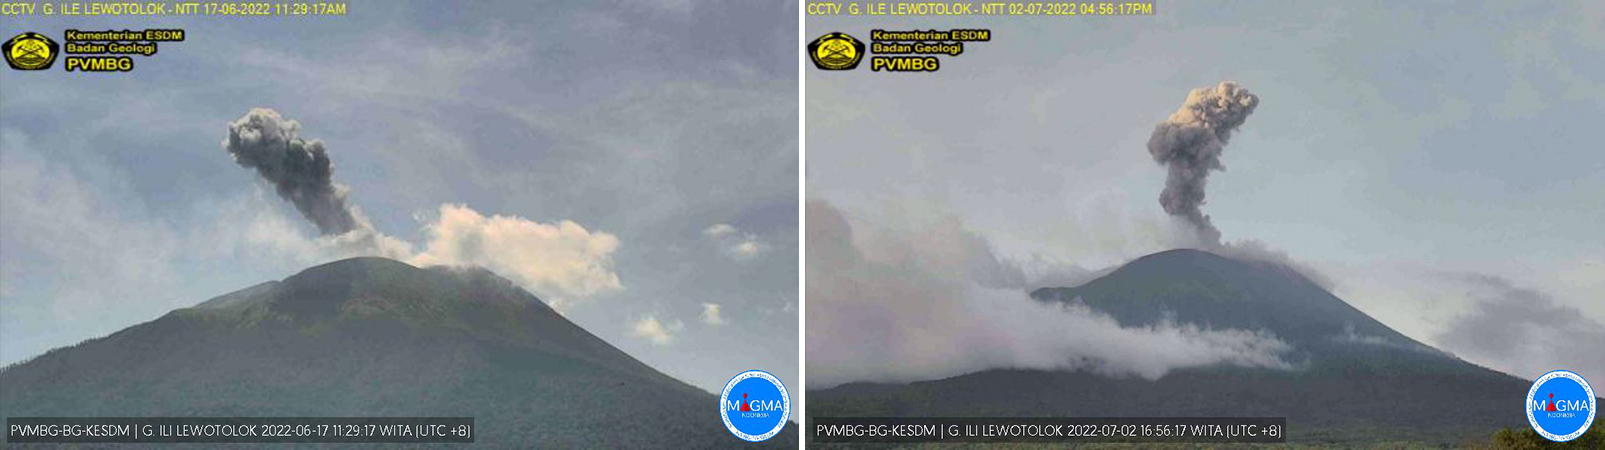 |
Figure 41. Webcam images of ash plumes during 17 June 2022 (left) and 2 July 2022 (right) rising from Lewotolok to 2.4 km altitude and 2.7 km altitude, respectively. Courtesy of MAGMA Indonesia. |
During August through September, white and gray gas-and-steam plumes rose 5-1,000 m above the main summit crater. Photos from MAGMA Indonesia showed occasional incandescent Strombolian explosions at the summit crater during the night, many of which ejected incandescent material above the crater rim. During 1-2 September white, gray, and black gas-and-steam plumes rose as high as 1,500 m above the summit (figure 42). At 0350 on 23 September an eruptive event produced an ash plume that rose 800 m high and drifted W. An image captured at that time showed Strombolian activity ejecting incandescent material above the summit.
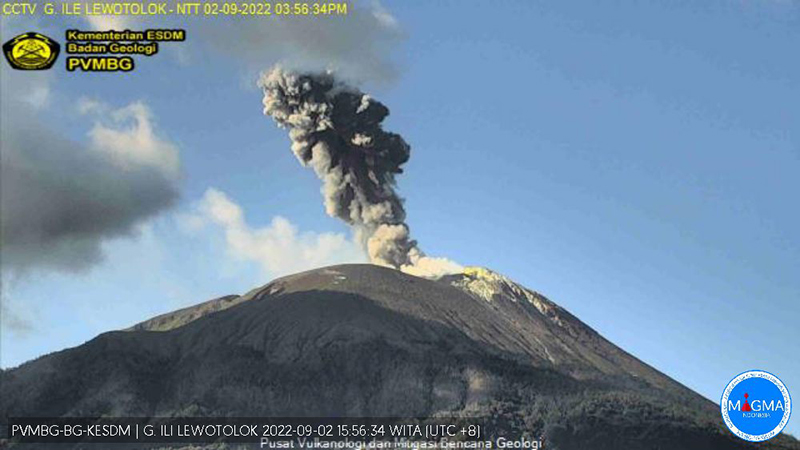 |
Figure 42. Webcam image of an ash plume rising 1.5 km above the summit crater of Lewotolok at 1556 on 2 September 2022. Courtesy of MAGMA Indonesia. |
Information Contacts: Pusat Vulkanologi dan Mitigasi Bencana Geologi (PVMBG, also known as Indonesian Center for Volcanology and Geological Hazard Mitigation, CVGHM), Jalan Diponegoro 57, Bandung 40122, Indonesia (URL: http://www.vsi.esdm.go.id/); MAGMA Indonesia, Kementerian Energi dan Sumber Daya Mineral (URL: https://magma.esdm.go.id/v1); MIROVA (Middle InfraRed Observation of Volcanic Activity), a collaborative project between the Universities of Turin and Florence (Italy) supported by the Centre for Volcanic Risk of the Italian Civil Protection Department (URL: http://www.mirovaweb.it/); Hawai'i Institute of Geophysics and Planetology (HIGP) - MODVOLC Thermal Alerts System, School of Ocean and Earth Science and Technology (SOEST), Univ. of Hawai'i, 2525 Correa Road, Honolulu, HI 96822, USA (URL: http://modis.higp.hawaii.edu/); Sentinel Hub Playground (URL: https://www.sentinel-hub.com/explore/sentinel-playground).
Strombolian eruption continues through April 2023 with intermittent ash plumes
The current eruption at Lewotolok, in Indonesian’s Lesser Sunda Islands, began in late November 2020 and has included Strombolian explosions, occasional ash plumes, incandescent ejecta, intermittent thermal anomalies, and persistent white and white-and-gray emissions (BGVN 47:10). Similar activity continued during October 2022-April 2023, as described in this report based on information provided by Pusat Vulkanologi dan Mitigasi Bencana Geologi (PVMBG, also known as CVGHM, or the Center of Volcanology and Geological Hazard Mitigation), MAGMA Indonesia, the Darwin Volcanic Ash Advisory Centre (VAAC), and satellite data.
During most days in October 2022 white and white-gray emissions rose as high as 200-600 m above the summit. Webcam images often showed incandescence above the crater rim. At 0351 on 14 October, an explosion produced a dense ash plume that rose about 1.2 km above the summit and drifted SW (figure 43). After this event, activity subsided and remained low through the rest of the year, but with almost daily white emissions.
|
Figure 43. Webcam image of Lewotolok on 14 October 2022 showing a dense ash plume and incandescence above the crater. Courtesy of MAGMA Indonesia. |
After more than two months of relative quiet, PVMBG reported that explosions at 0747 on 14 January 2023 and at 2055 on 16 January produced white-and-gray ash plumes that rose around 400 m above the summit and drifted E and SE (figure 44). During the latter half of January through April, almost daily white or white-and-gray emissions were observed rising 25-800 m above the summit, and nighttime webcam images often showed incandescent material being ejected above the summit crater. Strombolian activity was visible in webcam images at 2140 on 11 February, 0210 on 18 February, and during 22-28 March. Frequent hotspots were recorded by the MIROVA detection system starting in approximately the second week of March 2023 that progressively increased into April (figure 45).
|
Figure 44. Webcam image of an explosion at Lewotolok on 14 January 2023 ejecting a small ash plume along with white emissions. Courtesy of MAGMA Indonesia. |
|
Figure 45. MIROVA Log Radiative Power graph of thermal anomalies detected by the VIIRS satellite instrument at Lewotolok’s summit crater for the year beginning 24 July 2022. Clusters of mostly low-power hotspots occurred during August-October 2022, followed by a gap of more than four months before persistent and progressively stronger anomalies began in early March 2023. Courtesy of MIROVA. |
Explosions that produced dense ash plumes as high as 750 m above the summit were described in Volcano Observatory Notices for Aviation (VONA) at 0517, 1623, and 2016 on 22 March, at 1744 on 24 March, at 0103 on 26 March, at 0845 and 1604 on 27 March (figure 46), and at 0538 on 28 March. According to the Darwin VAAC, on 6 April another ash plume rose to 1.8 km altitude (about 370 m above the summit) and drifted N.
|
Figure 46. Webcam image of Lewotolok at 0847 on 27 March 2023 showing a dense ash plume from an explosion along with clouds and white emissions. Courtesy of MAGMA-Indonesia. |
Sentinel-2 images over the previous year recorded thermal anomalies as well as the development of a lava flow that descended the NE flank beginning in June 2022 (figure 47). The volcano was often obscured by weather clouds, which also often hampered ground observations. Ash emissions were reported in March 2022 (BGVN 47:10), and clear imagery from 4 March 2022 showed recent lava flows confined to the crater, two thermal anomaly spots in the eastern part of the crater, and mainly white emissions from the SE. Thermal anomalies became stronger and more frequent in mid-May 2022, followed by strong Strombolian activity through June and July (BGVN 47:10); Sentinel-2 images on 2 June 2022 showed active lava flows within the crater and overflowing onto the NE flank. Clear images from 23 April 2023 (figure 47) show the extent of the cooled NE-flank lava flow, more extensive intra-crater flows, and two hotspots in slightly different locations compared to the previous March.
|
Figure 47. Sentinel-2 satellite images of Lewotolok showing sets of visual (true color) and infrared (bands 12, 11, 8a) views on 4 March 2022, 2 June 2022, and 23 April 2023. Courtesy of Copernicus Browser. |
Information Contacts: Pusat Vulkanologi dan Mitigasi Bencana Geologi (PVMBG, also known as Indonesian Center for Volcanology and Geological Hazard Mitigation, CVGHM), Jalan Diponegoro 57, Bandung 40122, Indonesia (URL: http://www.vsi.esdm.go.id/); MAGMA Indonesia, Kementerian Energi dan Sumber Daya Mineral (URL: https://magma.esdm.go.id/v1); Darwin Volcanic Ash Advisory Centre (VAAC), Bureau of Meteorology, Northern Territory Regional Office, PO Box 40050, Casuarina, NT 0811, Australia (URL: http://www.bom.gov.au/info/vaac/); MIROVA (Middle InfraRed Observation of Volcanic Activity), a collaborative project between the Universities of Turin and Florence (Italy) supported by the Centre for Volcanic Risk of the Italian Civil Protection Department (URL: http://www.mirovaweb.it/); Copernicus Browser, Copernicus Data Space Ecosystem, European Space Agency (URL: https://dataspace.copernicus.eu/browser/).
This compilation of synonyms and subsidiary features may not be comprehensive. Features are organized into four major categories: Cones, Craters, Domes, and Thermal Features. Synonyms of features appear indented below the primary name. In some cases additional feature type, elevation, or location details are provided.
Synonyms |
| Lewotolo | Ili Lewoto | Ngapi | Zwavelberg | Tokajain | Ili Lewotolo |
|
|
||||||||||||||||||||||||
There is data available for 10 confirmed Holocene eruptive periods.
2020 Nov 27 - 2024 Apr 19 (continuing) Confirmed Eruption Max VEI: 2
| Episode 1 | Eruption Episode | |||||||||||||||
|---|---|---|---|---|---|---|---|---|---|---|---|---|---|---|---|
| 2020 Nov 27 - 2022 Oct 25 | Evidence from Observations: Reported | ||||||||||||||
|
List of 1 Events for Episode 1
| |||||||||||||||
| Episode 2 | Eruption Episode | ||||
|---|---|---|---|---|
| 2023 Jan 14 - 2024 Apr 19 (continuing) | Evidence from Observations: Reported | |||
2012 Jan 2 - 2012 Jan 14 Confirmed Eruption Max VEI: 1
| Episode 1 | Eruption Episode | Summit crater | ||||||||||||||||||||||||||||||||||||||||||||||||||||||||||||||||
|---|---|---|---|---|---|---|---|---|---|---|---|---|---|---|---|---|---|---|---|---|---|---|---|---|---|---|---|---|---|---|---|---|---|---|---|---|---|---|---|---|---|---|---|---|---|---|---|---|---|---|---|---|---|---|---|---|---|---|---|---|---|---|---|---|---|
| 2012 Jan 2 - 2012 Jan 14 | Evidence from Observations: Reported | ||||||||||||||||||||||||||||||||||||||||||||||||||||||||||||||||
|
List of 11 Events for Episode 1 at Summit crater
| |||||||||||||||||||||||||||||||||||||||||||||||||||||||||||||||||
1951 Dec 15 Confirmed Eruption Max VEI: 2
| Episode 1 | Eruption Episode | |||||||||||||||
|---|---|---|---|---|---|---|---|---|---|---|---|---|---|---|---|
| 1951 Dec 15 - Unknown | Evidence from Observations: Reported | ||||||||||||||
|
List of 1 Events for Episode 1
| |||||||||||||||
1920 Confirmed Eruption Max VEI: 2
| Episode 1 | Eruption Episode | |||||||||||||||||||||||||
|---|---|---|---|---|---|---|---|---|---|---|---|---|---|---|---|---|---|---|---|---|---|---|---|---|---|
| 1920 - Unknown | Evidence from Observations: Reported | ||||||||||||||||||||||||
|
List of 3 Events for Episode 1
| |||||||||||||||||||||||||
1899 Jun 2 Confirmed Eruption Max VEI: 2
| Episode 1 | Eruption Episode | ||||||||||||||||||||
|---|---|---|---|---|---|---|---|---|---|---|---|---|---|---|---|---|---|---|---|---|
| 1899 Jun 2 - Unknown | Evidence from Observations: Reported | |||||||||||||||||||
|
List of 2 Events for Episode 1
| ||||||||||||||||||||
1864 Confirmed Eruption Max VEI: 2
| Episode 1 | Eruption Episode | ||||||||||||||||||||
|---|---|---|---|---|---|---|---|---|---|---|---|---|---|---|---|---|---|---|---|---|
| 1864 - Unknown | Evidence from Observations: Reported | |||||||||||||||||||
|
List of 2 Events for Episode 1
| ||||||||||||||||||||
1852 Oct 5 - 1852 Oct 6 Confirmed Eruption Max VEI: 2
| Episode 1 | Eruption Episode | K2 crater | |||||||||||||||||||||||||||||
|---|---|---|---|---|---|---|---|---|---|---|---|---|---|---|---|---|---|---|---|---|---|---|---|---|---|---|---|---|---|---|
| 1852 Oct 5 - 1852 Oct 6 | Evidence from Observations: Reported | |||||||||||||||||||||||||||||
|
List of 4 Events for Episode 1 at K2 crater
| ||||||||||||||||||||||||||||||
1849 Oct 6 Confirmed Eruption Max VEI: 2
| Episode 1 | Eruption Episode | ||||||||||||||||||||
|---|---|---|---|---|---|---|---|---|---|---|---|---|---|---|---|---|---|---|---|---|
| 1849 Oct 6 - Unknown | Evidence from Observations: Reported | |||||||||||||||||||
|
List of 2 Events for Episode 1
| ||||||||||||||||||||
1819 Confirmed Eruption Max VEI: 2
| Episode 1 | Eruption Episode | ||||||||||||||||||||
|---|---|---|---|---|---|---|---|---|---|---|---|---|---|---|---|---|---|---|---|---|
| 1819 - Unknown | Evidence from Observations: Reported | |||||||||||||||||||
|
List of 2 Events for Episode 1
| ||||||||||||||||||||
1660 Confirmed Eruption Max VEI: 3
| Episode 1 | Eruption Episode | ||||||||||||||||||||
|---|---|---|---|---|---|---|---|---|---|---|---|---|---|---|---|---|---|---|---|---|
| 1660 - Unknown | Evidence from Observations: Reported | |||||||||||||||||||
|
List of 2 Events for Episode 1
| ||||||||||||||||||||
There is no Deformation History data available for Lewotolok.
There is no Emissions History data available for Lewotolok.
 Lewotolo volcano, rising here above the village of Jontona, anchors the eastern end of the northern peninsula that is connected to Lembata (formerly Lomblen) Island by a narrow isthmus. The symmetrical stratovolcano contains a small cone with a 130-m-wide crater constructed at the SE side of a larger crater that forms the volcano's summit. Many lava flows have reached the coastline. Historical eruptions, recorded since 1660, have consisted of explosive activity from the summit crater.
 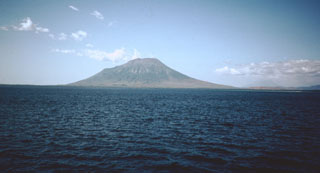 Lewotolo, seen here from the Flores Sea NW of the volcano, anchors the eastern end of the northern peninsula that is connected to Lomblen Island by a narrow isthmus. Many lava flows have reached the coastline of the peninsula. Historical eruptions from Lewotolo have been recorded since 1660 and have consisted of explosive activity from the summit crater.
 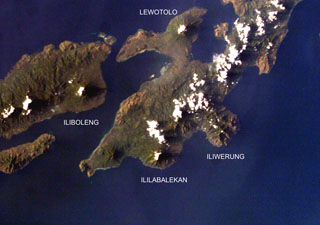 Four volcanoes are seen in this NASA International Space Station image (with north to the upper left) of Solor (lower left), Adonara (upper left), and Lembata (right) Islands. Ililabalekan volcano on SW Lembata (formerly Lomblen) Island is the only one of these without historical eruptions, although fumaroles are found near its summit. A satellitic cone was constructed on the SE flank of the steep-sided volcano, and four craters, one of which contains a lava dome and two small explosion pits, occur at the summit of Mount Labalekan.
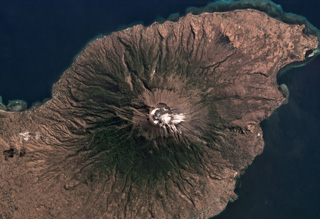 The approximately 800-m-diameter Lewotolo summit crater is in the center of this July 2019 Planet Labs satellite image monthly mosaic (N is at the top). A smaller cone with a 100-m-wide crater has formed along the main crater rim. Lighter colored deposits are seen at the summit area and erosion has formed gullies down the flanks.
The maps shown below have been scanned from the GVP map archives and include the volcano on this page. Clicking on the small images will load the full 300 dpi map. Very small-scale maps (such as world maps) are not included. The maps database originated over 30 years ago, but was only recently updated and connected to our main database. We welcome users to tell us if they see incorrect information or other problems with the maps; please use the Contact GVP link at the bottom of the page to send us email.
There are no samples for Lewotolok in the Smithsonian's NMNH Department of Mineral Sciences Rock and Ore collection.
| Copernicus Browser | The Copernicus Browser replaced the Sentinel Hub Playground browser in 2023, to provide access to Earth observation archives from the Copernicus Data Space Ecosystem, the main distribution platform for data from the EU Copernicus missions. |
| MIROVA | Middle InfraRed Observation of Volcanic Activity (MIROVA) is a near real time volcanic hot-spot detection system based on the analysis of MODIS (Moderate Resolution Imaging Spectroradiometer) data. In particular, MIROVA uses the Middle InfraRed Radiation (MIR), measured over target volcanoes, in order to detect, locate and measure the heat radiation sourced from volcanic activity. |
| MODVOLC Thermal Alerts | Using infrared satellite Moderate Resolution Imaging Spectroradiometer (MODIS) data, scientists at the Hawai'i Institute of Geophysics and Planetology, University of Hawai'i, developed an automated system called MODVOLC to map thermal hot-spots in near real time. For each MODIS image, the algorithm automatically scans each 1 km pixel within it to check for high-temperature hot-spots. When one is found the date, time, location, and intensity are recorded. MODIS looks at every square km of the Earth every 48 hours, once during the day and once during the night, and the presence of two MODIS sensors in space allows at least four hot-spot observations every two days. Each day updated global maps are compiled to display the locations of all hot spots detected in the previous 24 hours. There is a drop-down list with volcano names which allow users to 'zoom-in' and examine the distribution of hot-spots at a variety of spatial scales. |
|
WOVOdat
Single Volcano View Temporal Evolution of Unrest Side by Side Volcanoes |
WOVOdat is a database of volcanic unrest; instrumentally and visually recorded changes in seismicity, ground deformation, gas emission, and other parameters from their normal baselines. It is sponsored by the World Organization of Volcano Observatories (WOVO) and presently hosted at the Earth Observatory of Singapore.
GVMID Data on Volcano Monitoring Infrastructure The Global Volcano Monitoring Infrastructure Database GVMID, is aimed at documenting and improving capabilities of volcano monitoring from the ground and space. GVMID should provide a snapshot and baseline view of the techniques and instrumentation that are in place at various volcanoes, which can be use by volcano observatories as reference to setup new monitoring system or improving networks at a specific volcano. These data will allow identification of what monitoring gaps exist, which can be then targeted by remote sensing infrastructure and future instrument deployments. |
| Volcanic Hazard Maps | The IAVCEI Commission on Volcanic Hazards and Risk has a Volcanic Hazard Maps database designed to serve as a resource for hazard mappers (or other interested parties) to explore how common issues in hazard map development have been addressed at different volcanoes, in different countries, for different hazards, and for different intended audiences. In addition to the comprehensive, searchable Volcanic Hazard Maps Database, this website contains information about diversity of volcanic hazard maps, illustrated using examples from the database. This site is for educational purposes related to volcanic hazard maps. Hazard maps found on this website should not be used for emergency purposes. For the most recent, official hazard map for a particular volcano, please seek out the proper institutional authorities on the matter. |
| IRIS seismic stations/networks | Incorporated Research Institutions for Seismology (IRIS) Data Services map showing the location of seismic stations from all available networks (permanent or temporary) within a radius of 0.18° (about 20 km at mid-latitudes) from the given location of Lewotolok. Users can customize a variety of filters and options in the left panel. Note that if there are no stations are known the map will default to show the entire world with a "No data matched request" error notice. |
| UNAVCO GPS/GNSS stations | Geodetic Data Services map from UNAVCO showing the location of GPS/GNSS stations from all available networks (permanent or temporary) within a radius of 20 km from the given location of Lewotolok. Users can customize the data search based on station or network names, location, and time window. Requires Adobe Flash Player. |
| DECADE Data | The DECADE portal, still in the developmental stage, serves as an example of the proposed interoperability between The Smithsonian Institution's Global Volcanism Program, the Mapping Gas Emissions (MaGa) Database, and the EarthChem Geochemical Portal. The Deep Earth Carbon Degassing (DECADE) initiative seeks to use new and established technologies to determine accurate global fluxes of volcanic CO2 to the atmosphere, but installing CO2 monitoring networks on 20 of the world's 150 most actively degassing volcanoes. The group uses related laboratory-based studies (direct gas sampling and analysis, melt inclusions) to provide new data for direct degassing of deep earth carbon to the atmosphere. |
| Large Eruptions of Lewotolok | Information about large Quaternary eruptions (VEI >= 4) is cataloged in the Large Magnitude Explosive Volcanic Eruptions (LaMEVE) database of the Volcano Global Risk Identification and Analysis Project (VOGRIPA). |
| EarthChem | EarthChem develops and maintains databases, software, and services that support the preservation, discovery, access and analysis of geochemical data, and facilitate their integration with the broad array of other available earth science parameters. EarthChem is operated by a joint team of disciplinary scientists, data scientists, data managers and information technology developers who are part of the NSF-funded data facility Integrated Earth Data Applications (IEDA). IEDA is a collaborative effort of EarthChem and the Marine Geoscience Data System (MGDS). |

