


AVO reported that seismicity at Bogoslof had declined during the previous three weeks to background levels and the last moderate earthquake, a M 2.7, was recorded on 9 November. No other signs of unrest were detected. Both the Volcano Alert Level and the Aviation Color Code were changed to Unassigned on 24 November. A seismic swarm had started around 22 October and was characterized by 5-10 events per hour and a total of around 1,100 earthquakes per week at the peak. The volcano was monitored by a single local seismic station, distant seismic and infrasound instruments, satellite data, and lightning networks.
Source: US Geological Survey Alaska Volcano Observatory (AVO)
Explosions in July and August 2017; new lava dome visible 20-22 August destroyed by explosions that end on 30 August
Intermittent eruptions from Bogoslof, 40 km N of the main Aleutian arc (BGVN 42:09, figure 2), have created and destroyed several distinct islands at the summit of this submarine volcano. Previous eruptions in 1927 and 1992 created lava domes that were subsequently heavily eroded, before the most recent eruption began in December 2016 (figure 16). Numerous explosions with ash plumes significantly changed the morphology of the island between December 2016 and March 2017. Ash plumes rose to over 10 km altitude during May-July 2017 multiple times. A lava dome briefly emerged in early June before it was destroyed by subsequent explosions. This report continues with an account of activity between July and December 2017. Eruptive activity ended on 30 August. Information comes primarily from the Alaska Volcano Observatory (AVO) and the Anchorage Volcanic Ash Advisory Center (VAAC).
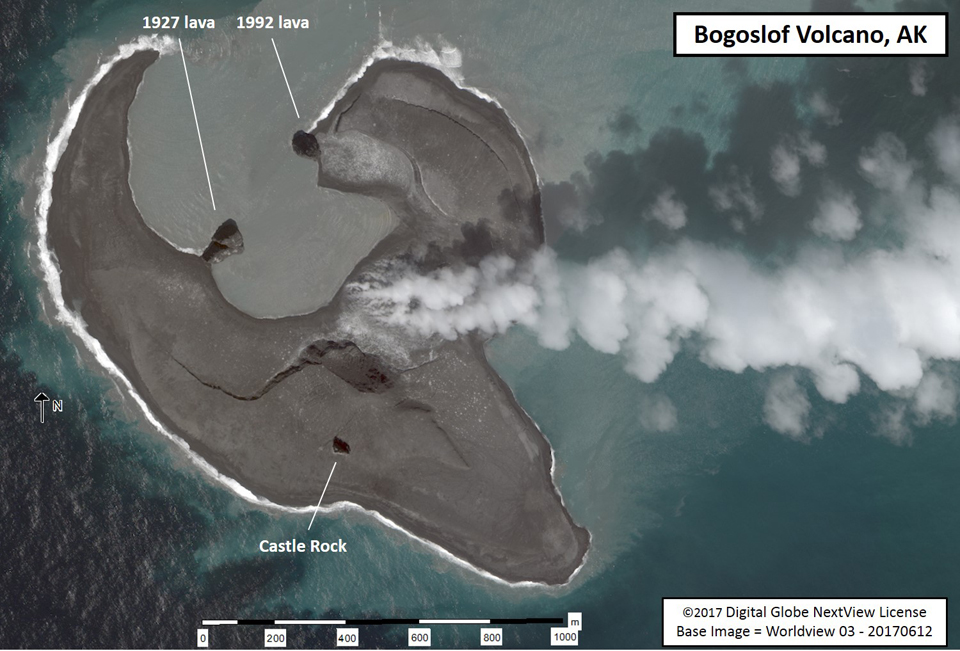 |
Figure 16. Worldview satellite image of Bogoslof collected at 2313 UTC on 12 June 2017, two days after a lava dome that appeared in the lagoon was destroyed. The circular embayments were formed by a series of more than 40 explosions that began in mid-December 2016. These explosions greatly reshaped the island as material was removed and redeposited as air fall. Vigorous steaming was visible from a region S of the most active vent areas in the lagoon. Lava extrusion produced a circular dome that first rose above the water on 5 June and grew to a diameter of ~160 m before being destroyed by an explosion early in the day on 10 June. Courtesy of AVO. |
New explosions during 2, 4, 8, and 9-10 July 2017 produced ash plumes that rose from 6.1 to 11 km altitude. Although significant ash clouds were produced, there were no reports of ashfall in nearby communities. After almost a month of quiet, an eruption on 7 August created new tephra deposits, and extended the N shore of the island. This eruption created a significant SO2 plume that was recorded by satellite instruments. Intermittent pulses of tremor were recorded during mid-August. A new lava dome grew between 20 and 22 August to 160 m in diameter before it was destroyed in a series of explosions during 26-30 August. Thermal anomalies were observed in satellite data several times during September, and they tapered off into early October. Steam emissions were still visible in early November when the last weak thermal anomaly was reported. By early December, significant erosion had begun to change the island's shape, and only minor steam emissions were visible in clear satellite images.
Beginning at 1248 local time (AKDT) on 2 July 2017, a significant explosive event was detected in seismic and infrasound data, and observed in satellite imagery. The event lasted about 16 minutes, and produced an ash plume that rose to 11 km altitude and drifted E, passing N of Dutch Harbor. No explosions were reported the following day, but two events were detected in seismic, infrasound, and satellite data on 4 July. The first, at 1651, lasted 13 minutes and produced an eruption cloud that rose to 8.5 km altitude and drifted SE; the second 11-minute-long eruption began at 1907, and produced a small cloud that rose to 9.8 km altitude and drifted SE.
On the morning of 8 July 2017, an eruption with a total duration of 19 minutes began at 1015 AKDT and produced a volcanic cloud reaching an altitude of 9.1 km that drifted N. Overnight during 9-10 July Bogoslof erupted several times; the first two explosions during the 3-hour-long eruption produced a small ash cloud that rose to 6.1 km altitude and drifted SE, dissipating rapidly. Later on 10 July, an 8-minute-long eruption began at 1000 AKDT and a 15-minute-long eruption began at 1706 AKDT; neither produced a significant plume. None of the eruptions on 8, 9, or 10 July caused ashfall in local communities. Weakly elevated surface temperatures were observed in clear satellite images on 12 and 16 July.
Following almost a month of quiet, Bogoslof erupted again on 7 August 2017. The eruption was detected in seismic, infrasound, satellite, and lightning data. The eruption began at 1000 AKDT and lasted for about three hours, producing an ash plume that rose to 9.7 km altitude according to AVO, and drifted S over Umnak Island, then out over the Pacific Ocean. The Anchorage VAAC initially reported the plume at 10.4 km altitude moving S. A later pilot report noted an altitude of 12.2 km. Satellite measurements of sulfur dioxide (SO2) in the eruption cloud indicated the second highest mass of SO2 erupted since the onset of activity in December 2016 (figure 17). Satellite images of the island taken on 8 August showed new tephra deposits had surrounded the vent area, forming a new crater lake, and extending the N shore of the island by 250 m (figure 18).
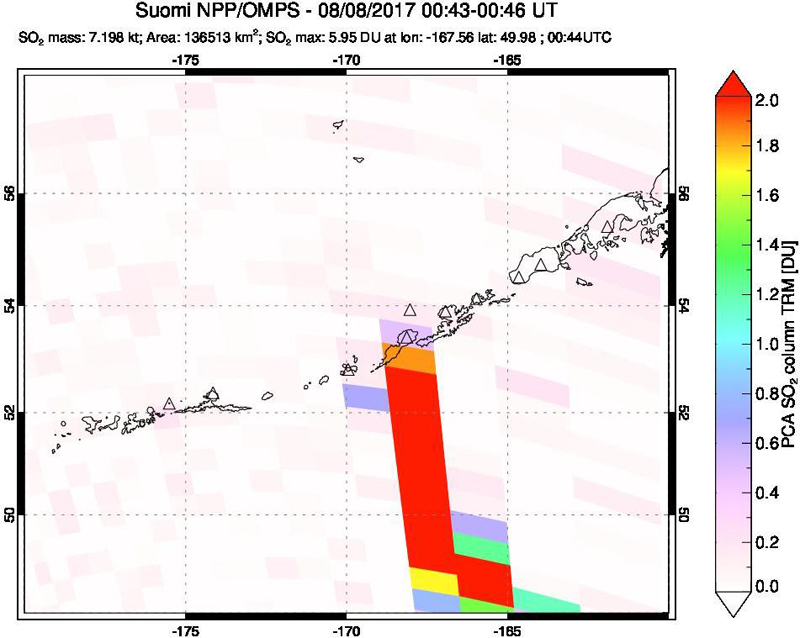 |
Figure 17. Although the data is coarsely pixelated, it is clear that a substantial SO2 plume emerged from Bogoslof during the 7 August eruption, as recorded by the OMPS instrument on the Suomio NPP satellite. Courtesy of NASA Goddard Space Flight Center. |
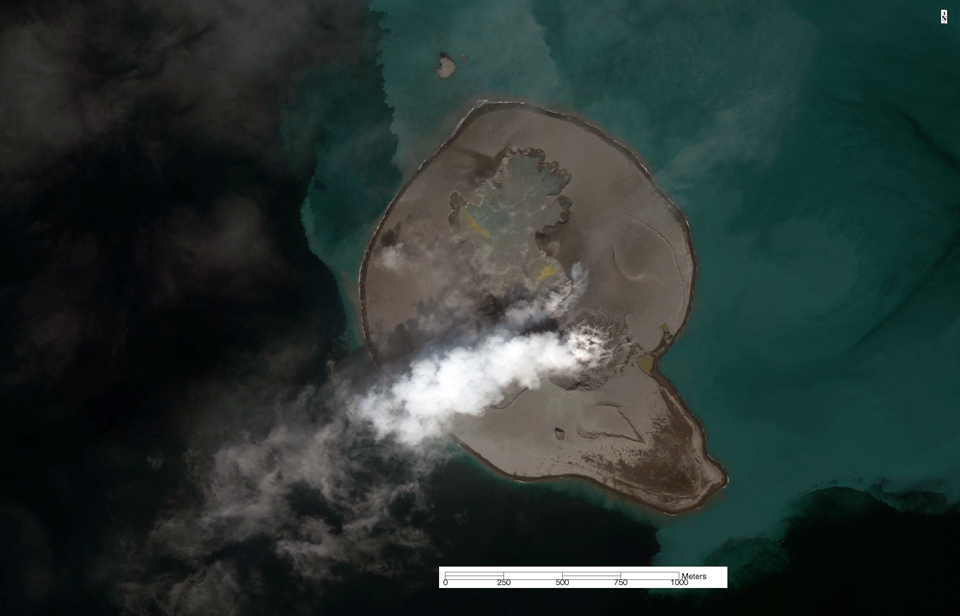 |
Figure 18. Worldview true-color satellite image of Bogoslof acquired on 8 August 2017, one day after a 3-hour-long explosive eruption. Ashfall deposits have expanded the island towards the N as the result of the eruption and formed an enclosed crater lake. At the time of this satellite overpass, the level of the crater lake was below sea level. Previous events such as these (that formed a shallow crater lake) formed a deep crater that was subsequently filled by an influx of ocean water. Vigorous steaming was apparent from the likely site of the initial explosive event in mid-December 2016. Sediment coming from erosion of the island is seen offshore surrounding most of the island. A comparison with figure 16, above, shows the extent of new material added on 7 August. Data provided under the Digital Globe NextView License. Courtesy of AVO. |
Several short-duration seismic and infrasound signals were detected at the stations on nearby islands on 9 August 2017. Weakly elevated surface temperatures and a minor steam plume were observed in satellite images. Two short pulses of tremor were seen in seismic data on 14 August, one lasting five minutes and the other lasting three minutes. Seismicity returned to background levels following the pulses and remained quiet until a series of small earthquakes the next morning. Seismicity again returned to background levels by the following afternoon, 16 August, and remained quiet through the rest of that week. Photographs taken during an overflight on 15 August indicated that the vent region, which had dried out during the 7 August eruption, had refilled with water (figure 19).
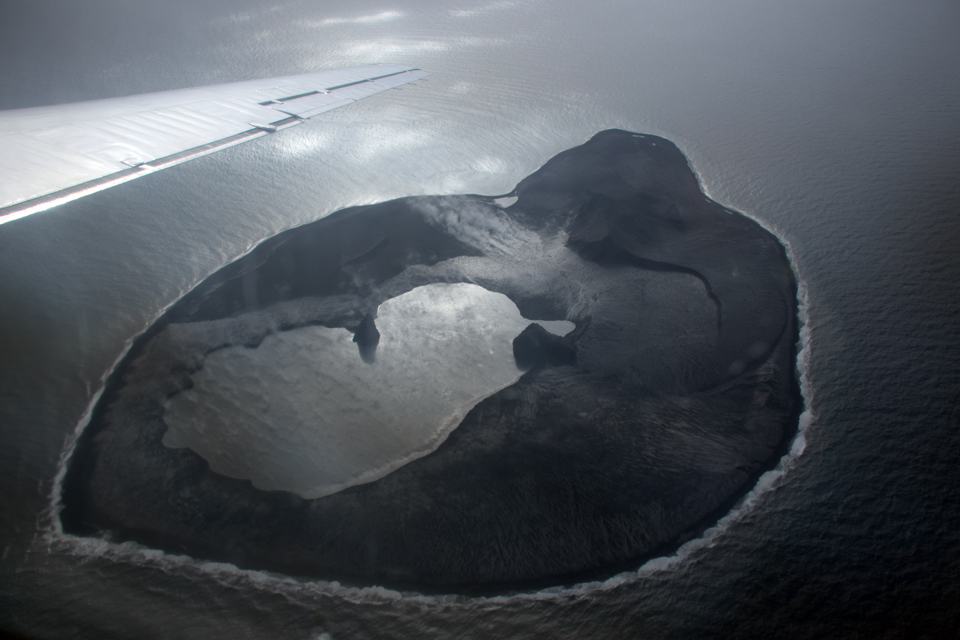 |
Figure 19. An overflight of Bogoslof on 15 August 2017 showed the increase in area of the crater lake after the eruption of 7 August (see figure 18). View is to the SE. Courtesy of AVO. |
Unrest continued during mid-August 2017, and available data suggested that a lava dome had formed within the intra-island lake just W of the 1992 lava dome. The new dome was first observed on 18 August, and during 20-22 August grew to about 160 m in diameter. Two small explosions were detected in infrasound data at 0410 AKDT on 22 August. These explosions did not produce any volcanic plumes recognizable in satellite data. Elevated surface temperatures were observed on 24 August along with a steam plume extending S about 17 km from the island. Satellite images showed elevated surface temperatures and a robust steam plume the next day drifting 70 km SE. A photo from a nearby low-altitude airplane on 26 August, taken shortly before the next explosion, confirmed the intense steam plume (figure 20) likely caused by the interaction of the new dome with seawater. Two MODVOLC thermal alerts were issued on 25 August, the first two since January 2017, and the last two for the year.
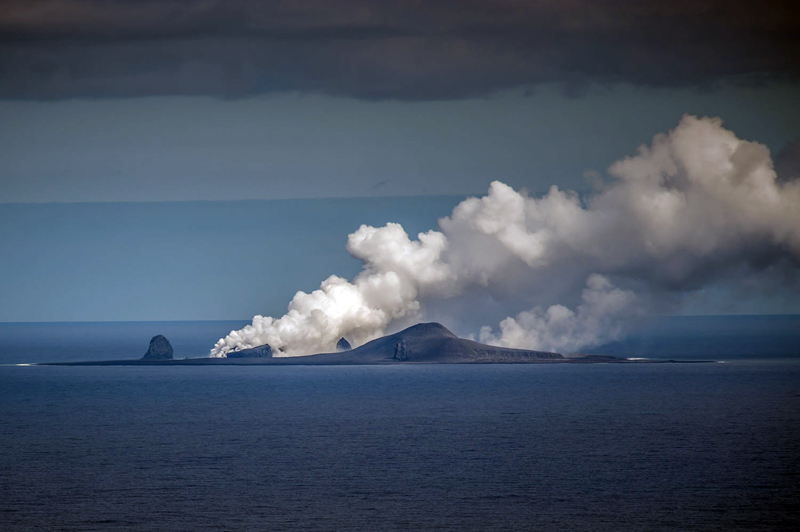 |
Figure 20. Bogoslof volcano with a vigorous steam plume likely caused by interaction of the new, hot lava dome with seawater. Photo by Dave Withrow (NOAA/Fisheries), taken at about 1300 AKDT on 26 August aboard a NOAA twin otter (N56RF) aircraft while surveying harbor seals west of Dutch Harbor. They were 13 nautical miles (24 km) from Bogoslof when photo was taken looking E with a 400 mm lens. Courtesy of AVO. |
An explosive eruption at 1629 AKDT on 26 August 2017 lasted for about four minutes and produced a cloud that was observed in satellite images drifting SE over southern Unalaska Island. Cloud-top temperatures seen in satellite data indicated that it rose as high as 7.3 km altitude. The Anchorage VAAC reported the plume at 8.2 km altitude several hours later. The eruption was observed in seismic, infrasound, and satellite data, and one lightning stroke was detected. Elevated surface temperatures persisted, suggesting to AVO scientists that the lava dome was possibly still present within the crater lake. Three short-duration eruptive events occurred during 27-28 August. On 27 August at 1508 AKDT a brief explosive event lasting about two minutes produced a volcanic cloud that reached about 7.9 km altitude and drifted SE. Another explosive eruption occurred at 0323 AKDT on 28 August and lasted about 25 minutes. Satellite imagery showed only a very small eruption cloud drifting ESE that dissipated quickly. The third event occurred at 1117 AKDT that morning and produced a small ash cloud that likely reached 9 km altitude before dissipating over the North Pacific Ocean. Modeling of ash fallout from the cloud indicated trace to minor ash fall over the Southern Bering Sea in the area just S of the volcano.
Elevated surface temperatures were noted in satellite data on 29 August, along with a steam plume drifting SSE, suggesting to AVO the presence of lava at the surface. An explosive eruption began the next morning at 0405 AKDT and continued intermittently for almost two hours. It produced an ash cloud that reached to about 6 km altitude and drifted SSE, dissipating over the southern Bering Sea and North Pacific Ocean area. A vapor plume extended about 65 km SSE later that day.
AVO reported on 8 September 2017 that available data suggested that the most recent lava dome, first observed on 18 August, was removed by the explosive eruptions of 27-30 August. In addition, a narrow isthmus of new land extended across the crater, bisecting it and creating two lakes. Elevated surface temperatures were recorded in a satellite images on 11, 14, 17, 19, and 23 September. Discolored water was visible in satellite images on 17 September and may have represented outflow from the crater. Elevated surface temperatures continued to be observed in satellite data during periods of clear weather into the first two weeks of October, and again briefly at the beginning of November. Several areas of steam emissions were visible in satellite imagery on 9 October (figure 21).
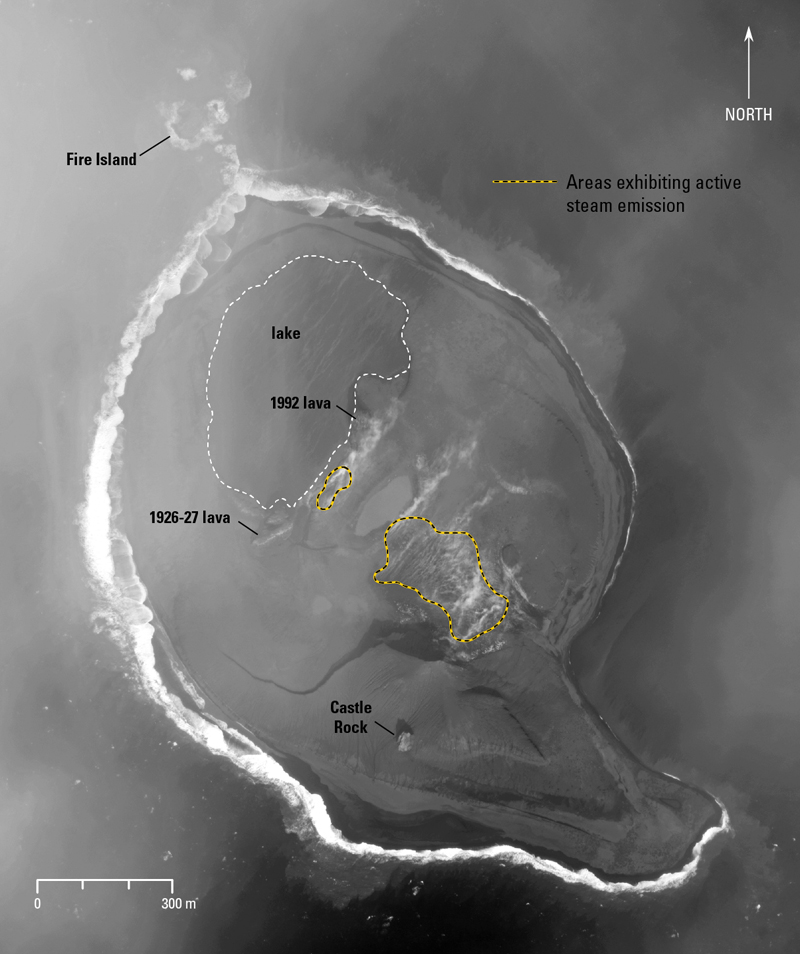 |
Figure 21. Worldview-3 satellite image of Bogoslof Island acquired on 9 October 2017. The areas that exhibited active steam emission are highlighted with yellow and black dashed lines. Image data acquired with the Digital Globe NextView License. Courtesy of AVO. |
A clear, high-resolution satellite image taken on 2 November showed continued steaming of the ground on the S side of the smaller crater lake. Weakly elevated surface temperatures consistent with a hot crater lake were last observed in clear nighttime satellite images on 10 November 2017. Imagery from 20 November showed warm regions in the crater lagoon and at the site of the steaming that had persisted for several months (see figure 21). AVO scientists noted that this was consistent with a slowly cooling, post-eruptive system, and was likely responsible for the occasional observation of slightly elevated surface temperatures in satellite data. The MIROVA graph of thermal anomalies supported the slow cooling trend observed by AVO after the last explosions on 30 August 2017 (figure 22).
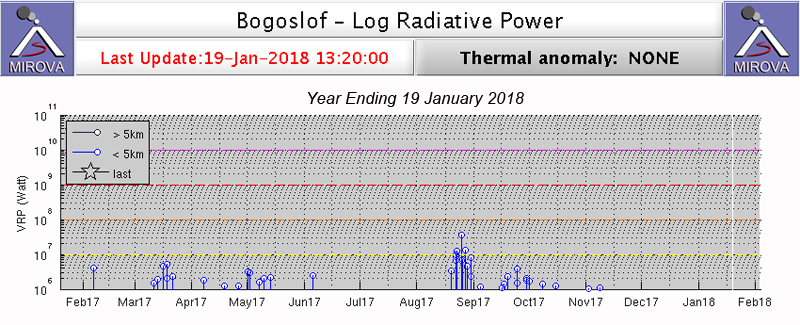 |
Figure 22. The last series of explosive events recorded at Bogoslof during 26-30 August 2017 coincided with the last significant thermal anomalies on the MIROVA graph (infrared MODIS data) that covers the year ending on 19 January 2018. Gradual tapering of thermal anomalies is consistent with AVO satellite observations of a cooling trend during September through early November. Courtesy of MIROVA. |
More than sixty explosive events occurred between 20 December 2016 and 30 August 2017. The most energetic of these sent water-rich, volcanic ash clouds to altitudes exceeding 10.7 km. The resulting dispersed volcanic clouds impacted local and international aviation operations over portions of the North Pacific and Alaska. Although most of the volcanic ash fell into the ocean, trace amounts were twice deposited on the community of Unalaska and the Port of Dutch Harbor. The 2016-17 eruption greatly changed the morphology of Bogoslof Island. At its greatest extent, the area of the island increased to about three times its pre-eruption size. Nearly all of the new material on the island is unconsolidated pyroclastic fall and flow (surge) deposits. The deposits are highly susceptible to wave erosion and additional changes in the configuration of the island are likely. A satellite image from 3 December 2017 shows significant erosion of the island with the vent lagoon opened to the ocean on the north shore of the island (figure 23).
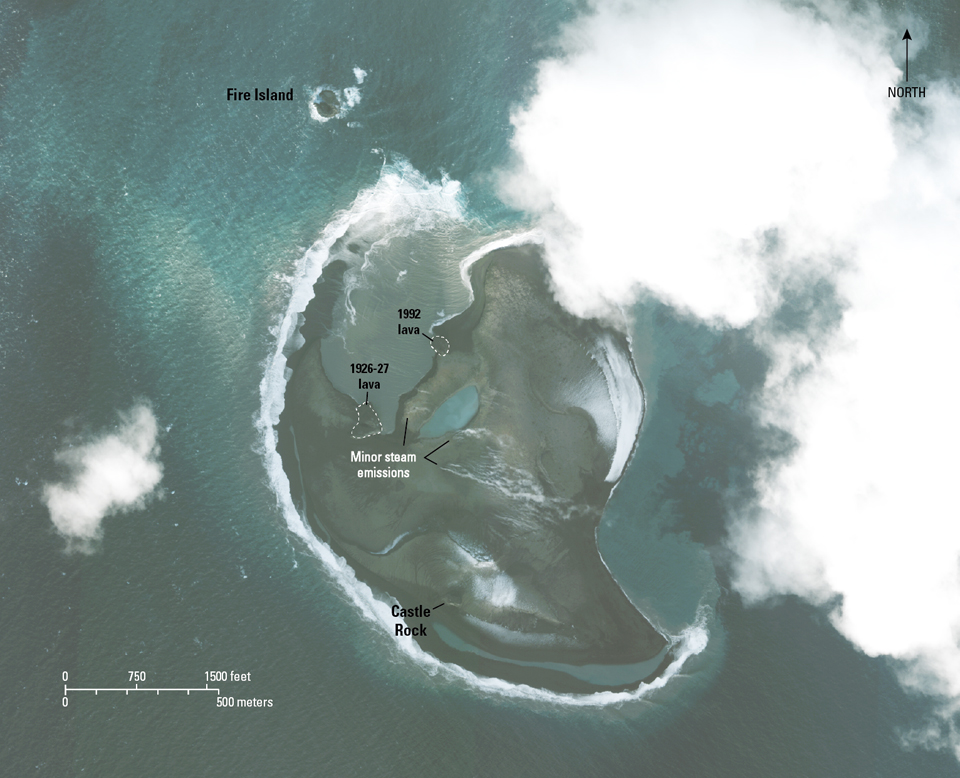 |
Figure 23. Worldview-3 satellite image of Bogoslof Island on 3 December 2017. Erosion of the island by waves had removed substantial material, and no new eruptive material had been added to the island since the end of August 2017. The approximate area of the island in this image was 1.3 square kilometers. Image data acquired with the Digital Globe NextView License. Courtesy of AVO. |
Information Contacts: Alaska Volcano Observatory (AVO), a cooperative program of a) U.S. Geological Survey, 4200 University Drive, Anchorage, AK 99508-4667 USA (URL: http://www.avo.alaska.edu/ ), b) Geophysical Institute, University of Alaska, PO Box 757320, Fairbanks, AK 99775-7320, USA, and c) Alaska Division of Geological & Geophysical Surveys, 794 University Ave., Suite 200, Fairbanks, AK 99709, USA (URL: http://www.dggs.alaska.gov/); Anchorage Volcanic Ash Advisory Center (VAAC), Alaska Aviation Weather Unit, NWS NOAA US Dept of Commerce, 6930 Sand Lake Road, Anchorage, AK 99502-1845(URL: http://vaac.arh.noaa.gov/); MIROVA (Middle InfraRed Observation of Volcanic Activity), a collaborative project between the Universities of Turin and Florence (Italy) supported by the Centre for Volcanic Risk of the Italian Civil Protection Department (URL: http://www.mirovaweb.it/); Hawai'i Institute of Geophysics and Planetology (HIGP), MODVOLC Thermal Alerts System, School of Ocean and Earth Science and Technology (SOEST), Univ. of Hawai'i, 2525 Correa Road, Honolulu, HI 96822, USA (URL: http://modis.higp.hawaii.edu/); NASA Goddard Space Flight Center (NASA/GSFC), Global Sulfur Dioxide Monitoring Page, Atmospheric Chemistry and Dynamics Laboratory, 8800 Greenbelt Road, Goddard, Maryland, USA (URL: https://so2.gsfc.nasa.gov/).
2023: October
| November
2017: January
| February
| March
| April
| May
| June
| July
| August
| September
| December
2016: December
AVO reported that seismicity at Bogoslof had declined during the previous three weeks to background levels and the last moderate earthquake, a M 2.7, was recorded on 9 November. No other signs of unrest were detected. Both the Volcano Alert Level and the Aviation Color Code were changed to Unassigned on 24 November. A seismic swarm had started around 22 October and was characterized by 5-10 events per hour and a total of around 1,100 earthquakes per week at the peak. The volcano was monitored by a single local seismic station, distant seismic and infrasound instruments, satellite data, and lightning networks.
Source: US Geological Survey Alaska Volcano Observatory (AVO)
Unrest continued at Bogoslof during 25-31 October with numerous daily earthquakes recorded in seismic data. No additional signs of unrest were recorded in satellite data. The Volcano Alert Level remained at Advisory (the second level on a four-level scale) and the Aviation Color Code remained at Yellow (the second color on a four-color scale).
Source: US Geological Survey Alaska Volcano Observatory (AVO)
AVO raised the Volcano Alert Level for Bogoslof to Advisory (the second level on a four-level scale) and the Aviation Color Code to Yellow (the second color on a four-color scale) on 24 October due to increased seismicity. Over 90 earthquakes were detected in the vicinity of the volcano during the previous three days. No signs of unrest had been recorded in satellite data over the past several days.
Source: US Geological Survey Alaska Volcano Observatory (AVO)
On 6 December AVO decreased the Aviation Color Code and Volcano Alert Level for Bogoslof to Unassigned, noting that no significant activity had been observed in seismic, infrasound, satellite, or lightning data during the past three months. The last detected explosive activity occurred on 30 August 2017.
Source: US Geological Survey Alaska Volcano Observatory (AVO)
On 27 September AVO reported that the last explosion at Bogoslof was detected on 30 August, and no new volcanic activity was observed in satellite, seismic, or infrasound data since then. The Aviation Color Code was lowered to Yellow and the Volcano Alert Level was lowered to Advisory.
Source: US Geological Survey Alaska Volcano Observatory (AVO)
AVO reported that during 20-26 September nothing significant was observed in partly to mostly cloudy satellite images of Bogoslof, and no activity was detected in seismic or infrasound data. Weakly elevated surface temperatures were identified in satellite images during 22-23 September, indicating ongoing unrest. The Aviation Color Code remained at Orange and the Volcano Alert Level remained at Watch.
Source: US Geological Survey Alaska Volcano Observatory (AVO)
AVO reported that during 13-19 September nothing significant was observed in partly to mostly cloudy satellite images of Bogoslof, and no activity was detected in seismic or infrasound data. Weakly elevated surface temperatures were identified in satellite images during 13-14 and 16-17 September, indicating ongoing unrest. On 17 September discolored ocean water was visible in satellite data, possibly representing outflow from the crater. The Aviation Color Code remained at Orange and the Volcano Alert Level remained at Watch.
Source: US Geological Survey Alaska Volcano Observatory (AVO)
AVO reported that during 6-12 September nothing significant was observed in mostly cloudy satellite images of Bogoslof, and no activity was detected in seismic or infrasound data. The 8 September report noted that the crater lake had been bisected by a narrow isthmus of land. Elevated surface temperatures were identified in one satellite image during 10-11 September. The Aviation Color Code remained at Orange and the Volcano Alert Level remained at Watch.
Source: US Geological Survey Alaska Volcano Observatory (AVO)
AVO reported that an explosive event at Bogoslof began at 0405 on 30 August and continued intermittently until 0555; the event produced a low-level ash plume that rose to around 6.1 km (20,000 ft) a.s.l. and drifted SSE. Later that day seismic and infrasound data showed quiet conditions, and a low-level plume (likely steam) drifted almost 65 km SSE. Satellite, infrasound, and seismic data showed nothing notable during 31 August-5 September. The Aviation Color Code remained at Orange and the Volcano Alert Level remained at Watch.
Source: US Geological Survey Alaska Volcano Observatory (AVO)
AVO reported that a satellite image of Bogoslof acquired at 0628 on 24 August showed elevated surface temperatures and a small plume that was most likely steam drifting 17 km S. During 24-25 August a robust steam plume drifting 70 km SE and elevated surface temperatures were identified in satellite data. A four-minute-long explosion that began at 1629 on 26 August generated an eruption cloud that rose 8.2 km (27,000 ft) a.s.l. and drifted SE. The event was also observed in seismic and infrasound data, and one lightning stroke was detected.
Three short-duration eruptive events occurred during 27-28 August. The first, a two-minute-long explosion at 1508 on 27 August, produced a volcanic cloud that rose 7.9 km (26,000 ft) a.s.l. and drifted SE. The second event started at 0323 on 28 August and lasted 25 minutes. The resulting small cloud drifted ESE and quickly dissipated. The third event was detected at 1117 on 28 August and generated a small volcanic cloud that rose 7.6-9.1 (25,000-30,000 ft) a.s.l. Slightly elevated surface temperatures were observed in a few satellite images during 28-29 August. The Aviation Color Code remained at Orange and the Volcano Alert Level remained at Watch.
Source: US Geological Survey Alaska Volcano Observatory (AVO)
AVO reported that photographs of Bogoslof taken during an overflight on 15 August showed that the vent area (which had dried out during the 7 August eruption) had refilled with water. Seismicity decreased on 16 August and remained low at least through 18 August. Weakly elevated surface temperatures consistent with a warm lake were identified in satellite data during 19-20 August. Satellite data acquired on 21 August showed an approximately 125-m-diameter lava dome within the intra-island lake, just W of the 1992 lava dome. A cold volcanic plume, likely from the lava dome, drifted about 55 km S of the island. Some minor explosions were detected in infrasound data at about 0410 on 22 August. The lava dome had grown to 160 m in diameter. The Aviation Color Code remained at Orange and the Volcano Alert Level remained at Watch.
Source: US Geological Survey Alaska Volcano Observatory (AVO)
AVO reported that on 9 August seismic and infrasound data suggested low-level eruptive activity at Bogoslof; weakly elevated surface temperatures and a minor steam emission were identified in satellite images. No significant activity was observed in cloudy satellite images, and no activity was detected in seismic, infrasound, or lightning data during 10-13 August. Two short pulses of tremor were detected (at 0853, lasting five minutes, and at 0913, lasting three minutes) in seismic data; seismicity returned to baseline levels afterwards. A sequence of seismic events began at 0000 on 15 August; no activity was observed in infrasound, lightning, or satellite data. The Aviation Color Code remained at Orange and the Volcano Alert Level remained at Watch.
Source: US Geological Survey Alaska Volcano Observatory (AVO)
AVO reported that during 2-6 August no activity at Bogoslof was observed in mostly cloudy satellite images, and no activity was detected in seismic, infrasound, or lightning data. An explosive eruption began at 1000 on 7 August, following more than an hour of increased seismicity. A pilot reported that an ash cloud rose to an altitude of 9.8 km (32,000 ft) a.s.l., prompting AVO to raise the Aviation Color Code (ACC) to Red and the Volcano Alert Level (VAL) to Warning. The eruption lasted about three hours, and was longer lived than most of the events in the eruptive sequence that started in December 2016. At 1341 AVO noted that the ash plume had formed a continuous cloud which stayed attached to the volcano and drifted S. The ACC was lowered to Orange and the VAL was lowered to Watch on 8 August. Satellite images acquired on 8 August showed a significant expansion of the island towards the N with thick tephra deposits around the vent area forming a new crater lake.
Source: US Geological Survey Alaska Volcano Observatory (AVO)
AVO reported that during 26 July-1 August no activity at Bogoslof was observed in partly cloudy to clear satellite images, and no activity was detected in seismic, infrasound, or lightning data. The Aviation Color Code remained at Orange and the Volcano Alert Level remained at Watch.
Source: US Geological Survey Alaska Volcano Observatory (AVO)
AVO reported that during 19-25 July no significant activity at Bogoslof was observed in cloudy or mostly cloudy satellite images, and no activity was detected in seismic, infrasound, or lightning data. The Aviation Color Code remained at Orange and the Volcano Alert Level remained at Watch.
Source: US Geological Survey Alaska Volcano Observatory (AVO)
AVO reported that during 12-18 July no significant activity at Bogoslof was observed in cloudy or mostly cloudy satellite images; weakly elevated surface temperatures were noted on 12 and 16 July. In addition no activity was detected in seismic, infrasound, or lightning data. The Aviation Color Code remained at Orange and the Volcano Alert Level remained at Watch.
Source: US Geological Survey Alaska Volcano Observatory (AVO)
On 5 July AVO reported that no further activity was detected at Bogoslof after the explosions the day before; the Aviation Color Code (ACC) was lowered to Orange and the Volcano Alert Level (VAL) was lowered to Watch. A nine-minute-long eruption pulse was detected in seismic data starting at 1015 on 8 July was followed by a shorter pulse that began at 1029 and then a decline in seismicity. An ash plume identified in satellite images rose 9.1 km (30,000 ft) a.s.l. and drifted N. AVO raised the ACC to Red and the VAL to Warning, but lowered them back down to Orange and Watch, respectively, the next day. An eruption began at 2347 on 9 July, lasted five minutes, and was followed 15 minutes later by another explosion that lasted seven minutes. A small ash cloud visible in satellite images drifting SE may have risen as high as 6.1 km (20,000 ft) a.s.l. Explosions ended at 0235 on 10 July. The ACC was raised to Red and the VAL was raised to Warning but lowered back down one level early on 10 July. An eruption began at 1000 on 10 July and lasted eight minutes. Infrasound data indicated ash emissions but ash was not confirmed in satellite data. A 15-minute-long event began at 1706 on 10 July; no volcanic plume was identified in satellite data, and no volcanic lightning nor infrasound was detected. Seismicity declined after the episode.
Source: US Geological Survey Alaska Volcano Observatory (AVO)
AVO reported that an explosion at Bogoslof was detected at 0124 on 30 June and lasted about 20 minutes. A small cloud from the event drifted about 16 km N and by 1815 had dissipated. Seismicity declined afterwards but continued intermittently at low levels. Beginning at 1248 on 2 July a significant explosive event was detected in seismic and infrasound data. The event lasted about 16 minutes, and produced an ash plume that rose as high as 11 km (36,000 ft) a.s.l. and drifted E. AVO raised the Aviation Color Code (ACC) to Red and the Volcano Alert Level (VAL) to Warning. Following the eruption seismicity declined and no signs of volcanic unrest were detected in seismic, infrasound, or satellite data on 3 July; the ACC was lowered to Orange and the VAL was lowered to Watch. The ACC and VAL were again raised to Red and Warning, respectively, following an explosive event that began at 1651 on 4 July and lasted 13 minutes. An eruption cloud rose as high as 8.5 km (28,000 ft) a.s.l. and drifted SE. An 11-minute-long eruption began at 1907 on 4 July, producing a small cloud that rose 9.8 km (32,000 ft) a.s.l. and drifted SE.
Source: US Geological Survey Alaska Volcano Observatory (AVO)
AVO reported that slightly elevated surface temperatures at Bogoslof were identified in satellite images on 23 June, and steam emissions were occasionally observed the previous week. Beginning at 1649 on 23 June a significant explosive event was detected in seismic and infrasound data that lasted about 10 minutes. It produced an ash plume that rose as high as 11 km (36,000 ft) a.s.l. and drifted 400-490 km E. The event prompted AVO to raise the Aviation Color Code (ACC) to Red and the Volcano Alert Level (VAL) to Warning. Four additional explosions were detected, during 1918-1924, 2013-2021, 2104-2112, and 2152-2155, though any resulting ash plumes were not detected above the cloud deck at 8.5-9.1 km (28,000-30,000 ft) a.s.l. On 25 June the ACC was lowered to Orange and the VAL was lowered to Watch. At 1645 on 26 June an eruption which lasted about 14 minutes produced an ash plume that rose 7.6 km (25,000 ft) a.s.l. Seismic and lighting data indicated that a significant explosion began at 0317 on 27 June, prompting AVO to raise the ACC to Red and the VAL to Warning. The event lasted 14 minutes, and produced an ash plume that rose 9.1 km (30,000 ft) a.s.l. and drifted NW. The ACC was lowered to Orange and the VAL was lowered to Watch later that day.
Source: US Geological Survey Alaska Volcano Observatory (AVO)
AVO reported that elevated surface temperatures and a small steam emission at Bogoslof were identified in satellite images during 13-14 June. Weakly elevated surface temperatures were detected on 16 June, and a 13-km-long steam plume was visible on 18 June. The Aviation Color Code remained at Orange and the Volcano Alert Level remained at Watch.
Source: US Geological Survey Alaska Volcano Observatory (AVO)
AVO reported that a new lava dome at Bogoslof breached the surface of the ocean on or around 6 June, and was the first observation of lava at the surface since the start of the eruption that began in mid-December 2016. The dome was an estimated 110 m in diameter on 7 June, and then grew to 160 m in diameter by 9 June.
An explosive eruption began at 0318 on 10 June with a series of short infrasound signals which then, starting at about 0416, transitioned into several minutes-long continuous seismic and infrasound tremor signals. The events generated an ash-rich cloud that rose to an estimated altitude of 10.4 km (34,000 ft) a.s.l. and drifted NW. The Aviation Color Code (ACC) was raised to Red and the Volcano Alert Level (VAL) was raised to Warning. The eruption ended at 0528. Satellite data indicated that at least part of the volcanic cloud was more ash-rich than most in the current eruption period. On 11 June AVO noted no detectable activity in seismic or infrasound data after the event the day before. The ACC was lowered to Orange and the VAL was lowered to Watch. Satellite image acquired on 10 June and a photograph from an observer aboard a jet aircraft on 11 June suggested that the lava dome was no longer above the surface of the water, and was destroyed during the 10 June event.
A series of explosive events, each lasting 10-30 minutes, began at 1747 on 12 June and ended around 2035. Ash plumes rose 7.6 km (25,000 ft) a.s.l. and drifted SE. The ACC was raised to Red and the VAL was raised to Warning. At 0817 on 13 June a six-minute-long explosion was detected in seismic and infrasound data. A plume was not observed, likely because it was too small or below detection limits. The ACC was lowered to Orange and the VAL was lowered to Watch.
Source: US Geological Survey Alaska Volcano Observatory (AVO)
AVO reported that a short-duration (less than 10 minute) explosion at Bogoslof began at 1842 on 31 May based on seismic and infrasound data. A volcanic cloud identified in satellite images rose 7.3 km (24,000 ft) a.s.l., drifted WNW, and dissipated over the Bering Sea. The explosion was preceded by a several hour-long swarm of very small earthquakes. Seismicity decreased in the hours prior to the explosion and remained below the detection threshold. A sulfur dioxide plume from an explosion on 28 May was visible in satellite data drifting over the Hudson Bay region of Canada on 2 June. A short-duration explosive event at 0750 on 5 June produced a small volcanic cloud observed by a pilot. Low-amplitude tremor was detected in seismic data beginning at about 1229 on 5 June but then decreased to background levels. A vessel in the area reported vigorous steaming and a white plume rising several thousand feet above sea level. A brief explosive event was detected at 0600 on 6 June. The event likely produced a low-level (less than 3 km or 10,000 ft a.s.l.) emission; a possible plume at 1.8 km (6,000 ft) a.s.l. was identified in a satellite image following the detection of the activity in seismic and infrasound data, but quickly dissipated. The Aviation Color Code remained at Orange and the Volcano Alert Level remained at Watch.
Source: US Geological Survey Alaska Volcano Observatory (AVO)
An eruption at Bogoslof began at 1416 on 28 May prompting AVO to raise the Aviation Color Code (ACC) to Red and the Volcano Alert Level (VAL) to Warning. Pilot and satellite observations indicated than ash plumes rose at least 10.7 km (35,000 ft) a.s.l. and possibly as high as 13.7 km (45,000 ft) a.s.l. An observer on Unalaska Island reported seeing a large white-gray mushroom cloud form over Bogoslof, with ashfall to the W. The event lasted 50 minutes. On 29 May the ash cloud continued to drift NE. No detectable activity was observed in data from seismic or infrasound stations located on nearby Islands, and no new activity has been observed in satellite data. The ACC was lowered to Orange and the VAL was lowered to Watch.
Source: US Geological Survey Alaska Volcano Observatory (AVO)
AVO reported that the eruption at Bogoslof which began at 2232 on 16 May lasted about 73 minutes. Trace amounts of ash fell in the community of Nikolski on Umnak Island. Later that day the Aviation Color Code (ACC) was lowered to Orange and the Volcano Alert Level (VAL) was lowered to Watch; no further ash emissions were detected and seismicity was low. Satellite data showed that the event altered the N coastline of the island. The crater lake was breached with a 550-m-wide gap along the N shore, and the NE shore had been extended 300 m from new tephra deposits.
Source: US Geological Survey Alaska Volcano Observatory (AVO)
AVO reported that an increase in seismic and infrasound activity from Bogoslof was detected from stations on nearby islands starting at 2232 on 16 May, suggesting the beginning of an explosive eruption. The Aviation Color Code (ACC) was raised to Orange and the Volcano Alert Level (VAL) was raised to Watch. A pilot reported an ash plume rising as high as 10.4 km (34,000 ft) a.s.l., and the Worldwide Lightning Location Network detected lightning associated with the cloud. The ACC was raised to Red and the VAL was raised to Warning. The eruption lasted about 73 minutes.
Source: US Geological Survey Alaska Volcano Observatory (AVO)
On 19 April AVO noted that no new volcanic activity at Bogoslof had been detected in satellite, seismic, or infrasound data since a short-lived increase in seismicity on 15 April; AVO lowered the Aviation Color Code to Yellow and the Volcano Alert Level to Advisory.
Source: US Geological Survey Alaska Volcano Observatory (AVO)
Increased seismicity at Bogoslof was recorded by stations on nearby islands starting around 1501 on 15 April, prompting AVO to raise the Aviation Color Code to Orange and the Volcano Alert Level to Watch. The seismic activity subsided a few hours later; there was no evidence of renewed eruptive activity from infrasound, lightning, or satellite data during 15-18 April.
Source: US Geological Survey Alaska Volcano Observatory (AVO)
On 5 April AVO reported that the Aviation Color Code for Bogoslof was lowered to Yellow and the Volcano Alert Level was lowered to Advisory based on the absence of detected activity at the volcano for the past three weeks; the last large explosion occurred on 8 March. No significant volcanic activity was detected in seismic, infrasound, or satellite data during 6-11 April.
Source: US Geological Survey Alaska Volcano Observatory (AVO)
AVO reported that no significant volcanic activity at Bogoslof was detected in seismic or infrasound data during 29 March-4 April, and satellite views were often obscured by clouds or showed nothing noteworthy. Weakly elevated surface temperatures were identified in satellite images during 28-29 March. The Aviation Color Code remained at Orange and the Volcano Alert Level remained at Warning.
Source: US Geological Survey Alaska Volcano Observatory (AVO)
AVO reported that no significant volcanic activity at Bogoslof was detected in seismic or infrasound data during 22-28 March, and satellite views were often obscured by clouds or showed nothing noteworthy. Weakly elevated surface temperatures were identified in satellite images during 21-23 March. The Aviation Color Code remained at Orange and the Volcano Alert Level remained at Warning.
Source: US Geological Survey Alaska Volcano Observatory (AVO)
AVO reported that no significant volcanic activity at Bogoslof was detected in seismic or infrasound data during 15-21 March, and satellite views were either obscured by clouds or showed nothing noteworthy. Slightly elevated surface temperatures were identified in satellite images during 16-17 and 20-21 March. The Aviation Color Code remained at Orange and the Volcano Alert Level remained at Warning.
Source: US Geological Survey Alaska Volcano Observatory (AVO)
AVO reported that an explosive event at Bogoslof began at about 2236 on 7 March, indicated in seismic, lightning, and infrasound data, and lasted about three hours. Though ash was not immediately visible in satellite data, AVO raised the Aviation Color Code (ACC) to Red and the Volcano Alert Level (VAL) to Warning. Later, satellite images showed a large ash cloud rising to an altitude of 10.7 km (35,000 ft) a.s.l. and drifting E. This event was the first detected eruptive activity since 19 February, and more than 1,000 lightning strokes related to the volcanic eruption cloud were detected during this event, by far the highest number observed to date. In addition the seismic levels were among the highest detected since the beginning of the eruption. Satellite images from 8 March showed that the W part of the island had grown significantly. The ACC was lowered to Orange and the VAL was lowered to Watch on 9 March.
Two earthquakes swarms were detected during 9-11 March; the first began at 1750 on 9 March and ended at 1400 on 10 March, and the second was detected from 1900 on 10 March to 0500 on 11 March. Mildly elevated surface temperatures were identified in satellite data during 10-11 March. A third swarm began at 0500 on 12 March. A short-duration event, from 1131 to 1143 on 13 March, produced a small ash cloud that rose to an altitude of 5.5 km (18,000 ft) a.s.l. and drifted SSW. AVO noted that after the event, the level of seismic activity declined and the repeating earthquakes, detected for much of the previous several days, stopped. Weakly elevated surface temperatures were observed in two satellite images from 13 March. A photograph taken by a pilot showed a low-level, billowy steam plume rising from the general area of the intra-island lake.
Source: US Geological Survey Alaska Volcano Observatory (AVO)
AVO reported that no significant volcanic activity at Bogoslof had been detected in seismic, infrasound, or sometimes cloudy satellite data during 1-7 March. The Aviation Color Code remained at Orange and the Volcano Alert Level remained at Warning.
Source: US Geological Survey Alaska Volcano Observatory (AVO)
AVO reported that no significant volcanic activity at Bogoslof had been detected in seismic, infrasound, or mostly cloudy satellite data during 22-28 February. The Aviation Color Code remained at Orange and the Volcano Alert Level remained at Warning.
Source: US Geological Survey Alaska Volcano Observatory (AVO)
AVO reported that during 15-16 February cloud cover prevented satellite views of Bogoslof; no other data indicated eruptive activity. At 0955 on 17 February seismic data indicated the beginning of an explosive event, prompting AVO to raise the Aviation Color Code (ACC) to Red and the Volcano Alert Level (VAL) to Warning. Individual pulses of seismicity was recorded until 1140, and then afterwards seismicity was low. Satellite images and pilot observations indicated that an ash plume rose to an altitude of 11.6 km (38,000 ft) a.s.l. The event was also verified by infrasound and lightning data. Another short-lived explosive event began at 1546, detected in infrasound and seismic data. A volcanic cloud identified in satellite images rose as high as 7.6 km (25,000 ft) a.s.l.
An explosion at 0450 on 18 February was detected in seismic, infrasound, and lightning data. The seismic data suggested that ash emissions lasted several minutes, and then seismicity decreased. A preliminary evaluation of satellite data indicated that a cloud rose at least as high as 7.6 km (25,000 ft) a.s.l.; the cloud drifted SW. On 19 February the ACC was lowered to Orange and the VAL was lowered to Watch. Later that day seismic and infrasound data recorded a series of short-lived explosive pulses during 1708-1745. The ACC was raised to Red and the VAL was raised to Warning. A plume identified in satellite images rose as high as 7.6 km (25,000 ft) a.s.l. and drifted 160 km SE over Unalaska Island. AVO geologists on the island described the cloud has having a white upper portion and a slightly darker lower portion. Storms in the region impacted data communications at AVO's facility in Dutch Harbor on 20 February, limiting AVO's ability to forecast and detect eruptions at Bogoslof.
Source: US Geological Survey Alaska Volcano Observatory (AVO)
AVO reported that during 8-12 and 14 February cloud cover prevented satellite views of Bogoslof; no other data indicated eruptive activity. At 0724 on 13 February seismicity significantly increased, prompting AVO to raise the Aviation Color Code (ACC) to Red and the Volcano Alert Level (VAL) to Warning. Satellite images acquired through 0930 showed no ash emissions above the 3 km (10,000 ft) a.s.l. cloud deck, and no lightning was detected. AVO concluded that, despite the intensity of seismic activity, a significant ash emission was not produced during this event; the ACC was lowered to Orange and the VAL was lowered to Watch.
Source: US Geological Survey Alaska Volcano Observatory (AVO)
AVO reported that no further emissions were detected at Bogoslof after an explosion at 0520 on 31 January; the Aviation Color Code (ACC) was lowered to Orange and the Volcano Alert Level (VAL) was lowered to Watch the next day. A burst of tremor lasting nine minutes was detected starting at 0457 on 3 February. A second burst, starting at 0533 and lasting 20 minutes, was also detected by infrasound instruments, indicating an explosion. No ash cloud was detected above the meteorological cloud deck in satellite data. An event that began at 1642 produced a small volcanic plume that drifted about 40 km N below an altitude of 7.6 km (25,000 ft) a.s.l. Seismic tremor significantly decreased later that evening. Weakly elevated surface temperatures were observed in two satellite images acquired on 5 February, possibly related to hot deposits from explosive activity the day before.
Source: US Geological Survey Alaska Volcano Observatory (AVO)
AVO reported that no further emissions were detected at Bogoslof after an explosion at 0453 on 24 January; the Aviation Color Code (ACC) was lowered to Orange and the Volcano Alert Level (VAL) was lowered to Watch the next day. An hour-long seismic increase began at 0134 on 25 January though no evidence of eruptive activity was evident. Based on lightning and seismic data an explosive event began at 0650 on 26 January, and another burst of seismicity was recorded at 0706. The ACC was raised to Red and the VAL was raised to Warning. An ice-rich cloud, first identified in satellite data at 0700, likely contained ash, and rose as high as 9.8 km (32,000 ft) a.s.l. and drifted SE at lower altitudes, and NE at altitudes above about 6.1 km (20,000 ft) a.s.l. The ACC was lowered to Orange and the VAL was lowered to Watch later that day. Lightning and seismic data again indicated an explosive event at 0824 on 27 January, prompting AVO to raise the Aviation Color Code (ACC) to Red and the Volcano Alert Level (VAL) to Warning. An ice-rich cloud that likely contained ash rose to an altitude of 7.6 km (25,000 ft) a.s.l. and drifted E; seismicity related to ash emissions remained elevated for 48 minutes. The ACC was lowered to Orange and the VAL was lowered to Watch later that day.
Several short bursts of seismic activity were detected at 0520 and 0608 on 30 January. An infrasound signal accompanied the first event indicating an explosion; an eruption cloud was identified in satellite data at 0530, rising to an altitude of 6.1 km (20,000 ft) a.s.l. later that day AVO noted that bursts of explosive activity continued and intensified; more than 10 short-duration explosions were detected in seismic, infrasound, and lightning data. The Aviation Color Code (ACC) was raised to Red and the Volcano Alert Level (VAL) was raised to Warning. Ash plumes rose as high as 7.6 km (25,000 ft) a.s.l. and drifted 125 km SE. Trace amounts of ashfall and a sulfur odor were reported in Unalaska/Dutch Harbor (98 km E). By the next day the explosions had subsided or ended. Satellite images acquired on 31 January showed significant changes to the island. AVO stated that freshly erupted volcanic rock and ash had formed a barrier that separated the vent from the sea, suggesting that the change had resulted in the more ash-rich emissions occurring during 30-31 January.
Source: US Geological Survey Alaska Volcano Observatory (AVO)
AVO reported that an explosive event at Bogoslof began at about 1320 on 18 January, generating an ash plume that rose at least to an altitude of 9.4 km (31,000 ft) a.s.l. and drifted NE. The dark (ash-rich) plume was identified in satellite images and observed by a pilot, and produced lightning strikes and infrasound signals detected by sensors in Sand Point and Dillingham. Analysis of a satellite image suggested the presence of very hot material (lava) at the surface immediately surrounding the vent, which was the first such observation since the beginning of the eruption. AVO raised the Aviation Color Code (ACC) to Red and the Volcano Alert Level (VAL) to Warning. A second lower-altitude cloud was visible in satellite images around 1400, likely corresponding with an increase in seismic tremor that occurred from 1340-1355. The ACC was lowered to Orange and the VAL was lowered to Watch the next day.
Another explosion was detected at 1317 on 20 January, following an approximately 30-minute-long increase in seismic activity, based on seismic data and lightning detected from the World Wide Lightning Location Network. Pilots observed an ash plume rising to an altitude of 11 km (36,000 ft) a.s.l. and drifting SE. Satellite images indicated an ice-rich plume and lava present at the vent. The ACC was raised to Red and the VAL was raised to Warning, but were again lowered one level to Orange and Watch, respectively, the next day. Several lightning strikes north of Bogoslof indicated that an explosive event began at 1409 on 22 January. An ash plume identified in satellite images rose to an altitude of 9.1 km (30,000 ft) a.s.l. The ACC was raised to Red and the VAL was raised to Warning, and again lowered one level the next day. Following a period of increasing seismicity, an explosive event began at 0453 on 24 January, as indicated in seismic data and lightning detection, prompting AVO to raise the ACC to Red and the VAL to Warning. Seven minutes later an ice-rich plume which likely contained ash rose too altitudes of 7.6-10.7 km (25,000-35,000 ft) a.s.l. and drifted E.
Source: US Geological Survey Alaska Volcano Observatory (AVO)
AVO reported that photos taken by a pilot on 10 January showed Bogoslof covered with dark gray ash, and a roughly 300-m-diameter submarine explosion crater on the E side of the island. Unrest continued during 11-17 January. Two short-lived explosions (five to six minutes long) were seismically detected at 1123 and 1230 on 12 January and observed by pilots. The estimated altitudes of the first and second plumes were 5.5 and 4.4 km (18,000 and 14,500 ft) a.s.l., respectively. Seismicity again increased at 2126 on 14 January and remained elevated. Six explosive events were detected between 2216 on 14 January and 0350 on 15 January. No volcanic clouds were identified in satellite data, although one lightning strike was recorded at 2232 on 14 January. Increased seismicity on 17 January indicated minor explosive activity; steam plumes with minor amounts of ash rose no higher than 4.6 km (15,000 ft) a.s.l. The Aviation Color Code remained at Orange and the Volcano Alert Level remained at Watch.
Source: US Geological Survey Alaska Volcano Observatory (AVO)
AVO reported that a five-minute-long seismic signal detected by sensors on islands near Bogoslof began at 2118 on 3 January along with a series of lightning strikes identified by the World Wide Lightning Location Network. An ash cloud identified in satellite data rose as high as 10 km (33,000 ft) a.s.l. and drifted N. AVO raised the Aviation Color Code (ACC) to Red and the Volcano Alert Level (VAL) to Warning. No other indications of activity were noted for the next few days, the ACC and the VAL were lowered to Orange and Watch, respectively, on 5 January. Later that day, at 1324, seismicity again escalated, and lightning strikes indicated another significant and short-lived (five minutes) explosion. The ash plume was visible on satellite images and observed by pilots, and had risen to an estimated altitude of 10.7 km (35,000 ft) a.s.l., detached, and drifted NNW. The ACC was raised to Red and the VAL was raised to Warning, but were again lowered one level the next day. Seismic and infrasound data from neighboring islands indicated another explosive event, beginning at 2230 on 8 January. Seismic data suggested two strong pulses, during 2233-2234 and at 2256, consistent with two distinct volcanic clouds observed in satellite images. The second cloud was larger, rising to an altitude of 10.7 km (35,000 ft) a.s.l. and drifting NW. The ACC was raised to Red and the VAL was raised to Warning, but were again lowered one level to Orange and Watch, respectively, the next day.
Source: US Geological Survey Alaska Volcano Observatory (AVO)
On 27 December AVO noted that since there was no indication of elevated seismicity at Bogoslof during the previous day the Aviation Color Code (ACC) was lowered to Orange and the Volcano Alert Level (VAL) was lowered to Orange. AVO noted that there is no ground-based volcano monitoring equipment on Bogoslof; activity is monitored by satellite images, information from the Worldwide Lightning Location Network pertaining to volcanic-cloud lightning, and data from seismic and infrasound instruments on other islands.
An increase of volcanic tremor started to be detected at 1755 on 28 December with the largest burst, recorded at 1807 and lasting 50 minutes. Inclement weather prevented satellite confirmation of accompanying emissions. The report noted that this type of seismic activity had accompanied each of the previous explosions at Bogoslof since the eruption began last week, prompting AVO to issue a Volcano Activity Notice (VAN) and Volcano Observatory Notice for Aviation (VONA) in case there was an ash plume released.
Another increase in seismicity began at 1900 on 29 December and progressed, merging into a continuous tremor sequence indicative of a possible ash-producing eruption. At 2345 a 30-minute-long, ash-producing event began, with an ash plume possibly rising as high as 6.1 km (20,000 ft) a.s.l. that drifted NE. The ACC and VAL were raised to Red and Warning, respectively. A 45-minute-long explosive event began at 2230 on 30 December, indicated by seismic data and lightning strikes. Meteorological cloud cover prevented satellite views. No further explosions were detected afterward, so on 1 January 2017 the ACC was lowered to Orange and the VAL was lowered to Watch. Increased seismicity detected at 1353 on 2 January and lasting about 10 minutes likely indicated a relatively minor explosion; meteorological cloud cover prevented visual observations.
Source: US Geological Survey Alaska Volcano Observatory (AVO)
AVO reported that the explosive eruption at Bogoslof, which was reported by several pilots around 1530 on 20 December and produced an ash plume that rose to 10.3 km (34,000 ft) a.s.l., lasted about 30 minutes. The ash plume detached and dispersed S. AVO had raised the Aviation Color Code (ACC) to Red and the Volcano Alert Level (VAL) to Warning, but since no further activity was detected or observed the ACC was lowered to Orange and the VAL was lowered to Watch. On 21 December periods of discrete earthquakes and continuous seismic tremor were recorded by instruments on nearby volcanoes. At 1610 an explosive eruption detected in satellite data and by seismic instruments on nearby islands again lasted about 30 minutes. An ash plume rose to an altitude of 10.7 km (35,000 ft) a.s.l. and drifted N. The ACC and VAL were raised to Red and Warning, respectively. Seismicity declined rapidly afterward and remained low; the ACC was lowered to Orange and the VAL was lowered to Watch. Strong continuous seismic activity started abruptly at about 1340 on 22 December.
AVO noted that the eruption had dramatically changed the island. Satellite images showed that a small new island had formed just offshore of the NE end of the main island, the previous shore and much of the NE side of Bogoslof Island adjacent to the new island had been mostly removed (and was likely the site of the new, underwater vent), and deposition of material had occurred on the W side of the island.
An explosion occurred at 0930 on 23 December. A Coast Guard ship in the vicinity reported ash emissions, lightning, and ejected lava and fragmented material. The ash plume rose to an altitude below 9.1 km (30,000 ft) a.s.l. Coast Guard observers noted that ash emission subsided around 1037. The ACC/VAL were raised to Red/Warning. On 24 December seismic unrest was periodically detected by nearby island networks, but levels were generally low. The ACC was lowered to Orange and the VAL was lowered to Watch. A period of tremor detected in the evening on 25 December may have been associated with a minor, low-level ash emission (below 3 km or 10,000 ft a.s.l.); several lightning strikes in the area were recorded. Lightning strikes, seismic data, and satellite images indicated a continuing eruption that began at 1405 on 26 December. An ash plume rose to an altitude of 9.1 km (30,000 ft) a.s.l. and drifted WSW. The ACC/VAL were again raised to Red/Warning.
Source: US Geological Survey Alaska Volcano Observatory (AVO)
AVO reported that a short-lived explosive eruption at Bogoslof, observed and reported by several pilots around 1600 on 20 December, produced an ash plume that rose to 10.3 km (34,000 ft) a.s.l. A subsequent pilot report made 50 minutes later indicated that activity had decreased. Satellite data showed a discrete, short-lived explosion just prior to 1600, and a detached plume that drifted S. AVO raised the Aviation Color Code to Red and the Volcano Alert Level to Warning.
Source: US Geological Survey Alaska Volcano Observatory (AVO)
Reports are organized chronologically and indexed below by Month/Year (Publication Volume:Number), and include a one-line summary. Click on the index link or scroll down to read the reports.
Steam and ash emission
A eruption . . . had begun by 6 July, when airplane pilots first reported steam and ash rising through low clouds. Similar activity was seen through the week, when satellite images revealed repeated plumes from Bogoslof. Pilots reported a cloud to ~3 km altitude on 14 July at 1815. Satellite images showed the plume extending roughly 100 km SE, to the S side of Unalaska Island. An image from 16 July at 1140 showed another plume extending ~100 km E to Unalaska. That day, a pilot saw a white plume rising to ~4 km altitude. An episode of vigorous steam and ash ejection began on 20 July at about 1700, and material had reached nearly 8 km asl by 1725, drifting NNE. A dark gray cloud that was ~15 km wide at 3 km altitude was moving NW from the volcano several hours later. Poor weather prevented subsequent observations, but satellite images showed no volcanic plumes rising above weather-cloud tops at ~6 km elevation. There have been no reports of ashfall. Cloudy weather has prevented direct observation of the island . . . .
Information Contacts: AVO; SAB.
New lava dome enlarges island
A large new lava dome grew on the N side of Bogoslof Island (figure 1) during the steam-and-ash eruption reported in 17:6. The eruption apparently began about 6 July, and the last reports of activity were received on 24 July.
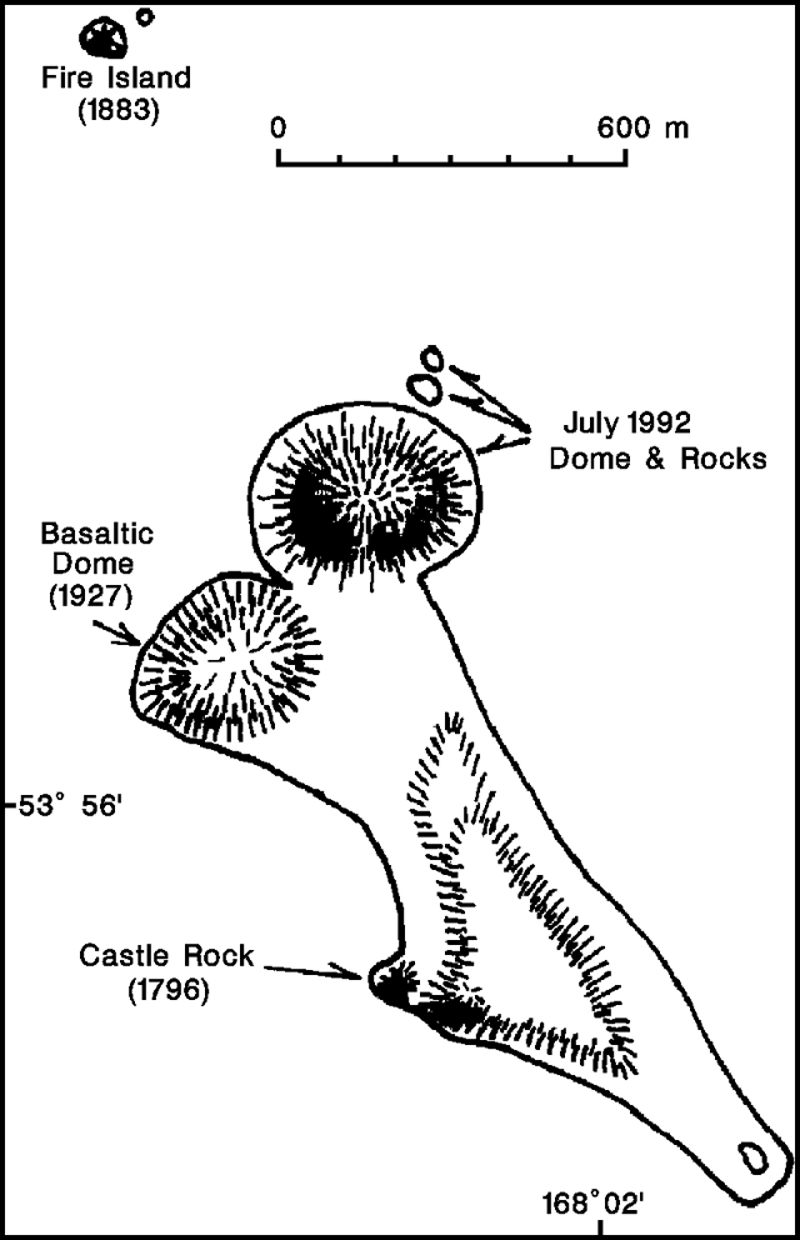 |
Figure 1. Sketch map of Bogoslof Island, showing the 1992 dome and new flat land just offshore (labeled "rocks"). Pre-1992 features are drawn from a 1982 pocket-transit survey by John Reeder, which had shown substantial erosion of the soft 1926-27 pyroclastic deposits since USGS mapping in 1947 (Byers, 1959). Courtesy of John Reeder. |
A plume was first visible on satellite imagery at about 1500 on 6 July, rising to an estimated 3 km altitude. Previous small plumes, if any, would have been obscured by clouds at about 6 km altitude that had remained over the area for the previous few days. Just after 1700 on 6 July, Thomas Madsen (Aleutian Air) saw a continuously rising steam column that disappeared into low clouds at 350 m altitude. From his vantage point 30 km SSE, the column appeared to be emerging from the sea just beyond the island. No eruptive activity had been evident during his previous flight two days earlier. At about 1800, Joe May and David Alborn (MarkAir) saw a white plume reaching at least 1.8 km altitude. During the late afternoon of 7 July, a commercial fisherman saw a rocky new island, with steam and some ash emerging from its summit, between Bogoslof Island and Fire Island (the 1883 dome). A fracture extended from the new island's summit to the sea, from where steam was also rising. No eruptive activity had been evident when the fisherman passed Bogoslof early 6 July.
Only intermittent small plumes appeared on satellite imagery through 13 July. However, plumes were continuous for the next two days, reaching a maximum altitude, on 14 July, of 5.5 km. The largest plume, at 1140 on 15 July, extended ~100 km ESE over neighboring Unalaska Island at 3-3.5 km altitude. At 1755 that day, May and Alborn saw a fairly dark, continuous, steam-and-ash plume that reached about 3.5 km elevation. Satellite images again showed only intermittent plumes 16-17 July, and none since then. Additional pilot observations included a rapidly rising mushroom-shaped cloud with a black stem, reaching at least 4.5 km above sea level on 17 July at 1623 (Wyman Owens, Peninsula Airways). On 20 July at 1830 Joseph Maricelli (Northwest Airlines) saw a gray plume rising from Bogoslof, with a very pale top that may have reached 8 km altitude. A gray cloud was still rising to 4.5 km when Randy Lovett and Tom Peebles (MarkAir) passed at 2056.
Photographs taken from a boat by Larry Shaishnikoff on 21 July, and video footage from a U.S. Coast Guard C-130 aircraft on 24 July, show a profusely steaming new lava dome at the N tip of the main island. Steam with some ash was emerging from most of the dome's surface during Shaishnikoff's visit. Incandescent lava could be seen within large crags over most of the dome, but was brightest on the upper NW and SE flanks. Estimates of its size from the video footage (AVO) and photographs (John Reeder) were similar, at ~80-90 m high and roughly 300-400 m across. It has a steep-sided central spire surrounded by a blocky, more gently sloping debris apron, and is adjacent to the remnant of the 1927 dome. Rock color and surface texture looked very similar to those of the 1927 dome in the Shaishnikoff photos. Approximately horizontal new land ("rocks" on figure 1) extended slightly above sea level just NNE of the dome. No steaming was occurring from these rocks, which may have been uplifted sea floor. Dall porpoises, numerous birds, and some Steller sea lions near Fire Island, several hundred meters from the new dome, did not appear to have been affected by the activity.
Pilot reports of steaming and possible ash emission continued through 24 July, after which occasional pilot observations indicated no further significant activity.
No ashfall has been reported at the two nearest towns, Dutch Harbor/Unalaska (100 km E of Bogoslof) and Nikolski (Umnak I., 120 km SW). The principal hazards from Bogoslof's eruptions are to aircraft in the Aleutian Islands and on Trans-Pacific international routes across the Bering Sea. No aircraft incidents have been reported. A SIGMET issued 20 July was cancelled the next day. No seismometers are maintained near the island.
The volcano's subaerial portion consists of fragmental deposits, agglomerate, lava spires, dome remnants, and beach sediments, all of historical age (Byers, 1959). All sampled rocks are high-potassium andesites and basalts (Arculus et al., 1977). The island is remote and uninhabited, but houses a large sea-lion rookery. The island's low elevation and frequent explosive activity since the first historical eruption in 1796 have resulted in rapid, well-documented morphologic changes over the past 200 years. Particularly vigorous eruptions occurred in 1883, 1907 (both of which deposited small amounts of ash on Dutch Harbor), and 1926-27. These eruptions were characterized by sporadic, violent explosions, with lava flows and dome-building continuing for several months (Jaggar, 1930). Three kilometers of muddy water encountered by a ship near the island in September 1951 may have been from a submarine eruption.
References. Arculus, R., Delong, S., Kay, R.W., Brooks, C., and Sun, S., 1977, The Alkalic Rock Suite of Bogoslof Island, Eastern Aleutian Arc, Alaska: Journal of Geology, v. 85, p. 177-186.
Byers, F.M., 1959, Geology of Umnak and Bogoslof Islands, Alaska: USGS Bulletin 1028-L.
Jaggar, T., 1930, Recent Activity of Bogoslof Volcano: The Volcano Letter, no. 275, p. 1-3.
Information Contacts: AVO; J. Reeder, ADGGS.
Ash-bearing explosions begin in December 2016; lava dome emerges in June 2017
Bogoslof lies 40 km N of the main Aleutian arc, over 1,350 km SW of Anchorage, Alaska (figure 2). Its intermittent eruptive history, first recorded in the late 18th century, has created and destroyed several distinct islands that are responsible for a unique and changing landscape at the summit of this submarine volcano, and produced multiple explosive ash-bearing plumes. The last subaerial eruption, in July 1992, created a lava dome on the N side of the island, adjacent to an eroded dome created in 1927 (BGVN 17:07, figure 1). A new eruption began on 20 December 2016, and was ongoing through July 2017. Information comes from the Alaska Volcano Observatory (AVO) and the Anchorage Volcanic Ash Advisory Center (VAAC).
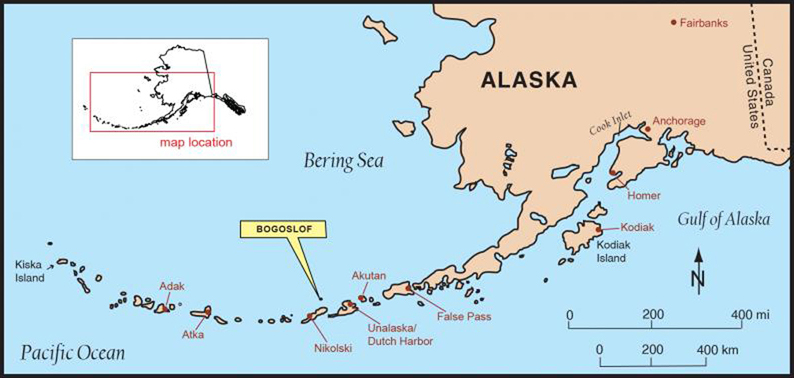 |
Figure 2. Index map showing the location of Bogoslof. Adapted from Beget et al. (2005). Courtesy of AVO. |
AVO notes that there is no ground-based monitoring equipment on Bogoslof, so monitoring is accomplished using satellite images, information from the Worldwide Lightning Location Network pertaining to volcanic-cloud lightning, and data from seismic and infrasound (airwave sensor) instruments. The infrasound instruments are located on neighboring Umnak (100 km SW) and Unalaska Islands (85 km SE) and further away at Sand Point (500 km E) on Popof Island, and on the Alaska mainland in Dillingham (825 km NE). AVO also receives reports from observers on ships and airplanes.
The first eruption at Bogoslof since 1992 began during mid-December 2016, when an ash plume was seen on 20 December. Numerous explosions were recorded via seismic, infrasound, lightning, satellite, and visual observations until 19 February 2017, and the morphology of the island changed significantly during that time. Ashfall was reported in Unalaska on 31 January. A large explosion on 7 March produced a substantial ash plume, and was followed by four days with earthquake swarms that lasted for hours. An explosion on 16 May produced an ash plume that rose to over 10 km altitude. A larger explosion on 28 May created tephra jets, pyroclastic fall and flow material around the island, and a possible 13.7-km-high ash plume. A substantial submarine sediment plume was observed in early June, followed by confirmation of a lava dome above the ocean surface during 5-6 June. A series of explosions during 10 June destroyed the lava dome. Explosions producing ash plumes that rose to altitudes above 10 km occurred on 23 June and 2 July; several additional smaller explosions were recorded through mid-July.
Activity during December 2016-February 2017. According to AVO, Bogoslof showed signs of unrest beginning on 12 December 2016 in seismic, infrasound (air-wave), and satellite data. Ash emissions may have occurred on 16 and 19 December on the basis of recorded lightning strikes, seismic data, and sulfur dioxide clouds detected by satellite instruments, though there were no direct visual observations from satellite or ground observers. On 20 December, a powerful, short-lived explosion at about 1535 AKST (0035 UTC 21 December) sent ash to over 10.3 km altitude which then drifted S (figure 3).
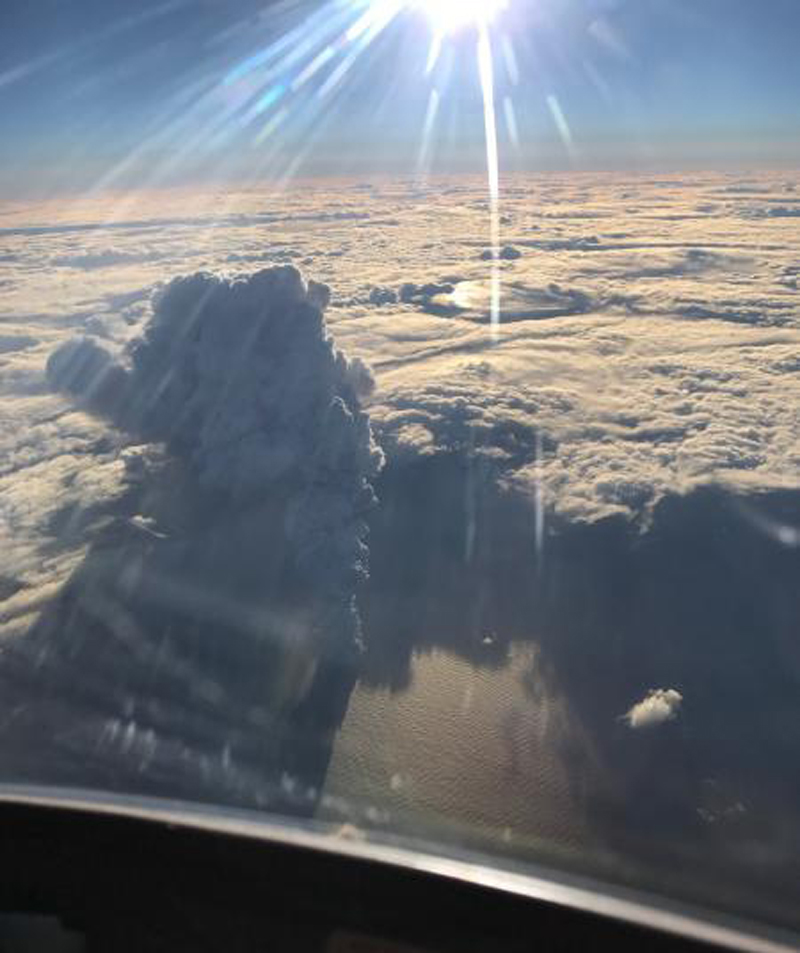 |
Figure 3. Bogoslof's eruption plume was captured on 20 December shortly after 1530 AKST from an aircraft at 36,000 feet (10.9 km). The aircraft was about 20 miles N of Bogoslof Island flying W. Photo by Paul Tuvman, courtesy of AVO. |
An explosion on 21 December at 1610 AKST was detected in satellite images and seismic data from neighboring islands. This eruption lasted about 30 minutes and sent ash as high as 10.7 km which then drifted N. Satellite images from the next day showed that a small new island had formed just offshore of the NE end of the main island. The previous shore and much of the NE side of Bogoslof Island adjacent to the new island was mostly removed and, according to AVO, was likely the site of the new, underwater vent; deposition of material was visible on the W side of the island (figure 4).
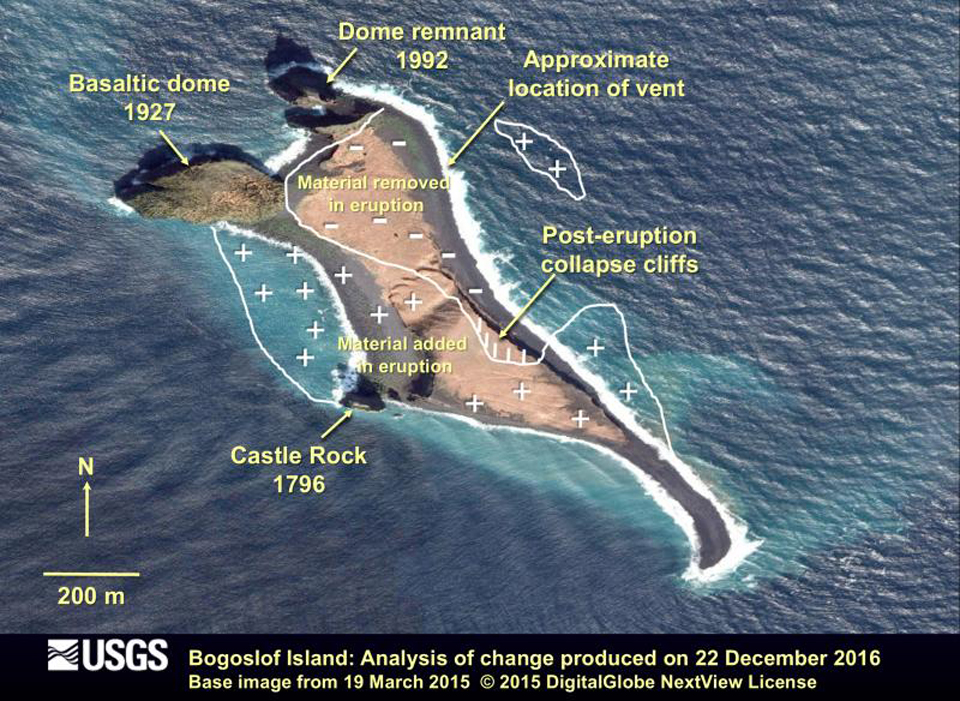 |
Figure 4. Analysis of shoreline change and vent location from the 20-21 December 2016 eruption of Bogoslof. The base image is from 19 March 2015 and the analysis was conducted using data from 22 December 2016, a day after the large explosive eruption on 21 December. Note that the location of the vent for the eruption was underwater or near the shoreline on the NE part of Bogoslof Island. Deposits have enlarged portions of the island and were interpreted by AVO to be comprised of coarse-grained volcanic ash and blocks of lava. The areas marked with "+" are material that was added during the eruption. The area marked with "-" represents material removed during the eruption. Courtesy of AVO. |
During the morning of 23 December 2016, observers aboard a Coast Guard vessel reported ash emission, lightning, and the ejection of incandescent lava and fragmental material. Ash emission and lava ejection subsided after about an hour. The ash cloud was carried N over the Bering Sea and did not penetrate above the regional cloud tops at 9.1 km altitude. Similar, repeated, short-duration explosions continued every few days through 19 February 2017 before the first break in activity (table 1).
Table 1. Observations of activity at Bogoslof, December 2016-July 2017, as reported by AVO and the Anchorage VAAC. Date is local AKST or AKDT (starting 10 June). Plume altitude in kilometers. Drift is direction and distance in kilometers.
| Date | Time (local) | Observation and notes | Plume Altitude (km) | Drift | Detection Method |
| 12 Dec 2016 | -- | "Unrest" | -- | -- | Seismic, infrasound, satellite |
| 16 Dec 2016 | -- | Possible ash emissions | -- | -- | Lightning, seismic, SO2 |
| 19 Dec 2016 | -- | Possible ash emissions | -- | -- | Lightning, seismic, SO2 |
| 20 Dec 2016 | 1530 | Explosive eruption with ash plume | 10.3 | S | Pilot, satellite |
| 21 Dec 2016 | 1610 | 30-minute-long explosion with ash plume | 10.7 | N | Satellite, seismic |
| 23 Dec 2016 | 0930 | Explosion with ash, lightning, incandescent lava, and debris, 60 minute duration | Below 9.1 | N | Coast Guard observers from nearby vessel |
| 25 Dec 2016 | evening | Tremor, possible minor, low-level ash emission, lightning | -- | -- | Seismic, lightning |
| 26 Dec 2016 | 1405 | Ash Plume | 9.1 | WSW | Lightning, seismic, satellite |
| 28 Dec 2016 | 1755 | Tremor, 50 minutes, Cloud cover obscured | -- | -- | Seismic |
| 29 Dec 2016 | 1900, 2345 | Continuous tremor at 1900, 30-minute-long ash producing event at 2345 | 6.1 | NE | Seismic station on Umnak, infrasound, satellite |
| 30 Dec 2016 | 2230 | Explosive event, 45 minutes, Cloud cover obscured | -- | -- | Seismic, infrasound, lightning |
| 31 Dec 2016 | 0500 | Low-level eruptive activity, continuous; cloud cover obscured; windy conditions affect local seismic stations | -- | -- | Dillingham infrasound |
| 02 Jan 2017 | 1353 | Minor explosions, 10 minutes of increased seismicity, cloud cover obscured | -- | -- | Seismic, infrasound |
| 03 Jan 2017 | 2118 | Seismic activity, 5 minutes, ash plume | 10.0 | N | Seismic, infrasound, lightning, satellite |
| 05 Jan 2017 | 1324 | Increased seismicity, ash plume, detached | 10.7 | NNW | Seismic, lightning, satellite, pilot |
| 08 Jan 2017 | 2233, 2256 | Two strong seismic pulses, two volcanic clouds | 10.7 | NW | Seismic, infrasound, satellite |
| 12 Jan 2017 | 1123, 1230 | Two short-lived explosions, plumes | 5.5, 4.4 | -- | Seismic, pilot |
| 14 Jan 2017 | 2126, 2216 | Six explosions, beginning 2216, no ash plumes observed | -- | -- | Seismic, lightning |
| 17 Jan 2017 | 0400, 0740 | Increasing tremor signal, Steam with minor ash | 4.6 | -- | Seismic, satellite |
| 18 Jan 2017 | 1320 | Explosion, dark ash cloud, strong thermal anomaly around vent | 9.4 | NE | Seismic, pilot, lightning, infrasound, satellite, SO2, MODVOLC |
| 20 Jan 2017 | 1317 | Explosion, ice-rich ash plume, lava at vent | 11.0 | SE | Seismic, lightning, pilot, satellite imagery of lava, infrasound |
| 22 Jan 2017 | 1409 | Explosion, ash plume | 9.1 | -- | Lightning, satellite |
| 24 Jan 2017 | 0453 | Explosion, ice-rich cloud with likely ash | 7.6-10.7 | E | Seismic, lightning |
| 26 Jan 2017 | 0650, 0706 | Exposion, ice-rich cloud with likely ash; ash drifted in multiple directions | 9.8, 6.1 | SE, NE | Seismic, lightning |
| 27 Jan 2017 | 0824 | Explosion, ice-rich cloud with likely ash | 7.6 | -- | Seismic, lightning |
| 30 Jan 2017 | 2020 | Eruption cloud, more than 10 short explosions, Trace ashfall in Dutch Harbor (98 km E) and strong SO2 odor | 7.6 | 125 km SE | Seismic, infrasound, lightning, satellite |
| 03 Feb 2017 | 0457, 0533 | Increased seismicity, small explosions, no ash detected | -- | -- | Seismic, infrasound |
| 03 Feb 2017 | 1641 | Seismic event, small plume | 7.6 | 40 km N | Infrasound, satellite, pilot |
| 5, 7, 8 Feb 2017 | -- | Weakly elevated surface temp | -- | -- | Satellite |
| 13 Feb 2017 | 0724 | Increased seismicity, no ash emissions above 3 km | -- | -- | Seismic, satellite |
| 17 Feb 2017 | 0955, 1546 | Explosive event, ash plume | 11.6, 7.6 | N | Seismic, satellite, pilot, infrasound, lightning |
| 18 Feb 2017 | 0450 | Explosion, ash emissions | 7.6 | SW | Seismic, infrasound, lightning, satellite |
| 19 Feb 2017 | 1708-1745 | Series of short explosive pulses, plume | 7.6 | 160 km SE | Seismic, infrasound, satellite |
| 07-08 Mar 2017 | 2236 | 3 hour explosive event, large ash plume, over 1,000 lightning strokes | 10.7 | E | Seismic, lightning, infrasound |
| 09-10 Mar 2017 | 1750 | Earthquake swarm, 20 hours | -- | -- | Seismic |
| 10-11 Mar 2017 | 1900 | Earthquake swarm, 10 hours | -- | -- | Seismic |
| 12 Mar 2017 | 0500 | Earthquake swarm | -- | -- | Seismic |
| 13 Mar 2017 | 1131 | Seismic event, small ash cloud, weakly elevated surface temps | 5.5 | 90 km SSW | Seismic, satellite |
| 16 May 2017 | 2232 | Increased seismicity, ash plume, 73 minutes | 10.4 | SW | Seismic, infrasound, lightning, satellite, pilot |
| 28 May 2017 | 1416 | Explosion, ash plume, 50 minutes, plume visible for 4 days | 10.7-13.7 | W, NE | Seismic, satellite, pilot |
| 31 May 2017 | 1842 | Several hour-long seismic swarm followed by short duration explosion, volcanic cloud | 7.3 | WNW | Seismic, infrasound, satellite |
| 05 Jun 2017 | 0750 | Explosion, small volcanic cloud | -- | -- | Seismic, pilot |
| 06 Jun 2017 | 0600 | Brief explosive event, possible plume, lava dome emerges | 1.8 | -- | Seismic, infrasound, satellite |
| 10 Jun 2017 | 0318 | Explosive eruption, ash-rich cloud | 10.4 | NW | Seismic, infrasound, lightning, satellite |
| 12 Jun 2017 | 1747 | Series of explosive events, ash plumes | 7.6 | SE | Seismic, infrasound |
| 13 Jun 2017 | 0817 | Six-minute long explosion, no plume observed | -- | -- | Seismic, infrasound |
| 23 Jun 2017 | 1649 | Five explosions, ash plume | 11.0 | 400-490 km E | Seismic, infrasound |
| 26 Jun 2017 | 1645 | 14-minute explosion, ash plume | 7.6 | -- | Seismic |
| 27 Jun 2017 | 0317 | 14-minute explosion, ash plume | 9.1 | NW | Seismic, lightning |
| 30 Jun 2017 | 0124 | Explosion, 20 minutes, small cloud | -- | 16 km N | Seismic |
| 02 Jul 2017 | 1248 | 16-minute explosion, ash plume | 11 | E | Seismic, infrasound |
| 04 Jul 2017 | 1651 | 13-minute explosive event, eruption cloud | 8.5 | SE | Seismic |
| 04 Jul 2017 | 1907 | 11-minute-long explosion, small cloud | 9.8 | SE | Seismic |
| 08 Jul 2017 | 1015 | Two eruption pulses, ash plume | 9.1 | N | Seismic, satellite |
| 09 Jul 2017 | 2347 | Two eruptions, 5-minutes and 7-minutes long, small ash cloud | 6.1 | SE | Seismic, satellite |
| 10 Jul 2017 | 1000, 1706 | Two explosions, no confirmed ash | -- | -- | Seismic, infrasound |
AVO reported that photos taken by a pilot on 10 January showed Bogoslof covered with dark gray ash, and a roughly 300-m-diameter submarine explosion crater on the E side of the island. The dark (ash-rich) plume from an explosion on 18 January (figure 5) was identified in satellite images and observed by a pilot; the event produced lightning strikes and infrasound signals detected by sensors in Sand Point and Dillingham. Analysis of a satellite image suggested the presence of very hot material (possibly lava) at the surface immediately surrounding the vent, which was the first such observation since the beginning of the eruption. The first MODVOLC thermal alerts were issued on 18 January.
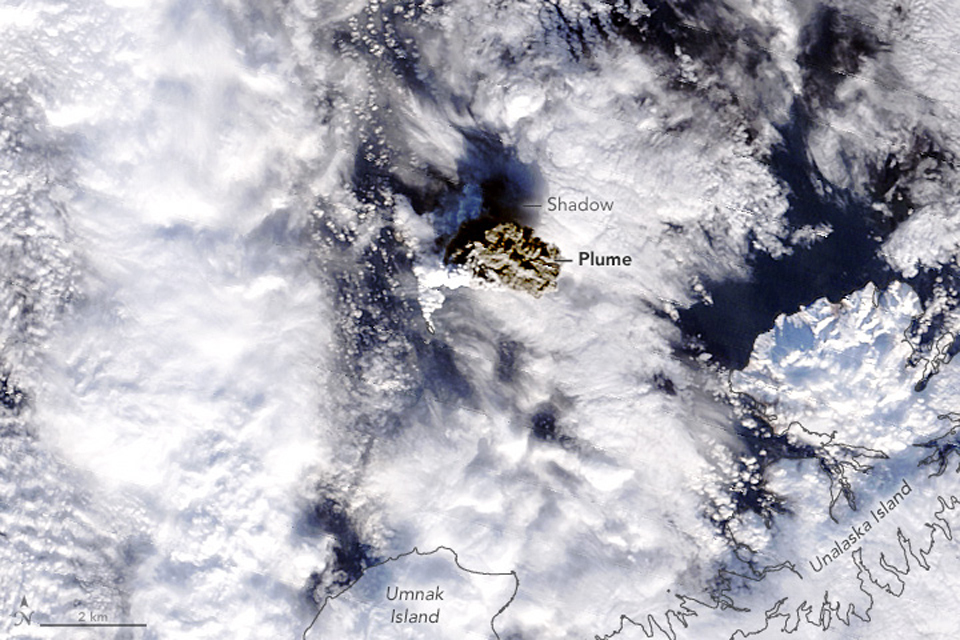 |
Figure 5. A large explosion at Bogoslof on 18 January 2017 produced a dark ash cloud that rose to 9.4 km and drifted NE. Captured by MODIS on NASA's Terra satellite. Courtesy of NASA Earth Observatory. |
AVO analysis of satellite images from 16 and 18 January 2017 (before the eruption that day) showed that the vent area, which formed on the NE end of the island in shallow water, had been filling in with eruptive material and building out of the water. On 20 January, satellite images showed an ice-rich plume and lava present at the vent. Prevailing winds carried the plume to the SE over the SW end of Unalaska Island, but no ash fall was reported. A high spatial resolution satellite image collected on 24 January showed AVO that the explosive eruptions continued to change the morphology of the island and the coastline (see figure 7). The eruptive vent, however, remained below sea level in the N portion of a figure-eight-shaped bay, as indicated by the presence of upwelling volcanic gases. There was no sign of lava at the surface.
A series of more than 10 short-duration explosions beginning on 30 January (AKST) and detected in seismic, infrasound, and lightning data, resulted in an ash plume that rose to 7.6 km altitude and drifted 125 km SE. Trace amounts of ashfall and a strong SO2 odor were reported in Dutch Harbor on Unalaska Island (98 km E) (figure 6). Satellite images acquired on 31 January showed additional significant changes to the morphology of the island (figure 7). AVO stated that freshly erupted volcanic rock and ash had formed a barrier that separated the vent from the sea.
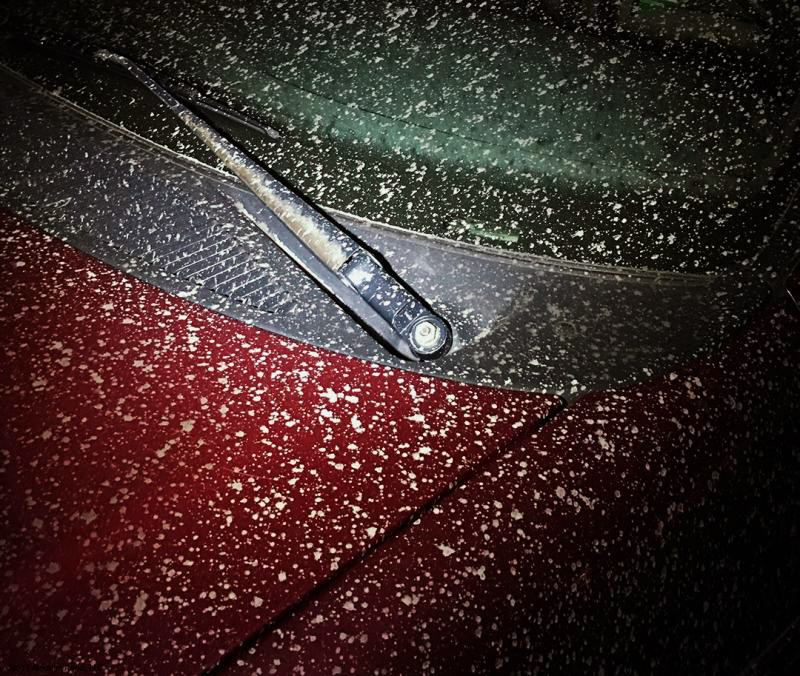 |
Figure 6. Trace ashfall in Unalaska, Alaska, on 31 January 2017 from Bogoslof. Courtesy of AVO. |
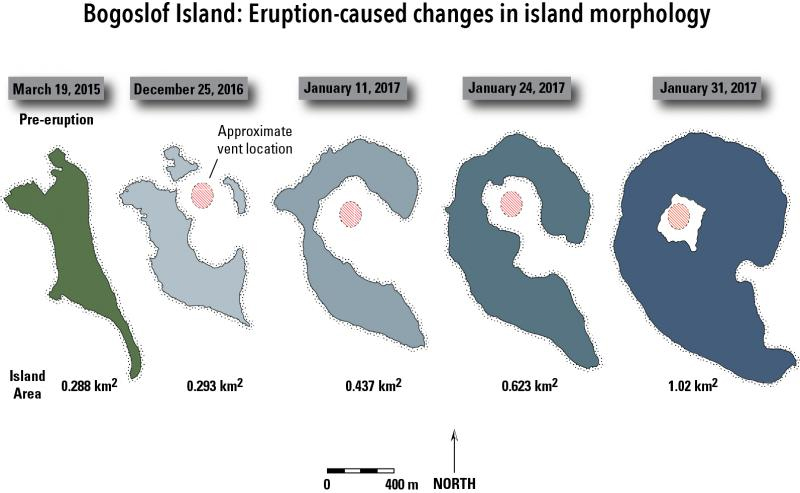 |
Figure 7. Changes in the morphology of Bogoslof Island resulting from the ongoing 2016-17 eruption. The 30-31 January 2017 eruptive activity generated roughly 0.4 square kilometers of new land. As of 31 January 2017 the island area was 1.02 square kilometers, roughly three times the size of the pre-eruption island. Nearly all of this new material consisted of unconsolidated pyroclastic fall and flow (surge) deposits that are highly susceptible to wave erosion. Courtesy of AVO. |
On 19 February 2017, a series of short-lived explosive pulses resulted in a plume that drifted 160 km SE over Unalaska Island. AVO geologists on the island described the cloud has having a white upper portion and a slightly darker lower portion. A satellite image from 23 February showed that the vent location at Bogoslof remained underwater. After the 19 February events, the volcano was quiet for two weeks.
Activity during March 2017. A 3-hour-long explosive event occurred overnight during 7-8 March 2017 and produced numerous strokes of volcanic lightning, high levels of seismicity and infrasound, and an ash cloud up to 10.7 km altitude that moved E over Unalaska Island. The seismicity was among the highest levels observed for the eruption sequence that began in mid-December 2016, and the more than 1,000 detected lightning strokes were by far the highest number observed to date. The eruptive activity again changed the shape of the island and temporarily dried out the vent area. Satellite images from 8 March showed that the W coast of the island appeared to have grown significantly due to the eruption of new volcanic ash and blocks. A new vent was also identified on the NW side of the island, and the lava dome emplaced during the 1992 eruption was partially destroyed (figure 8).
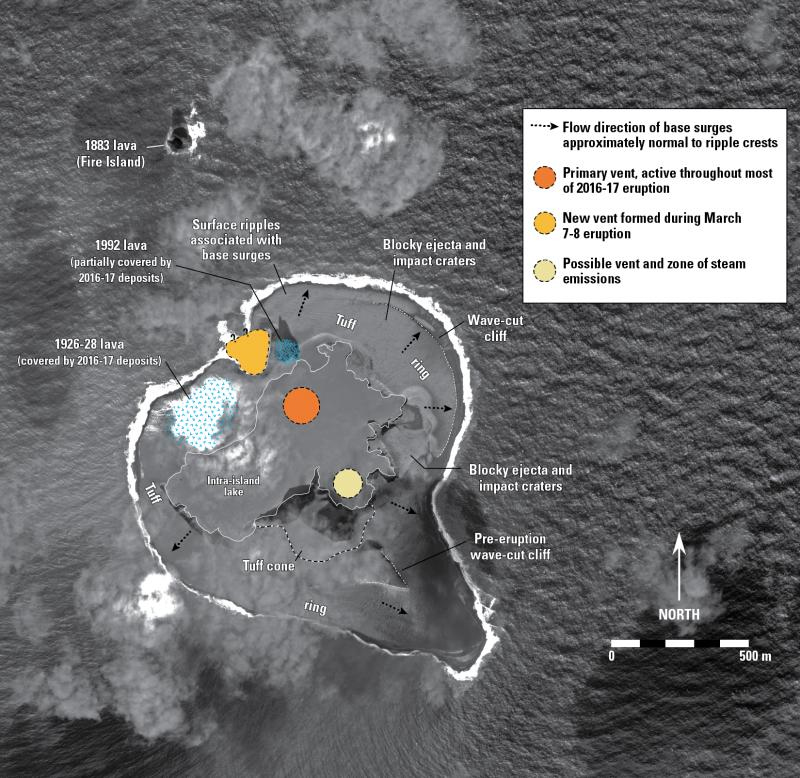 |
Figure 8. A Worldview-2 satellite image of Bogoslof Island on 11 March 2017 showing features and changes resulting from the 7-8 March 2017 activity. A new vent developed on the NW shore of the island adjacent to the lava dome that formed during the 1992 eruption. Most of the deposits on the surface appear fine-grained and were likely emplaced by pyroclastic base surges. The surface of these deposits exhibit ripples, dunes, and ballistic impact craters. The scalloped appearing shoreline of the intra-island lake is probably the result of groundwater related erosion (sapping) of the pyroclastic deposits as water refills the lake. Most or all of the water in the lake was likely expelled by the eruption column exiting the primary or other vents. The area of Bogoslof Island in this image is about 0.98 square kilometers. Image data provided under Digital Globe NextView License. Courtesy of AVO. |
Two earthquake swarms were detected during 9-11 March; the first began at 1750 on 9 March and ended at 1400 on 10 March, and the second was detected from 1900 on 10 March to 0500 on 11 March. Mildly elevated surface temperatures were identified in satellite data during 10-11 March. A third swarm began at 0500 on 12 March. A 12-minute-long explosive event, beginning at 1131 on 13 March, produced a small ash cloud that rose to an altitude of 5.5 km and drifted SSW. AVO noted that after the event, the level of seismic activity declined and the repeating earthquakes of the previous several days had stopped. Weakly elevated surface temperatures were observed in two satellite images from 13 March. A photograph taken by a pilot showed a low-level, billowy steam plume rising from the general area of the intra-island lake. Except for weakly elevated surface temperatures in satellite data, no significant activity was reported during the rest of March. The only activity detected during April 2017 was a brief increase in seismicity on 15 April. Aerial reconnaissance by the US Coast Guard on 8 May showed the dramatic changes of the island's shape (figure 9).
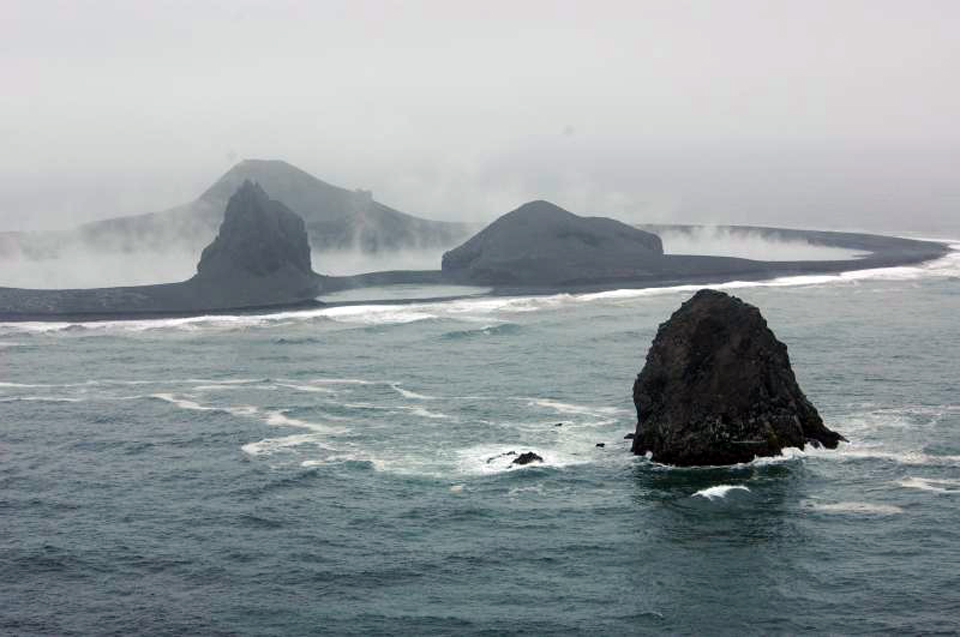 |
Figure 9. Bogoslof Island viewed from the NW on 8 May 2017. Fire Island (a remnant of lava from an 1883 eruption) is in the right foreground, and the new steaming lake that includes the submarine vent is behind the two dome remnants in the mid-ground. The 1992 lava is the remnant on the left and the 1926-28 lava is on the right. Bogoslof Island aerial reconnaissance courtesy of U.S. Coast Guard Air Station Kodiak and U.S.C.G. Cutter Mellon. Photo by Max Kaufman, courtesy of AVO. |
Activity during May-July 2017. Following a pause in explosive activity that lasted a little over two months, Bogoslof erupted explosively at 2232 (AKDT) on 16 May. The eruption, which lasted about 70 minutes, was detected by seismic and infrasound sensors on neighboring islands and the resulting ash-cloud-generated volcanic lightning that was detected by the Worldwide Lightning Location Network. A pilot report and satellite images showed that the plume rose as high as 10.4 km, and then drifted SW. Trace ashfall was reported in the community of Nikolski on Umnak Island (125 km SW). A drifting sulfur dioxide cloud from the eruption was detected for several days using satellite-based sensors. The eruption altered the northern coastline of the island, with the crater lake breached by a 550-m-wide gap along the N shore. Part of the NE shore had been extended 300 m due to new tephra deposits.
Another large explosion began at 1416 on 28 May 2017. Pilot and satellite observations indicated that ash plumes rose at least 10.7 km and possibly as high as 13.7 km altitude (figure 10). An observer on Unalaska Island reported seeing a large white-gray mushroom cloud form over Bogoslof, with ashfall to the W. The event lasted 50 minutes. On 29 May the ash cloud continued to drift NE, and on 2 June, an SO2 plume from the event was still visible in satellite data drifting over the Hudson Bay region.
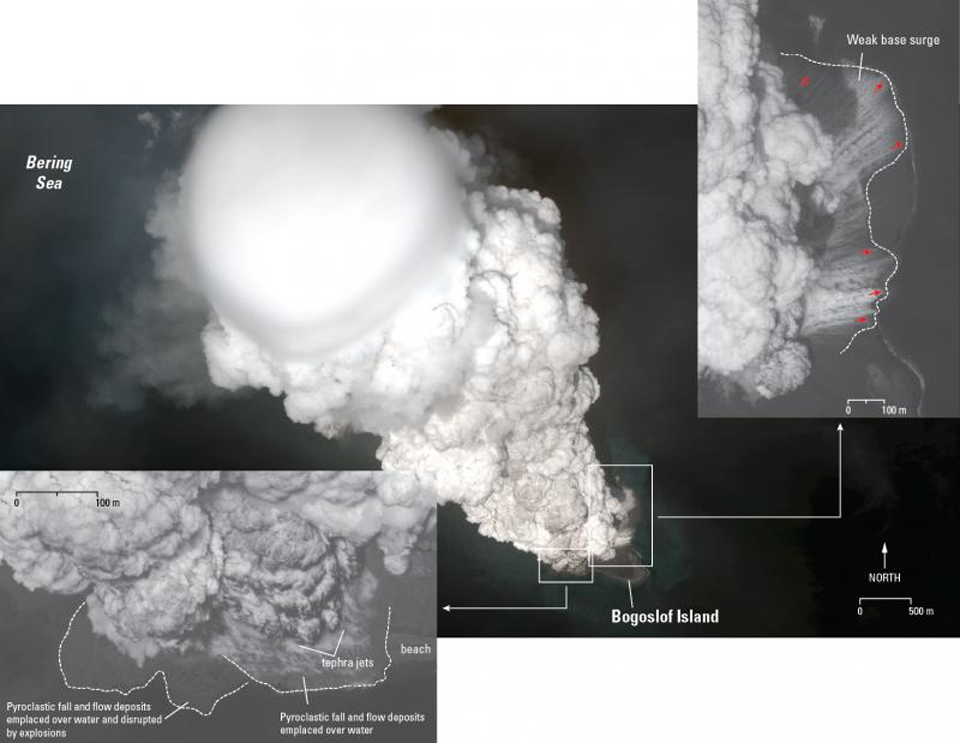 |
Figure 10. Enlarged portions of 28 May 2017 satellite image of Bogoslof Island. Inset image on lower left shows pyroclastic fall and flow material emplaced over water. Some of the material appears to have been disturbed, possibly by the force of the eruption column. It is unclear if this material represents new land or material floating on the water. Tephra jets are common features of many shallow submarine eruptions. The inset image in the upper right shows a weak base surge propagating from the base of the eruption column across the tuff ring. Image data provided under the Digital Globe NextView License. Courtesy of AVO. |
On 5 June, a vessel in the area reported vigorous steaming and a white plume rising at least a kilometer above sea level. Also, a substantial submarine sediment plume was seen in satellite imagery drifting N from the lagoon area (figure 11). A brief explosive event at 0600 on 6 June likely produced a low-level (less than 3 km) emission. A possible plume at 1.8 km that quickly dissipated was identified in a satellite image following the detection of the activity in seismic and infrasound data.
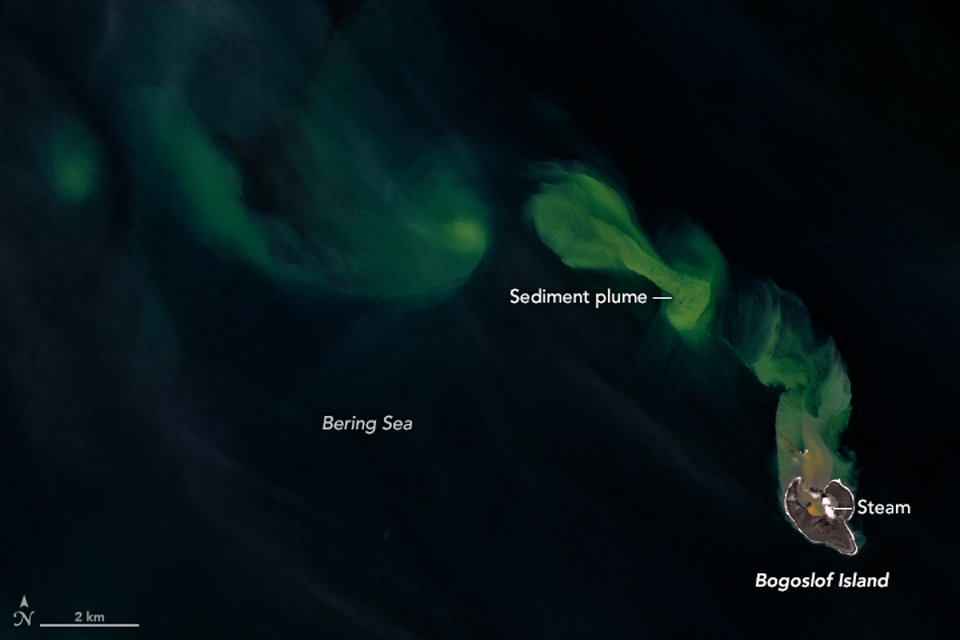 |
Figure 11. Landsat-8 image of Bogoslof from 5 June 2017 at 2200 UTC (1400 AKDT). This composite image of visible and thermal infrared data shows a sediment plume in the ocean that extends from the vent region in the horseshoe-shaped lagoon. Warm water outflow is highlighted in color extending northward from the lagoon where it mixes with colder ocean water. A hot vent just S of the lagoon can be seen in orange, and several small puffs of white steam are visible coming from this region. Courtesy of NASA Earth Observatory. |
AVO reported that a new lava dome breached the surface of the ocean on or around 6 June 2017; it was the first observation of lava at the surface since the start of the eruption in mid-December 2016 (figure 12). The dome was an estimated 110 m in diameter on 7 June, and then grew to 160 m in diameter by 9 June. Four short-duration explosions were detected in seismic and/or infrasound data between 5 and 7 June, and generated volcanic clouds that in many cases were too small to be observed in satellite data. AVO reported that robust steaming was identified in satellite data and by observers aboard a U.S. Fish and Wildlife Service ship in the region following the emergence of the lava dome likely due to, or enhanced by, the effusion of lava into the ocean.
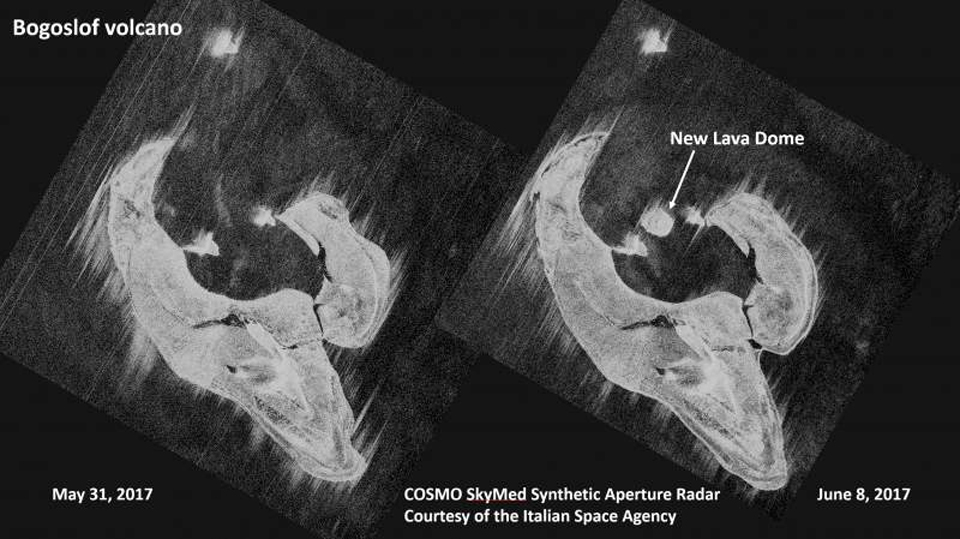 |
Figure 12. Comparison of satellite radar images from 31 May and 8 June 2017 of Bogoslof showing the newly emplaced lava dome. The diameter of the short-lived dome was about 110 m. N is to the top. Courtesy of AVO. |
A series of six explosions was detected on 10 June, starting with a 2-hour explosive event that emitted an ash-rich cloud to 10.4 km altitude that was detected in seismic, infrasound, lightning, and satellite data. This event destroyed the 160-m-diameter lava dome that was first observed on 5 June (figure 13). On 12 June, a series of four small explosions lasting 10-30 minutes each emitted volcanic clouds that rose to a maximum height of 7.6 km, and dissipated within about 30 minutes. On 13 June, a six-minute-long explosion occurred, although no ash cloud was observed in satellite imagery likely because it's altitude was below detection limits.
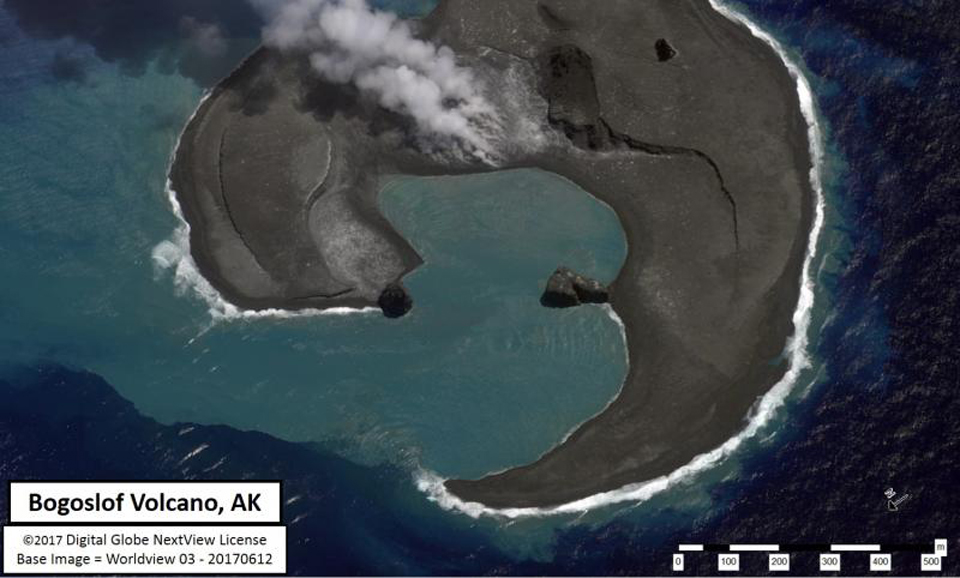 |
Figure 13. Worldview satellite image of Bogoslof taken at 2313 UTC on 12 June 2017. Note that N is to the lower left of the image. The circular embayments were formed by a series of more than 40 explosions that began in mid-December 2016. These explosions have greatly reshaped the island as material was removed and redeposited as air fall. Vigorous steaming was observed S of the most active vent areas in the lagoon. Lava extrusion produced a circular dome that first rose above the water on 5 June and grew to a diameter of ~160 m before being destroyed by an explosion early in the day on 10 June. Large blocks of the destroyed dome can be seen littering the surface of the island near the lagoon. Courtesy of AVO. |
Weakly elevated surface temperatures detected in satellite imagery on 10 and 11 June suggested to AVO that a new lava dome was extruding beneath the ocean surface. Satellite imagery showed persistent degassing from the island in between explosions. In addition, residents of Unalaska/Dutch Harbor reported smelling sulfur on 12 June, and winds were consistent with a source at Bogoslof. AVO reported that elevated surface temperatures and a small steam emission were identified in satellite images during 13-14 and 16 June. A 13-km-long steam plume was visible on 18 June.
A series of nine explosions were detected in seismic and/or infrasound data during the night of 23 June, the largest of which produced a volcanic cloud reaching an altitude of 11 km that drifted well over 400 km E (figure 14). Additional explosions on 26 and 27 June sent volcanic clouds to 7.6 and 9.1 km altitude, respectively. Winds carried most of these plumes N and NE; AVO received no reports of ashfall from local communities. Bogoslof erupted again on 29 June and produced a small plume, and several times during the first two weeks of July explosions produced larger plumes that rose to 8.5-11 km altitude. Two explosions that occurred on 10 July without producing observed ash were the last for the rest of the month. Weakly elevated surface temperatures were observed in clear satellite images on 12 and 16 July. No further activity was reported for the rest of July 2017.
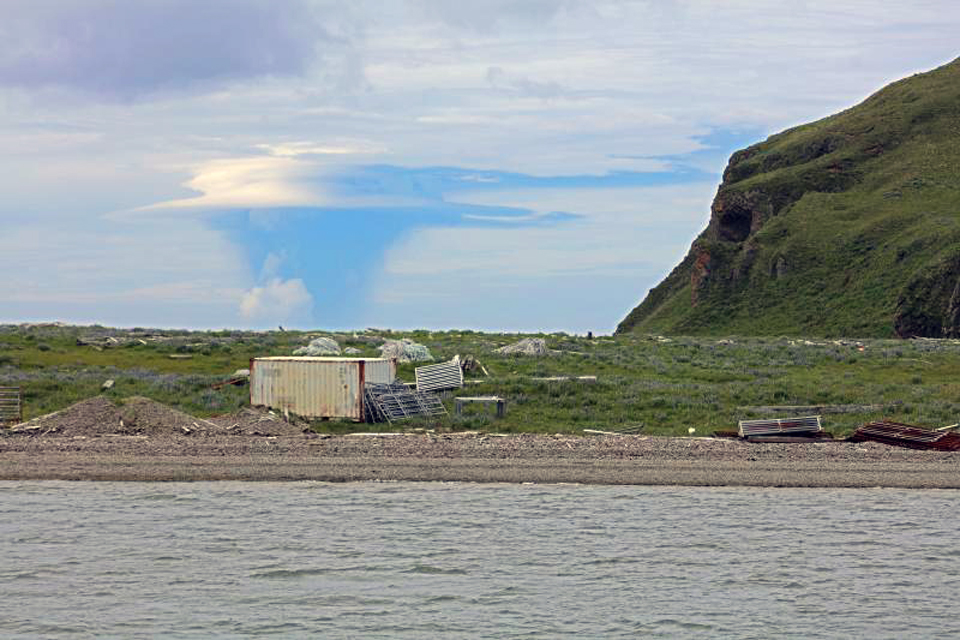 |
Figure 14. Ash plume rising above Bogoslof, 1814 AKDT, 23 June 2017. The view is from Mutton Cove on SW Unalaska Island about 67 km SE of the volcano. AVO estimated the volcanic cloud reached about 11 km above sea level. Photo by Masami Sugiyama courtesy of Allison Everett and AVO. |
A modest thermal signal was detected by the MIROVA system between February and July 2017 consistent with the activity that suggested lava dome growth during that time (figure 15).
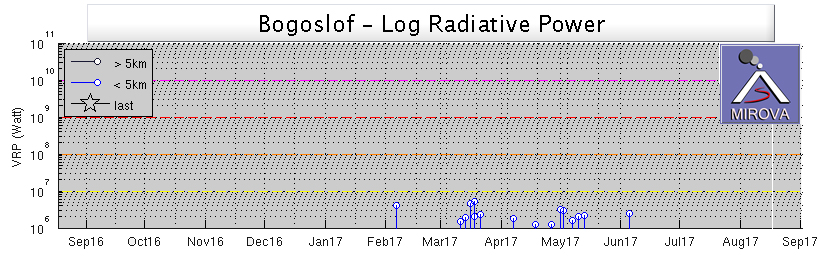 |
Figure 15. MIROVA Log Radiative Power graph of thermal energy at Bogoslof for the year ending on 17 August 2017. A low-level thermal anomaly was first detected in early March, and was intermittent through early July. Courtesy of MIROVA. |
References: Beget, J.E., Larsen, J.F., Neal, C.A., Nye, C.J., and Schaefer, J.R., 2005, Preliminary volcano-hazard assessment for Okmok Volcano, Umnak Island, Alaska: Alaska Division of Geological & Geophysical Surveys Report of Investigation 2004-3, 32 p., 1 sheet, scale 1:150,000.
Information Contacts: Alaska Volcano Observatory (AVO), a cooperative program of a) U.S. Geological Survey, 4200 University Drive, Anchorage, AK 99508-4667 USA (URL: http://www.avo.alaska.edu/), b) Geophysical Institute, University of Alaska, PO Box 757320, Fairbanks, AK 99775-7320, USA, and c) Alaska Division of Geological & Geophysical Surveys, 794 University Ave., Suite 200, Fairbanks, AK 99709, USA (URL: http://www.dggs.alaska.gov/); Anchorage Volcanic Ash Advisory Center (VAAC), Alaska Aviation Weather Unit, NWS NOAA US Dept of Commerce, 6930 Sand Lake Road, Anchorage, AK 99502-1845(URL: http://vaac.arh.noaa.gov/); NASA Earth Observatory, EOS Project Science Office, NASA Goddard Space Flight Center, Goddard, Maryland, USA (URL: http://earthobservatory.nasa.gov/).
Explosions in July and August 2017; new lava dome visible 20-22 August destroyed by explosions that end on 30 August
Intermittent eruptions from Bogoslof, 40 km N of the main Aleutian arc (BGVN 42:09, figure 2), have created and destroyed several distinct islands at the summit of this submarine volcano. Previous eruptions in 1927 and 1992 created lava domes that were subsequently heavily eroded, before the most recent eruption began in December 2016 (figure 16). Numerous explosions with ash plumes significantly changed the morphology of the island between December 2016 and March 2017. Ash plumes rose to over 10 km altitude during May-July 2017 multiple times. A lava dome briefly emerged in early June before it was destroyed by subsequent explosions. This report continues with an account of activity between July and December 2017. Eruptive activity ended on 30 August. Information comes primarily from the Alaska Volcano Observatory (AVO) and the Anchorage Volcanic Ash Advisory Center (VAAC).
|
Figure 16. Worldview satellite image of Bogoslof collected at 2313 UTC on 12 June 2017, two days after a lava dome that appeared in the lagoon was destroyed. The circular embayments were formed by a series of more than 40 explosions that began in mid-December 2016. These explosions greatly reshaped the island as material was removed and redeposited as air fall. Vigorous steaming was visible from a region S of the most active vent areas in the lagoon. Lava extrusion produced a circular dome that first rose above the water on 5 June and grew to a diameter of ~160 m before being destroyed by an explosion early in the day on 10 June. Courtesy of AVO. |
New explosions during 2, 4, 8, and 9-10 July 2017 produced ash plumes that rose from 6.1 to 11 km altitude. Although significant ash clouds were produced, there were no reports of ashfall in nearby communities. After almost a month of quiet, an eruption on 7 August created new tephra deposits, and extended the N shore of the island. This eruption created a significant SO2 plume that was recorded by satellite instruments. Intermittent pulses of tremor were recorded during mid-August. A new lava dome grew between 20 and 22 August to 160 m in diameter before it was destroyed in a series of explosions during 26-30 August. Thermal anomalies were observed in satellite data several times during September, and they tapered off into early October. Steam emissions were still visible in early November when the last weak thermal anomaly was reported. By early December, significant erosion had begun to change the island's shape, and only minor steam emissions were visible in clear satellite images.
Beginning at 1248 local time (AKDT) on 2 July 2017, a significant explosive event was detected in seismic and infrasound data, and observed in satellite imagery. The event lasted about 16 minutes, and produced an ash plume that rose to 11 km altitude and drifted E, passing N of Dutch Harbor. No explosions were reported the following day, but two events were detected in seismic, infrasound, and satellite data on 4 July. The first, at 1651, lasted 13 minutes and produced an eruption cloud that rose to 8.5 km altitude and drifted SE; the second 11-minute-long eruption began at 1907, and produced a small cloud that rose to 9.8 km altitude and drifted SE.
On the morning of 8 July 2017, an eruption with a total duration of 19 minutes began at 1015 AKDT and produced a volcanic cloud reaching an altitude of 9.1 km that drifted N. Overnight during 9-10 July Bogoslof erupted several times; the first two explosions during the 3-hour-long eruption produced a small ash cloud that rose to 6.1 km altitude and drifted SE, dissipating rapidly. Later on 10 July, an 8-minute-long eruption began at 1000 AKDT and a 15-minute-long eruption began at 1706 AKDT; neither produced a significant plume. None of the eruptions on 8, 9, or 10 July caused ashfall in local communities. Weakly elevated surface temperatures were observed in clear satellite images on 12 and 16 July.
Following almost a month of quiet, Bogoslof erupted again on 7 August 2017. The eruption was detected in seismic, infrasound, satellite, and lightning data. The eruption began at 1000 AKDT and lasted for about three hours, producing an ash plume that rose to 9.7 km altitude according to AVO, and drifted S over Umnak Island, then out over the Pacific Ocean. The Anchorage VAAC initially reported the plume at 10.4 km altitude moving S. A later pilot report noted an altitude of 12.2 km. Satellite measurements of sulfur dioxide (SO2) in the eruption cloud indicated the second highest mass of SO2 erupted since the onset of activity in December 2016 (figure 17). Satellite images of the island taken on 8 August showed new tephra deposits had surrounded the vent area, forming a new crater lake, and extending the N shore of the island by 250 m (figure 18).
|
Figure 17. Although the data is coarsely pixelated, it is clear that a substantial SO2 plume emerged from Bogoslof during the 7 August eruption, as recorded by the OMPS instrument on the Suomio NPP satellite. Courtesy of NASA Goddard Space Flight Center. |
|
Figure 18. Worldview true-color satellite image of Bogoslof acquired on 8 August 2017, one day after a 3-hour-long explosive eruption. Ashfall deposits have expanded the island towards the N as the result of the eruption and formed an enclosed crater lake. At the time of this satellite overpass, the level of the crater lake was below sea level. Previous events such as these (that formed a shallow crater lake) formed a deep crater that was subsequently filled by an influx of ocean water. Vigorous steaming was apparent from the likely site of the initial explosive event in mid-December 2016. Sediment coming from erosion of the island is seen offshore surrounding most of the island. A comparison with figure 16, above, shows the extent of new material added on 7 August. Data provided under the Digital Globe NextView License. Courtesy of AVO. |
Several short-duration seismic and infrasound signals were detected at the stations on nearby islands on 9 August 2017. Weakly elevated surface temperatures and a minor steam plume were observed in satellite images. Two short pulses of tremor were seen in seismic data on 14 August, one lasting five minutes and the other lasting three minutes. Seismicity returned to background levels following the pulses and remained quiet until a series of small earthquakes the next morning. Seismicity again returned to background levels by the following afternoon, 16 August, and remained quiet through the rest of that week. Photographs taken during an overflight on 15 August indicated that the vent region, which had dried out during the 7 August eruption, had refilled with water (figure 19).
|
Figure 19. An overflight of Bogoslof on 15 August 2017 showed the increase in area of the crater lake after the eruption of 7 August (see figure 18). View is to the SE. Courtesy of AVO. |
Unrest continued during mid-August 2017, and available data suggested that a lava dome had formed within the intra-island lake just W of the 1992 lava dome. The new dome was first observed on 18 August, and during 20-22 August grew to about 160 m in diameter. Two small explosions were detected in infrasound data at 0410 AKDT on 22 August. These explosions did not produce any volcanic plumes recognizable in satellite data. Elevated surface temperatures were observed on 24 August along with a steam plume extending S about 17 km from the island. Satellite images showed elevated surface temperatures and a robust steam plume the next day drifting 70 km SE. A photo from a nearby low-altitude airplane on 26 August, taken shortly before the next explosion, confirmed the intense steam plume (figure 20) likely caused by the interaction of the new dome with seawater. Two MODVOLC thermal alerts were issued on 25 August, the first two since January 2017, and the last two for the year.
|
Figure 20. Bogoslof volcano with a vigorous steam plume likely caused by interaction of the new, hot lava dome with seawater. Photo by Dave Withrow (NOAA/Fisheries), taken at about 1300 AKDT on 26 August aboard a NOAA twin otter (N56RF) aircraft while surveying harbor seals west of Dutch Harbor. They were 13 nautical miles (24 km) from Bogoslof when photo was taken looking E with a 400 mm lens. Courtesy of AVO. |
An explosive eruption at 1629 AKDT on 26 August 2017 lasted for about four minutes and produced a cloud that was observed in satellite images drifting SE over southern Unalaska Island. Cloud-top temperatures seen in satellite data indicated that it rose as high as 7.3 km altitude. The Anchorage VAAC reported the plume at 8.2 km altitude several hours later. The eruption was observed in seismic, infrasound, and satellite data, and one lightning stroke was detected. Elevated surface temperatures persisted, suggesting to AVO scientists that the lava dome was possibly still present within the crater lake. Three short-duration eruptive events occurred during 27-28 August. On 27 August at 1508 AKDT a brief explosive event lasting about two minutes produced a volcanic cloud that reached about 7.9 km altitude and drifted SE. Another explosive eruption occurred at 0323 AKDT on 28 August and lasted about 25 minutes. Satellite imagery showed only a very small eruption cloud drifting ESE that dissipated quickly. The third event occurred at 1117 AKDT that morning and produced a small ash cloud that likely reached 9 km altitude before dissipating over the North Pacific Ocean. Modeling of ash fallout from the cloud indicated trace to minor ash fall over the Southern Bering Sea in the area just S of the volcano.
Elevated surface temperatures were noted in satellite data on 29 August, along with a steam plume drifting SSE, suggesting to AVO the presence of lava at the surface. An explosive eruption began the next morning at 0405 AKDT and continued intermittently for almost two hours. It produced an ash cloud that reached to about 6 km altitude and drifted SSE, dissipating over the southern Bering Sea and North Pacific Ocean area. A vapor plume extended about 65 km SSE later that day.
AVO reported on 8 September 2017 that available data suggested that the most recent lava dome, first observed on 18 August, was removed by the explosive eruptions of 27-30 August. In addition, a narrow isthmus of new land extended across the crater, bisecting it and creating two lakes. Elevated surface temperatures were recorded in a satellite images on 11, 14, 17, 19, and 23 September. Discolored water was visible in satellite images on 17 September and may have represented outflow from the crater. Elevated surface temperatures continued to be observed in satellite data during periods of clear weather into the first two weeks of October, and again briefly at the beginning of November. Several areas of steam emissions were visible in satellite imagery on 9 October (figure 21).
|
Figure 21. Worldview-3 satellite image of Bogoslof Island acquired on 9 October 2017. The areas that exhibited active steam emission are highlighted with yellow and black dashed lines. Image data acquired with the Digital Globe NextView License. Courtesy of AVO. |
A clear, high-resolution satellite image taken on 2 November showed continued steaming of the ground on the S side of the smaller crater lake. Weakly elevated surface temperatures consistent with a hot crater lake were last observed in clear nighttime satellite images on 10 November 2017. Imagery from 20 November showed warm regions in the crater lagoon and at the site of the steaming that had persisted for several months (see figure 21). AVO scientists noted that this was consistent with a slowly cooling, post-eruptive system, and was likely responsible for the occasional observation of slightly elevated surface temperatures in satellite data. The MIROVA graph of thermal anomalies supported the slow cooling trend observed by AVO after the last explosions on 30 August 2017 (figure 22).
|
Figure 22. The last series of explosive events recorded at Bogoslof during 26-30 August 2017 coincided with the last significant thermal anomalies on the MIROVA graph (infrared MODIS data) that covers the year ending on 19 January 2018. Gradual tapering of thermal anomalies is consistent with AVO satellite observations of a cooling trend during September through early November. Courtesy of MIROVA. |
More than sixty explosive events occurred between 20 December 2016 and 30 August 2017. The most energetic of these sent water-rich, volcanic ash clouds to altitudes exceeding 10.7 km. The resulting dispersed volcanic clouds impacted local and international aviation operations over portions of the North Pacific and Alaska. Although most of the volcanic ash fell into the ocean, trace amounts were twice deposited on the community of Unalaska and the Port of Dutch Harbor. The 2016-17 eruption greatly changed the morphology of Bogoslof Island. At its greatest extent, the area of the island increased to about three times its pre-eruption size. Nearly all of the new material on the island is unconsolidated pyroclastic fall and flow (surge) deposits. The deposits are highly susceptible to wave erosion and additional changes in the configuration of the island are likely. A satellite image from 3 December 2017 shows significant erosion of the island with the vent lagoon opened to the ocean on the north shore of the island (figure 23).
|
Figure 23. Worldview-3 satellite image of Bogoslof Island on 3 December 2017. Erosion of the island by waves had removed substantial material, and no new eruptive material had been added to the island since the end of August 2017. The approximate area of the island in this image was 1.3 square kilometers. Image data acquired with the Digital Globe NextView License. Courtesy of AVO. |
Information Contacts: Alaska Volcano Observatory (AVO), a cooperative program of a) U.S. Geological Survey, 4200 University Drive, Anchorage, AK 99508-4667 USA (URL: http://www.avo.alaska.edu/ ), b) Geophysical Institute, University of Alaska, PO Box 757320, Fairbanks, AK 99775-7320, USA, and c) Alaska Division of Geological & Geophysical Surveys, 794 University Ave., Suite 200, Fairbanks, AK 99709, USA (URL: http://www.dggs.alaska.gov/); Anchorage Volcanic Ash Advisory Center (VAAC), Alaska Aviation Weather Unit, NWS NOAA US Dept of Commerce, 6930 Sand Lake Road, Anchorage, AK 99502-1845(URL: http://vaac.arh.noaa.gov/); MIROVA (Middle InfraRed Observation of Volcanic Activity), a collaborative project between the Universities of Turin and Florence (Italy) supported by the Centre for Volcanic Risk of the Italian Civil Protection Department (URL: http://www.mirovaweb.it/); Hawai'i Institute of Geophysics and Planetology (HIGP), MODVOLC Thermal Alerts System, School of Ocean and Earth Science and Technology (SOEST), Univ. of Hawai'i, 2525 Correa Road, Honolulu, HI 96822, USA (URL: http://modis.higp.hawaii.edu/); NASA Goddard Space Flight Center (NASA/GSFC), Global Sulfur Dioxide Monitoring Page, Atmospheric Chemistry and Dynamics Laboratory, 8800 Greenbelt Road, Goddard, Maryland, USA (URL: https://so2.gsfc.nasa.gov/).
|
|
||||||||||||||||||||||||||
There is data available for 9 confirmed eruptive periods.
2016 Dec 20 - 2017 Aug 30 Confirmed Eruption (Explosive / Effusive) VEI: 3
| Episode 1 | Eruption (Explosive / Effusive) | Central vent, just below sea level | ||||||||||||||||||||||||||||||||||||||||||||||||||||||||||||||||||||||||||||||||||||||||||||||||||||||||||||||||||||||||||||||||||||||||||||||||||||||||||||||||||||||||||||||||||||||||||||||||||||||||||||||||||||||||||||||||||||||||||||||||||||||||||||||||||||||||||||||||||||||||||||||||||||||||||||||||||||||||||||||||||||||||||||||||||||||||||||||||||||||||||||||||||||||||||||||||||||||||||||||||||||||||||||||||||||||||||||||||||||||||||||||||||||||||||||||||||||||||||||||||||||||||||||||||||||||||||||||||||||||||||||||||||||||||||||||||||||||||||||||||||||||||||||||||||||||||||||||||||||||||||||||||||||||||||||||||||||||||||||||||||||||||||||||||||||||||||||||||||||||||||||||||||||||||||||||||||||||||||||||||||||||||||||||||||||||||||||||||||||||||||||||||||||||||||||||||||||||||||||||||||||||||||||||||||||||||||||||||||||||||||||||||||||||||||||||||||||||||||||||||||||||||||||||||||||||||||||||||||||||||||||||||||||||||||||||||||||||||||||||||||||||||||||||||||||||||||||||||||||||
|---|---|---|---|---|---|---|---|---|---|---|---|---|---|---|---|---|---|---|---|---|---|---|---|---|---|---|---|---|---|---|---|---|---|---|---|---|---|---|---|---|---|---|---|---|---|---|---|---|---|---|---|---|---|---|---|---|---|---|---|---|---|---|---|---|---|---|---|---|---|---|---|---|---|---|---|---|---|---|---|---|---|---|---|---|---|---|---|---|---|---|---|---|---|---|---|---|---|---|---|---|---|---|---|---|---|---|---|---|---|---|---|---|---|---|---|---|---|---|---|---|---|---|---|---|---|---|---|---|---|---|---|---|---|---|---|---|---|---|---|---|---|---|---|---|---|---|---|---|---|---|---|---|---|---|---|---|---|---|---|---|---|---|---|---|---|---|---|---|---|---|---|---|---|---|---|---|---|---|---|---|---|---|---|---|---|---|---|---|---|---|---|---|---|---|---|---|---|---|---|---|---|---|---|---|---|---|---|---|---|---|---|---|---|---|---|---|---|---|---|---|---|---|---|---|---|---|---|---|---|---|---|---|---|---|---|---|---|---|---|---|---|---|---|---|---|---|---|---|---|---|---|---|---|---|---|---|---|---|---|---|---|---|---|---|---|---|---|---|---|---|---|---|---|---|---|---|---|---|---|---|---|---|---|---|---|---|---|---|---|---|---|---|---|---|---|---|---|---|---|---|---|---|---|---|---|---|---|---|---|---|---|---|---|---|---|---|---|---|---|---|---|---|---|---|---|---|---|---|---|---|---|---|---|---|---|---|---|---|---|---|---|---|---|---|---|---|---|---|---|---|---|---|---|---|---|---|---|---|---|---|---|---|---|---|---|---|---|---|---|---|---|---|---|---|---|---|---|---|---|---|---|---|---|---|---|---|---|---|---|---|---|---|---|---|---|---|---|---|---|---|---|---|---|---|---|---|---|---|---|---|---|---|---|---|---|---|---|---|---|---|---|---|---|---|---|---|---|---|---|---|---|---|---|---|---|---|---|---|---|---|---|---|---|---|---|---|---|---|---|---|---|---|---|---|---|---|---|---|---|---|---|---|---|---|---|---|---|---|---|---|---|---|---|---|---|---|---|---|---|---|---|---|---|---|---|---|---|---|---|---|---|---|---|---|---|---|---|---|---|---|---|---|---|---|---|---|---|---|---|---|---|---|---|---|---|---|---|---|---|---|---|---|---|---|---|---|---|---|---|---|---|---|---|---|---|---|---|---|---|---|---|---|---|---|---|---|---|---|---|---|---|---|---|---|---|---|---|---|---|---|---|---|---|---|---|---|---|---|---|---|---|---|---|---|---|---|---|---|---|---|---|---|---|---|---|---|---|---|---|---|---|---|---|---|---|---|---|---|---|---|---|---|---|---|---|---|---|---|---|---|---|---|---|---|---|---|---|---|---|---|---|---|---|---|---|---|---|---|---|---|---|---|---|---|---|---|---|---|---|---|---|---|---|---|---|---|---|---|---|---|---|---|---|---|---|---|---|---|---|---|---|---|---|---|---|---|---|---|---|---|---|---|---|---|---|---|---|---|---|---|---|---|---|---|---|---|---|---|---|---|---|---|---|---|---|---|---|---|---|---|---|---|---|---|---|---|---|---|---|---|---|---|---|---|---|---|---|---|---|---|---|---|---|---|---|---|---|---|---|---|---|---|---|---|---|---|---|---|---|---|---|---|---|---|---|---|---|---|---|---|---|---|---|---|---|---|---|---|---|---|---|---|---|---|---|---|---|---|---|---|---|---|---|---|---|---|---|---|---|---|---|---|---|---|---|---|---|---|---|---|---|---|---|---|---|---|---|---|---|---|---|---|---|---|---|---|---|---|---|---|---|---|---|---|---|---|---|---|---|---|---|---|---|---|---|---|---|---|---|---|---|---|---|---|---|---|---|---|---|---|---|---|---|---|---|---|---|---|---|---|---|---|---|---|---|---|---|---|---|---|---|---|---|---|---|---|---|---|---|---|---|---|---|---|---|---|---|---|---|---|---|---|---|---|---|---|---|---|---|---|---|---|---|---|---|---|---|---|---|---|---|---|---|---|---|---|---|---|---|---|---|---|---|---|---|---|---|---|---|---|---|---|---|---|---|---|---|---|---|---|---|---|---|---|---|---|---|---|---|---|---|---|---|---|---|---|---|---|---|---|---|---|---|---|---|---|---|---|---|---|---|---|---|---|---|---|---|---|---|---|---|---|---|---|---|---|---|---|---|---|---|---|---|---|---|---|---|---|---|---|---|---|---|---|---|---|---|---|---|
| 2016 Dec 20 - 2017 Aug 30 | Evidence from Observations: Reported | ||||||||||||||||||||||||||||||||||||||||||||||||||||||||||||||||||||||||||||||||||||||||||||||||||||||||||||||||||||||||||||||||||||||||||||||||||||||||||||||||||||||||||||||||||||||||||||||||||||||||||||||||||||||||||||||||||||||||||||||||||||||||||||||||||||||||||||||||||||||||||||||||||||||||||||||||||||||||||||||||||||||||||||||||||||||||||||||||||||||||||||||||||||||||||||||||||||||||||||||||||||||||||||||||||||||||||||||||||||||||||||||||||||||||||||||||||||||||||||||||||||||||||||||||||||||||||||||||||||||||||||||||||||||||||||||||||||||||||||||||||||||||||||||||||||||||||||||||||||||||||||||||||||||||||||||||||||||||||||||||||||||||||||||||||||||||||||||||||||||||||||||||||||||||||||||||||||||||||||||||||||||||||||||||||||||||||||||||||||||||||||||||||||||||||||||||||||||||||||||||||||||||||||||||||||||||||||||||||||||||||||||||||||||||||||||||||||||||||||||||||||||||||||||||||||||||||||||||||||||||||||||||||||||||||||||||||||||||||||||||||||||||||||||||||||||||||||||||||||||
|
List of 289 Events for Episode 1 at Central vent, just below sea level
|
|||||||||||||||||||||||||||||||||||||||||||||||||||||||||||||||||||||||||||||||||||||||||||||||||||||||||||||||||||||||||||||||||||||||||||||||||||||||||||||||||||||||||||||||||||||||||||||||||||||||||||||||||||||||||||||||||||||||||||||||||||||||||||||||||||||||||||||||||||||||||||||||||||||||||||||||||||||||||||||||||||||||||||||||||||||||||||||||||||||||||||||||||||||||||||||||||||||||||||||||||||||||||||||||||||||||||||||||||||||||||||||||||||||||||||||||||||||||||||||||||||||||||||||||||||||||||||||||||||||||||||||||||||||||||||||||||||||||||||||||||||||||||||||||||||||||||||||||||||||||||||||||||||||||||||||||||||||||||||||||||||||||||||||||||||||||||||||||||||||||||||||||||||||||||||||||||||||||||||||||||||||||||||||||||||||||||||||||||||||||||||||||||||||||||||||||||||||||||||||||||||||||||||||||||||||||||||||||||||||||||||||||||||||||||||||||||||||||||||||||||||||||||||||||||||||||||||||||||||||||||||||||||||||||||||||||||||||||||||||||||||||||||||||||||||||||||||||||||||||||
1992 Jul 6 - 1992 Jul 24 Confirmed Eruption (Explosive / Effusive) VEI: 3
| Episode 1 | Eruption (Explosive / Effusive) | North tip of island (NE of 1927 dome) | ||||||||||||||||||||||||||||||||||||||
|---|---|---|---|---|---|---|---|---|---|---|---|---|---|---|---|---|---|---|---|---|---|---|---|---|---|---|---|---|---|---|---|---|---|---|---|---|---|---|---|
| 1992 Jul 6 - 1992 Jul 24 | Evidence from Observations: Reported | ||||||||||||||||||||||||||||||||||||||
|
List of 6 Events for Episode 1 at North tip of island (NE of 1927 dome)
|
|||||||||||||||||||||||||||||||||||||||
[ 1951 Sep 21 ] Uncertain Eruption
| Episode 1 | Eruption (Explosive / Effusive) | ||||||||||||||
|---|---|---|---|---|---|---|---|---|---|---|---|---|---|---|
| 1951 Sep 21 - Unknown | Evidence from Unknown | |||||||||||||
|
List of 1 Events for Episode 1
|
||||||||||||||
1931 Oct 31 Confirmed Eruption (Explosive / Effusive) VEI: 1
| Episode 1 | Eruption (Explosive / Effusive) | 1926-1927 dome | ||||||||||||||||||||||||||||
|---|---|---|---|---|---|---|---|---|---|---|---|---|---|---|---|---|---|---|---|---|---|---|---|---|---|---|---|---|---|
| 1931 Oct 31 - Unknown | Evidence from Observations: Reported | ||||||||||||||||||||||||||||
|
List of 4 Events for Episode 1 at 1926-1927 dome
|
|||||||||||||||||||||||||||||
1926 Jul - 1928 Confirmed Eruption (Explosive / Effusive) VEI: 2
| Episode 1 | Eruption (Explosive / Effusive) | Between New and Old Bogoslof | ||||||||||||||||||||||||||||||||||||||
|---|---|---|---|---|---|---|---|---|---|---|---|---|---|---|---|---|---|---|---|---|---|---|---|---|---|---|---|---|---|---|---|---|---|---|---|---|---|---|---|
| 1926 Jul - 1928 | Evidence from Observations: Reported | ||||||||||||||||||||||||||||||||||||||
|
List of 6 Events for Episode 1 at Between New and Old Bogoslof
|
|||||||||||||||||||||||||||||||||||||||
[ 1913 Jul ] Uncertain Eruption
| Episode 1 | Eruption (Explosive / Effusive) | Tahoma Peak | |||||||||||||
|---|---|---|---|---|---|---|---|---|---|---|---|---|---|---|
| 1913 Jul - Unknown | Evidence from Unknown | |||||||||||||
|
List of 1 Events for Episode 1 at Tahoma Peak
|
||||||||||||||
1909 Sep - 1910 Sep 19 Confirmed Eruption (Explosive / Effusive) VEI: 2
| Episode 1 | Eruption (Explosive / Effusive) | Tahoma Peak | |||||||||||||||||||||||||||||||||||||||||||
|---|---|---|---|---|---|---|---|---|---|---|---|---|---|---|---|---|---|---|---|---|---|---|---|---|---|---|---|---|---|---|---|---|---|---|---|---|---|---|---|---|---|---|---|---|
| 1909 Sep - 1910 Sep 19 | Evidence from Observations: Reported | |||||||||||||||||||||||||||||||||||||||||||
|
List of 7 Events for Episode 1 at Tahoma Peak
|
||||||||||||||||||||||||||||||||||||||||||||
[ 1908 Jan 15 ± 45 days ] Uncertain Eruption
| Episode 1 | Eruption (Explosive / Effusive) | Metcalf Peak | |||||||||||||
|---|---|---|---|---|---|---|---|---|---|---|---|---|---|---|
| 1908 Jan 15 ± 45 days - Unknown | Evidence from Unknown | |||||||||||||
|
List of 1 Events for Episode 1 at Metcalf Peak
|
||||||||||||||
1906 Mar 1 ± 30 days - 1907 Sep 1 Confirmed Eruption (Explosive / Effusive) VEI: 3
| Episode 1 | Eruption (Explosive / Effusive) | Metcalf Peak, McCullough Peak | |||||||||||||||||||||||||||||||||||||||||||||||||||||
|---|---|---|---|---|---|---|---|---|---|---|---|---|---|---|---|---|---|---|---|---|---|---|---|---|---|---|---|---|---|---|---|---|---|---|---|---|---|---|---|---|---|---|---|---|---|---|---|---|---|---|---|---|---|---|
| 1906 Mar 1 ± 30 days - 1907 Sep 1 | Evidence from Observations: Reported | |||||||||||||||||||||||||||||||||||||||||||||||||||||
|
List of 9 Events for Episode 1 at Metcalf Peak, McCullough Peak
|
||||||||||||||||||||||||||||||||||||||||||||||||||||||
1883 Sep 27 (on or before) - 1895 ± 2 years Confirmed Eruption (Explosive / Effusive) VEI: 3
| Episode 1 | Eruption (Explosive / Effusive) | New Bogoslof (Grewingk) | ||||||||||||||||||||||||||||||||||||||||||||||||
|---|---|---|---|---|---|---|---|---|---|---|---|---|---|---|---|---|---|---|---|---|---|---|---|---|---|---|---|---|---|---|---|---|---|---|---|---|---|---|---|---|---|---|---|---|---|---|---|---|---|
| 1883 Sep 27 (on or before) - 1895 ± 2 years | Evidence from Observations: Reported | ||||||||||||||||||||||||||||||||||||||||||||||||
|
List of 8 Events for Episode 1 at New Bogoslof (Grewingk)
|
|||||||||||||||||||||||||||||||||||||||||||||||||
1806 - 1823 Confirmed Eruption (Explosive / Effusive) VEI: 2
| Episode 1 | Eruption (Explosive / Effusive) | Old Bogoslof (Castle Rock) | ||||||||||||||||||||||||||||||||||||||
|---|---|---|---|---|---|---|---|---|---|---|---|---|---|---|---|---|---|---|---|---|---|---|---|---|---|---|---|---|---|---|---|---|---|---|---|---|---|---|---|
| 1806 - 1823 | Evidence from Observations: Reported | ||||||||||||||||||||||||||||||||||||||
|
List of 6 Events for Episode 1 at Old Bogoslof (Castle Rock)
|
|||||||||||||||||||||||||||||||||||||||
1796 May - 1804 Confirmed Eruption (Explosive / Effusive) VEI: 3 (?)
| Episode 1 | Eruption (Explosive / Effusive) | Old Bogoslof (Castle Rock) | |||||||||||||||||||||||||||||||||||||||||||
|---|---|---|---|---|---|---|---|---|---|---|---|---|---|---|---|---|---|---|---|---|---|---|---|---|---|---|---|---|---|---|---|---|---|---|---|---|---|---|---|---|---|---|---|---|
| 1796 May - 1804 | Evidence from Observations: Reported | |||||||||||||||||||||||||||||||||||||||||||
|
List of 7 Events for Episode 1 at Old Bogoslof (Castle Rock)
|
||||||||||||||||||||||||||||||||||||||||||||
This compilation of synonyms and subsidiary features may not be comprehensive. Features are organized into four major categories: Cones, Craters, Domes, and Thermal Features. Synonyms of features appear indented below the primary name. In some cases additional feature type, elevation, or location details are provided.
Synonyms |
||||
| Agaschagoch | ||||
Domes |
||||
| Feature Name | Feature Type | Elevation | Latitude | Longitude |
| Castle Rock
Old Bogoslof Grewingk |
Dome | |||
| Fire Island
New Bogoslof |
Dome | 100 m | ||
| Mcculloch Peak | Former dome | |||
| Metcalf Domes | Former dome | |||
| Ship Rock | Former dome | |||
| Tahoma Peak | Former dome | |||
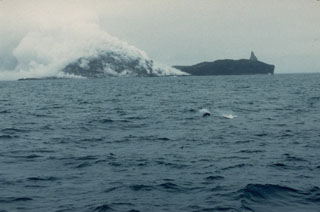 Plumes produced by degassing of a growing lava dome rise from the northern tip of Bogoslof on 21 July 1992. The 1992 eruption was first observed on 6 July when pilots saw steam and ash rising above the volcano. On 20 July an ash plume rose to 8 km. A new lava dome grew to a height of 100-m by the time the eruption ended in late July. The 1927 lava dome forms the dark land to the right with the pinnacle of Castle Rock behind it.
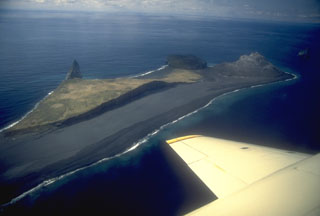 Lava dome remnants from three historical eruptions can be seen in this NW-looking aerial view of Bogoslof Island in the Aleutians. The pinnacle on the left is Castle Rock, also referred to as Old Bogoslof, a remnant of a 1796 lava dome. The circular, flat-topped area to its right is a remnant of a 1927 lava dome. The 1992 eruption produced the light-colored conical lava dome forming the tip of the island at top right. Regular eruptions and vigorous wave erosion frequently modify the island.
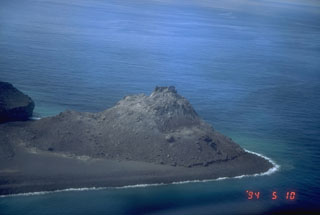 An aerial view shows the 1992 lava dome of Bogoslof Island, the summit of a largely submarine located in the Bering Sea 50 km behind the main Aleutian arc. The 1992 lava dome grew to a height of 100 m in July at the northern tip of the island. In May 1994, when this photograph was taken, the island was about 1.5 x 0.6 km wide, and due to frequent eruptive activity and energetic wave action, has changed shape dramatically since first mapped in the late 1700's.
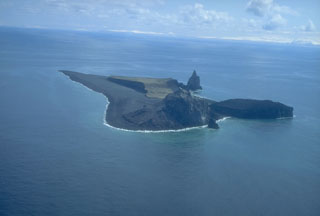 Bogoslof is the summit of a largely submarine volcano located in the Bering Sea, 50 km behind the main Aleutian arc. The island is about 1.5 x 0.6 km wide and due to its frequent eruptive activity and energetic wave action, has changed shape dramatically since it was first mapped in the late 1700s. The rounded lava dome and offshore spire at the northern tip of the island (bottom-center) formed in 1992. The circular, flat area at the right is a remnant of the 1927 lava dome, and the steep pinnacle is Castle Rock, a 1796 dome remnant.
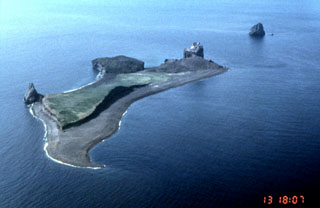 Lava dome remnants from four historical eruptions can be seen in this NW-looking aerial view of Bogoslof in the Aleutians. The pinnacle to the left is Castle Rock, a remnant of a 1796 lava dome. The circular, flat-topped area to its right is a remnant of a 1927 lava dome. An eruption in 1992 produced the light-colored rounded lava dome forming upper right part of the island. The island to the upper right formed in 1883.
The following 11 samples associated with this volcano can be found in the Smithsonian's NMNH Department of Mineral Sciences collections, and may be availble for research (contact the Rock and Ore Collections Manager). Catalog number links will open a window with more information.
| Catalog Number | Sample Description | Lava Source | Collection Date |
|---|---|---|---|
| NMNH 111123-315 | Hornblende Andesite | -- | -- |
| NMNH 111123-316 | Hornblende Andesite | -- | -- |
| NMNH 117642-1 | Pumice | -- | -- |
| NMNH 117642-2 | Pumice | -- | -- |
| NMNH 36855-1 | Volcanic Ash | -- | -- |
| NMNH 36855-2 | Hornblende Andesite | -- | -- |
| NMNH 37033 | Hornblende Andesite | -- | -- |
| NMNH 37034 | Hornblende | -- | -- |
| NMNH 37034-1 | Volcanic Ash | -- | -- |
| NMNH 37034-2 | Volcanic Ash | -- | -- |
| NMNH 37034-3 | Andesite Volcanic Ash | -- | -- |
| Alaska Volcano Observatory (Link to Bogoslof) | The Alaska Volcano Observatory (AVO) is a joint program of the U.S. Geological Survey (USGS), the Geophysical Institute of the University of Alaska Fairbanks (UAFGI), and the State of Alaska Division of Geological and Geophysical Surveys (ADGGS). AVO was formed in 1988, and uses federal, state, and university resources to monitor and study Alaska's hazardous volcanoes, to predict and record eruptive activity, and to mitigate volcanic hazards to life and property. |
| Copernicus Browser | The Copernicus Browser replaced the Sentinel Hub Playground browser in 2023, to provide access to Earth observation archives from the Copernicus Data Space Ecosystem, the main distribution platform for data from the EU Copernicus missions. |
| MIROVA | Middle InfraRed Observation of Volcanic Activity (MIROVA) is a near real time volcanic hot-spot detection system based on the analysis of MODIS (Moderate Resolution Imaging Spectroradiometer) data. In particular, MIROVA uses the Middle InfraRed Radiation (MIR), measured over target volcanoes, in order to detect, locate and measure the heat radiation sourced from volcanic activity. |
| MODVOLC Thermal Alerts | Using infrared satellite Moderate Resolution Imaging Spectroradiometer (MODIS) data, scientists at the Hawai'i Institute of Geophysics and Planetology, University of Hawai'i, developed an automated system called MODVOLC to map thermal hot-spots in near real time. For each MODIS image, the algorithm automatically scans each 1 km pixel within it to check for high-temperature hot-spots. When one is found the date, time, location, and intensity are recorded. MODIS looks at every square km of the Earth every 48 hours, once during the day and once during the night, and the presence of two MODIS sensors in space allows at least four hot-spot observations every two days. Each day updated global maps are compiled to display the locations of all hot spots detected in the previous 24 hours. There is a drop-down list with volcano names which allow users to 'zoom-in' and examine the distribution of hot-spots at a variety of spatial scales. |
|
WOVOdat
Single Volcano View Temporal Evolution of Unrest Side by Side Volcanoes |
WOVOdat is a database of volcanic unrest; instrumentally and visually recorded changes in seismicity, ground deformation, gas emission, and other parameters from their normal baselines. It is sponsored by the World Organization of Volcano Observatories (WOVO) and presently hosted at the Earth Observatory of Singapore.
GVMID Data on Volcano Monitoring Infrastructure The Global Volcano Monitoring Infrastructure Database GVMID, is aimed at documenting and improving capabilities of volcano monitoring from the ground and space. GVMID should provide a snapshot and baseline view of the techniques and instrumentation that are in place at various volcanoes, which can be use by volcano observatories as reference to setup new monitoring system or improving networks at a specific volcano. These data will allow identification of what monitoring gaps exist, which can be then targeted by remote sensing infrastructure and future instrument deployments. |
| Volcanic Hazard Maps | The IAVCEI Commission on Volcanic Hazards and Risk has a Volcanic Hazard Maps database designed to serve as a resource for hazard mappers (or other interested parties) to explore how common issues in hazard map development have been addressed at different volcanoes, in different countries, for different hazards, and for different intended audiences. In addition to the comprehensive, searchable Volcanic Hazard Maps Database, this website contains information about diversity of volcanic hazard maps, illustrated using examples from the database. This site is for educational purposes related to volcanic hazard maps. Hazard maps found on this website should not be used for emergency purposes. For the most recent, official hazard map for a particular volcano, please seek out the proper institutional authorities on the matter. |
| IRIS seismic stations/networks | Incorporated Research Institutions for Seismology (IRIS) Data Services map showing the location of seismic stations from all available networks (permanent or temporary) within a radius of 0.18° (about 20 km at mid-latitudes) from the given location of Bogoslof. Users can customize a variety of filters and options in the left panel. Note that if there are no stations are known the map will default to show the entire world with a "No data matched request" error notice. |
| UNAVCO GPS/GNSS stations | Geodetic Data Services map from UNAVCO showing the location of GPS/GNSS stations from all available networks (permanent or temporary) within a radius of 20 km from the given location of Bogoslof. Users can customize the data search based on station or network names, location, and time window. Requires Adobe Flash Player. |
| DECADE Data | The DECADE portal, still in the developmental stage, serves as an example of the proposed interoperability between The Smithsonian Institution's Global Volcanism Program, the Mapping Gas Emissions (MaGa) Database, and the EarthChem Geochemical Portal. The Deep Earth Carbon Degassing (DECADE) initiative seeks to use new and established technologies to determine accurate global fluxes of volcanic CO2 to the atmosphere, but installing CO2 monitoring networks on 20 of the world's 150 most actively degassing volcanoes. The group uses related laboratory-based studies (direct gas sampling and analysis, melt inclusions) to provide new data for direct degassing of deep earth carbon to the atmosphere. |
| Large Eruptions of Bogoslof | Information about large Quaternary eruptions (VEI >= 4) is cataloged in the Large Magnitude Explosive Volcanic Eruptions (LaMEVE) database of the Volcano Global Risk Identification and Analysis Project (VOGRIPA). |
| EarthChem | EarthChem develops and maintains databases, software, and services that support the preservation, discovery, access and analysis of geochemical data, and facilitate their integration with the broad array of other available earth science parameters. EarthChem is operated by a joint team of disciplinary scientists, data scientists, data managers and information technology developers who are part of the NSF-funded data facility Integrated Earth Data Applications (IEDA). IEDA is a collaborative effort of EarthChem and the Marine Geoscience Data System (MGDS). |