


Increased seismicity occurred at Martin during 8 January until at least 15 January. About 300 earthquakes were recorded during 2 days, in contrast to the background rate of ~25 earthquakes per month since the seismic network was installed in 1996. AVO increased the Concern Color Code to Yellow. AVO reported that swarms of earthquakes of this nature are common at volcanoes such as Martin, and do not suggest that eruptive activity is imminent. Satellite data showed nothing unusual, although steaming is frequently observed at the volcano.
Source: US Geological Survey Alaska Volcano Observatory (AVO)
Seismic swarm in January 2006
Activity at Mount Martin volcano since our last report (March 1995, BGVN 20:03) was marked by typical activity (summit fumarolic activity, often generating thick steam plumes reaching up to 1 km above the summit; Neal and others, 2009), occasionally interrupted by increased seismicity. The most notable event was a seismic swarm in January 2006.
Outstanding activity. An increase in seismicity during October 1996 was attributed to an actively degassing intrusion at the neighboring Mount Mageik volcano, ~7 km ENE of Martin (Jolly and McNutt, 1999). Other increases in seismicity occurred in December 1998, May-July 1999, January 2006 (the largest swarm at Martin since it has been monitored, discussed below), and May-June 2007 (figure 1).
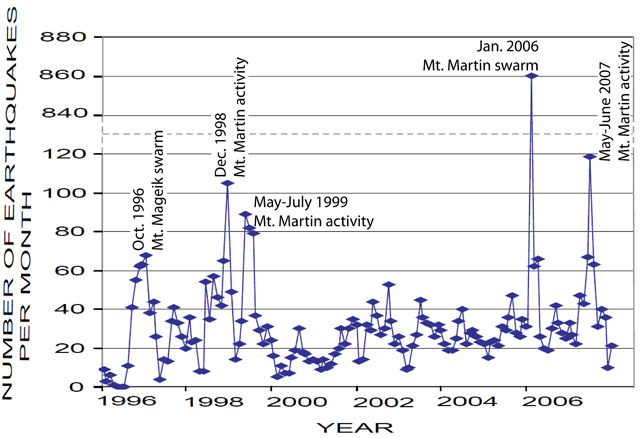 |
Figure 1. Number of earthquakes recorded per month at Mount Martin since 1996. Five episodes of increased seismicity are shown, the most notable of which was the January 2006 seismic swarm at Martin. Note the break in scale on the y-axis, denoted by the horizontal dashed line. Modified from Dixon and Power (2009). |
January 2006 seismic swarm. The January 2006 Mount Martin seismic swarm included 860 locatable earthquakes (figures 1 and 2), more than four times the number of earthquakes seen during other periods of increased seismicity or seismic swarms since the region has been monitored. No recorded earthquakes during the swarm were much greater than M 2 (figure 2d), and a significant number of earthquakes were of magnitudes below the magnitude of completeness, Mc (figure 2a-c). Mc is the minimum magnitude needed to reliably locate an earthquake, reported by Dixon and Power (2009) to be Mc = 0.2 for Mount Martin.
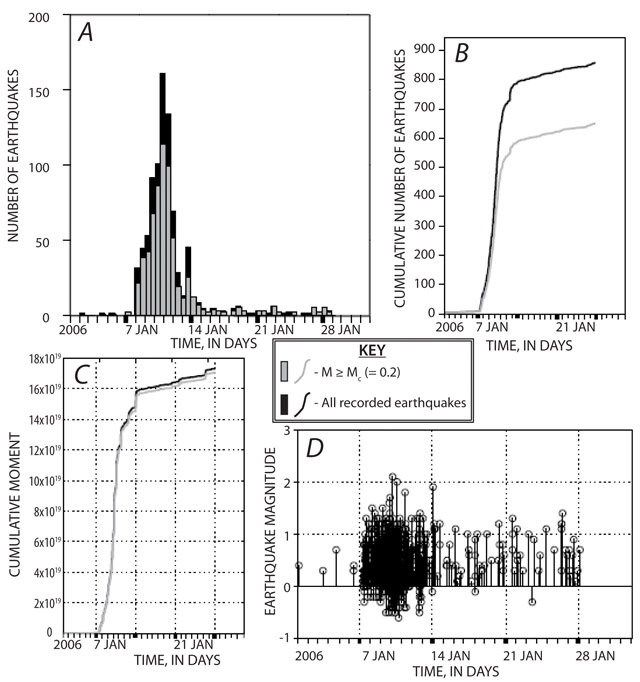 |
Figure 2. Plots highlighting the January 2006 Mount Martin seismic swarm. (A) Number of earthquakes per day; (B) cumulative number of earthquakes; (C) cumulative seismic moment; (D) magnitude of each recorded earthquake. In plots A-C, black symbols indicate all recorded earthquakes, and gray symbols indicate locatable earthquakes (earthquakes with magnitudes equal to or above the magnitude of completeness, M ≥ Mc = 0.2 (explained in text). |
Dixon and Power (2009) concluded that the pattern of the seismicity of the January 2006 swarm was characteristic of a volcanic earthquake sequence (as opposed to a tectonic earthquake sequence, which begins with a large mainshock) since the located hypocenters of the swarm occurred in the same space as those during previous background periods (figure 3). However, citing the short duration of the swarm, similar focal mechanisms compared to background periods, and the lack of long-period earthquakes, Dixon and Power (2009) stated that the data was not suggestive of a large intrusion of magma beneath Martin.
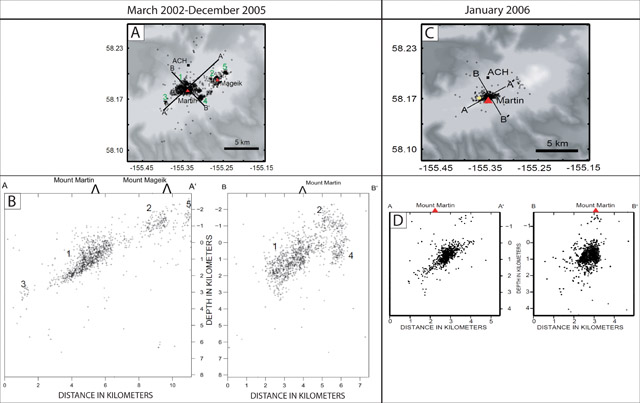 |
Figure 3.Located earthquake hypocenters at Mount Martin during March 2002-December 2005 (map view shown in A, cross section in B) and during the January 2006 seismic swarm (map view shown in C, cross section in D). The graphs indicate that the hypocenters of the seismic swarm earthquakes occurred within the same volume as those that occurred during previous background period, suggesting that the earthquakes were characteristic of a volcanic earthquake sequence. Modified from Dixon and Power (2009). |
References. Dixon, J.P., and Power, J.A., 2009, The January 2006 Volcanic-tectonic earthquake swarm at Mount Martin, Alaska, in Haeussler, P.J., and Galloway, J.P., eds, Studies by the U.S. Geological Survey in Alaska, 2007: U.S. Geological Survey Professional Paper 1760-D, 17 p.
Jolly, A.D., McNutt, S.R., 1999, Seismicity at the volcanoes of Katmai National Park, Alaska; July 1995-December 1997, Journal of Volcanology and Geothermal Research, vol. 93, issues 3-4, pg. 173-190 (DOI: 10.1016/S0377-0273(99)00115-8).
Neal, C.A., McGimsey, R.G., Dixon, J.P., Manevich, A., and Rybin, A., 2009, 2006 Volcanic Activity in Alaska, Kamchatka, and the Kurile Islands: Summary of Events and Response of the Alaska Volcano Observatory, U.S. Geological Survey Scientific Investigations Report 2008-5214, 102 p.
Information Contacts: Alaska Volcano Observatory (AVO), a cooperative program of a) U.S. Geological Survey (USGS), 4200 University Drive, Anchorage, AK 99508-4667 USA (URL: http://www.avo.alaska.edu/), b) Geophysical Institute, University of Alaska, PO Box 757320, Fairbanks, AK 99775-7320, USA, and c) Alaska Division of Geological & Geophysical Surveys (ADGGS), 794 University Ave., Suite 200, Fairbanks, AK 99709, USA (URL: http://www.dggs.alaska.gov/).
2006: January
Increased seismicity occurred at Martin during 8 January until at least 15 January. About 300 earthquakes were recorded during 2 days, in contrast to the background rate of ~25 earthquakes per month since the seismic network was installed in 1996. AVO increased the Concern Color Code to Yellow. AVO reported that swarms of earthquakes of this nature are common at volcanoes such as Martin, and do not suggest that eruptive activity is imminent. Satellite data showed nothing unusual, although steaming is frequently observed at the volcano.
Source: US Geological Survey Alaska Volcano Observatory (AVO)
Reports are organized chronologically and indexed below by Month/Year (Publication Volume:Number), and include a one-line summary. Click on the index link or scroll down to read the reports.
Large steam plumes, but no eruptive activity
On 15 March, the U.S. National Weather Service received a report from the town of King Salmon of steam plumes rising 600-900 m over the general vicinity of Mount Martin volcano in Katmai National Park. No eruptive activity was detected during analysis of satellite imagery. The mostly ice-covered Mount Martin stratovolcano has a poorly documented record of minor historical eruptive activity. However, vigorous steam plumes from its summit crater are common.
Information Contacts: Alaska Volcano Observatory.
Seismic swarm in January 2006
Activity at Mount Martin volcano since our last report (March 1995, BGVN 20:03) was marked by typical activity (summit fumarolic activity, often generating thick steam plumes reaching up to 1 km above the summit; Neal and others, 2009), occasionally interrupted by increased seismicity. The most notable event was a seismic swarm in January 2006.
Outstanding activity. An increase in seismicity during October 1996 was attributed to an actively degassing intrusion at the neighboring Mount Mageik volcano, ~7 km ENE of Martin (Jolly and McNutt, 1999). Other increases in seismicity occurred in December 1998, May-July 1999, January 2006 (the largest swarm at Martin since it has been monitored, discussed below), and May-June 2007 (figure 1).
|
Figure 1. Number of earthquakes recorded per month at Mount Martin since 1996. Five episodes of increased seismicity are shown, the most notable of which was the January 2006 seismic swarm at Martin. Note the break in scale on the y-axis, denoted by the horizontal dashed line. Modified from Dixon and Power (2009). |
January 2006 seismic swarm. The January 2006 Mount Martin seismic swarm included 860 locatable earthquakes (figures 1 and 2), more than four times the number of earthquakes seen during other periods of increased seismicity or seismic swarms since the region has been monitored. No recorded earthquakes during the swarm were much greater than M 2 (figure 2d), and a significant number of earthquakes were of magnitudes below the magnitude of completeness, Mc (figure 2a-c). Mc is the minimum magnitude needed to reliably locate an earthquake, reported by Dixon and Power (2009) to be Mc = 0.2 for Mount Martin.
|
Figure 2. Plots highlighting the January 2006 Mount Martin seismic swarm. (A) Number of earthquakes per day; (B) cumulative number of earthquakes; (C) cumulative seismic moment; (D) magnitude of each recorded earthquake. In plots A-C, black symbols indicate all recorded earthquakes, and gray symbols indicate locatable earthquakes (earthquakes with magnitudes equal to or above the magnitude of completeness, M ≥ Mc = 0.2 (explained in text). |
Dixon and Power (2009) concluded that the pattern of the seismicity of the January 2006 swarm was characteristic of a volcanic earthquake sequence (as opposed to a tectonic earthquake sequence, which begins with a large mainshock) since the located hypocenters of the swarm occurred in the same space as those during previous background periods (figure 3). However, citing the short duration of the swarm, similar focal mechanisms compared to background periods, and the lack of long-period earthquakes, Dixon and Power (2009) stated that the data was not suggestive of a large intrusion of magma beneath Martin.
|
Figure 3.Located earthquake hypocenters at Mount Martin during March 2002-December 2005 (map view shown in A, cross section in B) and during the January 2006 seismic swarm (map view shown in C, cross section in D). The graphs indicate that the hypocenters of the seismic swarm earthquakes occurred within the same volume as those that occurred during previous background period, suggesting that the earthquakes were characteristic of a volcanic earthquake sequence. Modified from Dixon and Power (2009). |
References. Dixon, J.P., and Power, J.A., 2009, The January 2006 Volcanic-tectonic earthquake swarm at Mount Martin, Alaska, in Haeussler, P.J., and Galloway, J.P., eds, Studies by the U.S. Geological Survey in Alaska, 2007: U.S. Geological Survey Professional Paper 1760-D, 17 p.
Jolly, A.D., McNutt, S.R., 1999, Seismicity at the volcanoes of Katmai National Park, Alaska; July 1995-December 1997, Journal of Volcanology and Geothermal Research, vol. 93, issues 3-4, pg. 173-190 (DOI: 10.1016/S0377-0273(99)00115-8).
Neal, C.A., McGimsey, R.G., Dixon, J.P., Manevich, A., and Rybin, A., 2009, 2006 Volcanic Activity in Alaska, Kamchatka, and the Kurile Islands: Summary of Events and Response of the Alaska Volcano Observatory, U.S. Geological Survey Scientific Investigations Report 2008-5214, 102 p.
Information Contacts: Alaska Volcano Observatory (AVO), a cooperative program of a) U.S. Geological Survey (USGS), 4200 University Drive, Anchorage, AK 99508-4667 USA (URL: http://www.avo.alaska.edu/), b) Geophysical Institute, University of Alaska, PO Box 757320, Fairbanks, AK 99775-7320, USA, and c) Alaska Division of Geological & Geophysical Surveys (ADGGS), 794 University Ave., Suite 200, Fairbanks, AK 99709, USA (URL: http://www.dggs.alaska.gov/).
This compilation of synonyms and subsidiary features may not be comprehensive. Features are organized into four major categories: Cones, Craters, Domes, and Thermal Features. Synonyms of features appear indented below the primary name. In some cases additional feature type, elevation, or location details are provided.
Cones |
||||
| Feature Name | Feature Type | Elevation | Latitude | Longitude |
| Alagogshak | Stratovolcano | 1835 m | 58° 9' 30" N | 155° 23' 0" W |
|
|
||||||||||||||||||||||||
There is data available for 4 confirmed Holocene eruptive periods.
1953 Feb 17 Confirmed Eruption
| Episode 1 | Eruption Episode | Volcano Uncertain: SW of Trident; probably Martin | ||||||||||||||
|---|---|---|---|---|---|---|---|---|---|---|---|---|---|---|---|
| 1953 Feb 17 - Unknown | Evidence from Unknown | ||||||||||||||
|
List of 1 Events for Episode 1 at Volcano Uncertain: SW of Trident; probably Martin
| |||||||||||||||
1951 Jul 22 Confirmed Eruption
| Episode 1 | Eruption Episode | Volcano Uncertain: Kukak Bay ashfall; probably Martin | ||||||||||||||
|---|---|---|---|---|---|---|---|---|---|---|---|---|---|---|---|
| 1951 Jul 22 - Unknown | Evidence from Unknown | ||||||||||||||
|
List of 1 Events for Episode 1 at Volcano Uncertain: Kukak Bay ashfall; probably Martin
| |||||||||||||||
0800 BCE ± 50 years Confirmed Eruption
| Episode 1 | Eruption Episode | ||||||||||||||||||||
|---|---|---|---|---|---|---|---|---|---|---|---|---|---|---|---|---|---|---|---|---|
| 0800 BCE ± 50 years - Unknown | Evidence from Isotopic: 14C (uncalibrated) | |||||||||||||||||||
|
List of 2 Events for Episode 1
| ||||||||||||||||||||
1750 BCE (?) Confirmed Eruption
| Episode 1 | Eruption Episode | |||||||||||||||||||||||||
|---|---|---|---|---|---|---|---|---|---|---|---|---|---|---|---|---|---|---|---|---|---|---|---|---|---|
| 1750 BCE (?) - Unknown | Evidence from Isotopic: 14C (uncalibrated) | ||||||||||||||||||||||||
|
List of 3 Events for Episode 1
| |||||||||||||||||||||||||
There is data available for 1 deformation periods. Expand each entry for additional details.
| Start Date: 1995 | Stop Date: 2010 | Direction: Uplift | Method: InSAR |
| Magnitude: Unknown | Spatial Extent: 20.00 km | Latitude: 58.000 | Longitude: -155.000 |
Remarks: A deformation signal near Martin, Mageik, and Trident volcanoes has been observed with InSAR. There is a gap in InSAR data coverage between 2000 and 2004, but the uplift is likely continuous. | |||
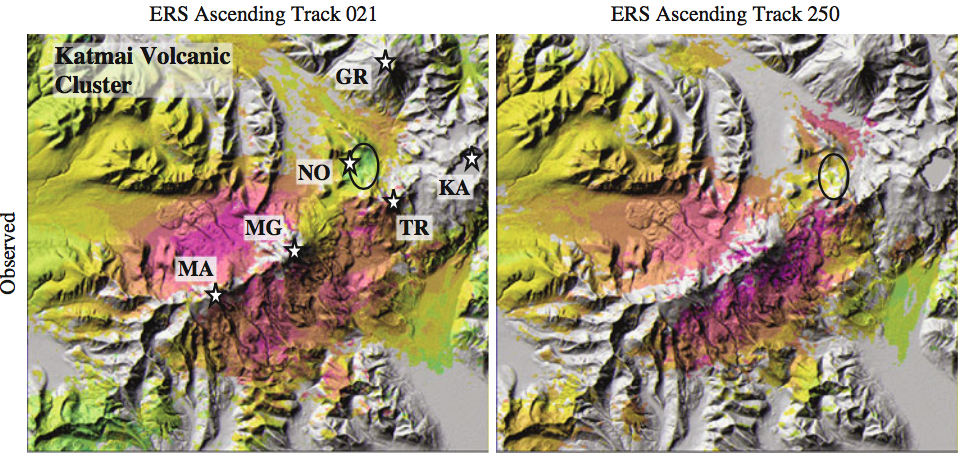 |
Averaged deformation images of the Mount Martin?Mount Mageik area produced by stacking high- quality ERS-1 and ERS-2 interferograms for 1995?2000 from two ascending tracks, 021 and 250. Ellipse outlines an area of subsidence near Novarupta dome. A full cycle of colors (i.e., one interferometric fringe) represents 28 mm/year of LOS surface displacement. Areas of loss of InSAR coherence are not colored. See Fig. 6.197 for meanings of labels From: Lu and Dzurisin 2014. |
||
Reference List: Lu and Dzurisin 2014.
Full References:
Lu Z, Dzurisin D, 2014. InSAR imaging of Aleutian volcanoes: monitoring a volcanic arc from space. Springer-Verlag Berlin Heidelberg. https://doi.org/10.1007/978-3-642-00348-6
There is no Emissions History data available for Martin.
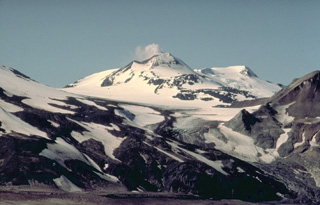 A steam plume is a nearly constant feature at the summit of Mount Martin, seen here from the NE in the Valley of Ten Thousand Smokes. Martin volcano is extensively covered by glaciers, but is only moderately dissected. Its youngest and largest lava flow traveled from the summit 12 km down the upper Angle Creek valley, behind the ridge at the right. The slopes at the left are the northern flank of Mount Mageik.
 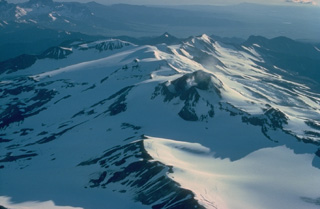 Mount Martin is a large glacier-mantled stratovolcano that anchors the SW end of NE-SW-trending chain of volcanoes cutting across Katmai National Park. A large postglacial lava flow extends 12 km to the NW. A 500-m-wide summit crater is largely ice-free because of strong fumarolic activity. This 1978 view looks down the long axis of elongated Mount Martin from the NE.
 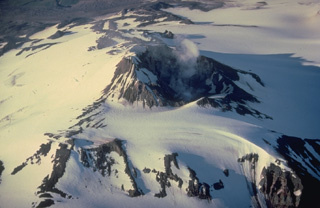 An almost-constant steam plume rises from the 500-m-wide summit crater of Mount Martin. High heat flux at the summit keeps the crater largely free of snow and ice despite the extensive glacial cover on the rest of the volcano. A small lake sometimes forms on the crater floor.
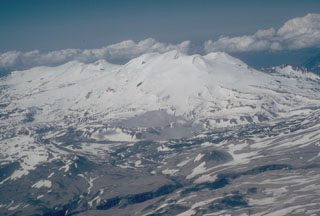 Mount Mageik is in the center of this aerial view from the east, south of Katmai Pass. Martin forms the skyline left of Mageik, and lava flows on the flanks of Trident volcano are visible to the middle right. The three volcanoes are part of a NE-SW chain across Katmai National Park. Much of the surface of Mageik is composed of Holocene lava flows.
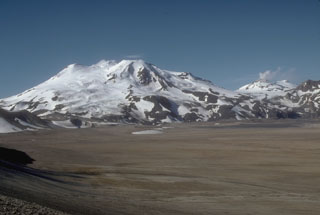 Mount Mageik (left) and Mount Martin (distant right) tower above the flat floor of the Valley of Ten Thousand Smokes. The deposits in the valley are pyroclastic flows that formed during the 1912 eruption of Novarupta, the largest eruption of the 20th century. Glacier-covered Mageik has a broad summit containing multiple cones and vents.
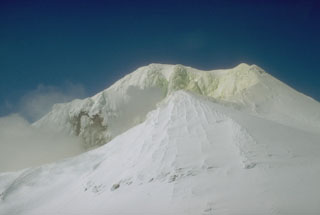 Mount Martin is located at the southern end of the group of volcanoes in the Katmai area. Gases rise from the summit crater and sulfur has accumulated on the snow and ice in this 1990 view. The crater, which opens to the east, is the site of intense fumarolic activity and sometimes contains a small crater lake.
The maps shown below have been scanned from the GVP map archives and include the volcano on this page. Clicking on the small images will load the full 300 dpi map. Very small-scale maps (such as world maps) are not included. The maps database originated over 30 years ago, but was only recently updated and connected to our main database. We welcome users to tell us if they see incorrect information or other problems with the maps; please use the Contact GVP link at the bottom of the page to send us email.
There are no samples for Martin in the Smithsonian's NMNH Department of Mineral Sciences Rock and Ore collection.
| Alaska Volcano Observatory (Link to Martin) | The Alaska Volcano Observatory (AVO) is a joint program of the U.S. Geological Survey (USGS), the Geophysical Institute of the University of Alaska Fairbanks (UAFGI), and the State of Alaska Division of Geological and Geophysical Surveys (ADGGS). AVO was formed in 1988, and uses federal, state, and university resources to monitor and study Alaska's hazardous volcanoes, to predict and record eruptive activity, and to mitigate volcanic hazards to life and property. |
| Copernicus Browser | The Copernicus Browser replaced the Sentinel Hub Playground browser in 2023, to provide access to Earth observation archives from the Copernicus Data Space Ecosystem, the main distribution platform for data from the EU Copernicus missions. |
| MIROVA | Middle InfraRed Observation of Volcanic Activity (MIROVA) is a near real time volcanic hot-spot detection system based on the analysis of MODIS (Moderate Resolution Imaging Spectroradiometer) data. In particular, MIROVA uses the Middle InfraRed Radiation (MIR), measured over target volcanoes, in order to detect, locate and measure the heat radiation sourced from volcanic activity. |
| MODVOLC Thermal Alerts | Using infrared satellite Moderate Resolution Imaging Spectroradiometer (MODIS) data, scientists at the Hawai'i Institute of Geophysics and Planetology, University of Hawai'i, developed an automated system called MODVOLC to map thermal hot-spots in near real time. For each MODIS image, the algorithm automatically scans each 1 km pixel within it to check for high-temperature hot-spots. When one is found the date, time, location, and intensity are recorded. MODIS looks at every square km of the Earth every 48 hours, once during the day and once during the night, and the presence of two MODIS sensors in space allows at least four hot-spot observations every two days. Each day updated global maps are compiled to display the locations of all hot spots detected in the previous 24 hours. There is a drop-down list with volcano names which allow users to 'zoom-in' and examine the distribution of hot-spots at a variety of spatial scales. |
|
WOVOdat
Single Volcano View Temporal Evolution of Unrest Side by Side Volcanoes |
WOVOdat is a database of volcanic unrest; instrumentally and visually recorded changes in seismicity, ground deformation, gas emission, and other parameters from their normal baselines. It is sponsored by the World Organization of Volcano Observatories (WOVO) and presently hosted at the Earth Observatory of Singapore.
GVMID Data on Volcano Monitoring Infrastructure The Global Volcano Monitoring Infrastructure Database GVMID, is aimed at documenting and improving capabilities of volcano monitoring from the ground and space. GVMID should provide a snapshot and baseline view of the techniques and instrumentation that are in place at various volcanoes, which can be use by volcano observatories as reference to setup new monitoring system or improving networks at a specific volcano. These data will allow identification of what monitoring gaps exist, which can be then targeted by remote sensing infrastructure and future instrument deployments. |
| Volcanic Hazard Maps | The IAVCEI Commission on Volcanic Hazards and Risk has a Volcanic Hazard Maps database designed to serve as a resource for hazard mappers (or other interested parties) to explore how common issues in hazard map development have been addressed at different volcanoes, in different countries, for different hazards, and for different intended audiences. In addition to the comprehensive, searchable Volcanic Hazard Maps Database, this website contains information about diversity of volcanic hazard maps, illustrated using examples from the database. This site is for educational purposes related to volcanic hazard maps. Hazard maps found on this website should not be used for emergency purposes. For the most recent, official hazard map for a particular volcano, please seek out the proper institutional authorities on the matter. |
| IRIS seismic stations/networks | Incorporated Research Institutions for Seismology (IRIS) Data Services map showing the location of seismic stations from all available networks (permanent or temporary) within a radius of 0.18° (about 20 km at mid-latitudes) from the given location of Martin. Users can customize a variety of filters and options in the left panel. Note that if there are no stations are known the map will default to show the entire world with a "No data matched request" error notice. |
| UNAVCO GPS/GNSS stations | Geodetic Data Services map from UNAVCO showing the location of GPS/GNSS stations from all available networks (permanent or temporary) within a radius of 20 km from the given location of Martin. Users can customize the data search based on station or network names, location, and time window. Requires Adobe Flash Player. |
| DECADE Data | The DECADE portal, still in the developmental stage, serves as an example of the proposed interoperability between The Smithsonian Institution's Global Volcanism Program, the Mapping Gas Emissions (MaGa) Database, and the EarthChem Geochemical Portal. The Deep Earth Carbon Degassing (DECADE) initiative seeks to use new and established technologies to determine accurate global fluxes of volcanic CO2 to the atmosphere, but installing CO2 monitoring networks on 20 of the world's 150 most actively degassing volcanoes. The group uses related laboratory-based studies (direct gas sampling and analysis, melt inclusions) to provide new data for direct degassing of deep earth carbon to the atmosphere. |
| Large Eruptions of Martin | Information about large Quaternary eruptions (VEI >= 4) is cataloged in the Large Magnitude Explosive Volcanic Eruptions (LaMEVE) database of the Volcano Global Risk Identification and Analysis Project (VOGRIPA). |
| EarthChem | EarthChem develops and maintains databases, software, and services that support the preservation, discovery, access and analysis of geochemical data, and facilitate their integration with the broad array of other available earth science parameters. EarthChem is operated by a joint team of disciplinary scientists, data scientists, data managers and information technology developers who are part of the NSF-funded data facility Integrated Earth Data Applications (IEDA). IEDA is a collaborative effort of EarthChem and the Marine Geoscience Data System (MGDS). |