

AVO reported that seismic activity at Iliamna began to increase at around 1200 on 5 June. Initially earthquakes occurred about every one minute, then became more closely spaced. The source of the activity was possibly from movement of magma or hydrothermal fluids beneath the volcano, though similar activity had been observed before large mass movements or avalanches; AVO could not rule out either. The Aviation Color Code was raised to Yellow (the second lowest level on a four-color scale) and the Volcano Alert Level was raised to Advisory (the second lowest level on a four-level scale).
The earthquake activity culminated in an ice-rock avalanche just before 1714. There was no visual confirmation, but the signals matched historical observations associated with avalanches at Red Glacier on the E flank. Seismicity declined to background levels. The Aviation Color Code was lowered to Green (the lowest level on a four-color scale) and the Volcano Alert Level was lowered to Normal (the lowest level on a four-level scale).
Source: US Geological Survey Alaska Volcano Observatory (AVO)
Rockfalls and fumarolic activity continue with spike in early 2012
Iliamna was last discussed in September 1997 (BGVN 22:09). This report is largely based on seismic data extracted from Alaska Volcano Observatory (AVO) yearly reports for 1997 to 2011, with the exception of an increase of seismicity during early 2012 that was reported by various sources. From the start of 2012, both rockfalls and seismicity progressively increased; this prompted AVO to increase the Alert Level to Advisory in March 2012. A map showing the location of Iliamna in relation to nearby volcanoes and communities is depicted in figure 1. Figures 2 and 3 are topographic maps showing Iliamna's known debris avalanches and rockfall deposits.
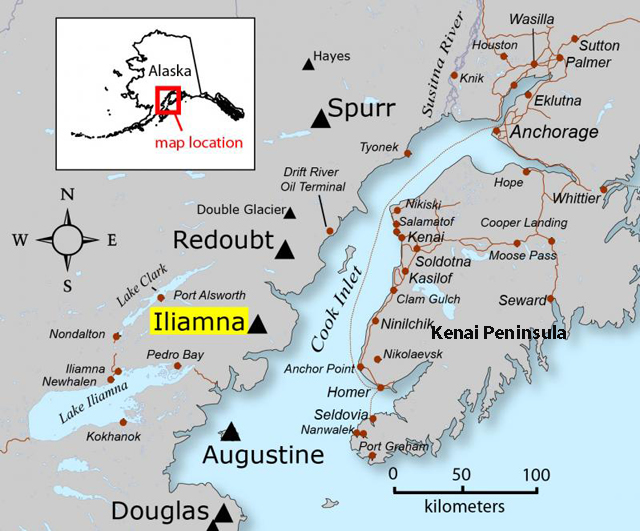 |
Figure 1. Map of Iliamna and nearby volcanoes and communities. Iliamna is in SW Alaska near the mouth of the Cook Inlet, and W of the Kenai Peninsula. Courtesy of AVO. |
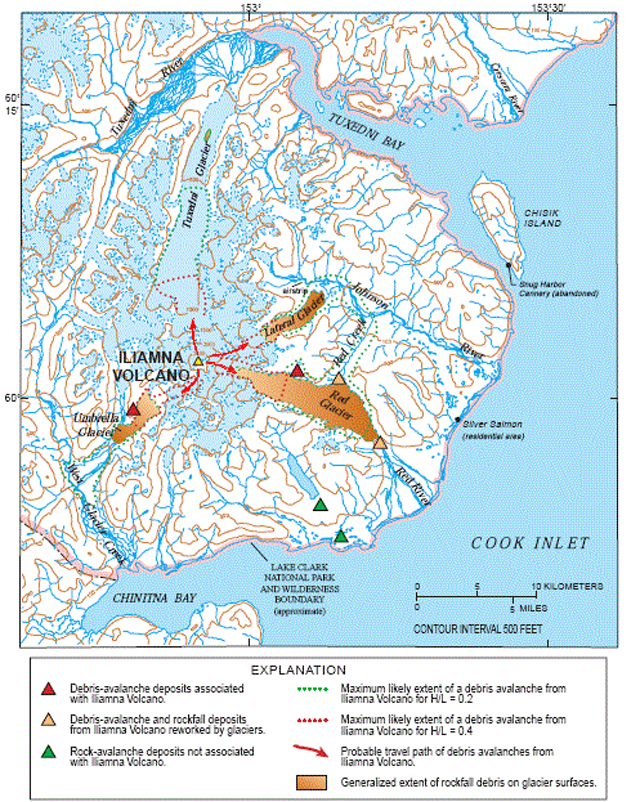 |
Figure 2. Iliamna topographic mapping of known debris-avalanche and rockfall deposits. As indicated in the explanation (bottom), red triangles indicate debris avalanches associated with Iliamna, pale orange triangles indicate debris avalanches associated with Iliamna that have been reworked by glaciers, green triangles indicate debris avalanches not associated with Iliamna, green and red dashed lines indicate the maximum likely extent of debris avalanches with relatively long and short runouts, respectively, potential pathways of debris avalanches are indicated by red arrows, and orange shaded areas indicate the generalized extent of rockfall debris on glacier surfaces. Courtesy of Waythomas (1999). |
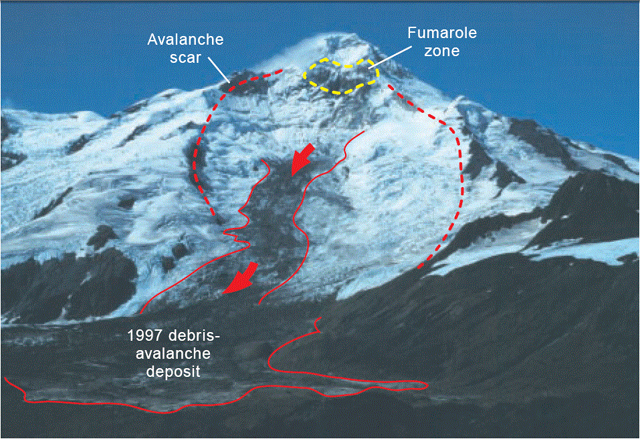 |
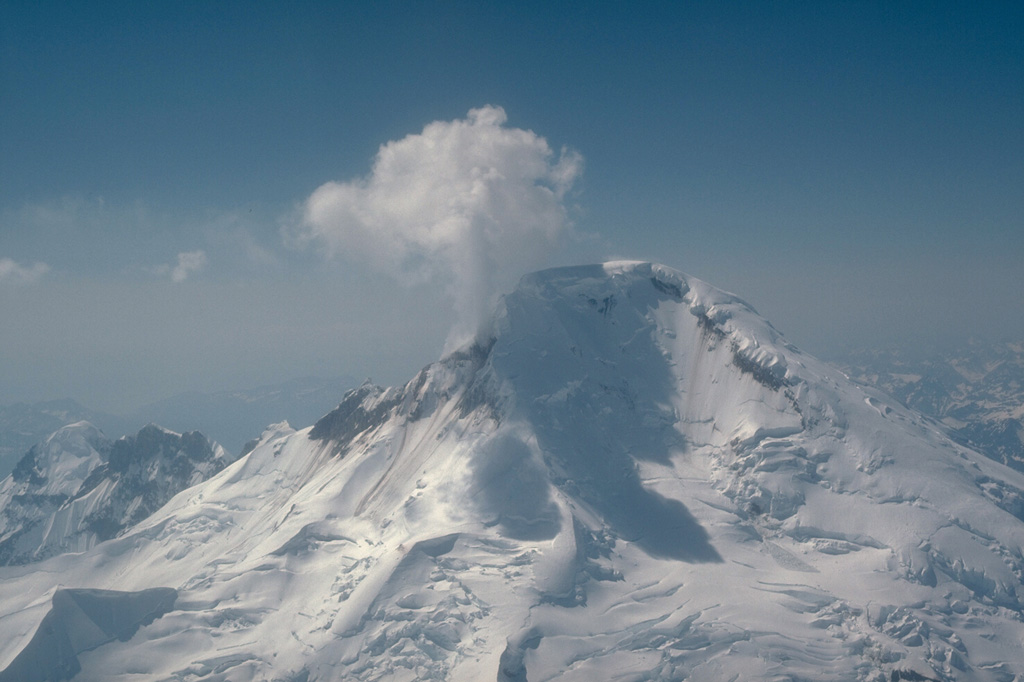
Figure 3. View of the SE flank of Iliamna Volcano showing debris-avalanche deposits from 1997 (solid red line), the fumarole zone near the summit (yellow dashed line), and the older avalanche scar at the head of Red Glacier (red dashed line). Photo undated; courtesy of Waythomas (1999). |
Most of the upper edifice exposes highly altered, unstable rock and shows scars from mass wasting. The E scar has been the source of frequent non-volcanic gravitational collapses producing mixed avalanches of ice, snow, rock, and mud that typically extend several kilometers downslope. Some are large enough to be visible from the Kenai Peninsula (Neal and others, 1995; McGimsey and Wallace, 1999).
Reports on Iliamna's seismicity since early 1997 are sparse. According to AVO, a pilot reported a fresh deposit of mud and rock on the upper NE flank on 6 July 1999. However, spring and summer avalanches are common on the glacier-dominated summit.
On 25 July 2003, an avalanche of snow, ice, and rock occurred. The event lasted four minutes and was recorded by seismometers located 75 km away on Augustine volcano. The avalanche presumably originated from the same vicinity as in previous years, a steep portion of the SE flank adjacent to an extensive permanent fumarolic zone above a debris-avalanche deposit (figure 3; Neal and others, 1995; McGimsey and Wallace, 1999; McGimsey and others, 2004).
On 15 May 2005, AVO seismologists noted a swarm of unusual seismic activity at Iliamna. The events were emergent and prolonged (the longest lasted 5-8 minutes) and were strongest at seismic station ILS, located on the S flank of South Twin (figure 4). The activity began at about 1250 UTC and tapered off at 1718 UTC. Analysis revealed that the signals most likely were caused by a surficial process, such as a snow avalanche (a common occurrence on Iliamna), but this particular event lacked the usual precursory seismicity preceding other Iliamna snow and ice avalanches ( Caplan-Auerbach and others, 2004; J. Caplan-Auerbach, written commun., 2005; Caplan-Auerbach and Huggel, 2007).
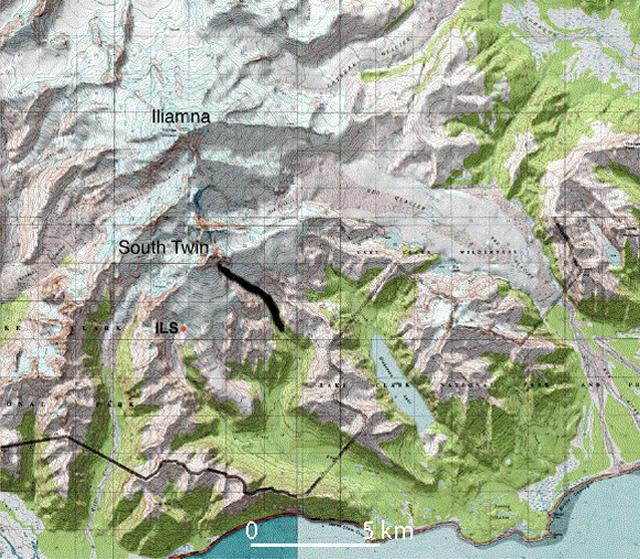 |
Figure 4. Iliamna volcano topographic map showing the location of the 15 May 2005 rockslide as a thick black line on the S flank of South Twin and the seismic station ILS as a red dot. Lake Clark National Park boundary shown as a thin black line. Base map provided by C. Waythomas, AVO/USGS; courtesy of McGimsey (2008). |
During an overflight on 16 May 2005, Lee Fink of Lake Clark National Park observed a large, fresh rock slide (not a snow or ice avalanche) SE of Iliamna that began at ~1,980 m elevation on the SE flank of South Twin, and ran down to ~365 m elevation (figure 5a). Along the lengthy ridge extending S of Iliamna (including both South Twin, North Twin, and a large unnamed massif) are steep, exposed sections of bedrock. The 15 May rockfall occurred below the ridge (figure 5b).
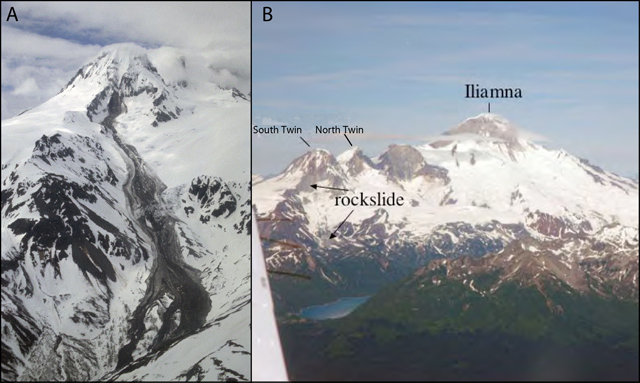 |
Figure 5. (a) Rock avalanche on SE flank of S Twin (topographic high at upper center) beginning at ~2 km elevation and running down to ~0.37 km elevation. Photo by Page Spencer, Lake Clark National Park, 16 May 2005. (b) Iliamna from the E captured on 12 July 2006. The arrows mark the location of the 15 May 2005 rock avalanche. Photo by Christinia Neal, AVO/USGS. Courtesy of McGimsey (2008). |
During Iliamna's mid-May 2005 rock slide, earthquakes at Augustine volcano, ~100 km SSW of Iliamna in the Cook Inlet, increased from 2 per day in April to 70 per day by the end of the year (McGimsey, 2008). However, no evidence exists that this increase disturbed Iliamna. Other factors such as temperature changes, ice and snow mass (and other conditions) would have contributed to the weakening of the summit material at Iliamna.
According to AVO, earthquake numbers increased significantly between 2008-2009, but returned to near-normal levels in 2010 (table 1).
Table 1. Numbers and types of earthquakes at Iliamna between 2008 and 2010. Key: VT, volcanic tremor; LF, low frequency; Mc, magnitude of completion (lowest magnitude detectable); and '--', not reported. Courtesy of AVO.
| Year | Total Earthquakes | Volcanic Tremor | Low-frequency | Other | Magnitude of completion (lowest magnitude detectable) |
| 2008 | 102 | -- | -- | -- | -- |
| 2009 | 173 | 159 | 13 | 1 | 0.3 |
| 2010 | 76 | 61 | 15 | 0 | 0.2 |
Early 2012 elevated seismicity. AVO reported that during December 2011-February 2012, earthquake activity steadily increased. During the first week of March 2012, numerous earthquakes occurred that varied in number and magnitude. According to a press account (Alaskan Dispatch), on 8 March, a moderate M 4.1 earthquake struck the region. On 9 March, AVO increased the Alert Level to Advisory and the Aviation Color Code to Yellow. AVO reported that the increased activity was a significant change, but also noted that a similarly energetic episode of seismic unrest from September 1996 to February 1997 did not lead to an eruption.
Between 9 March through at least 3 April 2012, seismicity remained above background levels. Satellite images acquired during 9-16 March showed a plume drifting 56 km downwind that was likely water vapor. An AVO report noted that long-lived fumaroles at the summit of Iliamna frequently produced visible plumes, but the current plume appeared to be more robust than usual. Scientists aboard an overflight on 17 March observed vigorous and plentiful fumaroles at the summit, consistent with elevated gas emissions. Gas measurements indicated that the volcano was emitting elevated levels of SO2 and CO2, consistent with a magmatic source. During the overflight, scientists did not observe obvious signs of recent rockfalls, such as large areas of newly exposed bedrock or unusual disturbance of the glacial ice. Some deformation of the ice at the headwall of the Red Glacier on the E side of the summit was observed, but it is not clear that this was related to the current volcanic unrest; glacier avalanching is common on this very steep area and was last seen in 2008. During 25-27 March, activity declined somewhat to just above background levels. When not obscured by clouds, satellite and web camera views showed nothing unusual.
References. Caplan-Auerbach, J., Prejean, S.G., and Power, J.A., 2004, Seismic recordings of ice and debris avalanches of Iliamna Volcano (Alaska): Acta Vulcanologica, v. 16, n. 1-2, p. 9-20.
Caplan-Auerbach, J., and Huggel, C., 2007, Precursory seismicity associated with frequent, large ice avalanches on Iliamna volcano, Alaska, USA: Journal of Glaciology, v. 53, n. 180, p. 128-140.
Detterman, R.L., and Hartsock, J.K., 1966, Geology of the Iniskin-Tuxedni region, Alaska: U.S. Geological Survey Professional Paper 512, 78 p.
Dixon, J.P., and Stihler, S.D., 2009, Catalog of earthquake hypocenters at Alaskan volcanoes: January 1 through December 31, 2008: U.S. Geological Survey Data Series 467, 88 p. Available at http://pubs.usgs.gov/ds/467/
Dixon, J.P., Stihler, S.D., Power, J.A., and Searcy, C.K., 2010, Catalog of earthquake hypocenters at Alaskan volcanoes: January 1 through December 31, 2009: U.S. Geological Survey Data Series 531, 84 p. Available online at http://pubs.usgs.gov/ds/531/
McGimsey, R.G., and Wallace, K.L., 1999, 1997 volcanic activity in Alaska and Kamchatka: Summary of events and response of the Alaska Volcano Observatory: U.S. Geological Survey Open-File Report OF 99-0448, 42 p.
McGimsey, R.G., Neal, C.A., and Girina, O., 2004, 1999 Volcanic activity in Alaska and Kamchatka: Summary of events and response of the Alaska Volcano Observatory: U.S. Geological Survey Open-File Report OF 2004-1033, 49 p.
McGimsey, R.G., Neal, C.A., Dixon, J.P., and Ushakov, S., 2008, 2005 Volcanic activity in Alaska, Kamchatka, and the Kurile Islands: Summary of events and response of the Alaska Volcano Observatory: U.S. Geological Survey Scientific Investigations Report 2007-5269, 94 p.
Neal, C.A., Doukas, M.P., and McGimsey, R.G., 1995, 1994 volcanic activity in Alaska-Summary of events and response of Alaska Volcano Observatory: U.S. Geological Survey Open-File Report OF 95-271, 18 p. [Iliamna, p. 4-5].
Waythomas, C.F. and Miller, T.P., 1999, Preliminary Volcano-Hazard Assessment for Iliamna Volcano, U.S. Geological Survey Open-File Report OF 99-373.
Information Contacts: Alaska Volcano Observatory (AVO), a cooperative program of a) U.S. Geological Survey, 4200 University Drive, Anchorage, AK 99508-4667 USA (URL: http://www.avo.alaska.edu/), b) Geophysical Institute, University of Alaska, PO Box 757320, Fairbanks, AK 99775-7320, USA, and c) Alaska Division of Geological & Geophysical Surveys, 794 University Ave., Suite 200, Fairbanks, AK 99709, USA (URL: http://www.dggs.alaska.gov/); Alaskan Dispatch (URL: http://www.alaskadispatch.com/).
2023: May
2013: January
2012: March
| October
AVO reported that seismic activity at Iliamna began to increase at around 1200 on 5 June. Initially earthquakes occurred about every one minute, then became more closely spaced. The source of the activity was possibly from movement of magma or hydrothermal fluids beneath the volcano, though similar activity had been observed before large mass movements or avalanches; AVO could not rule out either. The Aviation Color Code was raised to Yellow (the second lowest level on a four-color scale) and the Volcano Alert Level was raised to Advisory (the second lowest level on a four-level scale).
The earthquake activity culminated in an ice-rock avalanche just before 1714. There was no visual confirmation, but the signals matched historical observations associated with avalanches at Red Glacier on the E flank. Seismicity declined to background levels. The Aviation Color Code was lowered to Green (the lowest level on a four-color scale) and the Volcano Alert Level was lowered to Normal (the lowest level on a four-level scale).
Source: US Geological Survey Alaska Volcano Observatory (AVO)
On 9 January, AVO reported that unrest at Iliamna had decreased over the past several months, reaching background levels. The Volcano Alert Level was lowered to Normal and the Aviation Color Code was lowered to Green. The report also noted that occasional small earthquakes had continued, but at a greatly reduced rate and magnitude relative to the peak of unrest in March 2012. Steam and sulfur gas emissions continued to be observed from sites near the summit during periods of favorable meteorological conditions, not unusual at Iliamna.
Source: US Geological Survey Alaska Volcano Observatory (AVO)
AVO reported that during 24-30 October seismicity at Iliamna remained slightly elevated. Clear satellite and web camera views showed nothing unusual. The Alert Level remained at Advisory and the Aviation Color Code remained at Yellow.
Source: US Geological Survey Alaska Volcano Observatory (AVO)
AVO reported that during 28 March-3 April seismicity at Iliamna remained above background levels, although just slightly, during 25-27 March. When not obscured by clouds, satellite and web camera views showed nothing unusual. The Alert Level remained at Advisory and the Aviation Color Code remained at Yellow.
Source: US Geological Survey Alaska Volcano Observatory (AVO)
AVO reported that during 21-27 March seismicity at Iliamna remained above background levels, although just slightly during 25-27 March. When not obscured by clouds, satellite and web camera views showed nothing unusual. The Alert Level remained at Advisory and the Aviation Color Code remained at Yellow.
Source: US Geological Survey Alaska Volcano Observatory (AVO)
AVO reported that during 9-20 March seismicity at Iliamna was above background levels. Satellite images acquired during 9-16 March showed a plume drifting 56 km downwind that was likely water vapor. The report noted that long-lived fumaroles at the summit of Iliamna frequently produced visible plumes, but the current plume appeared to be more robust than usual. Scientists aboard an overflight on 17 March observed vigorous and plentiful fumaroles at the summit, consistent with the elevated gas emissions. Gas measurements indicated that the volcano was emitting elevated levels of sulfur dioxide and carbon dioxide. The Alert Level remained at Advisory and the Aviation Color Code remained at Yellow.
Source: US Geological Survey Alaska Volcano Observatory (AVO)
AVO reported that earthquake activity had steadily increased at Iliamna during the past three months. On 9 March AVO increased the Alert Level to Advisory and the Aviation Color Code to Yellow. The report noted that the current activity was characterized by numerous earthquakes that had varied in their number and magnitude over the past week.
Source: US Geological Survey Alaska Volcano Observatory (AVO)
Reports are organized chronologically and indexed below by Month/Year (Publication Volume:Number), and include a one-line summary. Click on the index link or scroll down to read the reports.
Steam emissions for 2.5 hours
A brief steam emission began at about 1050 on 7 November. Puffs of steam, ejected every 1-5 minutes, rose an estimated 3 km above the summit. No ash was visible in the steam puffs. The activity ended at about 1330. Iliamna's last reported activity occurred 1952-53. A USGS seismic station 20 km NNE of Iliamna recorded no unusual seismicity.
Information Contacts: J. Proffett, Anaconda Co., Anchorage; J. Kienle, Univ. of Alaska; J. Lahr, USGS, Menlo Park, CA.
Large steam plume
At 0800 on 19 March Reeve Aleutian Airways pilots Edward Livingston and Dale Schram observed a large steam plume rising about 1100 m above the summit. No ash appeared in the plume. Almost 3 hours later Northern Air Cargo pilot Wallace Niles observed a steam plume rising 1,000 m above the summit from a upper S flank vent. The plume drifted NNW. John Reeder noted that minor steam emissions are nearly continuous from Iliamna but a large steam plume is unusual.
Information Contacts: J. Reeder, ADGGS.
Seismicity rises; 40 metric tons/day of SO2
Seismicity began to increase on 1 August and persisted for the whole month. Several to 20 events of M 0.1-3.2 were recorded each day at depths from within the volcanic edifice to 9 km below sea level. All events seemed to be volcano-tectonic, and no long-period earthquakes or tremors that usually precede eruptions were observed. A similar but less intense cluster of earthquakes also occurred during mid-May of this year. AVO installed two additional seismic stations on the volcano in late August in order to increase the detection sensitivity and improve earthquake locations.
Two flights were conducted in late August to measure volcanic gas emissions. SO2 flux was at the background rate of ~40 t/d. CO2, often indicative of magmatic degassing, was also detected.
Information Contacts: Alaska Volcano Observatory (AVO), a cooperative program of a) U.S. Geological Survey, 4200 University Drive, Anchorage, AK 99508-4667, USA (URL: http://www.avo.alaska.edu/), b) Geophysical Institute, University of Alaska, PO Box 757320, Fairbanks, AK 99775-7320, USA, and c) Alaska Division of Geological & Geophysical Surveys, 794 University Ave., Suite 200, Fairbanks, AK 99709, USA.
Increased seismic activity persists in September and early October
A small shallow earthquake swarm occurred beneath Iliamna during mid-May. After two months of ensuing quiescence, seismic activity increased on 1 August (BGVN 21:08). During September and the first half of October, 6 to 27 events were recorded each day at depths within the edifice to 9 km below sea level. Most of them were less than M 1.0 and the largest was M 3.2. All events seemed to be volcano-tectonic, and no long-period earthquakes or tremors that usually precede eruptions were detected. This seismicity was likely related to an intrusion of magma, but doest not mean that an eruption is imminent.
Information Contacts: Alaska Volcano Observatory (AVO), a cooperative program of a) U.S. Geological Survey, 4200 University Drive, Anchorage, AK 99508-4667, USA (URL: http://www.avo.alaska.edu/), b) Geophysical Institute, University of Alaska, PO Box 757320, Fairbanks, AK 99775-7320, USA, and c) Alaska Division of Geological & Geophysical Surveys, 794 University Ave., Suite 200, Fairbanks, AK 99709, USA; NOAA/NESDIS Satellite Analysis Branch (SAB), Room 401, 5200 Auth Road, Camp Springs, MD 20746, USA.
Seismic swarm that began on 1 August continues through November
The seismic swarm that began on 1 August beneath Iliamna (BGVN 21:08 and 21:09) continued during 12 October-29 November at an average rate of 3-12 earthquakes/day. The swarm center is ~5 km S of the summit. All events (mostly M <1.0) were <10 km deep and seemed to be volcano-tectonic. No long-period earthquakes or tremors that usually precede eruptions were detected. This seismicity was likely related to an intrusion of magma, but does not mean that an eruption is imminent.
Information Contacts: Alaska Volcano Observatory (AVO), a cooperative program of a) U.S. Geological Survey, 4200 University Drive, Anchorage, AK 99508-4667, USA (URL: http://www.avo.alaska.edu/), b) Geophysical Institute, University of Alaska, PO Box 757320, Fairbanks, AK 99775-7320, USA, and c) Alaska Division of Geological & Geophysical Surveys, 794 University Ave., Suite 200, Fairbanks, AK 99709, USA.
Seismic swarm from 1 August continues into 1997
The seismic swarm that began on 1 August (BGVN 21:08-21:10) continued during December and the first half of January. There were 2-16 earthquakes recorded each day.
Information Contacts: Alaska Volcano Observatory (AVO), a cooperative program of a) U.S. Geological Survey, 4200 University Drive, Anchorage, AK 99508-4667, USA (URL: http://www.avo.alaska.edu/), b) Geophysical Institute, University of Alaska, PO Box 757320, Fairbanks, AK 99775-7320, USA, and c) Alaska Division of Geological & Geophysical Surveys, 794 University Ave., Suite 200, Fairbanks, AK 99709, USA.
Seismic swarm ends in March
A seismic swarm that began on 1 August 1996 (BGVN 21:08) continued during late 1996 and into early January 1997 (BGVN 21:09, 21:10, and 21:12) with earthquakes occurring at a rate of 11/day. Activity began to decline during 11-17 January, when only two events/day were recorded. The swarm continued through 24 January at an average rate of less than one earthquake/day, a significant reduction from the rate two weeks earlier. Seismic activity through the end of February averaged 2-5 events/day. Earthquake counts decreased again during 1-7 March to a rate of 1/day, then decreased to only one locatable earthquake during the week of 15-21 March. By 28 March seismicity was reported to be at background levels.
Iliamna is a deeply dissected stratovolcano 225 km SW of Anchorage in the Aleutian Range. The volcano is almost entirely covered with perennial snowfields and valley glaciers. A prominent fumarole field near the summit produces steam plumes that are commonly visible from Anchorage and the Kenai Peninsula on clear days.
Information Contacts: Alaska Volcano Observatory (AVO), a cooperative program of a) U.S. Geological Survey, 4200 University Drive, Anchorage, AK 99508-4667, USA (URL: http://www.avo.alaska.edu/), b) Geophysical Institute, University of Alaska, PO Box 757320, Fairbanks, AK 99775-7320, USA, and c) Alaska Division of Geological & Geophysical Surveys, 794 University Ave., Suite 200, Fairbanks, AK 99709, USA.
Rockfalls and fumarolic activity continue with spike in early 2012
Iliamna was last discussed in September 1997 (BGVN 22:09). This report is largely based on seismic data extracted from Alaska Volcano Observatory (AVO) yearly reports for 1997 to 2011, with the exception of an increase of seismicity during early 2012 that was reported by various sources. From the start of 2012, both rockfalls and seismicity progressively increased; this prompted AVO to increase the Alert Level to Advisory in March 2012. A map showing the location of Iliamna in relation to nearby volcanoes and communities is depicted in figure 1. Figures 2 and 3 are topographic maps showing Iliamna's known debris avalanches and rockfall deposits.
|
Figure 1. Map of Iliamna and nearby volcanoes and communities. Iliamna is in SW Alaska near the mouth of the Cook Inlet, and W of the Kenai Peninsula. Courtesy of AVO. |
|
Figure 2. Iliamna topographic mapping of known debris-avalanche and rockfall deposits. As indicated in the explanation (bottom), red triangles indicate debris avalanches associated with Iliamna, pale orange triangles indicate debris avalanches associated with Iliamna that have been reworked by glaciers, green triangles indicate debris avalanches not associated with Iliamna, green and red dashed lines indicate the maximum likely extent of debris avalanches with relatively long and short runouts, respectively, potential pathways of debris avalanches are indicated by red arrows, and orange shaded areas indicate the generalized extent of rockfall debris on glacier surfaces. Courtesy of Waythomas (1999). |
|
Figure 3. View of the SE flank of Iliamna Volcano showing debris-avalanche deposits from 1997 (solid red line), the fumarole zone near the summit (yellow dashed line), and the older avalanche scar at the head of Red Glacier (red dashed line). Photo undated; courtesy of Waythomas (1999). |
Most of the upper edifice exposes highly altered, unstable rock and shows scars from mass wasting. The E scar has been the source of frequent non-volcanic gravitational collapses producing mixed avalanches of ice, snow, rock, and mud that typically extend several kilometers downslope. Some are large enough to be visible from the Kenai Peninsula (Neal and others, 1995; McGimsey and Wallace, 1999).
Reports on Iliamna's seismicity since early 1997 are sparse. According to AVO, a pilot reported a fresh deposit of mud and rock on the upper NE flank on 6 July 1999. However, spring and summer avalanches are common on the glacier-dominated summit.
On 25 July 2003, an avalanche of snow, ice, and rock occurred. The event lasted four minutes and was recorded by seismometers located 75 km away on Augustine volcano. The avalanche presumably originated from the same vicinity as in previous years, a steep portion of the SE flank adjacent to an extensive permanent fumarolic zone above a debris-avalanche deposit (figure 3; Neal and others, 1995; McGimsey and Wallace, 1999; McGimsey and others, 2004).
On 15 May 2005, AVO seismologists noted a swarm of unusual seismic activity at Iliamna. The events were emergent and prolonged (the longest lasted 5-8 minutes) and were strongest at seismic station ILS, located on the S flank of South Twin (figure 4). The activity began at about 1250 UTC and tapered off at 1718 UTC. Analysis revealed that the signals most likely were caused by a surficial process, such as a snow avalanche (a common occurrence on Iliamna), but this particular event lacked the usual precursory seismicity preceding other Iliamna snow and ice avalanches ( Caplan-Auerbach and others, 2004; J. Caplan-Auerbach, written commun., 2005; Caplan-Auerbach and Huggel, 2007).
|
Figure 4. Iliamna volcano topographic map showing the location of the 15 May 2005 rockslide as a thick black line on the S flank of South Twin and the seismic station ILS as a red dot. Lake Clark National Park boundary shown as a thin black line. Base map provided by C. Waythomas, AVO/USGS; courtesy of McGimsey (2008). |
During an overflight on 16 May 2005, Lee Fink of Lake Clark National Park observed a large, fresh rock slide (not a snow or ice avalanche) SE of Iliamna that began at ~1,980 m elevation on the SE flank of South Twin, and ran down to ~365 m elevation (figure 5a). Along the lengthy ridge extending S of Iliamna (including both South Twin, North Twin, and a large unnamed massif) are steep, exposed sections of bedrock. The 15 May rockfall occurred below the ridge (figure 5b).
|
Figure 5. (a) Rock avalanche on SE flank of S Twin (topographic high at upper center) beginning at ~2 km elevation and running down to ~0.37 km elevation. Photo by Page Spencer, Lake Clark National Park, 16 May 2005. (b) Iliamna from the E captured on 12 July 2006. The arrows mark the location of the 15 May 2005 rock avalanche. Photo by Christinia Neal, AVO/USGS. Courtesy of McGimsey (2008). |
During Iliamna's mid-May 2005 rock slide, earthquakes at Augustine volcano, ~100 km SSW of Iliamna in the Cook Inlet, increased from 2 per day in April to 70 per day by the end of the year (McGimsey, 2008). However, no evidence exists that this increase disturbed Iliamna. Other factors such as temperature changes, ice and snow mass (and other conditions) would have contributed to the weakening of the summit material at Iliamna.
According to AVO, earthquake numbers increased significantly between 2008-2009, but returned to near-normal levels in 2010 (table 1).
Table 1. Numbers and types of earthquakes at Iliamna between 2008 and 2010. Key: VT, volcanic tremor; LF, low frequency; Mc, magnitude of completion (lowest magnitude detectable); and '--', not reported. Courtesy of AVO.
| Year | Total Earthquakes | Volcanic Tremor | Low-frequency | Other | Magnitude of completion (lowest magnitude detectable) |
| 2008 | 102 | -- | -- | -- | -- |
| 2009 | 173 | 159 | 13 | 1 | 0.3 |
| 2010 | 76 | 61 | 15 | 0 | 0.2 |
Early 2012 elevated seismicity. AVO reported that during December 2011-February 2012, earthquake activity steadily increased. During the first week of March 2012, numerous earthquakes occurred that varied in number and magnitude. According to a press account (Alaskan Dispatch), on 8 March, a moderate M 4.1 earthquake struck the region. On 9 March, AVO increased the Alert Level to Advisory and the Aviation Color Code to Yellow. AVO reported that the increased activity was a significant change, but also noted that a similarly energetic episode of seismic unrest from September 1996 to February 1997 did not lead to an eruption.
Between 9 March through at least 3 April 2012, seismicity remained above background levels. Satellite images acquired during 9-16 March showed a plume drifting 56 km downwind that was likely water vapor. An AVO report noted that long-lived fumaroles at the summit of Iliamna frequently produced visible plumes, but the current plume appeared to be more robust than usual. Scientists aboard an overflight on 17 March observed vigorous and plentiful fumaroles at the summit, consistent with elevated gas emissions. Gas measurements indicated that the volcano was emitting elevated levels of SO2 and CO2, consistent with a magmatic source. During the overflight, scientists did not observe obvious signs of recent rockfalls, such as large areas of newly exposed bedrock or unusual disturbance of the glacial ice. Some deformation of the ice at the headwall of the Red Glacier on the E side of the summit was observed, but it is not clear that this was related to the current volcanic unrest; glacier avalanching is common on this very steep area and was last seen in 2008. During 25-27 March, activity declined somewhat to just above background levels. When not obscured by clouds, satellite and web camera views showed nothing unusual.
References. Caplan-Auerbach, J., Prejean, S.G., and Power, J.A., 2004, Seismic recordings of ice and debris avalanches of Iliamna Volcano (Alaska): Acta Vulcanologica, v. 16, n. 1-2, p. 9-20.
Caplan-Auerbach, J., and Huggel, C., 2007, Precursory seismicity associated with frequent, large ice avalanches on Iliamna volcano, Alaska, USA: Journal of Glaciology, v. 53, n. 180, p. 128-140.
Detterman, R.L., and Hartsock, J.K., 1966, Geology of the Iniskin-Tuxedni region, Alaska: U.S. Geological Survey Professional Paper 512, 78 p.
Dixon, J.P., and Stihler, S.D., 2009, Catalog of earthquake hypocenters at Alaskan volcanoes: January 1 through December 31, 2008: U.S. Geological Survey Data Series 467, 88 p. Available at http://pubs.usgs.gov/ds/467/
Dixon, J.P., Stihler, S.D., Power, J.A., and Searcy, C.K., 2010, Catalog of earthquake hypocenters at Alaskan volcanoes: January 1 through December 31, 2009: U.S. Geological Survey Data Series 531, 84 p. Available online at http://pubs.usgs.gov/ds/531/
McGimsey, R.G., and Wallace, K.L., 1999, 1997 volcanic activity in Alaska and Kamchatka: Summary of events and response of the Alaska Volcano Observatory: U.S. Geological Survey Open-File Report OF 99-0448, 42 p.
McGimsey, R.G., Neal, C.A., and Girina, O., 2004, 1999 Volcanic activity in Alaska and Kamchatka: Summary of events and response of the Alaska Volcano Observatory: U.S. Geological Survey Open-File Report OF 2004-1033, 49 p.
McGimsey, R.G., Neal, C.A., Dixon, J.P., and Ushakov, S., 2008, 2005 Volcanic activity in Alaska, Kamchatka, and the Kurile Islands: Summary of events and response of the Alaska Volcano Observatory: U.S. Geological Survey Scientific Investigations Report 2007-5269, 94 p.
Neal, C.A., Doukas, M.P., and McGimsey, R.G., 1995, 1994 volcanic activity in Alaska-Summary of events and response of Alaska Volcano Observatory: U.S. Geological Survey Open-File Report OF 95-271, 18 p. [Iliamna, p. 4-5].
Waythomas, C.F. and Miller, T.P., 1999, Preliminary Volcano-Hazard Assessment for Iliamna Volcano, U.S. Geological Survey Open-File Report OF 99-373.
Information Contacts: Alaska Volcano Observatory (AVO), a cooperative program of a) U.S. Geological Survey, 4200 University Drive, Anchorage, AK 99508-4667 USA (URL: http://www.avo.alaska.edu/), b) Geophysical Institute, University of Alaska, PO Box 757320, Fairbanks, AK 99775-7320, USA, and c) Alaska Division of Geological & Geophysical Surveys, 794 University Ave., Suite 200, Fairbanks, AK 99709, USA (URL: http://www.dggs.alaska.gov/); Alaskan Dispatch (URL: http://www.alaskadispatch.com/).
This compilation of synonyms and subsidiary features may not be comprehensive. Features are organized into four major categories: Cones, Craters, Domes, and Thermal Features. Synonyms of features appear indented below the primary name. In some cases additional feature type, elevation, or location details are provided.
Synonyms |
||||
| Ilyaminskaya | Miranda | Jliamna | Ilaemaen | Burning Mountain | Brillantes, Montagnas | Ilaemanschen | ||||
Domes |
||||
| Feature Name | Feature Type | Elevation | Latitude | Longitude |
| Johnson Glacier | Dome | |||
| South Twin | Dome | |||
|
|
||||||||||||||||||||||||||
There is data available for 7 confirmed Holocene eruptive periods.
[ 1987 Mar 19 - 1987 May 2 ] Discredited Eruption
[ 1978 Nov 7 - 1978 Nov 7 ] Discredited Eruption
[ 1953 Mar 1 ] Uncertain Eruption
| Episode 1 | Eruption Episode | ||||||||||||||||||||
|---|---|---|---|---|---|---|---|---|---|---|---|---|---|---|---|---|---|---|---|---|
| 1953 Mar 1 - Unknown | Evidence from Unknown | |||||||||||||||||||
|
List of 2 Events for Episode 1
| ||||||||||||||||||||
[ 1952 Jul 2 ± 182 days ] Uncertain Eruption
| Episode 1 | Eruption Episode | |||||||||||||||
|---|---|---|---|---|---|---|---|---|---|---|---|---|---|---|---|
| 1952 Jul 2 ± 182 days - Unknown | Evidence from Unknown | ||||||||||||||
|
List of 1 Events for Episode 1
| |||||||||||||||
[ 1947 Jun ] Uncertain Eruption
| Episode 1 | Eruption Episode | |||||||||||||||
|---|---|---|---|---|---|---|---|---|---|---|---|---|---|---|---|
| 1947 Jun - Unknown | Evidence from Unknown | ||||||||||||||
|
List of 1 Events for Episode 1
| |||||||||||||||
[ 1933 May 5 ] Uncertain Eruption
| Episode 1 | Eruption Episode | |||||||||||||||
|---|---|---|---|---|---|---|---|---|---|---|---|---|---|---|---|
| 1933 May 5 - Unknown | Evidence from Unknown | ||||||||||||||
|
List of 1 Events for Episode 1
| |||||||||||||||
1876 Confirmed Eruption Max VEI: 3
| Episode 1 | Eruption Episode | |||||||||||||||||||||||||
|---|---|---|---|---|---|---|---|---|---|---|---|---|---|---|---|---|---|---|---|---|---|---|---|---|---|
| 1876 - Unknown | Evidence from Observations: Reported | ||||||||||||||||||||||||
|
List of 3 Events for Episode 1
| |||||||||||||||||||||||||
1867 Confirmed Eruption Max VEI: 2
| Episode 1 | Eruption Episode | ||||||||||||||||||||
|---|---|---|---|---|---|---|---|---|---|---|---|---|---|---|---|---|---|---|---|---|
| 1867 - Unknown | Evidence from Observations: Reported | |||||||||||||||||||
|
List of 2 Events for Episode 1
| ||||||||||||||||||||
[ 1843 ] Uncertain Eruption
| Episode 1 | Eruption Episode | ||||||||||||||||||||
|---|---|---|---|---|---|---|---|---|---|---|---|---|---|---|---|---|---|---|---|---|
| 1843 - Unknown | Evidence from Unknown | |||||||||||||||||||
|
List of 2 Events for Episode 1
| ||||||||||||||||||||
[ 1793 ] Uncertain Eruption
| Episode 1 | Eruption Episode | |||||||||||||||
|---|---|---|---|---|---|---|---|---|---|---|---|---|---|---|---|
| 1793 - Unknown | Evidence from Unknown | ||||||||||||||
|
List of 1 Events for Episode 1
| |||||||||||||||
[ 1786 ] Uncertain Eruption
| Episode 1 | Eruption Episode | |||||||||||||||
|---|---|---|---|---|---|---|---|---|---|---|---|---|---|---|---|
| 1786 - Unknown | Evidence from Unknown | ||||||||||||||
|
List of 1 Events for Episode 1
| |||||||||||||||
1778 - 1779 Confirmed Eruption
| Episode 1 | Eruption Episode | ||||||||||||||||||||
|---|---|---|---|---|---|---|---|---|---|---|---|---|---|---|---|---|---|---|---|---|
| 1778 - 1779 | Evidence from Observations: Reported | |||||||||||||||||||
|
List of 2 Events for Episode 1
| ||||||||||||||||||||
[ 1768 ] Uncertain Eruption
| Episode 1 | Eruption Episode | |||||||||||||||
|---|---|---|---|---|---|---|---|---|---|---|---|---|---|---|---|
| 1768 - Unknown | Evidence from Unknown | ||||||||||||||
|
List of 1 Events for Episode 1
| |||||||||||||||
1650 (?) Confirmed Eruption
| Episode 1 | Eruption Episode | |||||||||||||||||||||||||
|---|---|---|---|---|---|---|---|---|---|---|---|---|---|---|---|---|---|---|---|---|---|---|---|---|---|
| 1650 (?) - Unknown | Evidence from Isotopic: 14C (uncalibrated) | ||||||||||||||||||||||||
|
List of 3 Events for Episode 1
| |||||||||||||||||||||||||
0450 BCE (?) Confirmed Eruption
| Episode 1 | Eruption Episode | ||||||||||||||||||||
|---|---|---|---|---|---|---|---|---|---|---|---|---|---|---|---|---|---|---|---|---|
| 0450 BCE (?) - Unknown | Evidence from Isotopic: 14C (uncalibrated) | |||||||||||||||||||
|
List of 2 Events for Episode 1
| ||||||||||||||||||||
2050 BCE (?) Confirmed Eruption Max VEI: 4
| Episode 1 | Eruption Episode | Upper NE flank | ||||||||||||||||||||||||||||||||||
|---|---|---|---|---|---|---|---|---|---|---|---|---|---|---|---|---|---|---|---|---|---|---|---|---|---|---|---|---|---|---|---|---|---|---|---|
| 2050 BCE (?) - Unknown | Evidence from Isotopic: 14C (uncalibrated) | ||||||||||||||||||||||||||||||||||
|
List of 5 Events for Episode 1 at Upper NE flank
| |||||||||||||||||||||||||||||||||||
5050 BCE (?) Confirmed Eruption Max VEI: 4
| Episode 1 | Eruption Episode | ||||||||||||||||||||
|---|---|---|---|---|---|---|---|---|---|---|---|---|---|---|---|---|---|---|---|---|
| 5050 BCE (?) - Unknown | Evidence from Isotopic: 14C (uncalibrated) | |||||||||||||||||||
|
List of 2 Events for Episode 1
| ||||||||||||||||||||
There is data available for 1 deformation periods. Expand each entry for additional details.
| Start Date: 1996 | Stop Date: 1997 | Direction: Unknown | Method: InSAR |
| Magnitude: Unknown | Spatial Extent: Unknown | Latitude: Unknown | Longitude: Unknown |
Remarks: Deformation near Iliamna can be seen in averaged interferograms that span 1995 to 2000, though most of the deformation occurred during 1996-1997, coincident with a seismic swarm. | |||
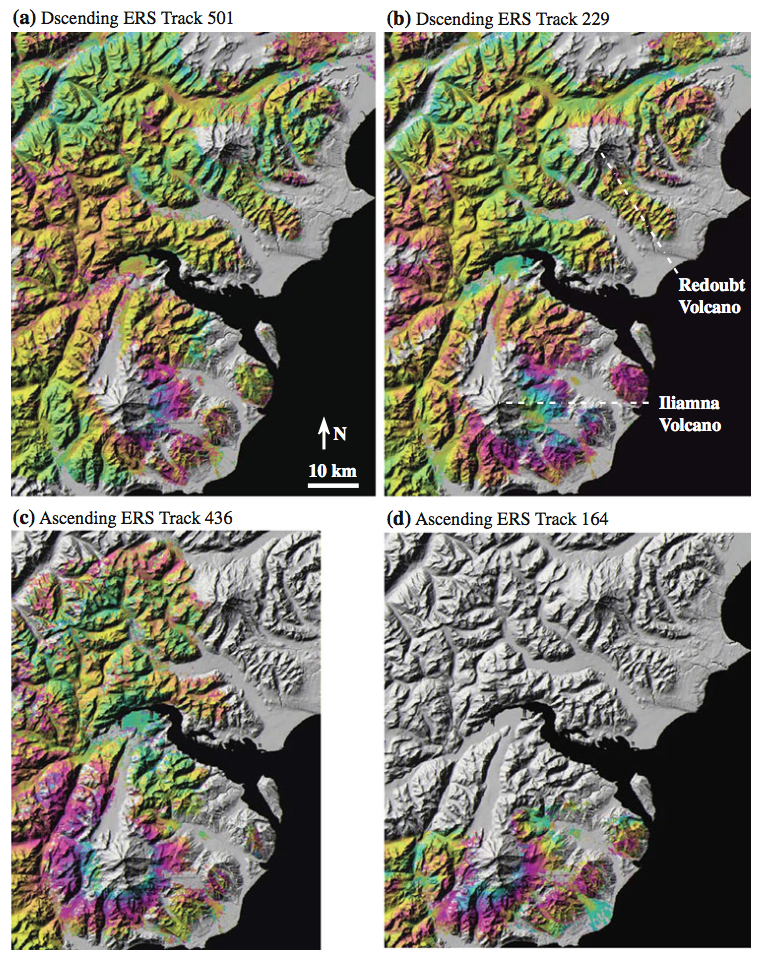 |
Averaged deformation images of Iliamna and Redoubt volcanoes produced by stacking high-quality ERS-1 and ERS-2 interferograms for the period 1996?1997 from four tracks: a descending track 501 b descending track 229 c ascending track 436, and d ascending track 164. A full cycle of colors (i.e., one interferometric fringe) represents 28 mm of LOS surface displacement. Areas of loss of InSAR coherence are not colored From: Lu and Dzurisin 2014. |
||
Reference List: Lu and Dzurisin 2014.
Full References:
Lu Z, Dzurisin D, 2014. InSAR imaging of Aleutian volcanoes: monitoring a volcanic arc from space. Springer-Verlag Berlin Heidelberg. https://doi.org/10.1007/978-3-642-00348-6
There is no Emissions History data available for Iliamna.
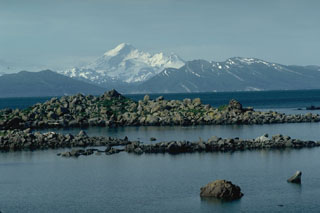 Iliamna rises across Kamishak Bay, 75 km N of Augustine Island. The features in the foreground are hummocks of a debris avalanche from the summit of Augustine in 1883 that reached the sea and extended the shoreline of the island by up to 2 km.
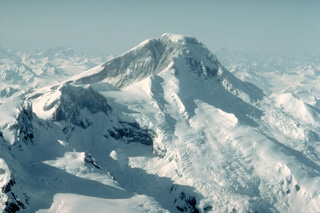 Iliamna volcano, seen here from the SE, is an ice-clad stratovolcano that has been extensively eroded by glaciers. Four peaks occur along a 5-km-long, N-S-trending summit ridge, ending with North Twin and South Twin peaks at the left center. No major Holocene tephras have been identified from Iliamna. Many reports of historical eruptions have mistaken powerful episodes of steam emission from fumaroles high on the south and east flanks.
 The north face of Iliamna, one of the Cook Inlet volcanoes monitored by the Alaska Volcano Observatory, is seen in this 6 May 1986 aerial view. Steam and volcanic gases rise from the near-continuously active fumaroles high on the eastern and southern flanks.
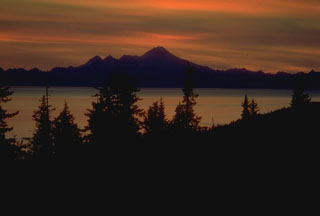 Iliamna rises across Cook Inlet, seen here at sunset from the Kenai Peninsula. It is the southernmost of three large volcanoes west of the inlet. The eroded summit ridge consists of four peaks along a 5-km-long ridge extending south (left) of the highest point.
The maps shown below have been scanned from the GVP map archives and include the volcano on this page. Clicking on the small images will load the full 300 dpi map. Very small-scale maps (such as world maps) are not included. The maps database originated over 30 years ago, but was only recently updated and connected to our main database. We welcome users to tell us if they see incorrect information or other problems with the maps; please use the Contact GVP link at the bottom of the page to send us email.
There are no samples for Iliamna in the Smithsonian's NMNH Department of Mineral Sciences Rock and Ore collection.
| Alaska Volcano Observatory (Link to Iliamna) | The Alaska Volcano Observatory (AVO) is a joint program of the U.S. Geological Survey (USGS), the Geophysical Institute of the University of Alaska Fairbanks (UAFGI), and the State of Alaska Division of Geological and Geophysical Surveys (ADGGS). AVO was formed in 1988, and uses federal, state, and university resources to monitor and study Alaska's hazardous volcanoes, to predict and record eruptive activity, and to mitigate volcanic hazards to life and property. |
| Copernicus Browser | The Copernicus Browser replaced the Sentinel Hub Playground browser in 2023, to provide access to Earth observation archives from the Copernicus Data Space Ecosystem, the main distribution platform for data from the EU Copernicus missions. |
| MIROVA | Middle InfraRed Observation of Volcanic Activity (MIROVA) is a near real time volcanic hot-spot detection system based on the analysis of MODIS (Moderate Resolution Imaging Spectroradiometer) data. In particular, MIROVA uses the Middle InfraRed Radiation (MIR), measured over target volcanoes, in order to detect, locate and measure the heat radiation sourced from volcanic activity. |
| MODVOLC Thermal Alerts | Using infrared satellite Moderate Resolution Imaging Spectroradiometer (MODIS) data, scientists at the Hawai'i Institute of Geophysics and Planetology, University of Hawai'i, developed an automated system called MODVOLC to map thermal hot-spots in near real time. For each MODIS image, the algorithm automatically scans each 1 km pixel within it to check for high-temperature hot-spots. When one is found the date, time, location, and intensity are recorded. MODIS looks at every square km of the Earth every 48 hours, once during the day and once during the night, and the presence of two MODIS sensors in space allows at least four hot-spot observations every two days. Each day updated global maps are compiled to display the locations of all hot spots detected in the previous 24 hours. There is a drop-down list with volcano names which allow users to 'zoom-in' and examine the distribution of hot-spots at a variety of spatial scales. |
|
WOVOdat
Single Volcano View Temporal Evolution of Unrest Side by Side Volcanoes |
WOVOdat is a database of volcanic unrest; instrumentally and visually recorded changes in seismicity, ground deformation, gas emission, and other parameters from their normal baselines. It is sponsored by the World Organization of Volcano Observatories (WOVO) and presently hosted at the Earth Observatory of Singapore.
GVMID Data on Volcano Monitoring Infrastructure The Global Volcano Monitoring Infrastructure Database GVMID, is aimed at documenting and improving capabilities of volcano monitoring from the ground and space. GVMID should provide a snapshot and baseline view of the techniques and instrumentation that are in place at various volcanoes, which can be use by volcano observatories as reference to setup new monitoring system or improving networks at a specific volcano. These data will allow identification of what monitoring gaps exist, which can be then targeted by remote sensing infrastructure and future instrument deployments. |
| Volcanic Hazard Maps | The IAVCEI Commission on Volcanic Hazards and Risk has a Volcanic Hazard Maps database designed to serve as a resource for hazard mappers (or other interested parties) to explore how common issues in hazard map development have been addressed at different volcanoes, in different countries, for different hazards, and for different intended audiences. In addition to the comprehensive, searchable Volcanic Hazard Maps Database, this website contains information about diversity of volcanic hazard maps, illustrated using examples from the database. This site is for educational purposes related to volcanic hazard maps. Hazard maps found on this website should not be used for emergency purposes. For the most recent, official hazard map for a particular volcano, please seek out the proper institutional authorities on the matter. |
| IRIS seismic stations/networks | Incorporated Research Institutions for Seismology (IRIS) Data Services map showing the location of seismic stations from all available networks (permanent or temporary) within a radius of 0.18° (about 20 km at mid-latitudes) from the given location of Iliamna. Users can customize a variety of filters and options in the left panel. Note that if there are no stations are known the map will default to show the entire world with a "No data matched request" error notice. |
| UNAVCO GPS/GNSS stations | Geodetic Data Services map from UNAVCO showing the location of GPS/GNSS stations from all available networks (permanent or temporary) within a radius of 20 km from the given location of Iliamna. Users can customize the data search based on station or network names, location, and time window. Requires Adobe Flash Player. |
| DECADE Data | The DECADE portal, still in the developmental stage, serves as an example of the proposed interoperability between The Smithsonian Institution's Global Volcanism Program, the Mapping Gas Emissions (MaGa) Database, and the EarthChem Geochemical Portal. The Deep Earth Carbon Degassing (DECADE) initiative seeks to use new and established technologies to determine accurate global fluxes of volcanic CO2 to the atmosphere, but installing CO2 monitoring networks on 20 of the world's 150 most actively degassing volcanoes. The group uses related laboratory-based studies (direct gas sampling and analysis, melt inclusions) to provide new data for direct degassing of deep earth carbon to the atmosphere. |
| Large Eruptions of Iliamna | Information about large Quaternary eruptions (VEI >= 4) is cataloged in the Large Magnitude Explosive Volcanic Eruptions (LaMEVE) database of the Volcano Global Risk Identification and Analysis Project (VOGRIPA). |
| EarthChem | EarthChem develops and maintains databases, software, and services that support the preservation, discovery, access and analysis of geochemical data, and facilitate their integration with the broad array of other available earth science parameters. EarthChem is operated by a joint team of disciplinary scientists, data scientists, data managers and information technology developers who are part of the NSF-funded data facility Integrated Earth Data Applications (IEDA). IEDA is a collaborative effort of EarthChem and the Marine Geoscience Data System (MGDS). |