Instrument-aided IR detection of 5 steaming vents at Red Island in 2013
A recent partial survey conducted by David K. Lynch and Paul M. Adams of Red Island, previously known as Red Hill, in Southern California, USA, has resulted in the discovery of five steaming hot vents on the SW flank of the northern Salton Buttes volcanic field. Lynch and Adams sent us a report, which follows. We also include some remarks from related literature and note geothermal power plants in the region.
Background. Red Island is part of the Salton Buttes, a collection of five late Quaternary rhyolitic volcanic necks in the Salton Sea Geothermal Field (SSGF) (figure 1). The SSGF rests within a topographic low, and has a geothermal gradient that averages ~0.3°C/m, reaching a maximum of 4.3°C/m (Lynch and others, 2013). This high geothermal gradient results from the shallow magma body of the spreading center between the San Andreas and Imperial faults. As shown in figure 2, the SSGF lies at the head of the Gulf of California, on the boundary of the Pacific and North American plates (Elders and Sass, 1988). Consequently, the SSGF's unique geology creates the perfect setting for hot geothermal fluids to seep to the surface, and has been slated as a site for geothermal electricity-generating plants. There are no previous Bulletin reports on the Salton Buttes.
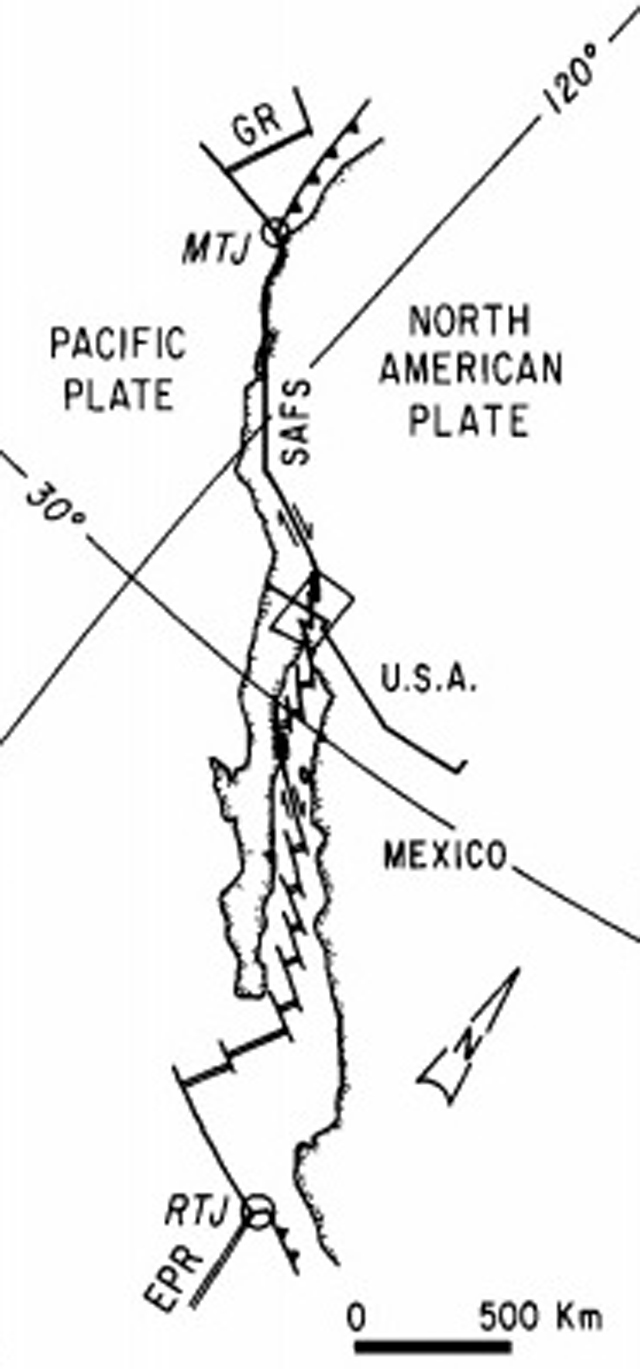 |
Figure 1. The Salton Trough is a result of crustal stretching and sinking associated with regional extensional tectonics including the San Andreas Fault (SAF) and the East Pacific Rise (EPR, the spreading center shown at the bottom of the map).This sketch shows the boundary between the Pacific and North American plates, with the rectangle indicating the Salton Trough. The S end of the Salton Trough (as defined by the box) begins adjacent to the Sea of Cortez, the body of water separating the Baja California peninsula from mainland Mexico. The SSGF is within the Salton Trough. Other abbreviations include Gorda Rise, GR; Mendocino Triple Junction, MTJ; and Rivera Triple Junction, RTJ. Taken from Elders and Sass (1988). |
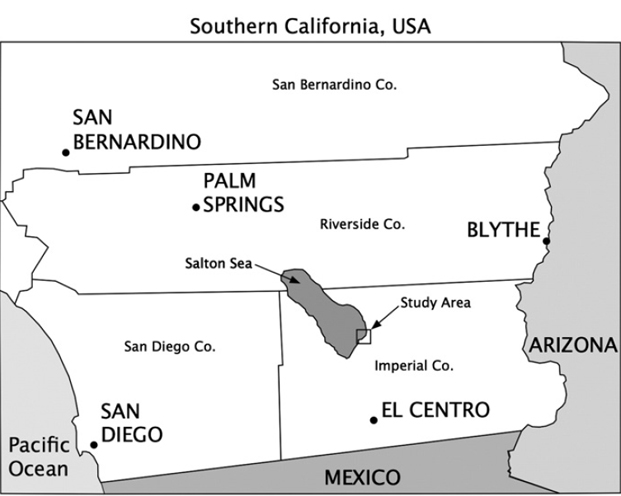 |
Figure 2. Sketch map showing location of Salton Sea and the Salton Buttes volcanic area study area. For scale, the N-S distance from the S end of the Salton Sea to the USA-Mexico border is ~100 km. The lake is receding but its 2014 surface elevation is close to -69 m. Courtesy of Lynch and others (2013). |
The Salton Buttes reside near the SE end of the Salton Sea. The Sea resides on the floor of the Salton Trough, chiefly in Imperial County, California. This briny water body is about 56 x 10 km. The Buttes lie along a NNE trending line spanning a distance of 7 km. The Salton Trough was filled, in part, by sediments carried by the Colorado River, which eventually built up and blocked the river's flow. The river was diverted away from the Salton Trough, yet, in 1905, heavy rainfall caused nearby levees to collapse, creating the Salton Sea (Morris, 2008).
Until recent work by Lynch and others (2011) and Schmidt and others (2013), the Salton Buttes were thought to have been formed by extruded magma during the late Pleistocene, ~16,000 BP. Age dates for some lavas are now dated to closer to 2,000 BP, much younger than originally understood, bringing closer scrutiny of the Buttes by the U.S. Geological Survey (USGS) California Volcano Observatory and other agencies concerned with geological threats in California (Lynch and Adams, unpublished draft).
Red Island consists of two conjoined volcanoes of related, yet distinctly different, geology. They are 2.5 km SSW of the Mullet Island fumaroles, an area discussed further by Lynch and others (2013).
Mullet Island fumaroles: As the briny water level of the Salton Sea began dropping in 1983, a number of fumarole fields were exposed subaerially for the first time since 1945. The Salton Sea overlaps the SSGF and, as a result, an interaction of rising gas and hot water with sediments has produced a number of hot, fumarolic gryphons (mud volcanoes) and salses (bubbling water in calderas of gryphons) (Lynch and others, 2013). Over-pressured subsurface gas cause the upward migration of fluidized sediment, creating these gryphons, as seen in figure 3.
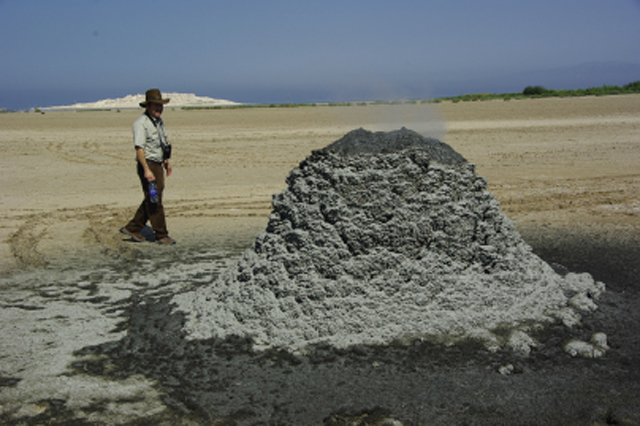 |
Figure 3. View of a steaming spatter cone, one of the first stages of a gryphon's development. Once the rising mud becomes more viscous and covers the spatter cone completely, a composite gryphon is formed. The height of these gryphons can range from a few centimeters to ~2 m. Mullet Island can be seen at the top left of the image. Taken from Lynch and others (2013). |
The NW trending alingment of these geothermal features is suggestive of a fault, most likely the Calipatria fault. Other fumarole fields are still below water level or are being exposed as the lake recedes.
Red Island vents. Before the work on Mullet Island fumaroles was published, Michael McKibben, while on a 2008 Desert Symposium field trip (Reynolds and others, 2008), mentioned a 'volcanic hotspot' on the SW flank of the N volcano at Red Island in a private communication to Lynch and Adams. However, a swift search of the area during the field trip did not reveal its location. As a result of this observation, Lynch and Adams performed a partial survey of the SW flank of the N volcano on 6, 7, and 29 November 2013, which resulted in the discovery of the five hot steaming vents on the summit of the south-facing slope. Lynch and Adams found that the vents were distributed along an ~80 m long line trending N65E, which they recognized as a possible fault.
All attempts at identifying vents were made before sunrise, when the air temperature was at its lowest diurnal value (~8°C). This provided a recognizable thermal contrast between cold and hot rocks. Lynch and Adams noted that it was unlikely that warm air coming from the vents could have been felt on a hot or windy day, as the vents appeared unremarkable from a relatively close distance (a few meters), "among the uneven field of loose, jutting volcanic rocks." To locate the vents, Lynch and Adams employed the following three tactics:
1. An Agena ThermoVision 470 infrared camera was used to look for areas that were warmer than the background (e.g., figure 4, lower). Absolute temperatures from the camera may have been off by 3-4°C due to systematic errors, but the image records relative temperatures between different parts of scene. were preserved. The vent seen in figure 4 may have been deliberately covered with a pile of rocks.
2. They reached into holes and crevasses to check for heat.
3. They measured rock temperatures using a Martin P. Jones & Associates, Inc., Model 9910 TE Infrared Thermometer. Because it was small enough to be placed deeper in the vents, the temperatures from this thermometer were higher than the IR camera temperatures.
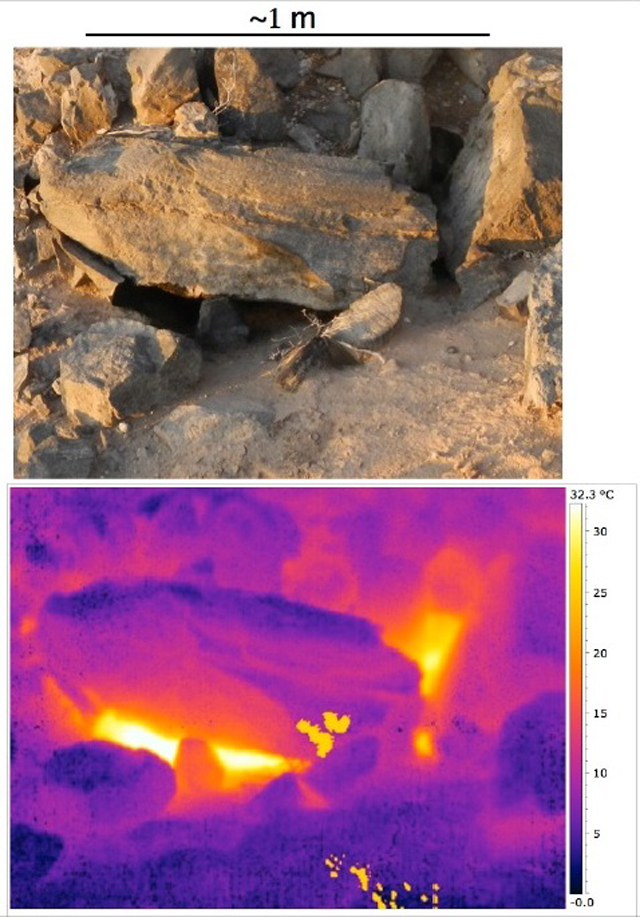 |
Figure 4. (Top) Image of a hotspot (designated H3) seen in visible wavelength light. (Bottom) Image of the same spot taken with an Agena ThermoVision 470 IR camera. Yellow patches in the center and lower right of the image indicate bad pixels in the IR camera. Taken from Lynch and Adams (2013). |
Lynch and Adams found one vent "by feeling hot air coming from it," one "by noticing wet rock," one "by seeing its steam cloud," and two by locating them with the IR camera. Once located, all vents were found to be steaming (figure 5) and surrounded by rocks wet from condensation.
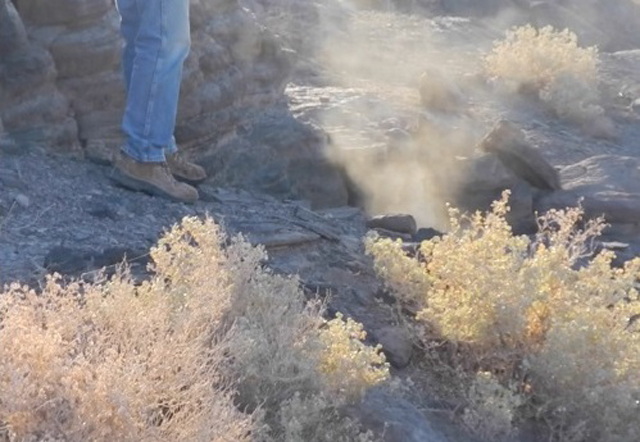 |
Figure 5. Steam cloud from H1; still taken from a video of the hotspot at Red Island, Salton Buttes. Taken from Lynch and Adams (2013). |
No surface deposits (e.g., sulfur) were seen, aside from water and greenish algae. The temperatures 1-2 m within the vents were 35-38°C. According to Lynch and Adams, these hotspots may "represent heat from original volcanism, or recent magma intrusions that have not reached the surface." The distribution of these vents, distinguished as H1, H2, H3, H4, H5, is shown in figure 6.
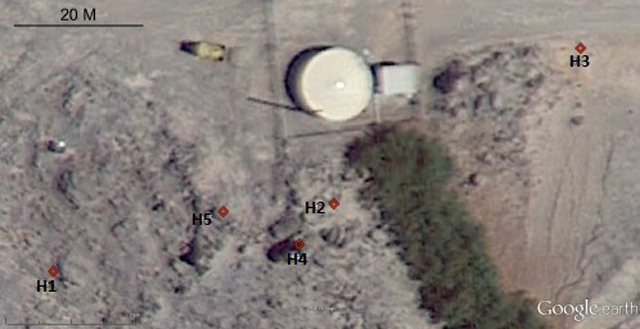 |
Figure 6. Vent locations marked on an image of Red Island, Salton Buttes, from Google Earth. Taken from Lynch and Adams (2013). |
The team was relatively confident that no additional vents were located within the area extending 225 m to the S and W, although a more complete survey must be undertaken to investigate seismicity and movement/deformation of the area from GPS networks. However, other "warm spots" not associated with venting or outgassing were found on the SW flank of the N volcano. They were ~5-10°C warmer than ambient temperatures and may represent weak signals from the warm interior of the volcano. More likely, however, the warmer temperatures are due to emissivity variations in rock layers, or normal temperature distributions that occur in crevasses where rocks are not able to radiate heat into the cold night sky.
Geothermal electricity-generating plants. According to the Geothermal Energy Association, currently there are three major geothermal production sites in the Imperial Valley, totaling in 16 plants. Figure 7 shows one of these sites, which hosts seven geothermal plants with running capacities ranging from 5-45 MW (Geothermal Energy Association). Despite the fact that this site alone has contributed enough electricity to power ~100,000 homes, geothermal energy only accounts for 4.4% of all system power in California (Matek and Gawell, 2014). The SSGF is considered the best opportunity for increasing the production of geothermal energy in California. The unique geology of the Salton Sea area allows geothermal fluids to seep to the surface, allowing a range of capacity from 1,700 to 2,900 MW.
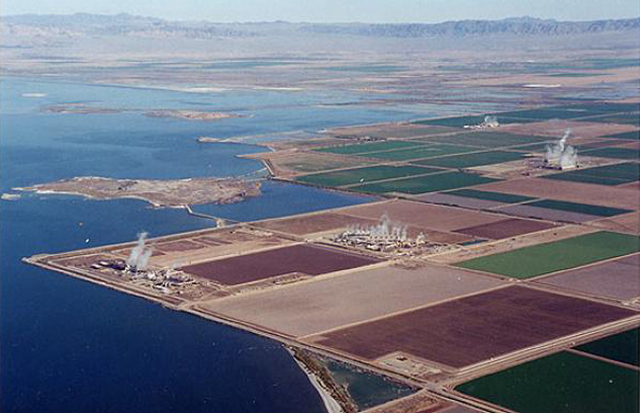 |
Figure 7. This CalEnergy geothermal site is located on the edge of the Salton Sea, and currently has seven running geothermal power plants. Taken from The Center for Land Use Interpretation. |
References. Elders, W and Sass, J, 10 November 1988, The Salton Sea Scientific Drilling Project; Journal of Geophysical Research, v. 03, no. B11, pp. 12,953-12,968.
Lynch, D., Hudnut, K., and Adams, P., 2013, Development and growth of recently-exposed fumarole fields near Mullet Island, Imperial County, California; Geomorphology, v. 195, pp. 27-44.
Lynch, D.K., Schmitt, A.K.., Rood, D., and Akciz, S, 2011, Radiometric Dating of the Salton Buttes, Proposal to the Southern California Earthquake Center.
Matek, B., and Gawell, K., February 2014, Report on the State of Geothermal Energy in California; Geothermal Energy Association, 2014.
Morris, R., 2008, Welcome to the Salton Trough, California State University Long Beach Geology.
Reynolds, R., Jefferson, G., Lynch, D., 2008, Trough to Trough: The Colorado River and the Salton Sea, Proceedings of the 2008 Desert Symposium, Robert E. Reynolds (ed.), California State University, Desert Studies Consortium and LSA Associates, Inc.
Schmitt, A, Martin, A, Stockli, D, Farley, K, Lovera, O, 2013, (U--Th)/He zircon and archaeological ages for a late prehistoric eruption in the Salton Trough (California, USA), Geology, January 2013, v. 41, pp. 7-10.
Information Contacts: David Lynch, Earthquake Science Center, USGS- Pasadena; Paul Adams, Thule Scientific, Topanga, CA (URL: http://thulescientific.com/Research.html); The Center for Land Use Interpretation, Culver City, CA (URL: http://clui.org/); and Geothermal Energy Association, Washington, D.C. (URL: http://geo-energy.org/).
The Global Volcanism Program has no Weekly Reports available for Salton Buttes.
Reports are organized chronologically and indexed below by Month/Year (Publication Volume:Number), and include a one-line summary. Click on the index link or scroll down to read the reports.
Instrument-aided IR detection of 5 steaming vents at Red Island in 2013
A recent partial survey conducted by David K. Lynch and Paul M. Adams of Red Island, previously known as Red Hill, in Southern California, USA, has resulted in the discovery of five steaming hot vents on the SW flank of the northern Salton Buttes volcanic field. Lynch and Adams sent us a report, which follows. We also include some remarks from related literature and note geothermal power plants in the region.
Background. Red Island is part of the Salton Buttes, a collection of five late Quaternary rhyolitic volcanic necks in the Salton Sea Geothermal Field (SSGF) (figure 1). The SSGF rests within a topographic low, and has a geothermal gradient that averages ~0.3°C/m, reaching a maximum of 4.3°C/m (Lynch and others, 2013). This high geothermal gradient results from the shallow magma body of the spreading center between the San Andreas and Imperial faults. As shown in figure 2, the SSGF lies at the head of the Gulf of California, on the boundary of the Pacific and North American plates (Elders and Sass, 1988). Consequently, the SSGF's unique geology creates the perfect setting for hot geothermal fluids to seep to the surface, and has been slated as a site for geothermal electricity-generating plants. There are no previous Bulletin reports on the Salton Buttes.
|
Figure 1. The Salton Trough is a result of crustal stretching and sinking associated with regional extensional tectonics including the San Andreas Fault (SAF) and the East Pacific Rise (EPR, the spreading center shown at the bottom of the map).This sketch shows the boundary between the Pacific and North American plates, with the rectangle indicating the Salton Trough. The S end of the Salton Trough (as defined by the box) begins adjacent to the Sea of Cortez, the body of water separating the Baja California peninsula from mainland Mexico. The SSGF is within the Salton Trough. Other abbreviations include Gorda Rise, GR; Mendocino Triple Junction, MTJ; and Rivera Triple Junction, RTJ. Taken from Elders and Sass (1988). |
|
Figure 2. Sketch map showing location of Salton Sea and the Salton Buttes volcanic area study area. For scale, the N-S distance from the S end of the Salton Sea to the USA-Mexico border is ~100 km. The lake is receding but its 2014 surface elevation is close to -69 m. Courtesy of Lynch and others (2013). |
The Salton Buttes reside near the SE end of the Salton Sea. The Sea resides on the floor of the Salton Trough, chiefly in Imperial County, California. This briny water body is about 56 x 10 km. The Buttes lie along a NNE trending line spanning a distance of 7 km. The Salton Trough was filled, in part, by sediments carried by the Colorado River, which eventually built up and blocked the river's flow. The river was diverted away from the Salton Trough, yet, in 1905, heavy rainfall caused nearby levees to collapse, creating the Salton Sea (Morris, 2008).
Until recent work by Lynch and others (2011) and Schmidt and others (2013), the Salton Buttes were thought to have been formed by extruded magma during the late Pleistocene, ~16,000 BP. Age dates for some lavas are now dated to closer to 2,000 BP, much younger than originally understood, bringing closer scrutiny of the Buttes by the U.S. Geological Survey (USGS) California Volcano Observatory and other agencies concerned with geological threats in California (Lynch and Adams, unpublished draft).
Red Island consists of two conjoined volcanoes of related, yet distinctly different, geology. They are 2.5 km SSW of the Mullet Island fumaroles, an area discussed further by Lynch and others (2013).
Mullet Island fumaroles: As the briny water level of the Salton Sea began dropping in 1983, a number of fumarole fields were exposed subaerially for the first time since 1945. The Salton Sea overlaps the SSGF and, as a result, an interaction of rising gas and hot water with sediments has produced a number of hot, fumarolic gryphons (mud volcanoes) and salses (bubbling water in calderas of gryphons) (Lynch and others, 2013). Over-pressured subsurface gas cause the upward migration of fluidized sediment, creating these gryphons, as seen in figure 3.
|
Figure 3. View of a steaming spatter cone, one of the first stages of a gryphon's development. Once the rising mud becomes more viscous and covers the spatter cone completely, a composite gryphon is formed. The height of these gryphons can range from a few centimeters to ~2 m. Mullet Island can be seen at the top left of the image. Taken from Lynch and others (2013). |
The NW trending alingment of these geothermal features is suggestive of a fault, most likely the Calipatria fault. Other fumarole fields are still below water level or are being exposed as the lake recedes.
Red Island vents. Before the work on Mullet Island fumaroles was published, Michael McKibben, while on a 2008 Desert Symposium field trip (Reynolds and others, 2008), mentioned a 'volcanic hotspot' on the SW flank of the N volcano at Red Island in a private communication to Lynch and Adams. However, a swift search of the area during the field trip did not reveal its location. As a result of this observation, Lynch and Adams performed a partial survey of the SW flank of the N volcano on 6, 7, and 29 November 2013, which resulted in the discovery of the five hot steaming vents on the summit of the south-facing slope. Lynch and Adams found that the vents were distributed along an ~80 m long line trending N65E, which they recognized as a possible fault.
All attempts at identifying vents were made before sunrise, when the air temperature was at its lowest diurnal value (~8°C). This provided a recognizable thermal contrast between cold and hot rocks. Lynch and Adams noted that it was unlikely that warm air coming from the vents could have been felt on a hot or windy day, as the vents appeared unremarkable from a relatively close distance (a few meters), "among the uneven field of loose, jutting volcanic rocks." To locate the vents, Lynch and Adams employed the following three tactics:
1. An Agena ThermoVision 470 infrared camera was used to look for areas that were warmer than the background (e.g., figure 4, lower). Absolute temperatures from the camera may have been off by 3-4°C due to systematic errors, but the image records relative temperatures between different parts of scene. were preserved. The vent seen in figure 4 may have been deliberately covered with a pile of rocks.
2. They reached into holes and crevasses to check for heat.
3. They measured rock temperatures using a Martin P. Jones & Associates, Inc., Model 9910 TE Infrared Thermometer. Because it was small enough to be placed deeper in the vents, the temperatures from this thermometer were higher than the IR camera temperatures.
|
Figure 4. (Top) Image of a hotspot (designated H3) seen in visible wavelength light. (Bottom) Image of the same spot taken with an Agena ThermoVision 470 IR camera. Yellow patches in the center and lower right of the image indicate bad pixels in the IR camera. Taken from Lynch and Adams (2013). |
Lynch and Adams found one vent "by feeling hot air coming from it," one "by noticing wet rock," one "by seeing its steam cloud," and two by locating them with the IR camera. Once located, all vents were found to be steaming (figure 5) and surrounded by rocks wet from condensation.
|
Figure 5. Steam cloud from H1; still taken from a video of the hotspot at Red Island, Salton Buttes. Taken from Lynch and Adams (2013). |
No surface deposits (e.g., sulfur) were seen, aside from water and greenish algae. The temperatures 1-2 m within the vents were 35-38°C. According to Lynch and Adams, these hotspots may "represent heat from original volcanism, or recent magma intrusions that have not reached the surface." The distribution of these vents, distinguished as H1, H2, H3, H4, H5, is shown in figure 6.
|
Figure 6. Vent locations marked on an image of Red Island, Salton Buttes, from Google Earth. Taken from Lynch and Adams (2013). |
The team was relatively confident that no additional vents were located within the area extending 225 m to the S and W, although a more complete survey must be undertaken to investigate seismicity and movement/deformation of the area from GPS networks. However, other "warm spots" not associated with venting or outgassing were found on the SW flank of the N volcano. They were ~5-10°C warmer than ambient temperatures and may represent weak signals from the warm interior of the volcano. More likely, however, the warmer temperatures are due to emissivity variations in rock layers, or normal temperature distributions that occur in crevasses where rocks are not able to radiate heat into the cold night sky.
Geothermal electricity-generating plants. According to the Geothermal Energy Association, currently there are three major geothermal production sites in the Imperial Valley, totaling in 16 plants. Figure 7 shows one of these sites, which hosts seven geothermal plants with running capacities ranging from 5-45 MW (Geothermal Energy Association). Despite the fact that this site alone has contributed enough electricity to power ~100,000 homes, geothermal energy only accounts for 4.4% of all system power in California (Matek and Gawell, 2014). The SSGF is considered the best opportunity for increasing the production of geothermal energy in California. The unique geology of the Salton Sea area allows geothermal fluids to seep to the surface, allowing a range of capacity from 1,700 to 2,900 MW.
|
Figure 7. This CalEnergy geothermal site is located on the edge of the Salton Sea, and currently has seven running geothermal power plants. Taken from The Center for Land Use Interpretation. |
References. Elders, W and Sass, J, 10 November 1988, The Salton Sea Scientific Drilling Project; Journal of Geophysical Research, v. 03, no. B11, pp. 12,953-12,968.
Lynch, D., Hudnut, K., and Adams, P., 2013, Development and growth of recently-exposed fumarole fields near Mullet Island, Imperial County, California; Geomorphology, v. 195, pp. 27-44.
Lynch, D.K., Schmitt, A.K.., Rood, D., and Akciz, S, 2011, Radiometric Dating of the Salton Buttes, Proposal to the Southern California Earthquake Center.
Matek, B., and Gawell, K., February 2014, Report on the State of Geothermal Energy in California; Geothermal Energy Association, 2014.
Morris, R., 2008, Welcome to the Salton Trough, California State University Long Beach Geology.
Reynolds, R., Jefferson, G., Lynch, D., 2008, Trough to Trough: The Colorado River and the Salton Sea, Proceedings of the 2008 Desert Symposium, Robert E. Reynolds (ed.), California State University, Desert Studies Consortium and LSA Associates, Inc.
Schmitt, A, Martin, A, Stockli, D, Farley, K, Lovera, O, 2013, (U--Th)/He zircon and archaeological ages for a late prehistoric eruption in the Salton Trough (California, USA), Geology, January 2013, v. 41, pp. 7-10.
Information Contacts: David Lynch, Earthquake Science Center, USGS- Pasadena; Paul Adams, Thule Scientific, Topanga, CA (URL: http://thulescientific.com/Research.html); The Center for Land Use Interpretation, Culver City, CA (URL: http://clui.org/); and Geothermal Energy Association, Washington, D.C. (URL: http://geo-energy.org/).
|
|
||||||||||||||||||||||||||
There is data available for 3 confirmed eruptive periods.
0210 ± 100 years Confirmed Eruption (Explosive / Effusive)
| Episode 1 | Eruption (Explosive / Effusive) | Rock Hill, N & S Red Hill | |||||||||||||||||||||||
|---|---|---|---|---|---|---|---|---|---|---|---|---|---|---|---|---|---|---|---|---|---|---|---|---|
| 0210 ± 100 years - Unknown | Evidence from Correlation: Magnetism | |||||||||||||||||||||||
|
List of 3 Events for Episode 1 at Rock Hill, N & S Red Hill
|
||||||||||||||||||||||||
0010 ± 100 years Confirmed Eruption (Explosive / Effusive)
| Episode 1 | Eruption (Explosive / Effusive) | Obsidian Butte | |||||||||||||||||||||||||||||||||
|---|---|---|---|---|---|---|---|---|---|---|---|---|---|---|---|---|---|---|---|---|---|---|---|---|---|---|---|---|---|---|---|---|---|---|
| 0010 ± 100 years - Unknown | Evidence from Correlation: Magnetism | |||||||||||||||||||||||||||||||||
|
List of 5 Events for Episode 1 at Obsidian Butte
|
||||||||||||||||||||||||||||||||||
0290 BCE ± 100 years Confirmed Eruption (Explosive / Effusive)
| Episode 1 | Eruption (Explosive / Effusive) | Mullet Island | |||||||||||||||||||||||
|---|---|---|---|---|---|---|---|---|---|---|---|---|---|---|---|---|---|---|---|---|---|---|---|---|
| 0290 BCE ± 100 years - Unknown | Evidence from Correlation: Magnetism | |||||||||||||||||||||||
|
List of 3 Events for Episode 1 at Mullet Island
|
||||||||||||||||||||||||
This compilation of synonyms and subsidiary features may not be comprehensive. Features are organized into four major categories: Cones, Craters, Domes, and Thermal Features. Synonyms of features appear indented below the primary name. In some cases additional feature type, elevation, or location details are provided.
Synonyms |
||||
| Niland Field | ||||
Domes |
||||
| Feature Name | Feature Type | Elevation | Latitude | Longitude |
| Mullet Island | Dome | -59 m | 33° 13' 32.00" N | 115° 36' 30.00" W |
| North Red Hill | Dome | -44 m | 33° 12' 0.00" N | 115° 36' 43.00" W |
| Obsidian Butte | Dome | -45 m | 33° 10' 17.00" N | 115° 38' 16.00" W |
| Rock Hill | Dome | -49 m | 33° 11' 1.00" N | 115° 37' 24.00" W |
| South Red Hill | Dome | -41 m | 33° 11' 46.00" N | 115° 36' 42.00" W |
The following 6 samples associated with this volcano can be found in the Smithsonian's NMNH Department of Mineral Sciences collections, and may be availble for research (contact the Rock and Ore Collections Manager). Catalog number links will open a window with more information.
| Catalog Number | Sample Description | Lava Source | Collection Date |
|---|---|---|---|
| NMNH 117460-118 | Obsidian | Obsidian Butte | -- |
| NMNH 117460-119 | Perlite | Obsidian Butte | -- |
| NMNH 117460-120 | Obsidian | Obsidian Butte | -- |
| NMNH 117460-121 | Obsidian | Obsidian Butte | -- |
| NMNH 117460-122 | Pumice | Obsidian Butte | -- |
| NMNH 117460-123 | Obsidian | Obsidian Butte | -- |
| Copernicus Browser | The Copernicus Browser replaced the Sentinel Hub Playground browser in 2023, to provide access to Earth observation archives from the Copernicus Data Space Ecosystem, the main distribution platform for data from the EU Copernicus missions. |
| MIROVA | Middle InfraRed Observation of Volcanic Activity (MIROVA) is a near real time volcanic hot-spot detection system based on the analysis of MODIS (Moderate Resolution Imaging Spectroradiometer) data. In particular, MIROVA uses the Middle InfraRed Radiation (MIR), measured over target volcanoes, in order to detect, locate and measure the heat radiation sourced from volcanic activity. |
| MODVOLC Thermal Alerts | Using infrared satellite Moderate Resolution Imaging Spectroradiometer (MODIS) data, scientists at the Hawai'i Institute of Geophysics and Planetology, University of Hawai'i, developed an automated system called MODVOLC to map thermal hot-spots in near real time. For each MODIS image, the algorithm automatically scans each 1 km pixel within it to check for high-temperature hot-spots. When one is found the date, time, location, and intensity are recorded. MODIS looks at every square km of the Earth every 48 hours, once during the day and once during the night, and the presence of two MODIS sensors in space allows at least four hot-spot observations every two days. Each day updated global maps are compiled to display the locations of all hot spots detected in the previous 24 hours. There is a drop-down list with volcano names which allow users to 'zoom-in' and examine the distribution of hot-spots at a variety of spatial scales. |
|
WOVOdat
Single Volcano View Temporal Evolution of Unrest Side by Side Volcanoes |
WOVOdat is a database of volcanic unrest; instrumentally and visually recorded changes in seismicity, ground deformation, gas emission, and other parameters from their normal baselines. It is sponsored by the World Organization of Volcano Observatories (WOVO) and presently hosted at the Earth Observatory of Singapore.
GVMID Data on Volcano Monitoring Infrastructure The Global Volcano Monitoring Infrastructure Database GVMID, is aimed at documenting and improving capabilities of volcano monitoring from the ground and space. GVMID should provide a snapshot and baseline view of the techniques and instrumentation that are in place at various volcanoes, which can be use by volcano observatories as reference to setup new monitoring system or improving networks at a specific volcano. These data will allow identification of what monitoring gaps exist, which can be then targeted by remote sensing infrastructure and future instrument deployments. |
| Volcanic Hazard Maps | The IAVCEI Commission on Volcanic Hazards and Risk has a Volcanic Hazard Maps database designed to serve as a resource for hazard mappers (or other interested parties) to explore how common issues in hazard map development have been addressed at different volcanoes, in different countries, for different hazards, and for different intended audiences. In addition to the comprehensive, searchable Volcanic Hazard Maps Database, this website contains information about diversity of volcanic hazard maps, illustrated using examples from the database. This site is for educational purposes related to volcanic hazard maps. Hazard maps found on this website should not be used for emergency purposes. For the most recent, official hazard map for a particular volcano, please seek out the proper institutional authorities on the matter. |
| IRIS seismic stations/networks | Incorporated Research Institutions for Seismology (IRIS) Data Services map showing the location of seismic stations from all available networks (permanent or temporary) within a radius of 0.18° (about 20 km at mid-latitudes) from the given location of Salton Buttes. Users can customize a variety of filters and options in the left panel. Note that if there are no stations are known the map will default to show the entire world with a "No data matched request" error notice. |
| UNAVCO GPS/GNSS stations | Geodetic Data Services map from UNAVCO showing the location of GPS/GNSS stations from all available networks (permanent or temporary) within a radius of 20 km from the given location of Salton Buttes. Users can customize the data search based on station or network names, location, and time window. Requires Adobe Flash Player. |
| DECADE Data | The DECADE portal, still in the developmental stage, serves as an example of the proposed interoperability between The Smithsonian Institution's Global Volcanism Program, the Mapping Gas Emissions (MaGa) Database, and the EarthChem Geochemical Portal. The Deep Earth Carbon Degassing (DECADE) initiative seeks to use new and established technologies to determine accurate global fluxes of volcanic CO2 to the atmosphere, but installing CO2 monitoring networks on 20 of the world's 150 most actively degassing volcanoes. The group uses related laboratory-based studies (direct gas sampling and analysis, melt inclusions) to provide new data for direct degassing of deep earth carbon to the atmosphere. |
| Large Eruptions of Salton Buttes | Information about large Quaternary eruptions (VEI >= 4) is cataloged in the Large Magnitude Explosive Volcanic Eruptions (LaMEVE) database of the Volcano Global Risk Identification and Analysis Project (VOGRIPA). |
| EarthChem | EarthChem develops and maintains databases, software, and services that support the preservation, discovery, access and analysis of geochemical data, and facilitate their integration with the broad array of other available earth science parameters. EarthChem is operated by a joint team of disciplinary scientists, data scientists, data managers and information technology developers who are part of the NSF-funded data facility Integrated Earth Data Applications (IEDA). IEDA is a collaborative effort of EarthChem and the Marine Geoscience Data System (MGDS). |


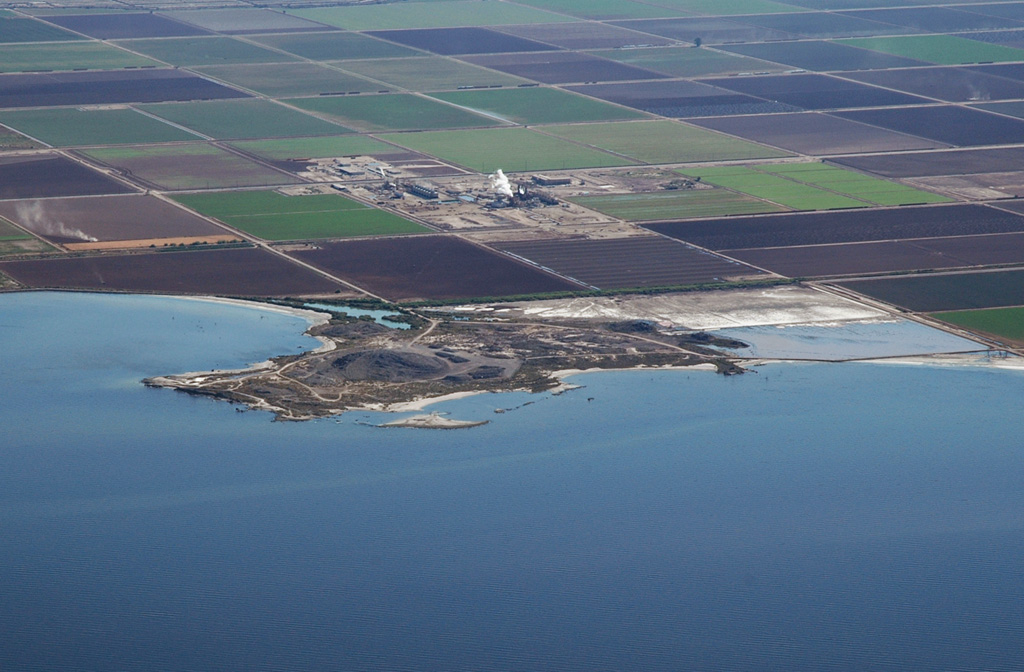
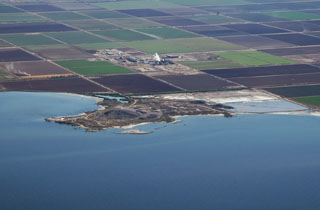 Obsidian Butte on the SE shore of the Salton Sea is seen in an aerial view from the NW. Obsidian Butte is one of five small rhyolitic lava domes extruded onto Quaternary sediments of the Colorado River delta; the summit of the dome lies 40 m below sea level. Two domes, Mullet Island and Red Island (not visible in this view), form small islands just offshore to the NE of Obsidian Butte. A steam plume rises from the Salton Sea geothermal field behind the dome.