Observatorio Vulcanológico y Sismológico de Popayán, Servicio Geologico Colombiano (SGC) reported increased unrest at Puracé on 5 January. A sudden increase in carbon dioxide emissions was detected during the morning and decreased through the day; increased gas emissions were visible in webcam images during the afternoon. Seismicity increased at 1450 and continued at high levels at least through 1715, the time the report was issued. The earthquake signals indicated fluid movement, had low magnitudes, and were located less than 2 km below the summit. The Alert Level remained at Yellow (the second level on a four-color scale).
Source: Servicio Geológico Colombiano (SGC)
Frequent seismicity and degassing during March-July 2022
Puracé, located in Colombia, is a stratovolcano that contains a 500-m-wide summit crater. It is part of the Los Coconucos volcanic chain that is a NW-SE trending group of seven cones and craters. The previous eruption occurred during March 1977, with more recent activity characterized by small white gas-and-steam plumes on the NW edge of the crater during October 2011 and intermittent elevated volcano-tectonic and long-period seismicity during January-April 2008 and January 2010-April 2012 (see table 2 in BGVN 37:09). This report updates similar seismic information and fumarolic activity from March through July 2022 based on weekly reports from the Popayán Observatory, part of the Servicio Geologico Colombiano (SGC).
Activity during this reporting period primarily consisted of elevated seismic events and fumaroles (table 3). On 28 March starting at 2000 and continuing through the night, there were 479 volcano-tectonic-type (VT) events, indicating rock fracturing events, 183 long-period-type (LP) events, and 119 volcanic tremor-type (TR) events, indicating fluid movement. Seismicity was detected 800 m SE from the crater at average depths of 2 km (figure 12). A magnitude 3.3 earthquake occurred at 1214 on 29 March. That same day, two cracks approximately 40 m long and located along Coconucos Volcanic Chain, between Puracé and Curiquinga, and produced gas-and-steam emissions. Ash was also reported by observers in the area. There was also an increase in sulfur dioxide gas emission. On 30 March the Volcano Alert Level rose to 3 or Yellow (the second lowest on a four-color scale).
Table 3. Seismicity at Puracé during March-July 2022. Volcano-tectonic (VT), long-period (LP), hybrid (HB), tremor (TR), and low frequency (BF) events are reported each month. Courtesy of SGC.
| Month | Volcano-tectonic | Long-period | Hybrid | Tremor | Low frequency |
| Mar 2022 | 479 | 183 | -- | 119 | -- |
| Apr 2022 | 489 | 2,554 | 39 | 104 | 12 |
| May 2022 | 276 | 1,502 | 12 | 416 | 337 |
| Jun 2022 | 312 | 2,674 | 46 | 664 | 302 |
| Jul 2022 | 161 | 1,120 | 90 | 80 | 26 |
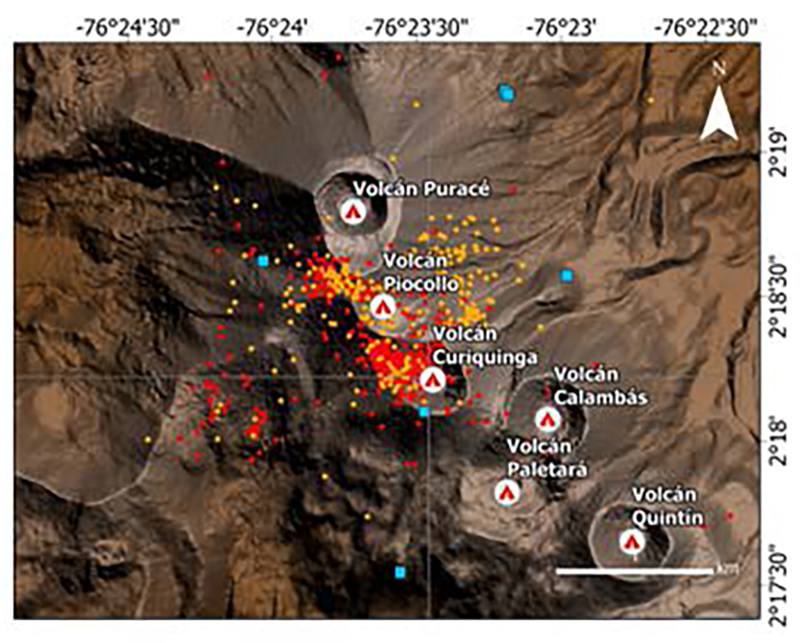 |
Figure 12. Location map showing the VT-type seismic events between the Puracé, Piocollo, and Curiquinga volcanoes during 1 March through 4 April 2022. The red dots represent events that occurred from 1-28 March 2022. The orange dots represent events that occurred during 29 March to 4 April 2022. The blue squares show the location of the seismic stations. Courtesy of SGC (Boletín semanal de actividad volcán Puracé - Cadena volcánica de Los Coconucos, 5 abril 2022). |
During April, seismicity increased to 3,198 events, which included 489 VT-type events, 2,554 LP-type events, 39 hybrid-type (HB) events, 104 TR-type events, and 12 low frequency-type (BF) events. Millimeter-to-centimeter-scale inflation was detected, according to the GNSS (Global Navigation Satellite System) geodetic network and DInSAR (Differential Interferometry by Synthetic Aperturn Radar) data. The measured sulfur dioxide emissions ranged from 937-2,389 tons/day (t/d). Occasional gas-and-steam emissions were emitted from the N flank and drifted NW (figure 13). Seismicity in May persisted with 276 VT-type events, 1,502 LP-type events, 12 HB-type events, 416 TR-type events, and 337 BF-type events. Sulfur dioxide emissions during May ranged from 523-1,841 t/d. White gas-and-steam emissions occasionally were visible drifting NW during the second half of the month. A drone overflight over Curiquinga occurred on 11 May showing cracks in the volcano that were 45 m long, 6 m deep, and 10-20 m wide. No emissions were observed rising from these cracks at the time.
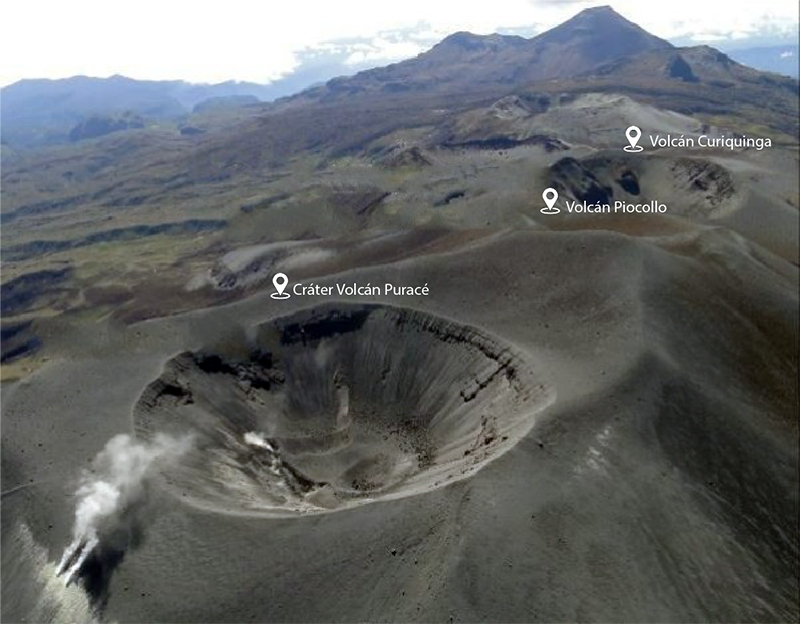 |
Figure 13. Aerial photo of the eruptive centers of the Coconucos Volcanic Chain showing the Puracé crater in the foreground and Piocollo and Cuiquinga in the background. Courtesy of SGC (10 de Agosto de 2022). |
Seismicity in June continued, with 312 VT-type events, 2,674 LP-type events, 46 HB-type events, 664 TR-type events, and 302 BF-type events. Sulfur dioxide emissions ranged from 544-1,573 t/d, the largest measurement of which occurred on 23 June. Intermittent white gas-and-steam emissions continued to drift NW. In July, the number of seismic events decreased slightly and included 161 VT-type events, 1,120 LP-type events, 90 HB-type events, 80 TR-type events, and 26 BF-type events. White gas-and-steam emissions continued to occasionally be visible through the first half of July.
Information Contacts: Servicio Geologico Colombiano (SGC), Diagonal 53 No. 34-53 - Bogotá D.C., Colombia (URL: https://www.sgc.gov.co/volcanes).
2024: January
2023: November
2022: March
| April
| September
Observatorio Vulcanológico y Sismológico de Popayán, Servicio Geologico Colombiano (SGC) reported increased unrest at Puracé on 5 January. A sudden increase in carbon dioxide emissions was detected during the morning and decreased through the day; increased gas emissions were visible in webcam images during the afternoon. Seismicity increased at 1450 and continued at high levels at least through 1715, the time the report was issued. The earthquake signals indicated fluid movement, had low magnitudes, and were located less than 2 km below the summit. The Alert Level remained at Yellow (the second level on a four-color scale).
Source: Servicio Geológico Colombiano (SGC)
Observatorio Vulcanológico y Sismológico de Popayán, Servicio Geologico Colombiano (SGC) reported that at 1929 on 16 November the seismic network recorded a signal at Puracé associated with an ash-and-gas emission. Ash deposits on the N flank were confirmed by an observer the next day. SGC noted that localized deformation between Puracé and Curiquinga volcanoes continued to be recorded. Sulfur dioxide gas emissions had stable values, but carbon dioxide concentrations were high compared to values recorded so far in 2023. The Alert Level remained at Yellow (the second lowest on a four-color scale).
Source: Servicio Geológico Colombiano (SGC)
Observatorio Vulcanológico y Sismológico de Popayán, Servicio Geologico Colombiano (SGC) reported that at 1929 on 16 November the seismic network recorded a signal at Puracé possibly associated with an ash-and-gas emission. An emission was not confirmed in webcam images due to darkness. The Alert Level remained at Yellow (the second lowest on a four-color scale).
Source: Servicio Geológico Colombiano (SGC)
Observatorio Vulcanológico y Sismológico de Popayán, Servicio Geologico Colombiano (SGC), reported that during 13-19 September the number of earthquakes at Puracé was slightly higher compared to previous weeks. A seismic swarm was recorded on 15 September. Events were located about 1.5 km SW of Puracé crater, at depths of 3-4 km, and were as large as M 1.3. A total of 904 earthquakes were recorded during the week; 296 of those were volcano-tectonic events, 538 were long-period events, 54 were low-energy pulses of tremor, 11 were tornillo-type events, and five were hybrid events. Data from the GNSS (Global Navigation Satellite System) geodetic network indicated continuing inflation. White gas plumes were visible in the Anambío, Mina, Lavas Rojas, Cerro Sombrero, and Curiquinga webcams drifting NW. Sulfur dioxide emissions were as high as 2,021 tonnes per day. The Alert Level remained at Yellow (the second lowest on a four-color scale).
Source: Servicio Geológico Colombiano (SGC)
Observatorio Vulcanológico y Sismológico de Popayán, Servicio Geologico Colombiano (SGC), reported that during 19-25 April the number and magnitudes of earthquakes at Puracé was similar to the previous week. Signals included 72 volcano-tectonic (VT) events, indicating rock fracturing, along with 207 long-period (LP) events and 14 low-energy tremor pulses, indicating fluid movement. Data from the GNSS (Global Navigation Satellite System) geodetic network continued to show inflation on the centimeter scale. Sulfur dioxide emissions were lower than the previous week, with values of 937-992 tonnes per day, and gas plumes drifted NW. During a field visit on 22 April scientists observed no changes to the crack near Puracé and Curiquinga volcanoes, and no visible gas emissions. Additional cracks, oriented NW-SE, were observed, in addition to volcanic ash deposits that were likely emplaced on 29 March. The Alert Level remained at Yellow (the second lowest on a four-color scale).
Source: Servicio Geológico Colombiano (SGC)
On 29 March Observatorio Vulcanológico y Sismológico de Popayán, Servicio Geologico Colombiano (SGC), reported that the number of earthquakes at Puracé had increased during the previous few weeks, and were characterized by volcano-tectonic (VT) events, indicating rock fracturing, and long-period (LP) and volcanic tremor (TR) events, indicating fluid movement. The number of events notably increased on 28 March, with 479 VT, 183 (LP), and 119 (TR) events in total. The magnitudes of events abruptly increased the next day; the largest event was a M 3.3 recorded at 1214 on 29 March. Two fractures opened on 29 March, each about 40 m long, and produced gas emissions detected by satellite; ash was reported by observers in the area. The fractures were located along Coconucos Volcanic Chain, between Puracé Volcano and Curiquinga Volcano. The Alert Level was raised to Yellow (the second lowest on a four-color scale) on 30 March.
Seismicity continued to be elevated through 4 April. The earthquakes were low magnitude, and located about 800 m SE of Puracé and beneath Curiquinga, at depths of 2 km on average. The number of events signifying fluid movement was increasing. GNSS (Global Navigation Satellite System) geodetic network and DInSAR (Differential Interferometry by Synthetic Aperture Radar) showed inflation on the millimeter scale. Sulfur dioxide and carbon dioxide emissions increased, based on satellite and ground-based sampling data, and a fumarole on the N flank of Puracé intensified and produced a strong sulfur odor.
Significant unrest continued during 5-11 April. The seismic network recorded a total of 2,077 earthquakes, consisting of 248 VT events, 1,759 LP events, 37 low-energy TR events, and 31 hybrid events. Millimeter-scale inflation persisted, and sulfur dioxide emissions averaged 1,800 tonnes per day.
Source: Servicio Geológico Colombiano (SGC)
The Popayán Observatory, part of the Servicio Geologico Colombiano (SGC) reported that there was an increase in the number of volcano-tectonic earthquakes associated with rock fractures at Puracé. On 28 March, 479 volcanic tremors, 183 long-period (LP), and 119 volcanic tremor (TR) events were detected. Seismicity was detected 800 m SE from the crater at average depths of 2 km. An earthquake that occurred at 1214 on 29 March had a magnitude of 3.3. That same day, two cracks approximately 40 m long produced gas-and-steam emissions. On 30 March the Volcano Alert Level rose to 3 or Yellow (the second lowest on a four-color scale).
Source: Servicio Geológico Colombiano (SGC)
Reports are organized chronologically and indexed below by Month/Year (Publication Volume:Number), and include a one-line summary. Click on the index link or scroll down to read the reports.
Eruption drops ash 7 km away on 19 March
An eruption on 19 March 1977 deposited fine gray ash as far as 7 km from the crater according to press reports. No casualties or damage were reported.
Information Contacts: E. Ramirez, Univ. Javeriana, Bogotá.
Another ash emission seen on 25 March
The eruption of a black and gray ash cloud began at 0545 on 19 March from two new vents. Fine gray ash was deposited as far as 7 km away. The volcano was visited a few days later by Guillermo Cajino, who noted a small tremor and rumbling noises while 5 km from Puracé at 2300 on 24 March. The next day, he observed the emission of a gas column from the two vents, which scattered ash SE over the flanks. By 28 March the fume clouds rose only 200 m.
Information Contacts: U.S. Dept. of State.
Sulfur-rich summit fumaroles and flank hot springs
"The summit crater and hydrothermal sites were visited on 6 and 7 August, with María Luisa Monsalve (INGEOMINAS, Popayán). The Coconucos-Aguas Herviendo hot springs, 5.5 km WNW of the crater at ~2,900 m elev, in the Río Grande valley, are a very popular developed site, with concrete pools and restaurant. Maximum water temperatures were measured in the small central bubbling spring and were 74°C (unchanged since December 1989). pH was not measured on this trip but was 6.2 in December. Coconucos-Aguas Tibias, ~ 2 km S of Aguas Herviendo (6 km WSW of the crater), has one small concrete pool with a natural spring ~300 m to the S. Maximum temperatures were 61°C. Giggenbach-type gas samples were collected from the bubbles at both sites. A third hydrothermal site, Pilimbala, is at 3,350 m elev and 7.8 km from the crater. This site is maintained by the national park service (INDERENA) and has large tile-lined pools, filled with water from the single large spring. Maximum temperature was 31°C. No pH was measured and no bubbles were observed in the spring. Although there was abundant deposition of sulfur within the hot spring, there was little odor of H2S.
"At the nearby mine site (3,550 m elev), the swimming pool spring was sampled again. The temperature was 47°C, unchanged since December 1989, when the pH was 4.3. The odor of H2S was very strong and abundant sulfur deposition was evident in the spring and swimming pool.
"The crater was visited on a day with almost no visibility and during a freezing rain. A fumarole field is located on a circumferential crack, ~ 100 m outside of the crater, and on a line between the crater and the mine (340°). The summit crater is ~ 400 m in diameter and ~ 100 m deep. A central graben, oriented 100°, is located in the deepest part of the crater and all of the crater fumaroles are located within it. The maximum temperature in the westernmost fumarole field was 89°C (unchanged). The fumarole field covered an area of ~10 m diameter and had a typical low-temperature appearance, with abundant native sulfur and aluminum chloride deposition over a large area. Some collapse of the fumarole had apparently taken place since the December 1989 visit. During the first visit to the crater, in April 1988, the fumaroles looked as if they were hotter than in August 1990 but no temperatures were taken. The summit fumaroles were basically steam and the system appeared to be dominated by recirculation of groundwater, with little magmatic input at this time.
Information Contacts: S. Williams, Louisiana State Univ; J. Stix and E. Fontaine, Univ de Montréal.
Summit fumarole gas analyses reported
Fumaroles near the summit were visited by Héctor Cepeda, other geologists from INGEOMINAS, Marino Martini, and Franco Prati. The temperature of the gas sample (table 1) was 170°C, and geologists inferred a significant magmatic component.
Table 1. Analysis of gases collected at Galeras (26 November 1992) and Puracé (28 November 1992). Percentages shown are for dry gas. Courtesy of M. Martini.
| Gas | Galeras | Puracé |
| CO2 | 70.23 | 73.84 |
| SO2 | 9.90 | 14.66 |
| H2S | 6.72 | 3.25 |
| HCl | 8.36 | 7.53 |
| HF | 0.73 | 0.041 |
| H2 | 3.35 | 0.0034 |
| CO | 0.16 | 0.0005 |
| N2 | 0.48 | 0.62 |
| H | 0.0037 | -- |
| B | -- | 0.042 |
| Vol % H20 | 91.48 | 98.09 |
| Temp | 642°C | 170°C |
Information Contacts: H. Cepeda, INGEOMINAS, Popayán; M. Martini, Univ di Firenze, Italy.
Anomalous February-April earthquakes and banded tremor
Puracé has been seismically monitored since 1989; during February-April 2000 some anomalous seismicity occurred. First, on 2 February a MR 4.7 tectonic earthquake and some volcano-tectonic (VT) earthquakes struck with epicenters near the town of Paispamba almost 15 km SW of the volcano. Next, a swarm consisting of 32 earthquakes occurred with M 0.0 to M 1.5; these events took place during 2-3 February; depths were at 7-9 km, and their magnitudes were over 1.5. Subsequently they migrated to the SE, ending on 21-22 April with 53 earthquakes in a cluster located 4.5 km NE of the volcano at depths of 2.5-8 km. A synopsis of the epicenter data appears in figure 1.
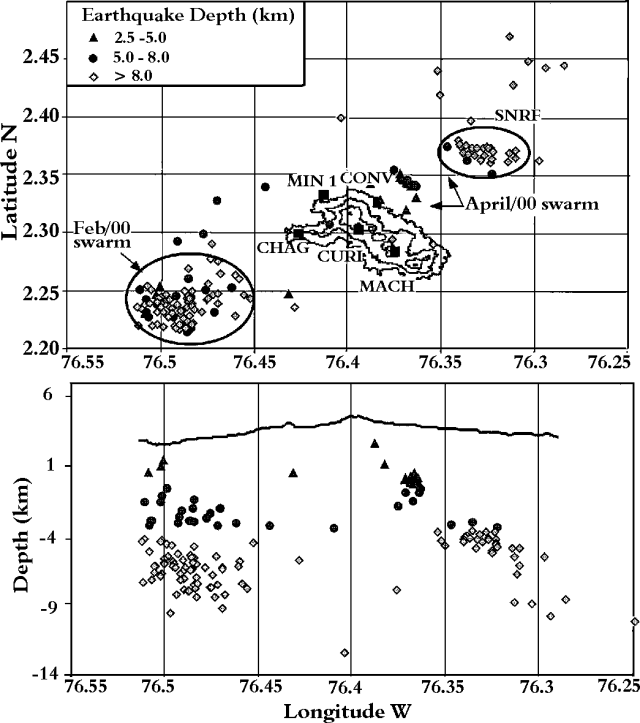 |
Figure 1. Epicenters determined for seismic events at Puracé during February to April 2000. The figure also shows the locations of the six telemetered seismic receivers. Courtesy of Observatorio Vulcanológico y Sismológico de Popayán (INGEOMINAS). |
Information Contacts: Fabiola Rodríguez and Jaime Raigosa, Observatorio Vulcanológico y Sismológico de Popayán, INGEOMINAS, Popayán, Colombia; Hector Cepeda, INGEOMINAS, Bogotá, Colombia.
Expanded monitoring efforts and persistent seismicity in 2012
Our previous report on Puracé (BGVN 25:05) described elevated seismicity and swarms from February through April 2000. The Popayán Observatory, part of the Instituto Colombiano de Geología y Minería (INGEOMINAS), released geochemical, geophysical, and visual observations of the volcano since our last report. Here we present the results from their field investigations focused on fumarolic sites, hot springs, and SO2 emissions. Low levels of seismicity persisted at Puracé during January-April 2008 and January 2010-August 2012, but tornillo and tremor events were frequently detected; elevated seismicity was detected in March 2012. Available maps include those for volcanic hazards, monitoring networks, and geomorphology. From January 2008-August 2012, the Alert Level for Puracé has remained at VI (Green; "volcanic behavior is in a typical background, noneruptive state"), the lowest level on a VI-I scale.
Hazard map for the Puracé region. A hazard map has been developed by INGEOMINAS for the Puracé region (figure 2). Three zones encompass the entire volcanic chain and one of the zones (delineating potential ashfall) reaches the town of Popayán (28 km NW).
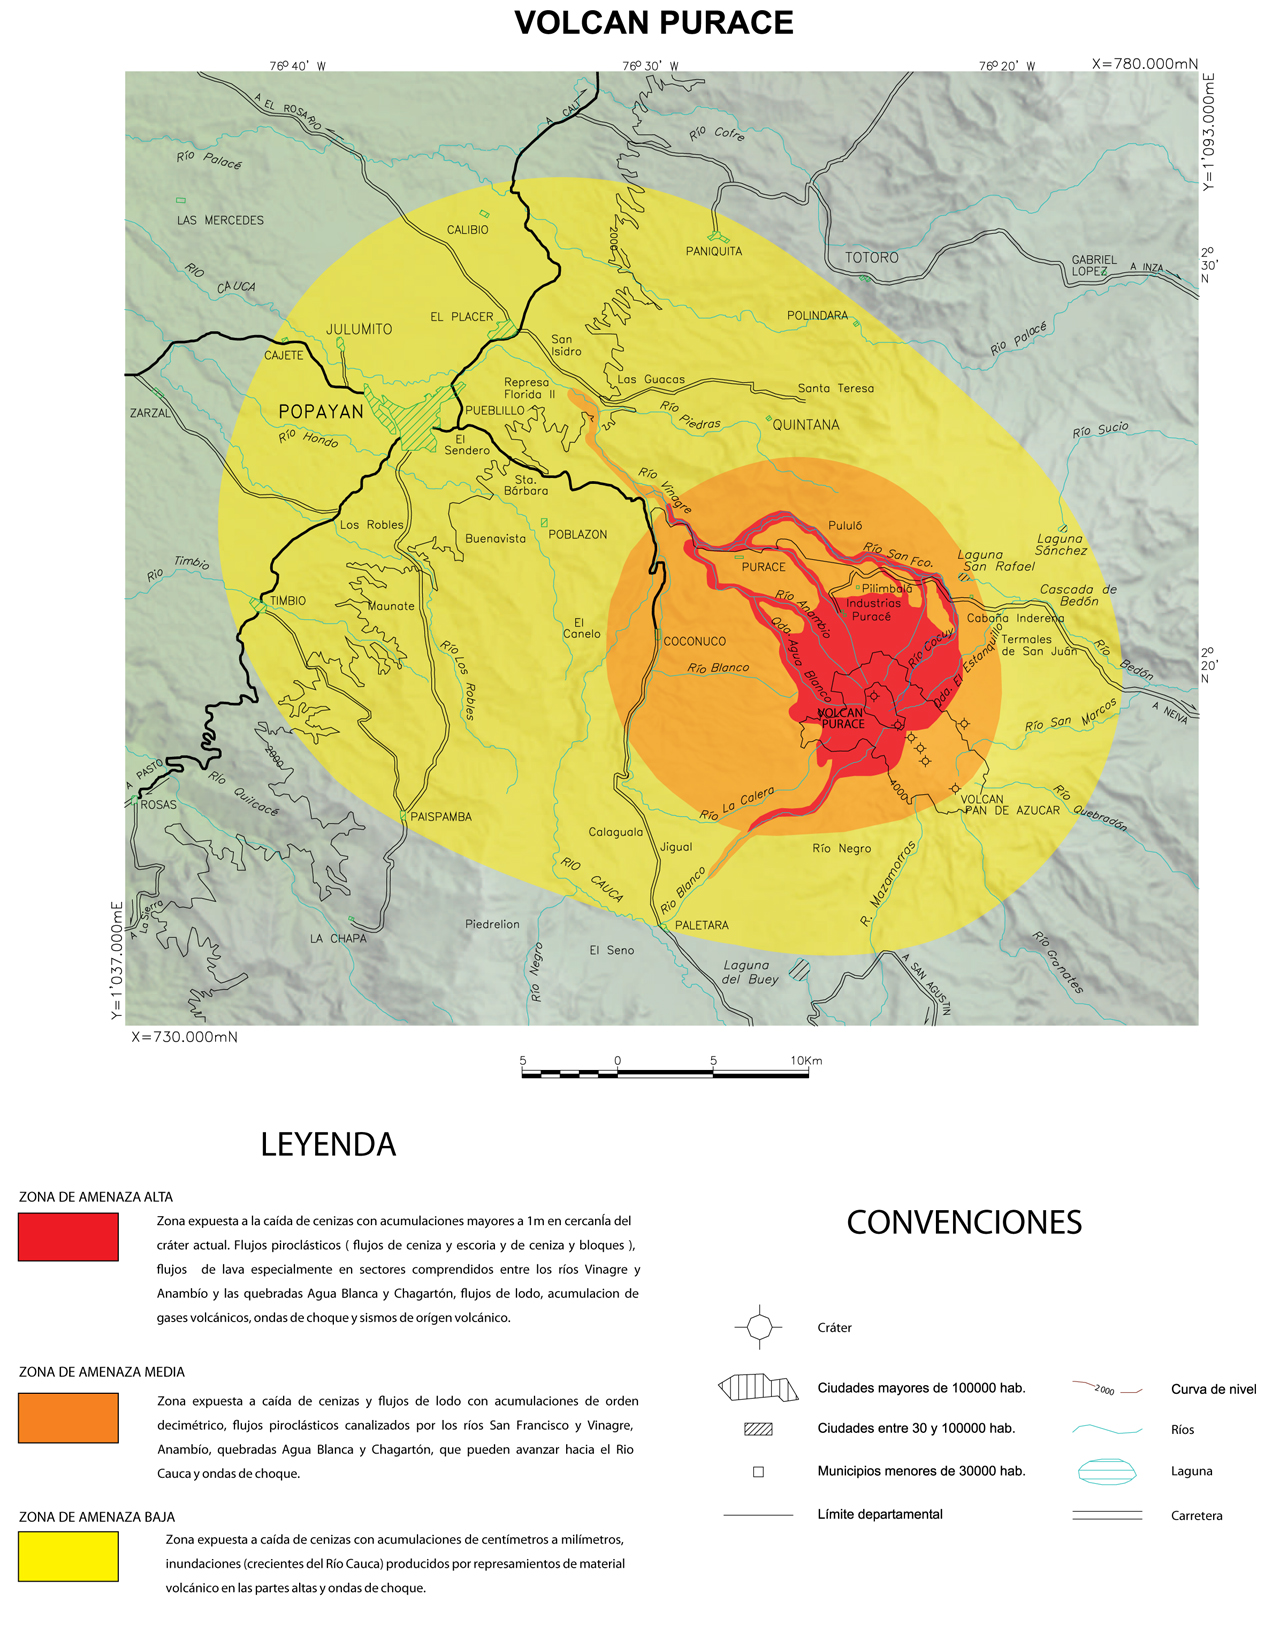 |
Figure 2. This hazard map delineates three zones around Puracé volcano (see text). The highest risk area (red) includes the volcanic centers Puracé and Curiquinga and also follows major drainages N and S. The moderate risk area (orange) includes most of the Coconucos volcanic chain and extends NW to include the town of Puracé. The lowest risk area (yellow) extends NW (including Popayán) and as far S as the town of Paletará. Courtesy of INGEOMINAS. |
The red zone (highest risk area) indicates areas where lava flows may occur in the future, with inferred events including more than 1 m of ash fall and ballistic ejecta, lahars, volcanic gases, and elevated seismicity. Drainages surrounding the town of Puracé and the sulfur mine (Industrias Puracé) location are within the red zone.
The orange zone (moderate risk) would, in future eruptions, likely experience ashfall on the order of decimeters; pyroclastic flows could reach this region as well as lahars. The towns Coconuco, Puracé, and Pululó are within the orange zone; ~7 km SE of Purace volcano, the peak of Pan de Azúcar is at the boundary between the orange and yellow zones (figure 3).
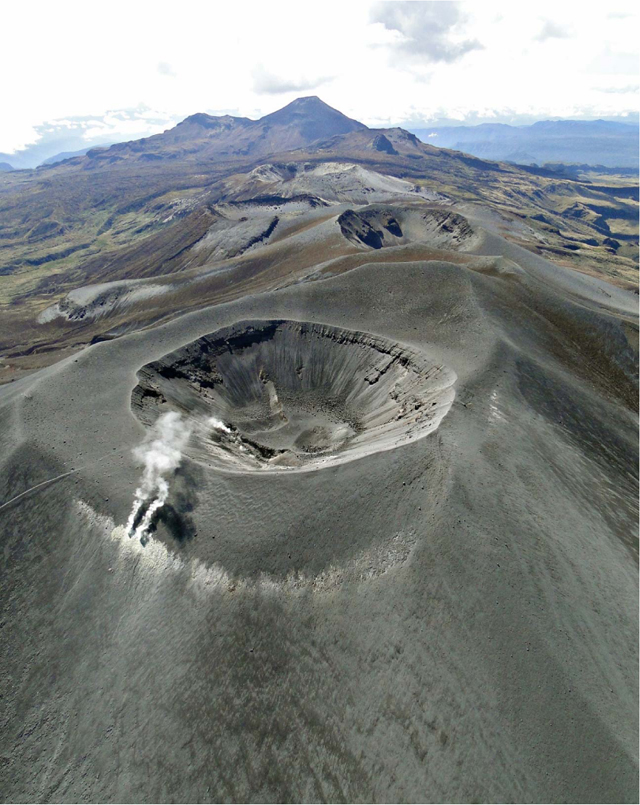 |
Figure 3. An aerial view looking SE along the Coconucos volcanic chain taken on 22 October 2011. Puracé is in the foreground and several craters are aligned in the distance. The tallest peak in the background is Pan de Azúcar. Courtesy of INGEOMINAS. |
The yellow zone (low risk) distinguishes the largest hazard zone and encompasses Paletará, Paispamba, Timbio, Popayán, El Placer, Calibio, Paniquita, Polindara, Quintana, and other towns. This zone may experience centimeters to millimeters of ashfall in future eruptions. Flooding along rivers could also occur within this zone if volcanic material accumulated during an eruption. INGEOMINAS also noted that shock waves from a large eruption could be experienced within all three zones.
Ground deformation monitoring 1999-2012. In 1999, INGEOMINAS monitored deformation with an electronic tilt station located 1.24 km N of the crater (Guañarita station, 4,248 m a.s.l., GUAI). During January-April 2008, significant changes were absent. From January 2010-October 2011, the tiltmeter network was expanded to include two more electronic tiltmeters (figure 4), however, no major trends in ground deformation were noted during that time. INGEOMINAS noted a decreasing trend between October 2011 and April 2012 at the Lavas Rojas station (LAVI, 2.4 km WNW of the summit, 4,046 m a.s.l.). They calculated -90 µrad in total deflation from the N component and -70 µrad from the E component. At the Guañarita station (GUAI), deflation also began in October 2011 and continued through August 2012.
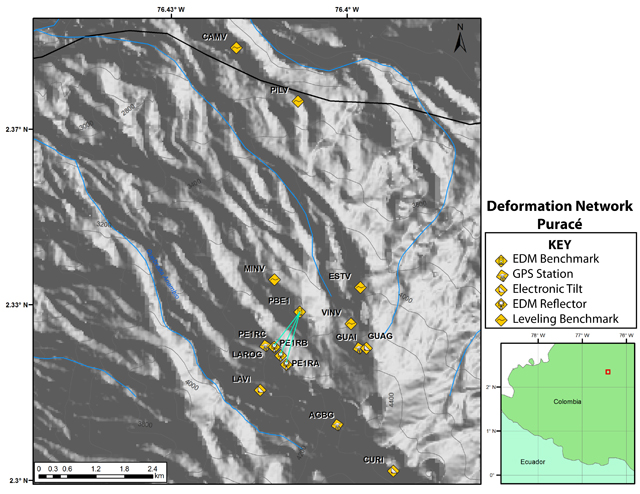 |
Figure 4. The geophysical monitoring network for Puracé volcano in 2012 included electronic tiltmeters, GPS stations, line leveling benchmarks, and an EDM network concentrated NW of the edifice. In the lower-right-hand corner, three craters are visible (Puracé, Curiquinga, and Calambas). Courtesy of INGEOMINAS. |
In August 2011, two permanent Global Positioning System (GPS) stations were installed on the flanks of Puracé located 1.24 km N (Guañarita, GUAG) and 2.48 km NW (Lavas Rojas, LAROG). A third GPS station, Agua Blanca (AGBG), was added to this network in November 2011, located 0.7 km W of the crater. During October 2011, deflation trends were observed with electronic tiltmeters; GPS and electronic distance measurement (EDM) campaigns showed few variations.
A magnetometer was installed near the Puracé edifice in December 2010 and, in January 2011, INGEOMINAS reported successful real-time transmissions to the Popayán Observatory (26 km NE of Puracé). The site location of the new instrument was 1.6 km N of the volcano in an area of andesitic lava flows emplaced during pre-Puracé development that remains undated. INGEOMINAS reported daily fluctuations in the magnetometer data and also identified anomalous solar activity that was confirmed with global datasets. Data sent from this station reported stable conditions persisting from January 2011 through August 2012.
Investigations at other volcanoes globally have shown successful correlations between magnetic fluctuations and magma intrusions, demonstrating the benefits of magnetometers in early warning systems. A basic unit of magnetism in the SI system is the tesla ("T"); this is a measure of magnetic field strength (a variable frequently denoted as B). [1 tesla = 1 weber/m2 = 1 newton/amp-m = 104 gauss = 109 gamma. Also, 1 nanotesla = 1 gamma (Sheriff, 1982)]. Hurst and others (2004) described examples:
"For instance, the basaltic andesite volcano Poas in Costa Rica showed changes of nearly 200 nanoTesla (Rymer and others, 2000), whereas the basaltic Japanese volcano Izu-Oshima showed changes of only tens of nanoTeslas in 1986 (Sasai and others, 1990). The latter case was one of the few in which magnetic changes clearly occurred before the volcanic activity started, a more marginal case was Unzen, where magnetic changes were recorded in the very early stages of an eruption (Tanaka, 1995)."
Geochemical monitoring. Between 1982 and 1993, INGEOMINAS carried out intermittent site visits to the fumaroles and hot springs located near the flanks and summit crater of Puracé (figure 5). Since 1994, they conducted periodic geochemical monitoring to evaluate the variations in fluid compositions from the hot springs and established a baseline of activity and characteristics.
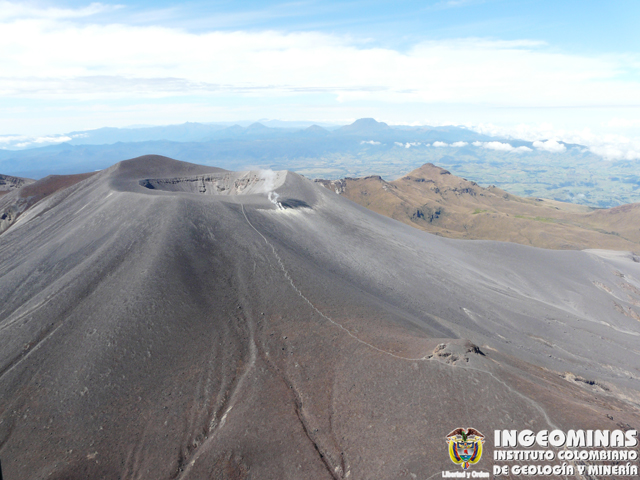 |
Figure 5. Photographed on 22 October 2011, a view of the N flank and crater rim of Puracé. Small, white plumes of gas rise from the fumarolic field located on the outside edge of the crater. The rugged peak of Chagarton, considered a pre-Puracé structure, is in view to the right of Puracé's summit (middle ground). In the background on the horizon is the tall, wide peak of Sotará volcano located ~32 km SW. Courtesy of INGEOMINAS. |
On 16 April 2008, INGEOMINAS visited three sites located along the lower flanks of Puracé to determine radon-222 emissions: Agua Tibío, Tabío, and Agua Hirviendo. Relative to past records, values obtained from the soil at Agua Hirviendo were slightly higher: 2,035 pico Curies per Liter (pCi/L). Tabío and Agua Tibío respectively measured 323 and 790 pCi/L.
On 14 September 2011, INGEOMINAS scientists walked the crater rim to collect differential optical-absorption spectroscopy (DOAS) measurements to determine SO2 flux. The mobile DOAS campaign confirmed the concentration of gas was located within the fumarolic area on the N rim (figure 6). With a wind speed of 5.0 m/s from the W, total flux was 0.5 metric tons per day.
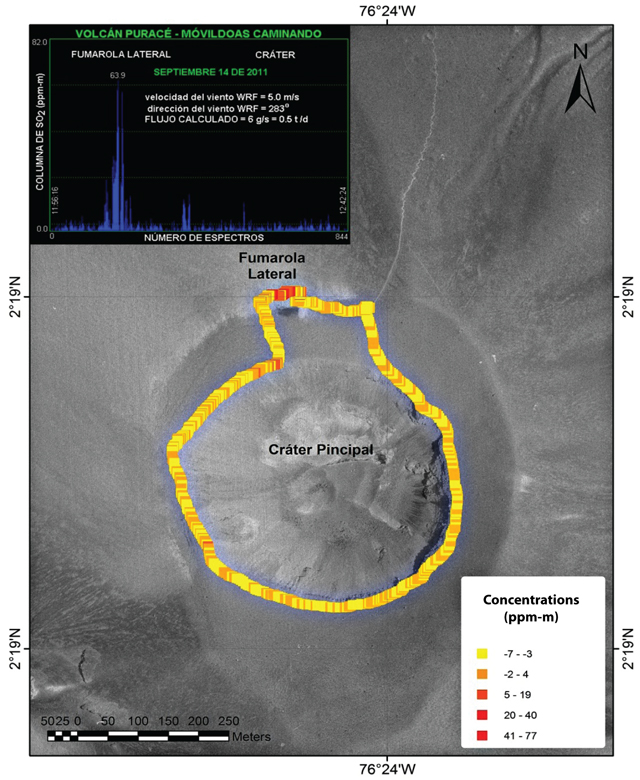 |
Figure 6. The path traversed with a mobile DOAS instrument on 14 September 2011 around the crater rim of Puracé (note color coding). The background photo was taken by Colombia's national mapping agency, IGAC, in 1976. Courtesy of INGEOMINAS. |
A field campaign to detect sulfur dioxide emissions was also conducted on 29 August 2012. Using a mobile Flyspec, a team of INGEOMINAS scientists focused on the Pozo Azul hot spring located ~8 km SW of the crater (also called PAFT in figure 7). This ultraviolet spectrometer sampled continuously for approximately five minutes while the scientists traversed the area around the hot spring (figure 7). There were four locations along the pathway where SO2 concentrations measured greater than 6.6 ppm-m. INGEOMINAS reported the total SO2 flux was 1.1 tons/day (windspeed of 7.7 m/s from the W).
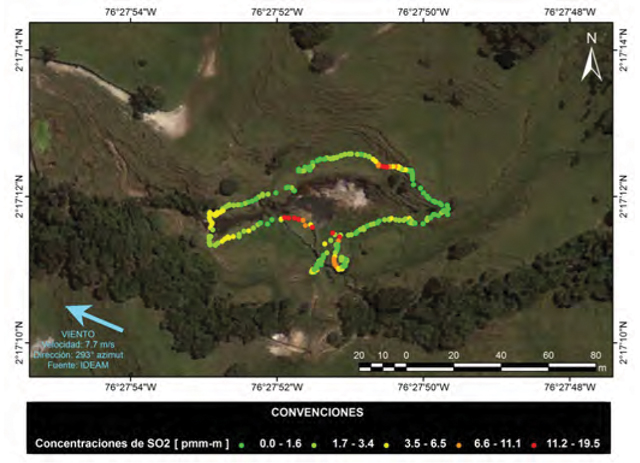 |
Figure 7. INGEOMINAS conducted a Flyspec traverse and calculated sulfur dioxide concentrations for the area around Pozo Azul, located ~8 km SW of Puracé's crater. Courtesy of INGEOMINAS. |
Radon emissions had been monitored by INGEOMINAS from May 2011 through August 2012. Regular measurements were obtained from 13 stations located at sites around the volcanic edifice up to 12 km away (figure 8). Month-to-month variations tended to show rare correlations except for March-April 2012. In their monthly report from April 2012, INGEOMINAS highlighted this time period as significant for both seismic and radon assessments. Volcano-tectonic (VT) seismicity had been notably elevated during that time (an average of 116 earthquakes per month) and events were frequently occurring directly below the edifice. Long-period seismicity was also higher in March and April (an average of 290 earthquakes per month). Tremor, tornillo, and hybrid earthquakes occurred more frequently during these months compared with seismicity from the past two years.
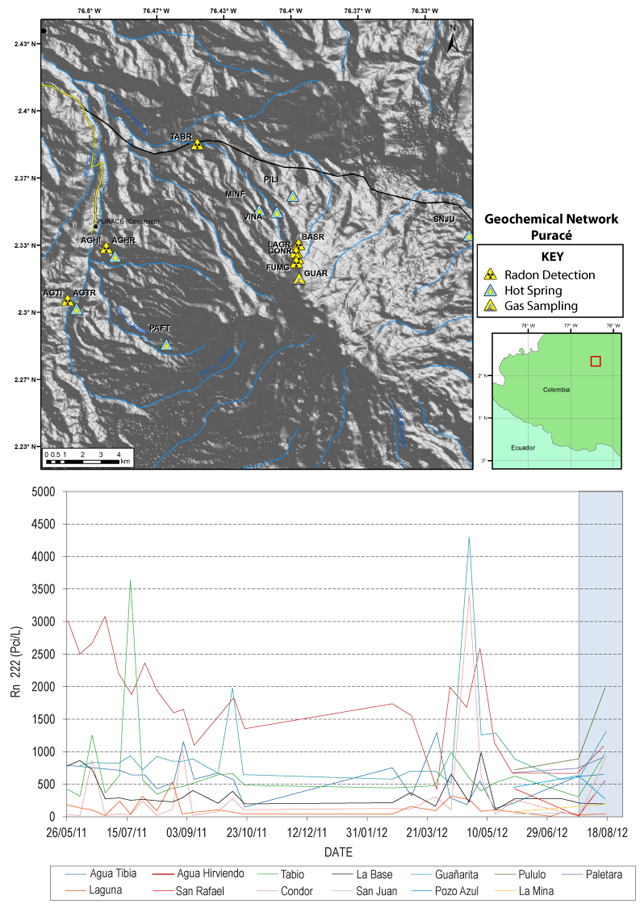 |
Figure 8. The geochemical monitoring network in August 2012 included radon emission detectors, hot spring sampling sites, and gas-sampling sites around the flanks of Puracé. (Top) This map shows the entire length of the Coconucos volcanic chain and sites within the monitoring network. (Bottom) Radon emissions were continuously monitored from 26 May 2011 through 18 August 2012, however, few datapoints were available between 23 October 2011 and February 2012. Courtesy of INGEOMINAS. |
INGEOMINAS reported in their online August 2012 bulletin that field investigations of fumaroles and hot springs detected stable conditions without significant variations in geochemistry or temperatures. Continuous temperature readings from an in situ thermocouple were available from April 2012 to August 2012. This system was installed for monitoring changes in the fumarolic area located on the NW flank of the volcano in September 2011. Due to equipment problems related to equipment corrosion (a common problem in these extreme environments), the data was only successfully telemetered starting on 14 April 2012.
From January 2010 through August 2012, webcameras frequently captured images of the active fumarolic area located on the NW edge of the crater; small white plumes regularly rose from the fumaroles. During an overflight on 22 October 2011, INGEOMINAS observed small plumes of vapor from a crack in the crater floor and the fumarolic field (figure 9).
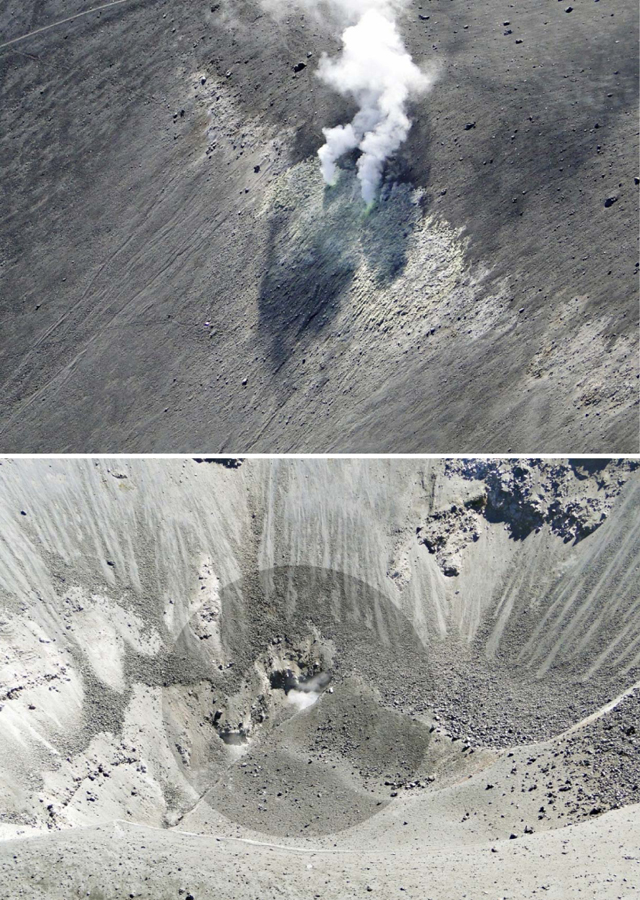 |
Figure 9. Close-up views of vapor plumes observed during an overflight of Puracé on 22 October 2011. (Top) Two adjacent sources of steam merge into a single plume rising from a narrow fumarolic field located on the NW crater rim. Note the bright yellow surfaces where sulfur has precipitated. Past measurements of fumarole temperatures here had reached 128°C. (Bottom) INGEOMINAS noted white vapor rising from a crack within the crater floor. Vapor plumes within the crater were too small to rise above the rim and had not been visible with webcameras. Both features, the fumarolic field outside of the crater and the crack along the crater floor, trend roughly E-W. Courtesy of INGEOMINAS. |
Overview of seismicity. Table 2 summarizes available seismic data for 2008-2012. More discussion appears in chronological subsections below.
Table 2. Seismicity at Puracé volcano during January-April 2008 and from January 2010 through August 2012. Volcano-tectonic (VT), long-period, tornillo, hybrid, and tremor events are reported per month. Depths and magnitudes (local magnitudes, ML) of VT events are mainly reported as ranges of dominant activity, however, many magnitudes are the largest events that occurred per month. Courtesy of INGEOMINAS.
| Month | Volcano-tectonic | VT Depths (km) | VT Magnitude (ML) | Long-period | Tornillo | Hybrid | Tremor |
| Jan 2008 | 246 | 1-20 | -0.89-2.27 | 243 | 13 | 1 | 2 |
| Feb 2008 | 95 | 1-24 | -0.62-2.4 | 113 | 17 | 5 | 0 |
| Mar 2008 | 91 | 1-6 | -0.89-2.27 | 123 | 15 | 1 | 2 |
| Apr 2008 | 51 | 1-4 | -0.4-1.25 | 88 | 15 | 0 | 1 |
| Jan 2010 | 77 | 1-15 | 1.7 | 167 | 0 | 0 | 0 |
| Feb 2010 | 29 | 1-17 | 1.3 | 127 | 0 | 0 | 0 |
| Mar 2010 | 76 | 1-15 | 2.0 | 182 | 30 | 7 | 0 |
| Apr 2010 | 70 | 1-12 | 2.2 | 91 | 61 | 0 | 0 |
| May 2010 | 54 | 1-15 | 2.04 | 85 | 45 | 0 | 0 |
| Jun 2010 | 58 | 0.8-18 | 1.4 | 89 | 21 | 0 | 0 |
| Jul 2010 | 33 | 0.8-2 | 1.14 | 113 | 37 | 0 | 0 |
| Aug 2010 | 13 | 0.8-5 | 1.1 | 83 | 34 | 2 | 0 |
| Sep 2010 | 49 | 5-15 | 1-4.4 | 81 | 28 | 0 | 0 |
| Oct 2010 | 22 | 3-18 | 0.3-1.3 | 122 | 31 | 0 | 0 |
| Nov 2010 | 112 | 1-7.5 | 0.2-2.1 | 157 | 31 | 0 | 0 |
| Dec 2010 | 76 | 0.3-4 | 2.7 | 247 | 9 | 0 | 15 |
| Jan 2011 | 49 | 0.7-4 | 1.8 | 210 | 7 | 0 | 10 |
| Feb 2011 | 34 | 1.2-16 | 1.5 | 177 | 20 | 0 | 3 |
| Mar 2011 | 68 | 1-12 | 1.6 | 152 | 17 | 0 | 3 |
| Apr 2011 | 63 | 1-12 | 1.3 | 137 | 21 | 0 | 1 |
| May 2011 | 45 | 1-15 | 1.7 | 197 | 19 | 0 | 2 |
| Jun 2011 | 31 | 1-15 | 1.7 | 143 | 9 | 0 | 3 |
| Jul 2011 | 26 | 1-13 | 2.4 | 116 | 13 | 0 | 13 |
| Aug 2011 | 32 | 2-3 | 1.8 | 125 | 13 | 0 | 2 |
| Sep 2011 | 15 | 1-2 | 1.5 | 154 | 1 | 0 | 2 |
| Oct 2011 | 25 | 1-15 | 2.1 | 151 | 17 | 2 | 2 |
| Nov 2011 | 25 | 1-4.5 | 1.3 | 125 | 15 | 2 | 2 |
| Dec 2011 | 45 | 1-4.5 | 1.0 | 116 | 28 | 7 | 5 |
| Jan 2012 | 67 | 0.8-5 | 0.1-1.8 | 184 | 54 | 17 | 4 |
| Feb 2012 | 86 | 1-17 | 1.4 | 248 | 20 | 19 | 4 |
| Mar 2012 | 143 | 1-3 | 2.2 | 332 | 46 | 30 | 32 |
| Apr 2012 | 90 | 1-12 | 1.7 | 248 | 67 | 40 | 26 |
| May 2012 | 31 | 1-12 | 1.9 | 219 | 29 | 4 | 8 |
| Jun 2012 | 57 | 1-12 | 1.8 | 190 | 51 | 22 | 11 |
| Jul 2012 | 33 | 1-12 | 1.5 | 181 | 35 | 7 | 2 |
| Aug 2012 | 28 | 1-12 | 2.1 | 165 | 48 | 15 | 11 |
Seismicity during January-April 2008. In January 2008, INGEOMINAS reported increased seismicity within 15 km of the Puracé edifice. There were two regions of activity, along the Moras fault system and within the immediate area of the volcano (figure 10). The Moras fault crosses beneath Puracé and was indicated by earthquake locations to the NE (in the San Rafael lake area) and to the SW (in Paletará Valley) (figure 11). These locations were sites for earthquake swarms in February and April 2000 (BGVN 25:05).
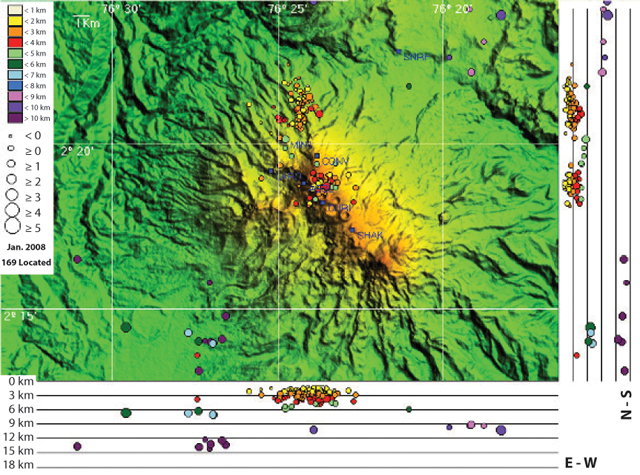 |
Figure 10. A map of epicenters for VT earthquakes located in the region of Puracé in January 2008. A total of 169 events were primarily located beneath the edifice and up to 5 km N in a sulfur mining district. The deepest and most distal earthquakes (to the NE and SW) were attributed to other portions of the Moras fault system, which also cuts through Puracé. Courtesy of INGEOMINAS. |
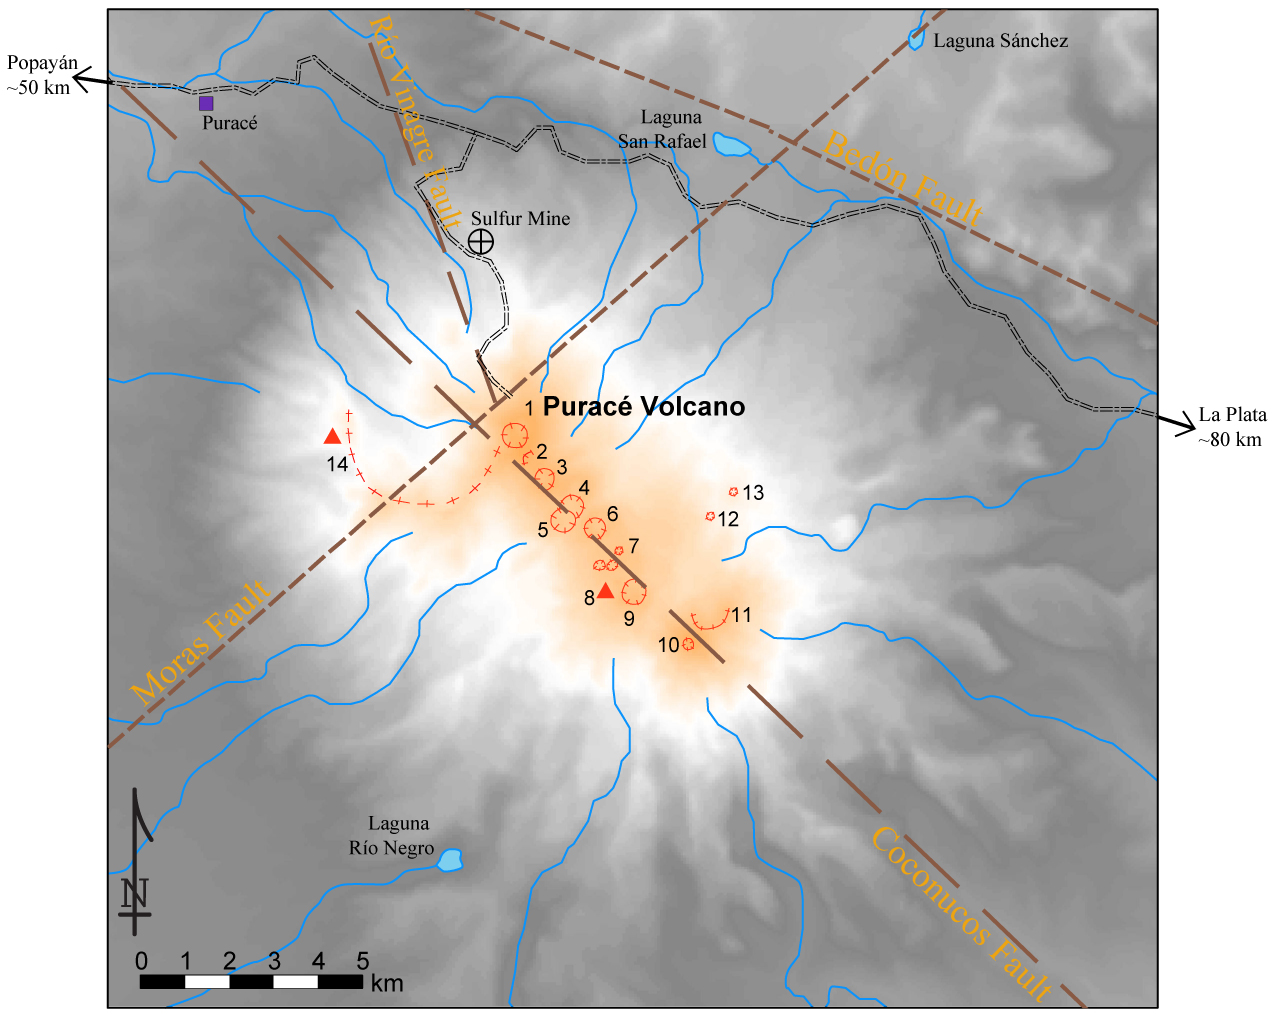 |
Figure 11. Puracé is the most active and northernmost volcano along the NW-SE trending Coconucos ridge. Numbers correspond to cones with craters (red hashed circles) and major peaks (red triangles): 1 Puracé volcano, 2 Piocollo, 3 Curiquinga, 4 Calambas, 5 Paletará, 6 Quintin, 7 Shaka (a cluster of craters with ponded water), 8 Killa, 9 Machangara (contains a small pond), 10 Pan de Azúcar (a prominent peak with a small summit crater), 11 Pukará, 12 Piki, 13 Amancay, 14 Chagartón (a large crater and peak has been attributed to this structure). Major regional faults are short dashed lines (brown); the local Coconucos fault and Río Vinagre fault zones are long-dashed lines (brown). The shaded terrain was derived from a 90 m SRTM (Shuttle Radar Topography Mission) digital elevation model. Highest elevations (greater than 4,000 m) are indicated by orange shading and reach a maximum of ~4,650 m; lowest elevations (gray shading) begin at 2,500 m. This map was compiled by GVP based on INGEOMINAS Popayán reports, maps, and aerial photos. Place names are from Arcila (1996), Cardona (1998), Kelsey (2001), and Monsalve and Pulgarín (1999). |
Another local structure, the 2-3 km wide Río Vinagre fault system, underlies Puracé and trends subparallel with the Coconucos fault. Sturchio and others (1993) described the thermal waters, gases and sulfur deposits from Puracé and concluded that sulfur precipitation was likely resulting from hot magmatic gas ascending through the Río Vinagre fault zone. The hot springs were attributed to descending meteoric water interacting with the magmatic system.
A total of 508 events were detected in January 2008, primarily volcano-tectonic (VT) and long-period (LP) earthquakes, 249 and 243 events respectively (table 2). Tornillo (13 in total), hybrid (1 identified), and tremor (2 events identified) were also detected that month. Magnitudes of VTs were in the range of -0.89 to 2.27 and magnitudes of LPs in the range of 0.09 to 1.59. Focal depths tended to be shallow for those events occurring beneath the edifice (1-6 km) and deeper elsewhere along the fault system (6-20 km).
From February through April 2008, INGEOMINAS reported that seismicity from Puracé was relatively low (table 2). Approximately 210 earthquakes were detected each month, primarily LP and VT earthquakes. Tornillo events were detected throughout this time period averaging ~15 per month. Few hybrid events were detected in February and March (1-5 events), and tremor was detected in March and April (1-2 events). Earthquake magnitudes were largest in February (up to ML 2.4 for VT and LP earthquakes) and depths of earthquake foci were characteristically shallow for those events beneath the volcanic edifice (1-7 km). In February, earthquakes (6-17 km deep) were detected within the Moras fault zone with events in a similar distribution to those located in January 2008 (figure 10).
Episode of seismicity in December 2008.On 13 December 2008, INGEOMINAS released a special report announcing a short period of elevated seismicity. Beginning on 12 December, 625 LP earthquakes were detected over 29 hours. These events were low-magnitude (M 0.5-1) and clustered within the sulfur mine area ~2.8 km N. While these earthquakes were very shallow (
Seismicity during January 2010-August 2012. In 2010 and 2011, seismicity detected at Puracé was generally relatively low (table 2). Magnitudes of VT events during 2010 rarely exceeded 2.0 and earthquake foci were rarely deeper than 15 km. Earthquakes deeper than 10 km were typically beyond the edifice and related to the local fault systems. LP events occurred more frequently than VT events; INGEOMINAS reported that 81-247 LP events were detected per month and 13-112 VT events per month. Up to 61 tornillo earthquakes were detected in April 2010, however, no tornillos were recorded in January and February and only nine were recorded in December. Hybrid and tremor events were also rare; several months passed without detecting these events. In March and August, hybrid earthquakes were detected, and tremor was only reported in December.
Seismicity remained low throughout 2011, however, tremor (1-13 events per month) and tornillo earthquakes (1-28 events per month) were detected every month. Hybrid earthquakes were only reported from October through December 2011. VT and LP events persisted, but at a lower rate compared with the previous year; magnitudes and depths were also in the same range.
From January through August 2012, seismicity was consistently higher than the previous eight months. VT and LP events were more numerous, at rates of 28-143 per month and 165-332 per month, respectively. Magnitudes and depths of earthquakes remained within similar ranges as previously recorded. Tremor and hybrid earthquakes were detected every month.
INGEOMINAS emphasized that seismicity was particularly high in March 2012, with more VT and LP events that month than in any month in the past two years. Numerous tornillo, hybrid, and tremor events were also reported (table 2). Seismicity was still comparatively elevated but less so in the five months that followed March 2012.
References. Arcila, M., 1996. Geophysical monitoring of the Puracé volcano, Colombia, Annali di Geofisica, vol. XXXIX, N. 2, pp. 265-272.
Cardona, C.E., 1998. Caracterización de fuentes sísmicas en el volcán Puracé, Geology thesis, Universidad de Caldas.
Hurst, A.W., Rickerby, P.C., Scott, B.J., and Hashimoto, T., 2004. Magnetic field changes on White Island, New Zealand, and the value of magnetic changes for eruption forecasting, Journal of Volcanology and Geothermal Research, 136, pp. 53-70.
Kelsey, M.R., 2001. Climber's and Hiker's Guide to the World's Mountains & Volcanoes, Kelsey Publishing, Provo, UT, 4th ed., p. 1248.
Monsalve, M.L. and Pulgarín, B., 1999. Cadena Volcánica de los Coconucos (Colombia): Centros eruptivos y producto recientes, Boletín Geológico, 37 (1-3): 17-51.
Sheriff, R.E., 1982. Encyclopedic Dictionary of Exploration Geophysics, Society of Exploration Geophysicists, Tulsa, OK, p. 266.
Sturchio, N.C., Williams, S.N., and Sano, Y., 1993. The hydrothermal system of Volcan Puracé, Colombia, Bulletin of Volcanology, 55, pp. 289-296.
Information Contacts: Instituto Colombiano de Geologia y Mineria (INGEOMINAS), Observatorio Vulcanológico y Sismológico de Popayán, Popayán, Colombia.
Frequent seismicity and degassing during March-July 2022
Puracé, located in Colombia, is a stratovolcano that contains a 500-m-wide summit crater. It is part of the Los Coconucos volcanic chain that is a NW-SE trending group of seven cones and craters. The previous eruption occurred during March 1977, with more recent activity characterized by small white gas-and-steam plumes on the NW edge of the crater during October 2011 and intermittent elevated volcano-tectonic and long-period seismicity during January-April 2008 and January 2010-April 2012 (see table 2 in BGVN 37:09). This report updates similar seismic information and fumarolic activity from March through July 2022 based on weekly reports from the Popayán Observatory, part of the Servicio Geologico Colombiano (SGC).
Activity during this reporting period primarily consisted of elevated seismic events and fumaroles (table 3). On 28 March starting at 2000 and continuing through the night, there were 479 volcano-tectonic-type (VT) events, indicating rock fracturing events, 183 long-period-type (LP) events, and 119 volcanic tremor-type (TR) events, indicating fluid movement. Seismicity was detected 800 m SE from the crater at average depths of 2 km (figure 12). A magnitude 3.3 earthquake occurred at 1214 on 29 March. That same day, two cracks approximately 40 m long and located along Coconucos Volcanic Chain, between Puracé and Curiquinga, and produced gas-and-steam emissions. Ash was also reported by observers in the area. There was also an increase in sulfur dioxide gas emission. On 30 March the Volcano Alert Level rose to 3 or Yellow (the second lowest on a four-color scale).
Table 3. Seismicity at Puracé during March-July 2022. Volcano-tectonic (VT), long-period (LP), hybrid (HB), tremor (TR), and low frequency (BF) events are reported each month. Courtesy of SGC.
| Month | Volcano-tectonic | Long-period | Hybrid | Tremor | Low frequency |
| Mar 2022 | 479 | 183 | -- | 119 | -- |
| Apr 2022 | 489 | 2,554 | 39 | 104 | 12 |
| May 2022 | 276 | 1,502 | 12 | 416 | 337 |
| Jun 2022 | 312 | 2,674 | 46 | 664 | 302 |
| Jul 2022 | 161 | 1,120 | 90 | 80 | 26 |
|
Figure 12. Location map showing the VT-type seismic events between the Puracé, Piocollo, and Curiquinga volcanoes during 1 March through 4 April 2022. The red dots represent events that occurred from 1-28 March 2022. The orange dots represent events that occurred during 29 March to 4 April 2022. The blue squares show the location of the seismic stations. Courtesy of SGC (Boletín semanal de actividad volcán Puracé - Cadena volcánica de Los Coconucos, 5 abril 2022). |
During April, seismicity increased to 3,198 events, which included 489 VT-type events, 2,554 LP-type events, 39 hybrid-type (HB) events, 104 TR-type events, and 12 low frequency-type (BF) events. Millimeter-to-centimeter-scale inflation was detected, according to the GNSS (Global Navigation Satellite System) geodetic network and DInSAR (Differential Interferometry by Synthetic Aperturn Radar) data. The measured sulfur dioxide emissions ranged from 937-2,389 tons/day (t/d). Occasional gas-and-steam emissions were emitted from the N flank and drifted NW (figure 13). Seismicity in May persisted with 276 VT-type events, 1,502 LP-type events, 12 HB-type events, 416 TR-type events, and 337 BF-type events. Sulfur dioxide emissions during May ranged from 523-1,841 t/d. White gas-and-steam emissions occasionally were visible drifting NW during the second half of the month. A drone overflight over Curiquinga occurred on 11 May showing cracks in the volcano that were 45 m long, 6 m deep, and 10-20 m wide. No emissions were observed rising from these cracks at the time.
|
Figure 13. Aerial photo of the eruptive centers of the Coconucos Volcanic Chain showing the Puracé crater in the foreground and Piocollo and Cuiquinga in the background. Courtesy of SGC (10 de Agosto de 2022). |
Seismicity in June continued, with 312 VT-type events, 2,674 LP-type events, 46 HB-type events, 664 TR-type events, and 302 BF-type events. Sulfur dioxide emissions ranged from 544-1,573 t/d, the largest measurement of which occurred on 23 June. Intermittent white gas-and-steam emissions continued to drift NW. In July, the number of seismic events decreased slightly and included 161 VT-type events, 1,120 LP-type events, 90 HB-type events, 80 TR-type events, and 26 BF-type events. White gas-and-steam emissions continued to occasionally be visible through the first half of July.
Information Contacts: Servicio Geologico Colombiano (SGC), Diagonal 53 No. 34-53 - Bogotá D.C., Colombia (URL: https://www.sgc.gov.co/volcanes).
This compilation of synonyms and subsidiary features may not be comprehensive. Features are organized into four major categories: Cones, Craters, Domes, and Thermal Features. Synonyms of features appear indented below the primary name. In some cases additional feature type, elevation, or location details are provided.
Cones |
||||
| Feature Name | Feature Type | Elevation | Latitude | Longitude |
| Coconucos, Los | Cone | 4400 m | 2° 18' 0" N | 76° 23' 0" W |
| Paletera | Cone | |||
| Pan de Azúcar | Stratovolcano | 4600 m | 2° 17' 0" N | 76° 22' 0" W |
Craters |
||||
| Feature Name | Feature Type | Elevation | Latitude | Longitude |
| Buey, Laguna la | Crater | 3250 m | 2° 11' 0" N | 76° 26' 0" W |
Thermal |
||||
| Feature Name | Feature Type | Elevation | Latitude | Longitude |
| Coconuscos-Aguas Herviendo | Thermal | 2900 m | ||
| Coconuscos-Aguas Tibias | Thermal | |||
| Pilimbala | Thermal | 3350 m | ||
|
|
||||||||||||||||||||||||
There is data available for 27 confirmed Holocene eruptive periods.
2023 Nov 16 - 2023 Nov 16 Confirmed Eruption
| Episode 1 | Eruption Episode | ||||
|---|---|---|---|---|
| 2023 Nov 16 - 2023 Nov 16 | Evidence from Observations: Reported | |||
2022 Mar 29 - 2022 Mar 29 Confirmed Eruption Max VEI: 1
| Episode 1 | Eruption Episode | Between Puracé and Curiquinga | |||||||||||||||||||||||||||||
|---|---|---|---|---|---|---|---|---|---|---|---|---|---|---|---|---|---|---|---|---|---|---|---|---|---|---|---|---|---|---|
| 2022 Mar 29 - 2022 Mar 29 | Evidence from Observations: Reported | |||||||||||||||||||||||||||||
| Two cracks approximately 40 m long opened along the Coconucos Volcanic Chain between Puracé and Curiquinga, produced gas-and-steam emissions. Ash was also reported by observers in the area. | ||||||||||||||||||||||||||||||
|
List of 4 Events for Episode 1 at Between Puracé and Curiquinga
| ||||||||||||||||||||||||||||||
1977 Mar 19 - 1977 Mar 28 (?) Confirmed Eruption Max VEI: 2
| Episode 1 | Eruption Episode | ||||||||||||||||||||||||||||||
|---|---|---|---|---|---|---|---|---|---|---|---|---|---|---|---|---|---|---|---|---|---|---|---|---|---|---|---|---|---|---|
| 1977 Mar 19 - 1977 Mar 28 (?) | Evidence from Observations: Reported | |||||||||||||||||||||||||||||
|
List of 4 Events for Episode 1
| ||||||||||||||||||||||||||||||
1957 Jul 2 ± 182 days Confirmed Eruption Max VEI: 2 (?)
| Episode 1 | Eruption Episode | |||||||||||||||
|---|---|---|---|---|---|---|---|---|---|---|---|---|---|---|---|
| 1957 Jul 2 ± 182 days - Unknown | Evidence from Observations: Reported | ||||||||||||||
|
List of 1 Events for Episode 1
| |||||||||||||||
1956 Jul 2 (in or before) ± 182 days Confirmed Eruption Max VEI: 2
| Episode 1 | Eruption Episode | ||||||||||||||||||||
|---|---|---|---|---|---|---|---|---|---|---|---|---|---|---|---|---|---|---|---|---|
| 1956 Jul 2 (in or before) ± 182 days - Unknown | Evidence from Observations: Reported | |||||||||||||||||||
|
List of 2 Events for Episode 1
| ||||||||||||||||||||
1949 May 26 - 1949 Jun 11 Confirmed Eruption Max VEI: 2
| Episode 1 | Eruption Episode | |||||||||||||||||||||||||||||||||||
|---|---|---|---|---|---|---|---|---|---|---|---|---|---|---|---|---|---|---|---|---|---|---|---|---|---|---|---|---|---|---|---|---|---|---|---|
| 1949 May 26 - 1949 Jun 11 | Evidence from Observations: Reported | ||||||||||||||||||||||||||||||||||
|
List of 5 Events for Episode 1
| |||||||||||||||||||||||||||||||||||
1947 Apr 27 Confirmed Eruption Max VEI: 2
| Episode 1 | Eruption Episode | ||||||||||||||||||||||||||||||||||||||||
|---|---|---|---|---|---|---|---|---|---|---|---|---|---|---|---|---|---|---|---|---|---|---|---|---|---|---|---|---|---|---|---|---|---|---|---|---|---|---|---|---|
| 1947 Apr 27 - Unknown | Evidence from Observations: Reported | |||||||||||||||||||||||||||||||||||||||
|
List of 6 Events for Episode 1
| ||||||||||||||||||||||||||||||||||||||||
1946 Mar - 1946 Apr Confirmed Eruption Max VEI: 2
| Episode 1 | Eruption Episode | |||||||||||||||||||||||||
|---|---|---|---|---|---|---|---|---|---|---|---|---|---|---|---|---|---|---|---|---|---|---|---|---|---|
| 1946 Mar - 1946 Apr | Evidence from Observations: Reported | ||||||||||||||||||||||||
|
List of 3 Events for Episode 1
| |||||||||||||||||||||||||
1927 Confirmed Eruption Max VEI: 2
| Episode 1 | Eruption Episode | ||||||||||||||||||||
|---|---|---|---|---|---|---|---|---|---|---|---|---|---|---|---|---|---|---|---|---|
| 1927 - Unknown | Evidence from Observations: Reported | |||||||||||||||||||
|
List of 2 Events for Episode 1
| ||||||||||||||||||||
1926 Aug - 1926 Sep Confirmed Eruption Max VEI: 2
| Episode 1 | Eruption Episode | ||||||||||||||||||||
|---|---|---|---|---|---|---|---|---|---|---|---|---|---|---|---|---|---|---|---|---|
| 1926 Aug - 1926 Sep | Evidence from Observations: Reported | |||||||||||||||||||
|
List of 2 Events for Episode 1
| ||||||||||||||||||||
1925 Oct 12 - 1925 Nov 5 Confirmed Eruption Max VEI: 2
| Episode 1 | Eruption Episode | ||||||||||||||||||||
|---|---|---|---|---|---|---|---|---|---|---|---|---|---|---|---|---|---|---|---|---|
| 1925 Oct 12 - 1925 Nov 5 | Evidence from Observations: Reported | |||||||||||||||||||
|
List of 2 Events for Episode 1
| ||||||||||||||||||||
1924 Confirmed Eruption Max VEI: 2
| Episode 1 | Eruption Episode | ||||||||||||||||||||
|---|---|---|---|---|---|---|---|---|---|---|---|---|---|---|---|---|---|---|---|---|
| 1924 - Unknown | Evidence from Observations: Reported | |||||||||||||||||||
|
List of 2 Events for Episode 1
| ||||||||||||||||||||
1906 Confirmed Eruption Max VEI: 2
| Episode 1 | Eruption Episode | ||||||||||||||||||||
|---|---|---|---|---|---|---|---|---|---|---|---|---|---|---|---|---|---|---|---|---|
| 1906 - Unknown | Evidence from Observations: Reported | |||||||||||||||||||
|
List of 2 Events for Episode 1
| ||||||||||||||||||||
1902 (?) Confirmed Eruption Max VEI: 2
| Episode 1 | Eruption Episode | ||||||||||||||||||||
|---|---|---|---|---|---|---|---|---|---|---|---|---|---|---|---|---|---|---|---|---|
| 1902 (?) - Unknown | Evidence from Observations: Reported | |||||||||||||||||||
|
List of 2 Events for Episode 1
| ||||||||||||||||||||
1899 Confirmed Eruption Max VEI: 2
| Episode 1 | Eruption Episode | ||||||||||||||||||||
|---|---|---|---|---|---|---|---|---|---|---|---|---|---|---|---|---|---|---|---|---|
| 1899 - Unknown | Evidence from Observations: Reported | |||||||||||||||||||
|
List of 2 Events for Episode 1
| ||||||||||||||||||||
1885 May 25 Confirmed Eruption Max VEI: 3
| Episode 1 | Eruption Episode | |||||||||||||||||||||||||||||||||||
|---|---|---|---|---|---|---|---|---|---|---|---|---|---|---|---|---|---|---|---|---|---|---|---|---|---|---|---|---|---|---|---|---|---|---|---|
| 1885 May 25 - Unknown | Evidence from Observations: Reported | ||||||||||||||||||||||||||||||||||
|
List of 5 Events for Episode 1
| |||||||||||||||||||||||||||||||||||
1881 Confirmed Eruption Max VEI: 2
| Episode 1 | Eruption Episode | ||||||||||||||||||||
|---|---|---|---|---|---|---|---|---|---|---|---|---|---|---|---|---|---|---|---|---|
| 1881 - Unknown | Evidence from Observations: Reported | |||||||||||||||||||
|
List of 2 Events for Episode 1
| ||||||||||||||||||||
1878 Aug 31 Confirmed Eruption Max VEI: 2
| Episode 1 | Eruption Episode | ||||||||||||||||||||
|---|---|---|---|---|---|---|---|---|---|---|---|---|---|---|---|---|---|---|---|---|
| 1878 Aug 31 - Unknown | Evidence from Observations: Reported | |||||||||||||||||||
|
List of 2 Events for Episode 1
| ||||||||||||||||||||
1870 Oct Confirmed Eruption Max VEI: 2
| Episode 1 | Eruption Episode | ||||||||||||||||||||
|---|---|---|---|---|---|---|---|---|---|---|---|---|---|---|---|---|---|---|---|---|
| 1870 Oct - Unknown | Evidence from Observations: Reported | |||||||||||||||||||
|
List of 2 Events for Episode 1
| ||||||||||||||||||||
1869 Oct 4 - 1869 Nov Confirmed Eruption Max VEI: 3 (?)
| Episode 1 | Eruption Episode | |||||||||||||||||||||||||||||||||||||||||||||
|---|---|---|---|---|---|---|---|---|---|---|---|---|---|---|---|---|---|---|---|---|---|---|---|---|---|---|---|---|---|---|---|---|---|---|---|---|---|---|---|---|---|---|---|---|---|
| 1869 Oct 4 - 1869 Nov | Evidence from Observations: Reported | ||||||||||||||||||||||||||||||||||||||||||||
|
List of 7 Events for Episode 1
| |||||||||||||||||||||||||||||||||||||||||||||
1860 ± 9 years Confirmed Eruption Max VEI: 2 (?)
| Episode 1 | Eruption Episode | ||||||||||||||||||||
|---|---|---|---|---|---|---|---|---|---|---|---|---|---|---|---|---|---|---|---|---|
| 1860 ± 9 years - Unknown | Evidence from Observations: Reported | |||||||||||||||||||
|
List of 2 Events for Episode 1
| ||||||||||||||||||||
1847 Oct 27 - 1852 Confirmed Eruption Max VEI: 3 (?)
| Episode 1 | Eruption Episode | ||||||||||||||||||||||||||||||||||||||||
|---|---|---|---|---|---|---|---|---|---|---|---|---|---|---|---|---|---|---|---|---|---|---|---|---|---|---|---|---|---|---|---|---|---|---|---|---|---|---|---|---|
| 1847 Oct 27 - 1852 | Evidence from Observations: Reported | |||||||||||||||||||||||||||||||||||||||
|
List of 6 Events for Episode 1
| ||||||||||||||||||||||||||||||||||||||||
1840 Confirmed Eruption Max VEI: 2
| Episode 1 | Eruption Episode | ||||||||||||||||||||
|---|---|---|---|---|---|---|---|---|---|---|---|---|---|---|---|---|---|---|---|---|
| 1840 - Unknown | Evidence from Observations: Reported | |||||||||||||||||||
|
List of 2 Events for Episode 1
| ||||||||||||||||||||
1835 Jan 23 Confirmed Eruption Max VEI: 2
| Episode 1 | Eruption Episode | ||||||||||||||||||||
|---|---|---|---|---|---|---|---|---|---|---|---|---|---|---|---|---|---|---|---|---|
| 1835 Jan 23 - Unknown | Evidence from Observations: Reported | |||||||||||||||||||
|
List of 2 Events for Episode 1
| ||||||||||||||||||||
1827 Nov 18 Confirmed Eruption Max VEI: 2
| Episode 1 | Eruption Episode | ||||||||||||||||||||||||||||||
|---|---|---|---|---|---|---|---|---|---|---|---|---|---|---|---|---|---|---|---|---|---|---|---|---|---|---|---|---|---|---|
| 1827 Nov 18 - Unknown | Evidence from Observations: Reported | |||||||||||||||||||||||||||||
|
List of 4 Events for Episode 1
| ||||||||||||||||||||||||||||||
1816 Confirmed Eruption
| Episode 1 | Eruption Episode | ||||
|---|---|---|---|---|
| 1816 - Unknown | Evidence from Observations: Reported | |||
0160 BCE ± 50 years Confirmed Eruption
| Episode 1 | Eruption Episode | ||||||||||||||||||||||||||||||||||||||||
|---|---|---|---|---|---|---|---|---|---|---|---|---|---|---|---|---|---|---|---|---|---|---|---|---|---|---|---|---|---|---|---|---|---|---|---|---|---|---|---|---|
| 0160 BCE ± 50 years - Unknown | Evidence from Isotopic: 14C (uncalibrated) | |||||||||||||||||||||||||||||||||||||||
|
List of 6 Events for Episode 1
| ||||||||||||||||||||||||||||||||||||||||
There is no Deformation History data available for Puracé.
There is no Emissions History data available for Puracé.
The maps shown below have been scanned from the GVP map archives and include the volcano on this page. Clicking on the small images will load the full 300 dpi map. Very small-scale maps (such as world maps) are not included. The maps database originated over 30 years ago, but was only recently updated and connected to our main database. We welcome users to tell us if they see incorrect information or other problems with the maps; please use the Contact GVP link at the bottom of the page to send us email.
The following 1 samples associated with this volcano can be found in the Smithsonian's NMNH Department of Mineral Sciences collections, and may be availble for research (contact the Rock and Ore Collections Manager). Catalog number links will open a window with more information.
| Catalog Number | Sample Description | Lava Source | Collection Date |
|---|---|---|---|
| NMNH 122119-00 | Sulfur | -- | -- |
| Copernicus Browser | The Copernicus Browser replaced the Sentinel Hub Playground browser in 2023, to provide access to Earth observation archives from the Copernicus Data Space Ecosystem, the main distribution platform for data from the EU Copernicus missions. |
| MIROVA | Middle InfraRed Observation of Volcanic Activity (MIROVA) is a near real time volcanic hot-spot detection system based on the analysis of MODIS (Moderate Resolution Imaging Spectroradiometer) data. In particular, MIROVA uses the Middle InfraRed Radiation (MIR), measured over target volcanoes, in order to detect, locate and measure the heat radiation sourced from volcanic activity. |
| MODVOLC Thermal Alerts | Using infrared satellite Moderate Resolution Imaging Spectroradiometer (MODIS) data, scientists at the Hawai'i Institute of Geophysics and Planetology, University of Hawai'i, developed an automated system called MODVOLC to map thermal hot-spots in near real time. For each MODIS image, the algorithm automatically scans each 1 km pixel within it to check for high-temperature hot-spots. When one is found the date, time, location, and intensity are recorded. MODIS looks at every square km of the Earth every 48 hours, once during the day and once during the night, and the presence of two MODIS sensors in space allows at least four hot-spot observations every two days. Each day updated global maps are compiled to display the locations of all hot spots detected in the previous 24 hours. There is a drop-down list with volcano names which allow users to 'zoom-in' and examine the distribution of hot-spots at a variety of spatial scales. |
|
WOVOdat
Single Volcano View Temporal Evolution of Unrest Side by Side Volcanoes |
WOVOdat is a database of volcanic unrest; instrumentally and visually recorded changes in seismicity, ground deformation, gas emission, and other parameters from their normal baselines. It is sponsored by the World Organization of Volcano Observatories (WOVO) and presently hosted at the Earth Observatory of Singapore.
GVMID Data on Volcano Monitoring Infrastructure The Global Volcano Monitoring Infrastructure Database GVMID, is aimed at documenting and improving capabilities of volcano monitoring from the ground and space. GVMID should provide a snapshot and baseline view of the techniques and instrumentation that are in place at various volcanoes, which can be use by volcano observatories as reference to setup new monitoring system or improving networks at a specific volcano. These data will allow identification of what monitoring gaps exist, which can be then targeted by remote sensing infrastructure and future instrument deployments. |
| Volcanic Hazard Maps | The IAVCEI Commission on Volcanic Hazards and Risk has a Volcanic Hazard Maps database designed to serve as a resource for hazard mappers (or other interested parties) to explore how common issues in hazard map development have been addressed at different volcanoes, in different countries, for different hazards, and for different intended audiences. In addition to the comprehensive, searchable Volcanic Hazard Maps Database, this website contains information about diversity of volcanic hazard maps, illustrated using examples from the database. This site is for educational purposes related to volcanic hazard maps. Hazard maps found on this website should not be used for emergency purposes. For the most recent, official hazard map for a particular volcano, please seek out the proper institutional authorities on the matter. |
| IRIS seismic stations/networks | Incorporated Research Institutions for Seismology (IRIS) Data Services map showing the location of seismic stations from all available networks (permanent or temporary) within a radius of 0.18° (about 20 km at mid-latitudes) from the given location of Puracé. Users can customize a variety of filters and options in the left panel. Note that if there are no stations are known the map will default to show the entire world with a "No data matched request" error notice. |
| UNAVCO GPS/GNSS stations | Geodetic Data Services map from UNAVCO showing the location of GPS/GNSS stations from all available networks (permanent or temporary) within a radius of 20 km from the given location of Puracé. Users can customize the data search based on station or network names, location, and time window. Requires Adobe Flash Player. |
| DECADE Data | The DECADE portal, still in the developmental stage, serves as an example of the proposed interoperability between The Smithsonian Institution's Global Volcanism Program, the Mapping Gas Emissions (MaGa) Database, and the EarthChem Geochemical Portal. The Deep Earth Carbon Degassing (DECADE) initiative seeks to use new and established technologies to determine accurate global fluxes of volcanic CO2 to the atmosphere, but installing CO2 monitoring networks on 20 of the world's 150 most actively degassing volcanoes. The group uses related laboratory-based studies (direct gas sampling and analysis, melt inclusions) to provide new data for direct degassing of deep earth carbon to the atmosphere. |
| Large Eruptions of Puracé | Information about large Quaternary eruptions (VEI >= 4) is cataloged in the Large Magnitude Explosive Volcanic Eruptions (LaMEVE) database of the Volcano Global Risk Identification and Analysis Project (VOGRIPA). |
| EarthChem | EarthChem develops and maintains databases, software, and services that support the preservation, discovery, access and analysis of geochemical data, and facilitate their integration with the broad array of other available earth science parameters. EarthChem is operated by a joint team of disciplinary scientists, data scientists, data managers and information technology developers who are part of the NSF-funded data facility Integrated Earth Data Applications (IEDA). IEDA is a collaborative effort of EarthChem and the Marine Geoscience Data System (MGDS). |


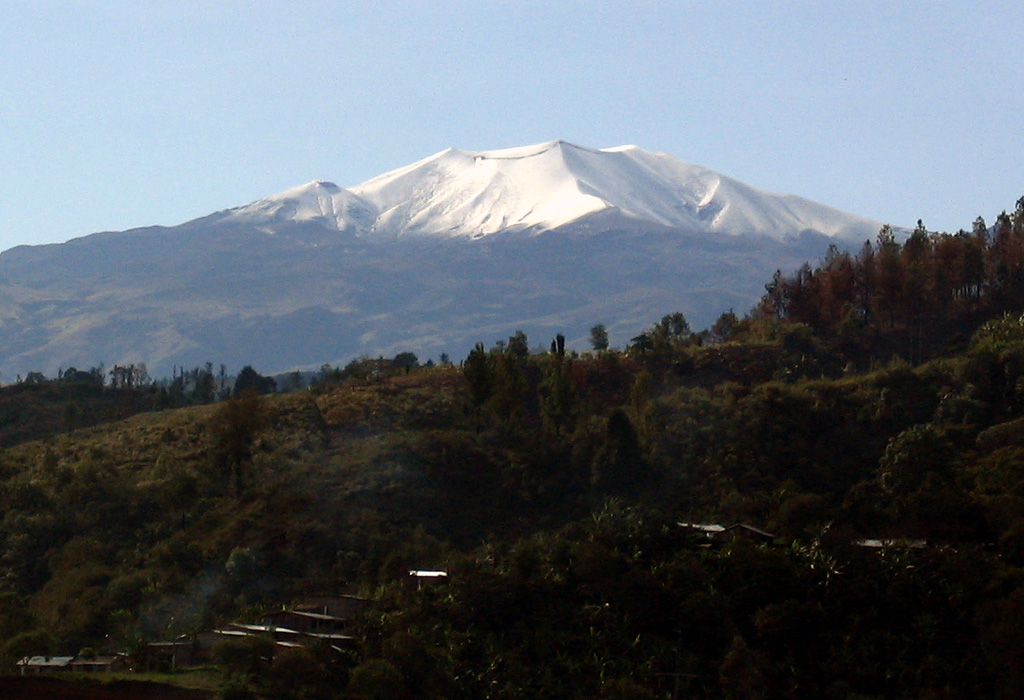
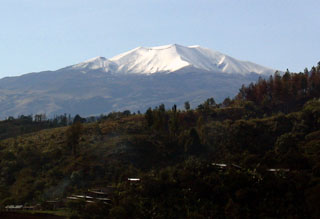 Snow-capped Puracé volcano has a 500-m-wide summit crater and is one of the most active volcanoes in Colombia. Frequent explosive eruptions in the 19th and 20th centuries have modified the morphology of the summit crater, with some of the largest occurring in 1849, 1869, and 1885.