Gas emissions from Michael volcano on Saunders Island were possibly visible in satellite images drifting NE on 24 October. A clear view of the crater on 6 November revealed a thermal anomaly on the crater floor. Weather clouds often obscure views of Michael.
Sources: South Sandwich Islands Volcano Monitoring Blog, Sentinel Hub
Thermal activity continues during February 2022-January 2023
Saunders Island consists of a large central volcanic edifice intersected by two seamount chains in the remote South Sandwich Volcanic Arc in the South Atlantic. The young Mount Michael stratovolcano dominates the glacier-covered island, while two submarine plateaus, Harpers Bank and Saunders Bank, extend north. The symmetrical Michael has a 500-m-wide summit crater. Ash clouds were reported from the summit crater in 1819, and an effusive eruption was inferred to have occurred from a N-flank fissure around the end of the 19th century and beginning of the 20th. The current eruption period began in November 2014 and more recently has been characterized by intermittent thermal anomalies and gas-and-steam emissions (BGVN 47:03). Visits are infrequent because of the remote location, and views are often obscured by cloudy weather. This report covers activity from February 2022 through January 2023 primarily using satellite data.
Activity at the Mount Michael summit crater consisted of intermittent thermal activity during the reporting period. MIROVA (Middle InfraRed Observation of Volcanic Activity) analysis of MODIS satellite data showed a total of 15 low-power thermal anomalies detected near the summit crater (figure 46). One anomaly was recorded in late May, four in early June, two in late July, two in late September, one in early October, two in late November, one in mid-December 2022, and two in January 2023. Some of this thermal activity was also visible in Sentinel-2 infrared satellite imagery at the summit crater (figure 47). A strong gas-and-steam plume drifted NE on 6 February, based on a satellite image. On 24 September and 16 November two hotspots of similar size and intensity were detected at the summit crater. Weak sulfur dioxide emissions were recorded on 6, 11, 26, and 27 February, 2 and 3 March, 5, 6, and 8 October, 16 and 25 November, and 9 December as detected by the TROPOMI instrument on the Sentinel-5P satellite that drifted in different directions (figure 48).
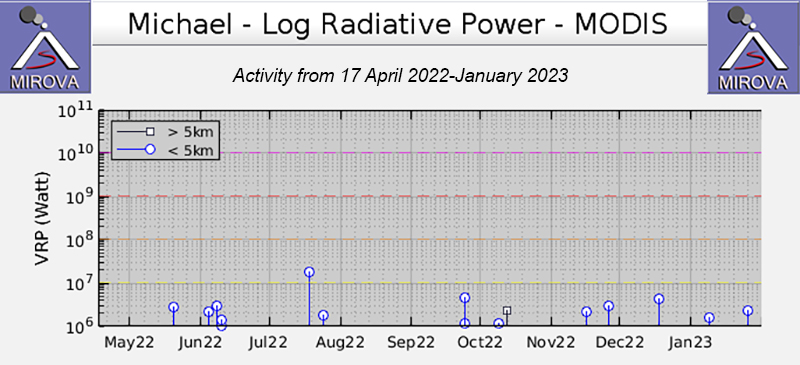 |
Figure 46. A total of 15 thermal anomalies were detected near the Mount Michael summit crater at Saunders during 17 April 2022 through January 2023. One anomaly occurred during late May, four during early June, two during late July, two during late September, one during early October, two during late November, one in mid-December 2022, and two during January 2023. Courtesy of MIROVA. |
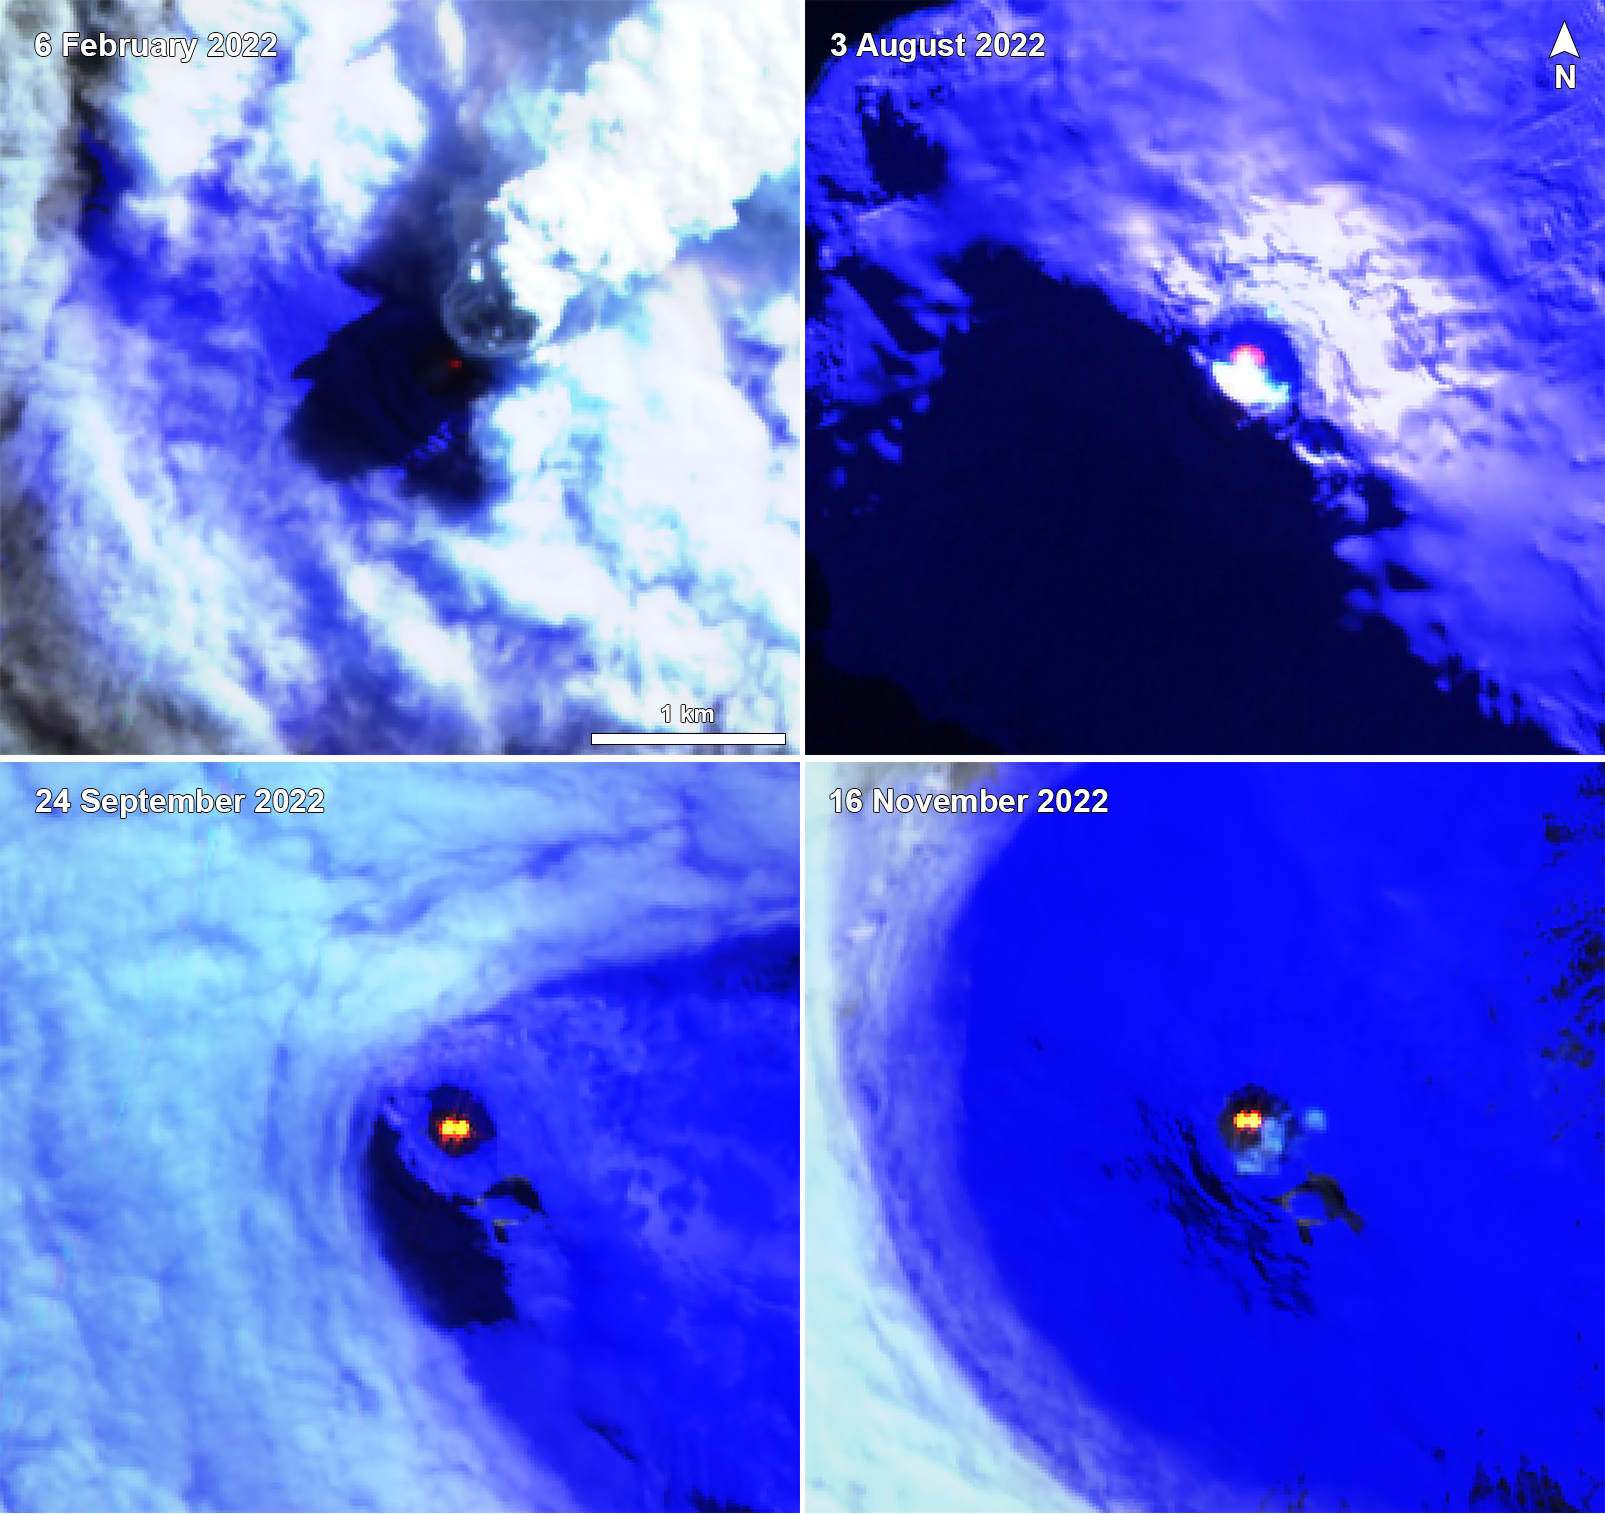 |
Figure 47. Sentinel-2 infrared satellite images showed an intermittent thermal anomaly (bright yellow-orange) within the Mount Michael summit crater at Saunders on 6 February 2022 (top left), 3 August 2022 (top right), 24 September 2022 (bottom left), and 16 November 2022 (bottom right). Strong gas-and-steam plumes were visible on 6 February. Two visible hotspots of similar size and brightness were visible in the images taken on 24 September and 16 November. Images use “Atmospheric penetration” rendering (bands 12, 11, 8a) rendering. Courtesy of Sentinel Hub Playground. |
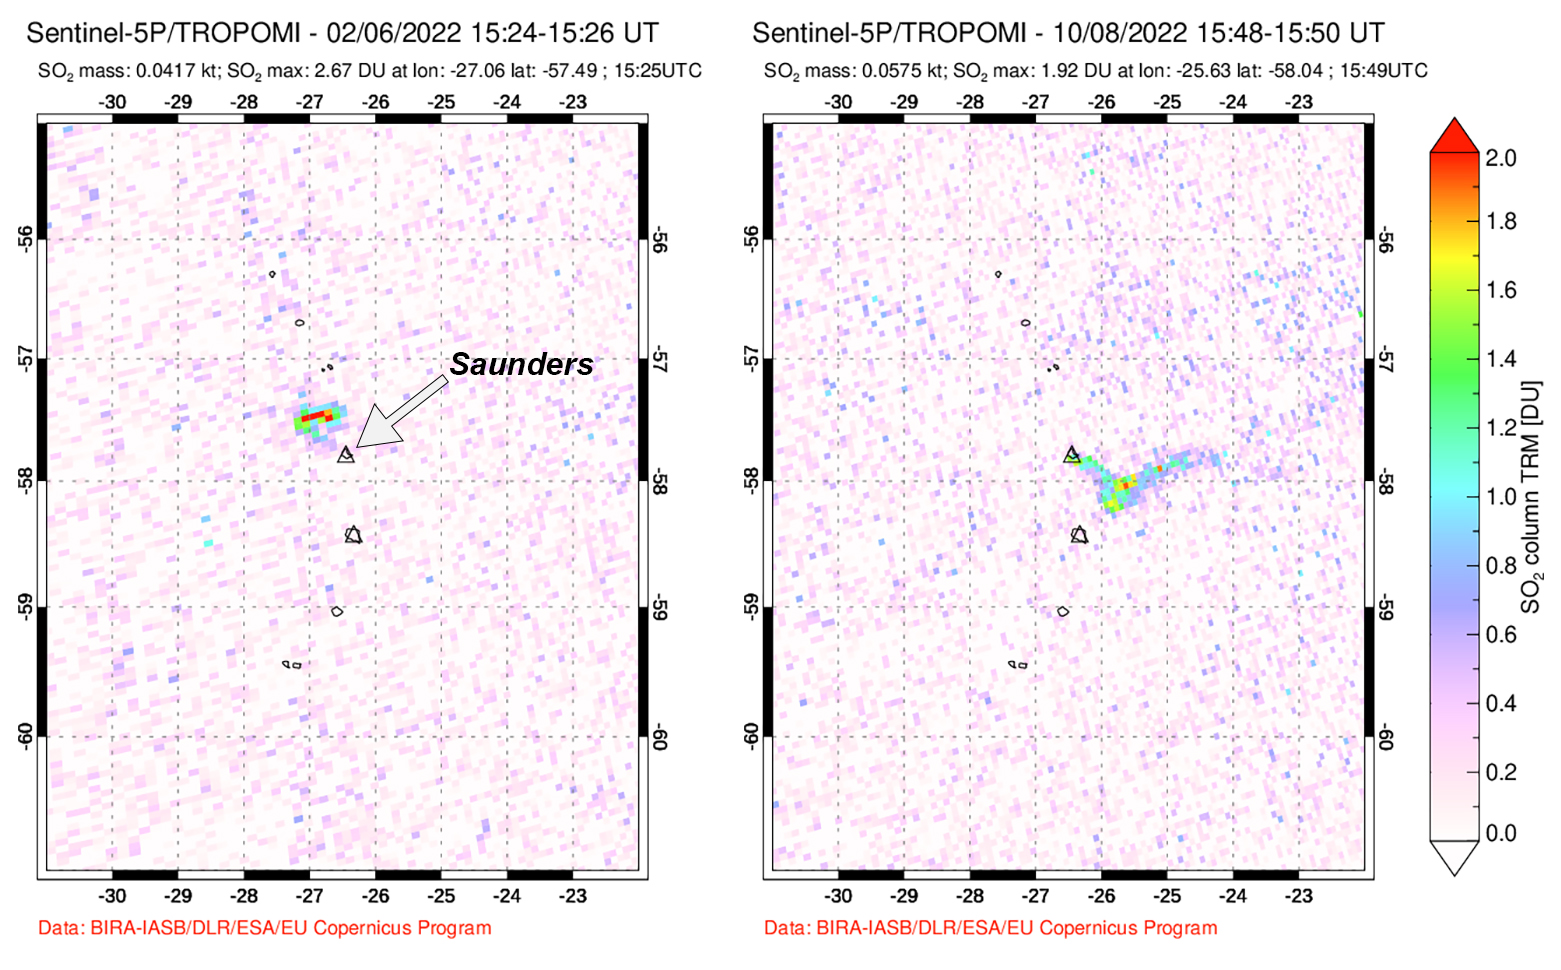 |
Figure 48. Small sulfur dioxide plumes rising from Saunders were detected by the TROPOMI instrument on the Sentinel-5P satellite on 6 February 2022 (left) and 8 October 2022 (right) that drifted NW and SE, respectively. Courtesy of NASA Global Sulfur Dioxide Monitoring Page. |
Information Contacts: MIROVA (Middle InfraRed Observation of Volcanic Activity), a collaborative project between the Universities of Turin and Florence (Italy) supported by the Centre for Volcanic Risk of the Italian Civil Protection Department (URL: http://www.mirovaweb.it/); NASA Global Sulfur Dioxide Monitoring Page, Atmospheric Chemistry and Dynamics Laboratory, NASA Goddard Space Flight Center (NASA/GSFC), 8800 Greenbelt Road, Goddard MD 20771, USA (URL: https://so2.gsfc.nasa.gov/); Sentinel Hub Playground (URL: https://www.sentinel-hub.com/explore/sentinel-playground).
2020: November
2019: December
2018: July
2015: September
2005: October
Gas emissions from Michael volcano on Saunders Island were possibly visible in satellite images drifting NE on 24 October. A clear view of the crater on 6 November revealed a thermal anomaly on the crater floor. Weather clouds often obscure views of Michael.
Sources: South Sandwich Islands Volcano Monitoring Blog; Sentinel Hub
Three distinct thermal anomalies in the summit crater of Michael on Saunders Island were identified in a satellite image acquired on 24 December. Satellite images from 29 November and 2 December showed similar anomalies.
Sources: South Sandwich Islands Volcano Monitoring Blog; Sentinel Hub
Satellite data acquired during 1 January-9 July periodically (a few times a month) showed volcanic plumes originating from Michael on Saunders Island. A thermal anomaly was last detected on 3 April 2018.
Sources: René Goad; Santiago Gassó, National Aeronautics and Space Administration Goddard Space Flight Center
The MODVOLC thermal alert system detected thermal anomalies over Michael’s summit crater during 30 September-7 October (GMT time, local -2).
Source: Hawai'i Institute of Geophysics and Planetology (HIGP) Thermal Alerts Team
The first MODVOLC alerts at Mount Michael since May 2003 recently began, indicating an increased level of activity in the island's summit crater (and presumed lava lake). The alerts occurred on 3, 5, and 6 October.
Sources: Hawai'i Institute of Geophysics and Planetology (HIGP) Thermal Alerts Team; British Antarctic Survey
Reports are organized chronologically and indexed below by Month/Year (Publication Volume:Number), and include a one-line summary. Click on the index link or scroll down to read the reports.
Lava lake detected in satellite imagery during 1995-2002
Although previous eruptions have been recorded in the South Sandwich Islands (Coombs and Landis, 1966), ongoing volcanic activity has only recently been detected and studied. These islands (figure 1) are all volcanic in origin, but sufficiently distant from population centers and shipping lanes that eruptions, if and when they do occur, currently go unnoticed. Visual observations of the islands probably do not occur on more than a few days each year (LeMasurier and Thomson, 1990). Satellite data have recently provided observations of volcanic activity in the group, and offer the only practical means to regularly characterize activity in these islands.
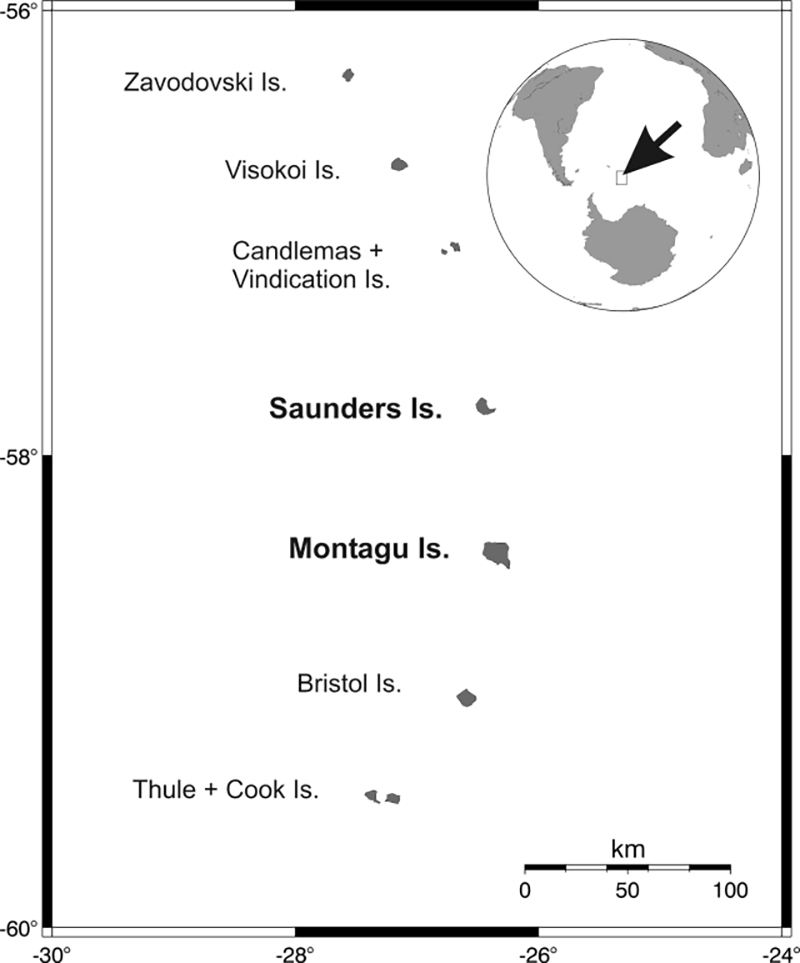 |
Figure 1. The South Sandwich Island archipelago, located in the Scotia Sea. The South Sandwich Trench lies approximately 100 km E, paralleling the trend of the islands, where the South American Plate subducts westward beneath the Scotia Plate. Courtesy Hawaii Institute of Geophysics and Planetology and British Antarctic Survey. |
Using Advanced Very High Resolution Radiometer (AVHRR) data, Lachlan-Cope and others (2001) discovered and analyzed an active lava lake on the summit of Saunders Island (figure 2) that was continuously present for intervals of several months between March 1995 and February 1998; plumes originating from the island were observed on 77 images during April 1995-February 1998. J.L. Smellie noted that during helicopter overflights on 23 January 1997 (Lachlan-Cope and others, 2001) "dense and abundant white steam was emitted from the crater in large conspicuous puffs at intervals of a few seconds alternating with episodes of less voluminous, more transparent vapour." Smellie also observed that the plume commonly extended ~8-10 km downwind.
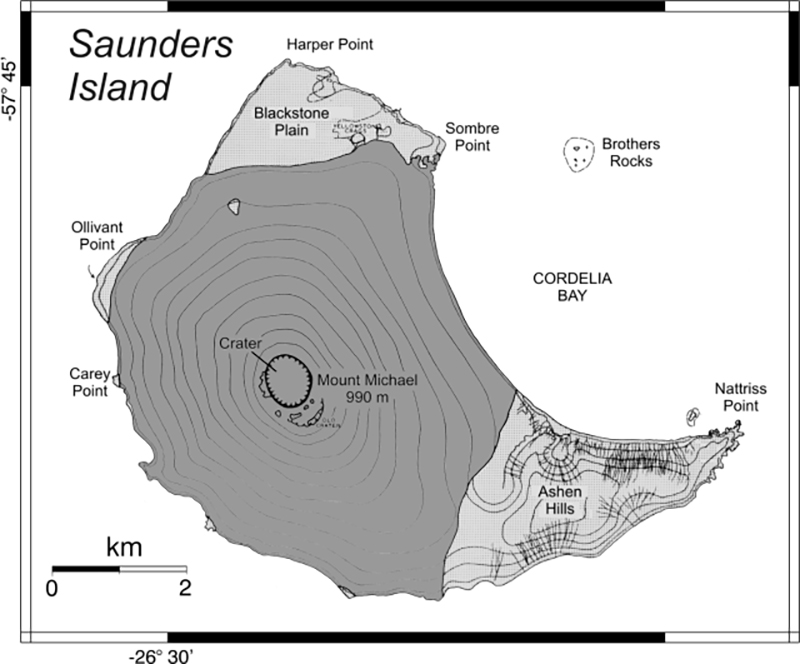 |
Figure 2. Map of Saunders Island, adapted from Holdgate and Baker (1979). Lighter shaded stippled areas show rock outcrop, the remainder is snow or ice covered. Relief is shown by form lines that should not be interpreted as fixed-interval contours. Courtesy Hawaii Institute of Geophysics and Planetology and British Antarctic Survey. |
The MODIS Thermal Alert system also detected repeated thermal anomalies throughout 2000-2002 in the summit area (figure 3), indicating that activity at the lava lake has continued. Anomalous pixels (1 km pixel size) were detected intermittently and were all 1-2 pixels in size, consistent with the relatively small confines of the crater. The timing of anomalous images in this study likely has more to do with the viewing limitations imposed by weather (persistent cloud cover masks any emitted surface radiance in the majority of images) than it has to do with fluctuations in activity levels, so this plot of radiance (figure 4) should not be used as a proxy for lava lake vigor.
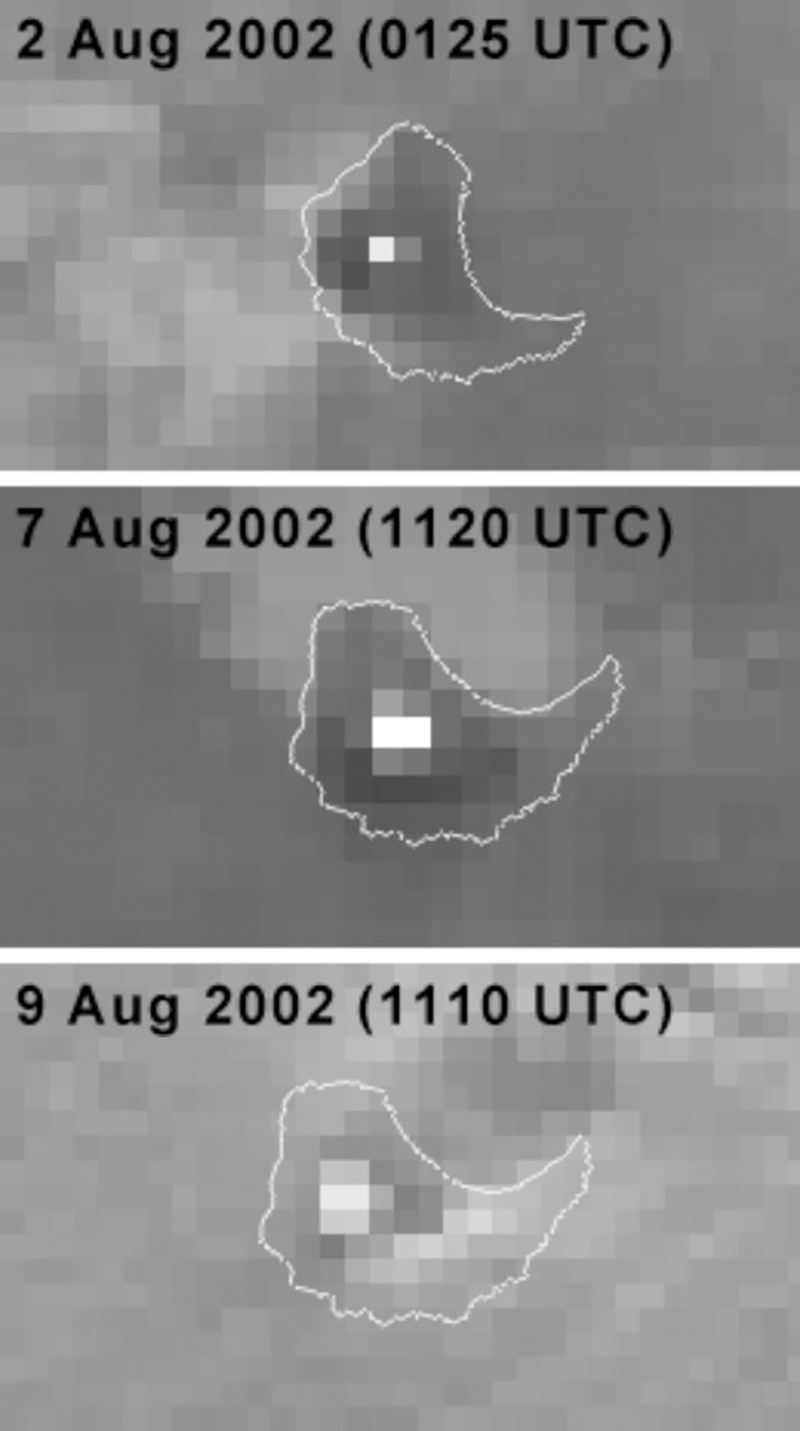 |
Figure 3. Selected MODIS images showing thermal anomalies on Saunders Island. Band 20 (3.7 µm) is shown here. Anomalous pixels on Saunders Island correspond to the lava lake in the summit crater of Mt. Michael volcano. Images are not georeferenced for purposes of radiance integrity, therefore coastlines are approximate. Courtesy Hawaii Institute of Geophysics and Planetology and British Antarctic Survey. |
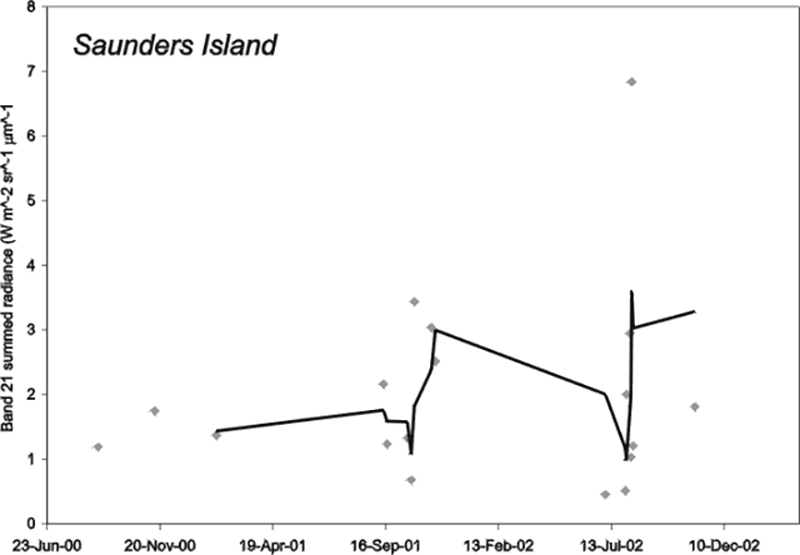 |
Figure 4. Summed radiance of anomalous pixels in each image. Band 21 (3.9 µm) was used for these plots. Points show the result for each image, and the line is a three point running mean of values. Courtesy Hawaii Institute of Geophysics and Planetology and British Antarctic Survey. |
References. Coombs, D.S., and Landis, C.A., 1966, Pumice from the South Sandwich eruption of March 1962 reaches New Zealand: Nature, v. 209, p. 289-290.
Holdgate, M.W., and Baker, P.E., 1979, The South Sandwich Islands, I, General description: British Antarctic Survey Science Report, v. 91, 76 p.
Lachlan-Cope, T., Smellie, J.L., and Ladkin, R., 2001, Discovery of a recurrent lava lake on Saunders Island (South Sandwich Islands) using AVHRR imagery: Journal of Volcanology and Geothermal Research, v. 112, p. 105-116.
LeMasurier, W.E., and Thomson, J.W. (eds), 1990, Volcanoes of the Antarctic Plate and Southern Oceans: American Geophysical Union, Washington, D.C., AGU Monograph, Antarctic Research Series, v. 48.
Wright, R., Flynn, L.P., Garbeil, H., Harris, A.J.L., and Pilger, E, 2002, Automated volcanic eruption detection using MODIS: Remote Sensing of Environment, v. 82, p. 135-155.
Information Contacts: Matt Patrick, Luke Flynn, Harold Garbeil, Andy Harris, Eric Pilger, Glyn Williams-Jones, and Rob Wright, HIGP Thermal Alerts Team, Hawai'i Institute of Geophysics and Planetology (HIGP) / School of Ocean and Earth Science and Technology (SOEST), University of Hawai'i, 2525 Correa Road, Honolulu, HI 96822, USA (URL: http://modis.higp.hawaii.edu/); John Smellie, British Antarctic Survey, Natural Environment Research Council, High Cross, Madingly Road, Cambridge CB3 0ET, United Kingdom (URL: https://www.bas.ac.uk/).
A MODIS thermal alert on 7 May 2003 (no secondary confirmation)
The only previous report on the remote Michael volcano was in BGVN 28:02, which commented on a lava lake detected by satellite imagery over the period 1995-2002. A review of MODIS data for the period from that report (end 2002) to 16 March 2004 (UTC) reveals one thermal alert, on 7 May 2003 (UTC). No corroborative report is available, although previous alerts were interpreted as possibly representing lava lake activity.
Information Contacts: Rob Wright, Luke Flynn, and Eric Pilger; MODIS Thermal Alert System, Hawaii Institute of Geophysics and Planetology (HIGP), School of Ocean and Earth Science and Technology, University of Hawaii at Manoa (URL: http://modis.higp.hawaii.edu/).
Lack of new thermal signals suggesting any eruption since October 2005
The last reported activity of Mount Michael was noted in the SI/USGS Weekly Report of 12-18 October 2005. At that time the first MODVOLC alerts for the volcano since May 2003 indicated an increased level of activity in the island's summit crater and a presumed semi-permanent lava lake that appeared confined to the summit crater. Those alerts occurred on 3, 5, and 6 October 2005. Since that time there has been no additional information concerning Mount Michael and presumably little to no activity.
Information Contacts: Matt Patrick, Luke Flynn, Harold Garbeil, Andy Harris, Eric Pilger, Glyn Williams-Jones, and Rob Wright, HIGP Thermal Alerts Team, Hawai'i Institute of Geophysics and Planetology (HIGP) / School of Ocean and Earth Science and Technology (SOEST), University of Hawai'i, 2525 Correa Road, Honolulu, HI 96822, USA (URL: http://modis.higp.hawaii.edu/); John Smellie, British Antarctic Survey, Natural Environment Research Council, High Cross, Madingly Road, Cambridge CB3 0ET, United Kingdom (URL: https://www.bas.ac.uk/).
Clear IR satellite view on 28 October 2006 suggests lava inside the crater
Matt Patrick sent a new Advanced Spaceborne Thermal Emission and Reflection Radiometer (ASTER) image, collected 28 October 2006 over Saunders Island . In his opinion this is the best image collected to date owing to the lack of a plume obscuring the summit crater, which was a problem in all previous images. The improved image provides a clear view of the crater (figures 5 and 6).
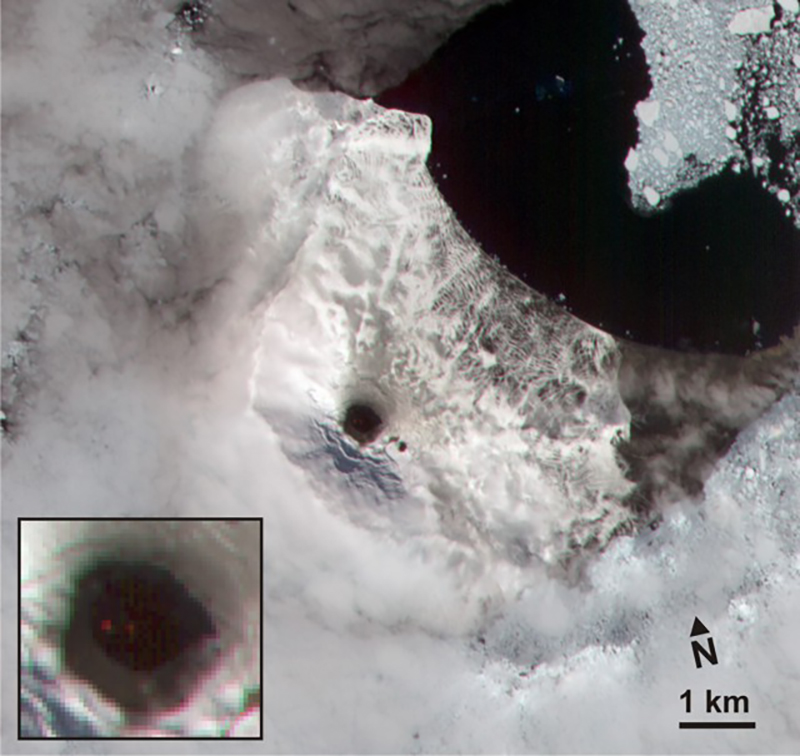 |
Figure 5. An ASTER image of Mt. Michael created using energy in the visible near-infrared wavelength ("VNIR"; bands 3-2-1, RGB), with the inset showing a closer view of the summit crater. There are two small near-IR anomalies (band 3, 0.807 microns wavelength) in the otherwise dark center of the crater, shown as red spots in the colored image. The two anomalies suggest very high temperatures and support the idea that fresh lava may reside at the surface or a shallow level in the crater. Courtesy of Matt Patrick. |
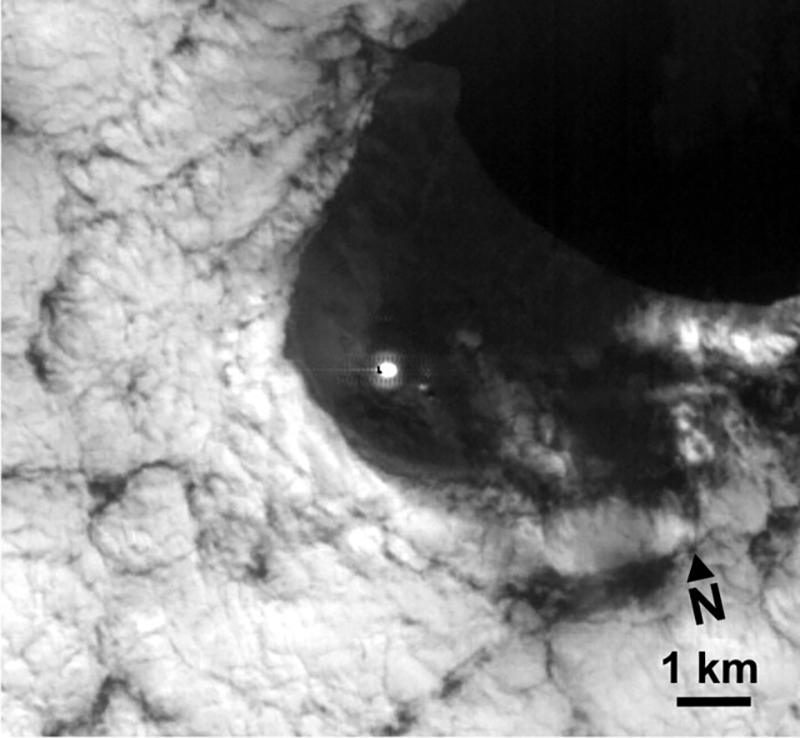 |
Figure 6. The ASTER Short Wave Infrared (SWIR; band 9, 2.4 microns) image with a conspicuous anomaly at the summit, with numerous saturated pixels. Courtesy of Matt Patrick. |
Analyzing the VNIR, SWIR, and Thermal Infrared (TIR) (not shown in figures 5 or 6) images together shows that the outer crater is 500-600 m wide, with a 180m high-temperature crater interior. The latter shows up as an SWIR anomaly and may indicate the rough extent of active lava flow being ~ 180 m wide. Matt Patrick chose Villarrica volcano in Chile for comparison to Mt. Michael (figure 7) since it presents a potentially good analogue in terms of morphology and activity style. Maximum radiant heat flux values were similar (up to ~ 150 MW), suggesting that the maximum intensity of activity may be similar. Mt. Michael shows a much lower frequency of thermal alerts, which may be the result of more frequent cloud cover in the South Sandwich Islands or a greater depth to molten lava in the Mt. Michael crater.
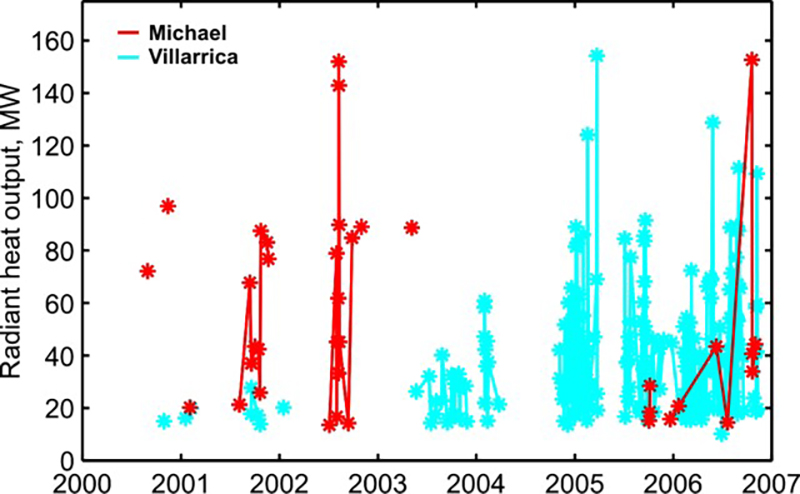 |
Figure 7. The real-time satellite thermal monitoring (MODVOLC) radiant heat flux values for Michael and Villarrica volcanoes during the period 2000-11 November 2006. Courtesy of Matt Patrick. |
Table 1 shows a summary of thermal anomalies and possible eruptions from Moderate Resolution Imagine Spectroradiometer (MODIS) satellites since November 2005. The last reported activity of Mount Michael was noted in the SI/USGS (Smithsonian Institution/U.S. Geological Survey) Weekly Volcanic Activity Report of 12-18 October 2005 (see BGVN 31:04). At that time the first MODVOLC alerts for the volcano since May 2003 indicated an increased level of activity in the island's summit crater and a presumed semi-permanent lava lake that appeared confined to the summit crater. Those alerts occurred on 3, 5, and 6 October 2005.
Table 1. Thermal anomalies measured by MODIS satellites for Mount Michael for the period 3 October 2005 to 1 November 2006. All of the anomalies appeared on the SW side of the volcano. Courtesy of Hawai'i Institute of Geophysics and Planetology (HIGP) Thermal Alerts Team.
| Date | Time (UTC) | Number of pixels | Satellite |
| 01 Nov 2006 | 0125 | 1 | Terra |
| 31 Oct 2006 | 1600 | 1 | Aqua |
| 21 Oct 2006 | 1120 | 1 | Terra |
| 20 Oct 2006 | 0250 | 2 | Aqua |
| 20 Oct 2006 | 0100 | 3 | Terra |
| 21 Jul 2006 | 0120 | 1 | Terra |
| 09 Jun 2006 | 0920 | 2 | Aqua |
| 21 Jan 2006 | 0100 | 1 | Terra |
| 20 Dec 2005 | 0100 | 1 | Terra |
| 06 Oct 2005 | 0115 | 1 | Terra |
| 05 Oct 2005 | 0220 | 1 | Aqua |
| 03 Oct 2005 | 0045 | 1 | Terra |
References. Lachlan-Cope, T., Smellie, J.L., and Ladkin, R., 2001, Discovery of a recurrent lava lake on Saunders island (South Sandwich Islands) using AVHRR imagery: Journal of Volcanology and Geothermal Research, vol. 112, no. 1-4, p. 105-116 (authors are members of the British Antarctic Survey).
LeMasurier, W.E., and Thomson, J.W. (eds), 1990, Volcanoes of the Antarctic Plate and Southern Oceans: American Geophysical Union, Washington, D.C., AGU Monograph, Antarctic Research Series, v. 48.
Information Contacts: Matt Patrick, Michigan Technological University, Houghton, MI; Thermal Alerts Team, Hawai'i Institute of Geophysics and Planetology (HIGP), School of Ocean and Earth Science and Technology (SOEST), University of Hawai'i, 2525 Correa Road, Honolulu, HI 96822, USA (URL: http://modis.higp.hawaii.edu/); John Smellie, British Antarctic Survey, Natural Environment Research Council, High Cross, Madingly Road, Cambridge CB3 0ET, United Kingdom (URL: https://www.bas.ac.uk/); ASTER Science Project Teams, United States and Japan (URL: https://asterweb.jpl.nasa.gov/).
No thermal anomalies detected since December 2006
The frigid, remote, and uninhabited region of Michael volcano is seldom visited. Thermal anomalies detected by satellite-based MODIS instruments, processed using the MODVOLC algorithm by the Thermal Alerts System of the Hawai'i Institute of Geophysics and Planetology, provide some data about possible eruptive activity (BGVN 28:02, 29:03, 31:04, and 31:10). During 3-6 October 2005 there were three days with thermal anomalies (BGVN 31:04). MODIS data indicates that anomalous pixels were also detected on 19 December 2005 (20 December UTC) and on 20 January 2006 (21 January UTC) (BGVN 31:10). The most recently reported MODIS thermal anomalies indicated activity during 19-21 October 2006 (20-21 October UTC) and again on 31 October-1 November 2006 (BGVN 31:10). The source of these anomalies was an inferred lava lake in a central vent as shown on an Advanced Spaceborne Thermal Emission and Reflection Radiometer (ASTER) image collected 28 October 2006 (BGVN 31:10). Additional anomalies occurred on 13 November and 6 December 2006 (7 December UTC). No anomalies were measured after that date through May 2008. Since August 2000 there have been six periods when thermal anomalies were detected in satellite imagery (table 2).
Table 2. Eruptive periods at Michael as inferred from MODIS thermal data from January 2000 through May 2008. Courtesy of the Hawai'i Institute of Geophysics and Planetology Thermal Alerts System.
| Date (UTC) | Thermal pixel data | Bulletin reference |
| 30 Aug 2000-03 Feb 2001 | 3 days with pixels | BGVN 28:02 |
| 05 Aug 2001-21 Nov 2001 | 10 days with pixels | BGVN 28:02 |
| 05 Jul 2002-01 Nov 2002 | 12 days with pixels | BGVN 28:02 |
| 07 May 2003 | 2 anomalous pixels | BGVN 29:03 |
| 03 Oct 2005-21 Jan 2006 | 5 days with pixels, three during 3-6 Oct | BGVN 31:04, 31:10 |
| 09 Jun 2006-07 Dec 2006 | 9 days with pixels | BGVN 31:10, 33:04 |
Information Contacts: Hawai'i Institute of Geophysics and Planetology (HIGP) Thermal Alerts System, School of Ocean and Earth Science and Technology (SOEST), Univ. of Hawai'i, 2525 Correa Road, Honolulu, HI 96822, USA (URL: http://modis.higp.hawaii.edu/).
Eruption from ‘new’ vent
Matthew Patrick (USGS-HVO) notified Bulletin editors that in late 2012 images from thermal sensing satellites showed a 'new' active vent on Mount Michael on Saunders Island in the South Sandwich Islands (see location map, figure 1 in BGVN 28:02). This prompted scrutiny of the same vent in earlier images. Patrick noted that, although the vent was first identified in the 2012 images, it also appeared as activity in satellite images starting in 2006. The South Sandwich Islands are generally devoid of vegetation and habitants, and are largely ice-bound. Thus, satellite thermal alerts are strong evidence of volcanism.
Patrick shared with us the following information from a paper by Patrick and Smellie (2013) about the vent, labeled as Old Crater (SE and outside of main crater, see figure 2 in BGVN 28:02). ASTER [Advance Spaceborne Thermal Emission and Reflection Radiometer] imagery provided "new information on the small subordinate crater, marked as 'Old Crater' by Holdgate and Baker (1979), presumably because it was inactive at the time of their observations." An ASTER image on 28 October 2006 showed an apparent SWIR [short-wave infrared] anomaly at Old Crater. The crater itself appeared to be snow-free and was approximately 150 m in diameter. An ASTER image from 5 January 2008, showed a steam plume coming from this vent, which appeared to be about 190 m wide, as well as a TIR [thermal infrared] anomaly. A very high resolution image from November 2009 available on Google Earth showed a small steam plume emanating from the crater, which is about 190 m wide (figure 8). An ASTER image from 17 November 2010, showed apparently recent eruptive activity in Old Crater, evidenced by tephra fallout emanating from the crater and a small TIR anomaly (at the time there was also a TIR anomaly in the main crater). According to Patrick and Smellie, the plume, tephra fall, SWIR anomalies, and crater enlargement (from 150 to 190 m) indicated that this vent had reactivated by late 2006.
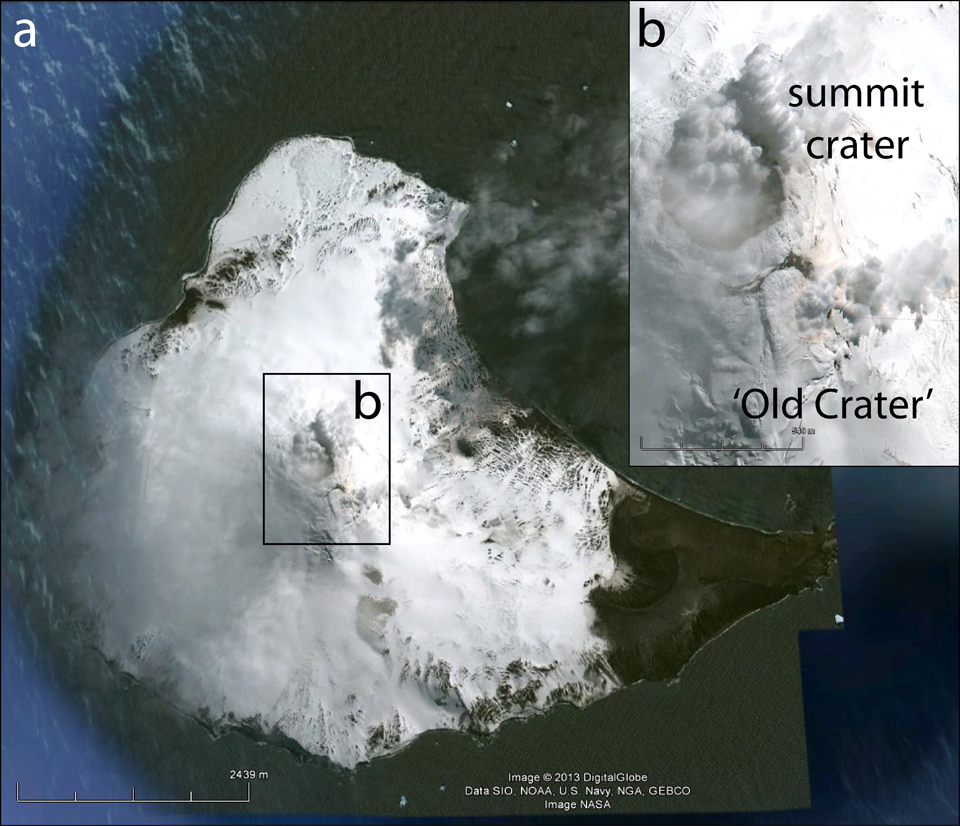 |
Figure 8. Annotated Google Earth imagery of Michael volcano (Saunders Island) acquired on 19 November 2009. (a) Saunders Island is mostly glacier covered, and steam plumes rose from the summit area. The scale bar indicates a distance of ~2.4 km. (b) A close up of the summit area that clearly shows steam plumes emanating from both the summit crater as well as the snow-filled 'Old Crater' (as termed by Holdgate and Baker, 1979). The scale bar indicates a distance of ~0.5 km. Courtesy of Google Earth. |
MODVOLC satellite thermal alerts measured from the volcano since our last Bulletin report (BGVN 33:04, activity through May 2008) and to 4 April 2013 are shown in Table 3. A solitary alert appeared 25 October 2008, followed by a four year period of apparent inactivity. Then, another solitary alert was measured in late June 2012, followed by alerts for two days in October 2012 and two days in November 2012. Patrick noted that occasional and sporadic alerts are very typical for Michael.
Table 3. Satellite thermal alerts measured by MODVOLC over Michael from 2008-February 2013. Pixel sizes generally range from 1-1.5 km2. Note that previous satellite thermal alerts for Michael were listed in BGVN 31:10 (October 2005-November 2006) and 33:04 (August 2000-May 2008). Courtesy of MODVOLC.
| Date | Time (UTC) | Number of pixels | Satellite |
| 25 Oct 2008 | 0100 | 1 | Terra |
| 30 Jun 2012 | 0100 | 1 | Terra |
| 02 Oct 2012 | 0110 | 1 | Terra |
| 28 Oct 2012 | 0200 | 2 | Aqua |
| 28 Oct 2012 | 1125 | 2 | Terra |
| 14 Nov 2012 | 0055 | 3 | Terra |
| 22 Nov 2012 | 1120 | 2 | Terra |
References. Patrick, M.R., and Smellie, J.L., 2013, A spaceborne inventory of volcanic activity in Antarctica and southern oceans, 2000-2010, Antarctic Science, v. 25, no. 4, p. 475-500.
Holdgate, M.W., and Baker, P.E., 1979. The South Sandwich Islands: I. General description, British Antarctic Survey Scientific Reports, No. 91, pp. 1-76.
Information Contacts: Matthew Patrick, Hawaiian Volcano Observatory (HVO), U.S. Geological Survey, PO Box 51, Hawai'i National Park, HI 96718, USA (URL: https://volcanoes.usgs.gov/observatories/hvo/); MODVOLC, Hawai'i Institute of Geophysics and Planetology (HIGP) Thermal Alerts System, School of Ocean and Earth Science and Technology (SOEST), Univ. of Hawai'i, 2525 Correa Road, Honolulu, HI 96822, USA (URL: http://modis.higp.hawaii.edu/).
Thermal anomalies during August-October 2015
The Michael stratovolcano forms the emergent small, unpopulated, mostly ice-covered Saunders Island, part of the South Sandwich Islands. The volcano is primarily monitored using satellite imagery. Prior to August 2015, the most recent eruptive activity detected was in the second half of 2012 (BGVN 38:02).
Infrared MODIS satellite data processed by MODVOLC showed thermal alerts at the summit of Michael during 28 August to 8 October 2015 (figure 9, table 4). MODIS data presented on the MIROVA site shows increased radiative power (measured from satellite thermal data) from late August through October 2015, with a very strong maximum near the end of August (figure 10); lower-power gradually decreasing detections during late November 2015-January 2016 may represent a cooling lava flow. It should be noted that cloud cover over a volcano may prevent the measurement of infrared data.
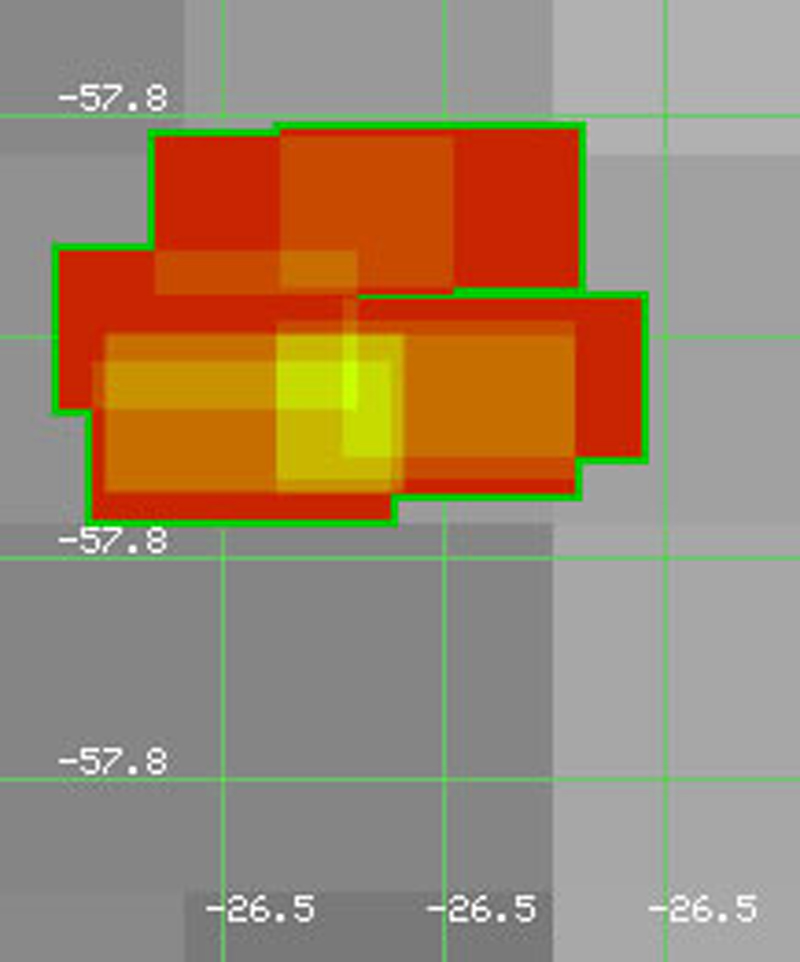 |
Figure 9. MODVOLC map of measured thermal alerts (each colored rectangle represents a pixel) during 28 August through 8 October 2015. Courtesy of MODVOLC. |
Table 4. Satellite thermal alerts measured by MODVOLC over Michael during August-October 2015. Pixel sizes generally range from 1-1.5 km2. Courtesy of MODVOLC.
| Date | Time (UTC) | Number of pixels | Satellite |
| 28 Aug 2015 | 0050 | 1 | Terra |
| 28 Aug 2015 | 0235 | 1 | Aqua |
| 30 Aug 2015 | 0225 | 1 | Aqua |
| 31 Aug 2015 | 0120 | 1 | Terra |
| 30 Sep 2015 | 0130 | 1 | Terra |
| 02 Oct 2015 | 0120 | 2 | Terra |
| 06 Oct 2015 | 1610 | 1 | Aqua |
| 08 Oct 2015 | 1660 | 1 | Aqua |
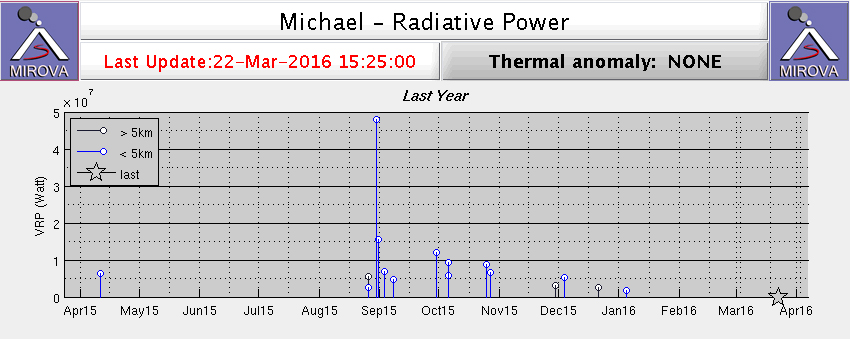 |
Figure 10. MIROVA graph showing radiative power measured by satellite over Michael during April 2015 to April 2016, with a strong maximum on the last day of August 2015. Courtesy of MIROVA. |
Information Contacts: MIROVA, a collaborative project between the Universities of Turin and Florence (Italy) supported by the Centre for Volcanic Risk of the Italian Civil Protection Department (URL: http://www.mirovaweb.it/); Hawai'i Institute of Geophysics and Planetology (HIGP), MODVOLC Thermal Alerts System, School of Ocean and Earth Science and Technology (SOEST), Univ. of Hawai'i, 2525 Correa Road, Honolulu, HI 96822, USA (URL: http://modis.higp.hawaii.edu/)
Intermittent thermal pulses and satellite imagery hotspots during September 2016-September 2018
Historical observations of eruptive activity on ice-covered Mount Michael stratovolcano on Saunders Island in the South Sandwich Islands were not recorded until the early 19th century at this remote site in the southernmost Atlantic Ocean. With the advent of satellite observation technology, indications of more frequent eruptive activity have become apparent. The last confirmed eruption evidenced by MODVOLC thermal alerts was during August-October 2015 (BGVN 41:02). Limited thermal anomaly data and satellite imagery since then have indicated intermittent activity through September 2018. Information for this report comes from MODVOLC and MIROVA thermal anomaly data and Sentinel-2, Landsat, and NASA Terra satellite imagery.
Evidence for thermal activity at Mount Michael tapered off in MIROVA data from October 2015 through January 2016. MODVOLC thermal alerts reappeared on 28 September 2016 and recurred intermittently through 6 January 2017. Low-level MIROVA thermal signals appeared in June and September-November 2017. During January-September 2018, evidence for some type of thermal or eruptive activity was recorded from either MODVOLC, MIROVA, or satellite imagery each month except for May and June.
Although MODVOLC thermal alerts at Mount Michael ended on 8 October 2015, the MIROVA radiative power data showed intermittent pulses of decreasing energy into early January 2016 (figure 10, BGVN 41:02). At a high-latitude, frequently cloud-covered site such as Saunders Island, this could be indicative of continued eruptive activity. A white plume in low resolution NASA's Terra satellite data was spotted drifting away from Saunders in April 2016, but no thermal activity was reported. The only high-confidence data available from April 2016 through May 2017 is from the MODVOLC thermal alert system, which recorded two thermal alerts on 28 September 2016, one the next day, one on 30 October, and eight alerts on four days in November. Activity continued into January 2017 with one alert on 17 December 2016, and six alerts on 2 and 6 January 2017 (figure 11).
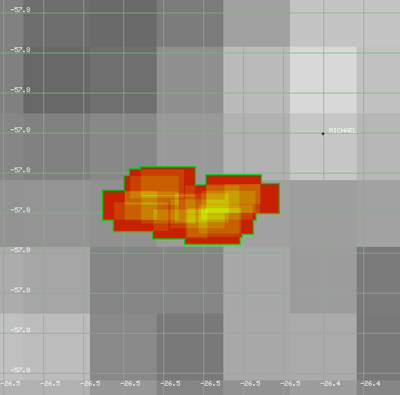 |
Figure 11. Seventeen MODVOLC thermal alerts between 28 September 2016 and 6 January 2017 were the best evidence available for eruptive activity on Saunders Island from April 2016 through May 2017. Courtesy of MODVOLC. |
A low-level log radiative power MIROVA signal appeared in early June 2017; two more signals appeared in September 2017, one in early October and one in late November (figure 12). Additional signals plotted as more than 5 km from the source may or may not reflect activity from the volcano. Steam plumes were visible in NASA Terra satellite images drifting away from the island in August, October, and December 2017, but no thermal signatures were captured.
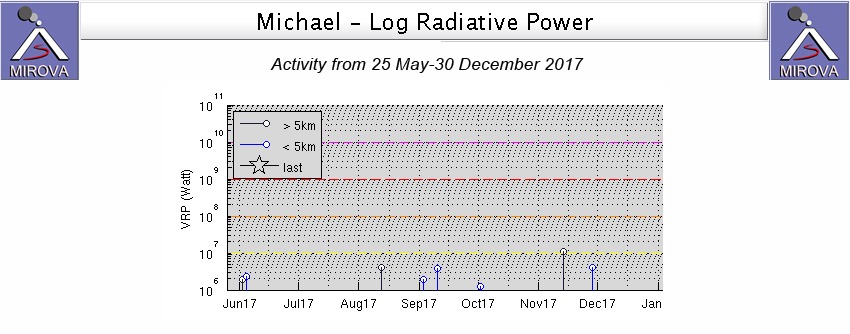 |
Figure 12. The MIROVA log radiative power graph for Mount Michael on Saunders Island from 25 May-30 December 2017 showed intermittent heat sources that indicated possible eruptive activity each month except July and December. Location uncertainty makes the distinction between greater and less than 5 km summit distance unclear. |
More sources of evidence for activity became available in 2018 with the addition of the Sentinel-2 satellite data during the months of February-April and September. Multiple thermal signals appeared from MIROVA in January 2018 (figure 13), and the first Sentinel-2 satellite image showed a distinct hotspot at the summit on 10 February (figure 14).
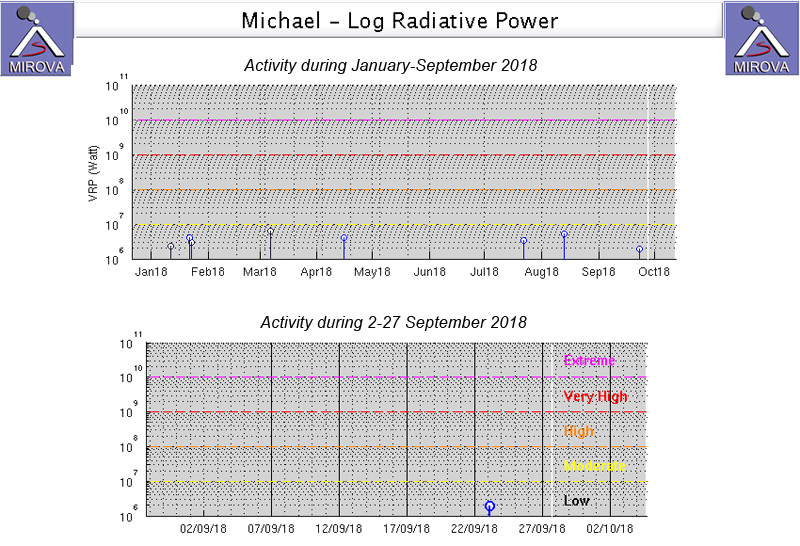 |
Figure 13. MIROVA thermal data for January-September 2018 indicated intermittent thermal anomaly signals in January, March, April, and July-September (top). A Sentinel-2 image with a hotspot was captured on 23 September, the same day as the MIROVA thermal signal (bottom). Courtesy of MIROVA. |
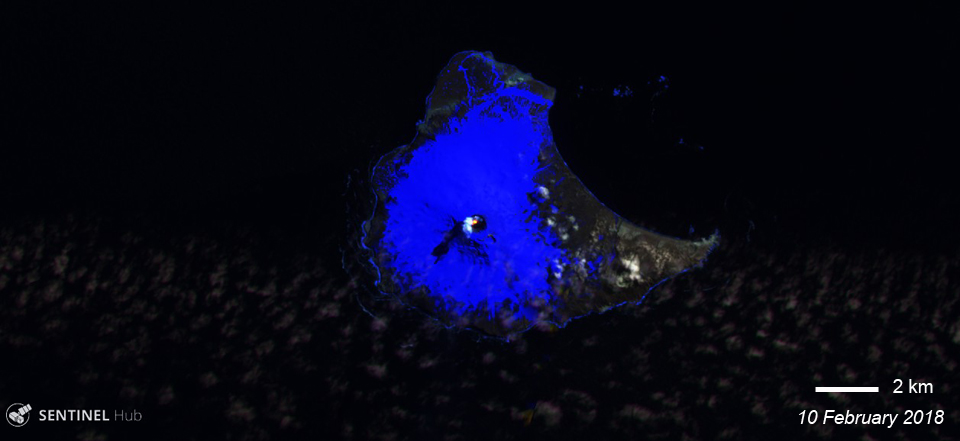 |
Figure 14. A Sentinel-2 image of Saunders Island on 10 February 2018 revealed a distinct hotspot and small steam plume rising from the summit crater of Mount Michael. Sentinel-2 image with Atmospheric Penetration view (bands 12, 11, and 8A), courtesy of Sentinel Hub Playground. |
A MODVOLC thermal alert appeared on 26 March 2019 followed by a significant hotspot signal in Sentinel-2 imagery on 29 March (figure 15). The hotspot was still present along with a substantial steam plume on 3 April 2018. Sentinel-2 imagery on 11 April revealed a large steam plume and cloud cover, but no hotspot.
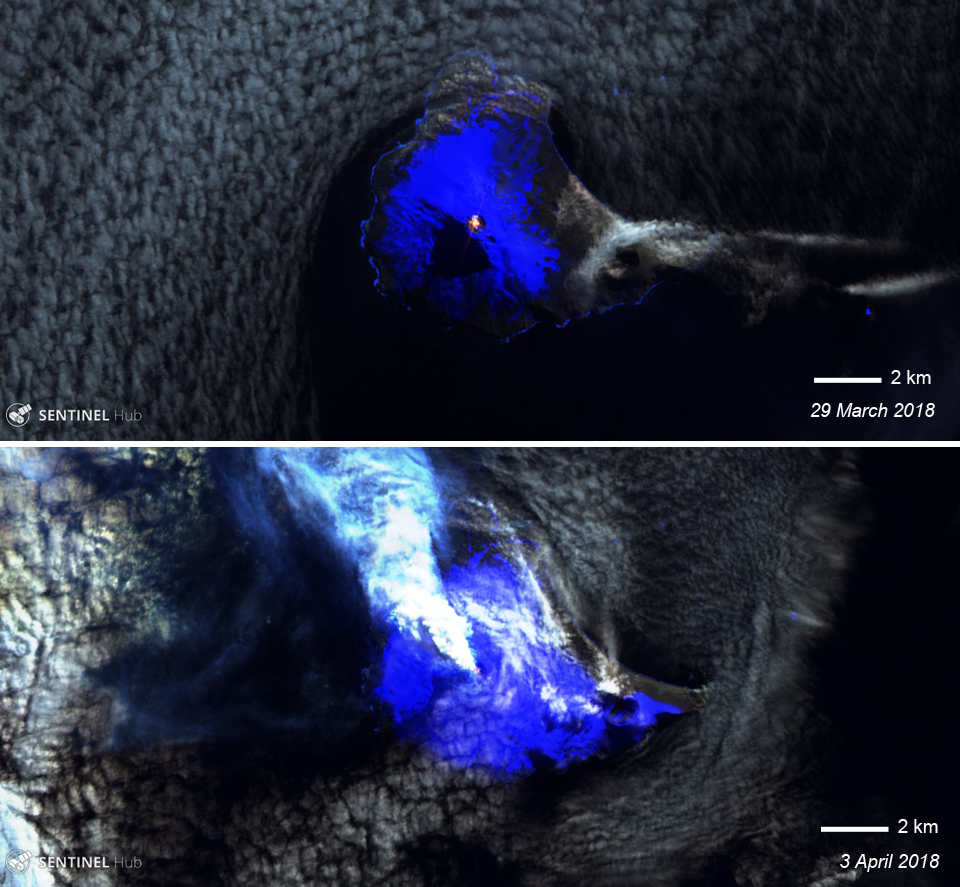 |
Figure 15. Hotspots in Sentinel-2 imagery on 29 March and 3 April 2018 indicated eruptive activity at Mount Michael on Saunders Island. Sentinel-2 image with Atmospheric Penetration view (bands 12, 11, and 8A), courtesy of Sentinel Hub Playground. |
MIROVA thermal signals appeared in mid-July and mid-August 2018 (figure 13) but little satellite imagery was available to confirm any thermal activity. The next clear signal of eruptive activity was evident in a Sentinel-2 image as a hotspot at the summit on 23 September. A small MIROVA signal was recorded the same day (figure 13, bottom). A few days later, on 28 September 2018, a Landsat 8 image showed a clear streak of dark-gray ash trending NW from the summit of Mount Michael (figure 16).
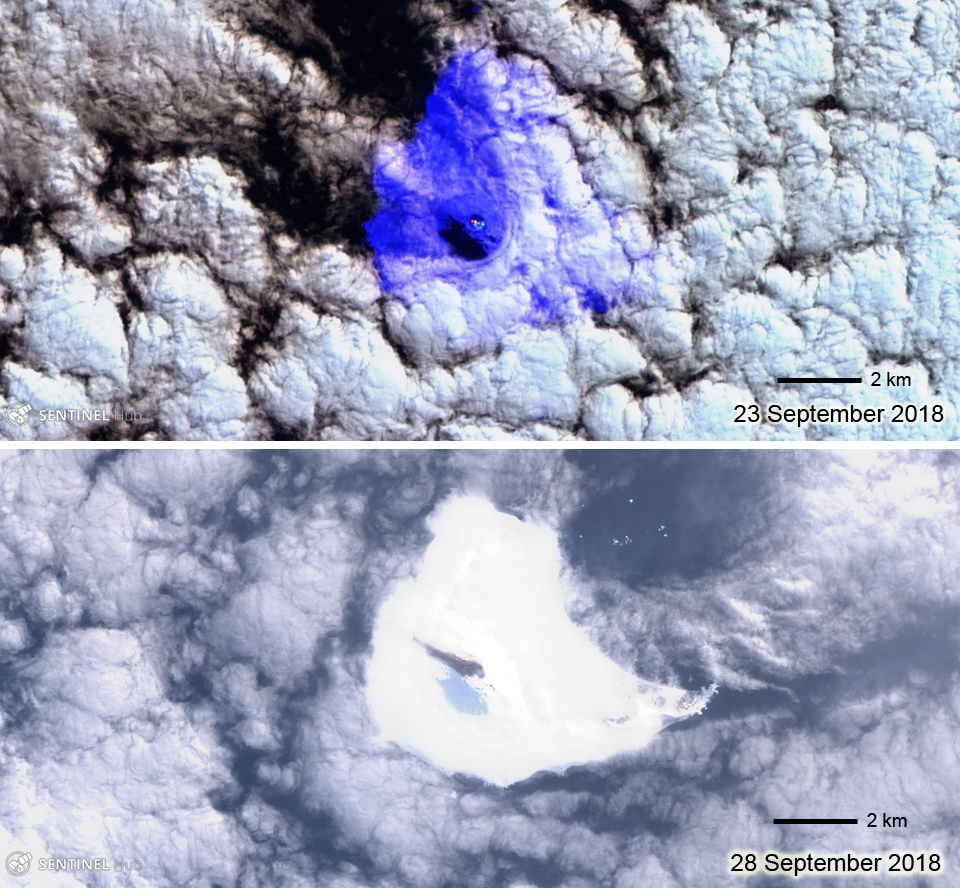 |
Figure 16. Satellite imagery confirmed eruptive activity at Mount Michael on Saunders Island in late September 2018. Top: a hotpot in a Sentinel-2 image on 23 September coincided with a MIROVA thermal signal (see figure 13); Bottom: A Landsat 8 image on 28 September has a distinct dark gray streak trending NW from the summit indicating a fresh ash deposit. The lighter gray area SW of the summit is likely a shadow. Sentinel-2 image with Atmospheric Penetration view, (bands 12, 11, and 8A), Landsat 8 image with pansharpened image processing, both courtesy of Sentinel Hub Playground. |
Information Contacts: Hawai'i Institute of Geophysics and Planetology (HIGP) - MODVOLC Thermal Alerts System, School of Ocean and Earth Science and Technology (SOEST), Univ. of Hawai'i, 2525 Correa Road, Honolulu, HI 96822, USA (URL: http://modis.higp.hawaii.edu/); MIROVA (Middle InfraRed Observation of Volcanic Activity), a collaborative project between the Universities of Turin and Florence (Italy) supported by the Centre for Volcanic Risk of the Italian Civil Protection Department (URL: http://www.mirovaweb.it/); Sentinel Hub Playground, (URL: https://www.sentinel-hub.com/explore/sentinel-playground); NASA Worldview (URL: https://worldview.earthdata.nasa.gov/).
Intermittent activity most months, October 2018-June 2019; photographs during February and May 2019
Historical observations of eruptive activity from the glacier-covered Mount Michael stratovolcano on Saunders Island in the South Sandwich Islands were not recorded until the early 19th century at this remote site in the southernmost Atlantic Ocean, and remain extremely rare. With the advent of satellite observation technology, indications of more frequent eruptive activity have become apparent. Vapor emission is frequently reported from the summit crater, and AVHRR and MODIS satellite imagery has revealed evidence for lava lake activity in the summit crater (Lachlan-Cope and others, 2001). Limited thermal anomaly data and satellite imagery indicated at least intermittent activity during May 2000-November 2013, and from November 2014 through April 2018 (Gray and others, 2019). Ongoing observations, including photographs from two site visits in February and May 2019 suggest continued activity at the summit during most months through May 2019, the period covered in this report. Information, in addition to on-site photographs, comes from MIROVA thermal anomaly data, NASA SO2 instruments, and Sentinel-2 and Landsat satellite imagery.
Near-constant cloud coverage for much of the year makes satellite data intermittent and creates difficulty in interpreting the ongoing nature of the activity. Gray and others (2019) concluded recently after a detailed study of shortwave and infrared satellite images that there was continued evidence for the previously identified lava lake on Mount Michael since January 1989. MIROVA thermal anomaly data suggest intermittent pulses of thermal energy in September, November, and December 2018, and April 2019 (figure 17). Satellite imagery confirmed some type of activity, either a dense steam plume, evidence of ash, or a thermal anomaly, each month during December 2018-March 2019. Sulfur dioxide anomalies were recorded in January, February, and March 2019. Photographic evidence of fresh ash was captured in February 2019, and images from May 2019 showed dense steam rising from the summit crater.
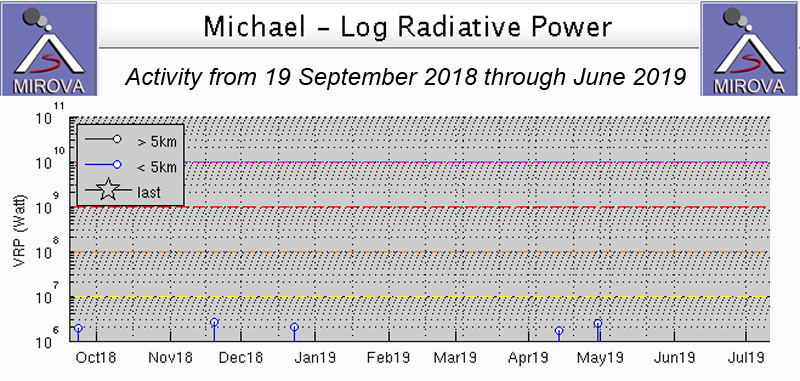 |
Figure 17. MIROVA thermal anomaly data from 19 September 2018 through June 2019 showed sporadic, low-level pulses of thermal energy in late September, November, and December 2018, and April 2019. Courtesy of MIROVA. |
After satellite imagery and thermal anomaly data in late September 2018 showed evidence for eruptive activity (BGVN 43:10, figure 16), a single thermal anomaly in MIROVA data was recorded in mid-November 2018 (figure 17). A rare, clear Sentinel-2 image on 2 December revealed a dense steam plume over the active summit crater; the steam obscured the presence of any possible thermal anomalies beneath (figure 18).
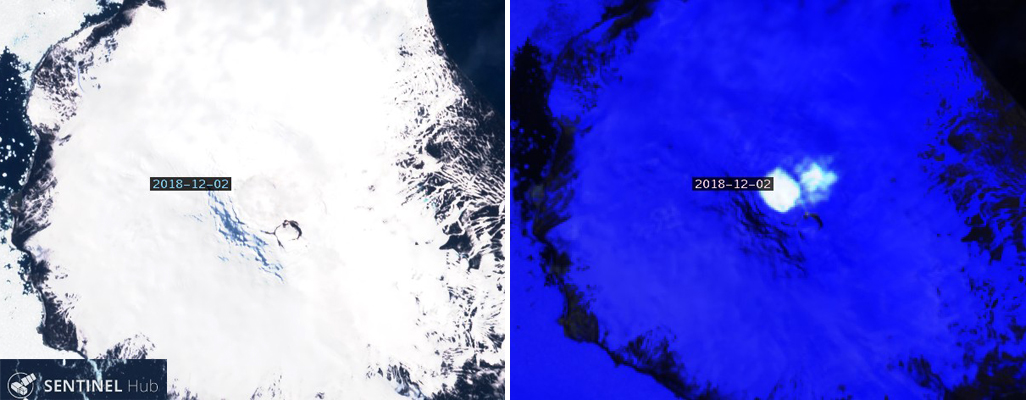 |
Figure 18. Sentinel-2 images of Mount Michael on Saunders Island on 2 December 2018 revealed a dense steam plume over the summit crater that was difficult to distinguish from the surrounding snow in Natural Color rendering (bands 4,3,2) (left), but was clearly visible in Atmospheric Penetration rendering (bands 12,11, 8a) (right). Courtesy of Sentinel Hub Playground. |
Clear evidence of recent activity appeared on 1 January 2019 with both a thermal anomaly at the summit crater and a streak of ash on the snow (figure 19). Steam was also present within the summit crater. A distinct SO2 anomaly appeared in data from the TROPOMI instrument on 14 January (figure 20).
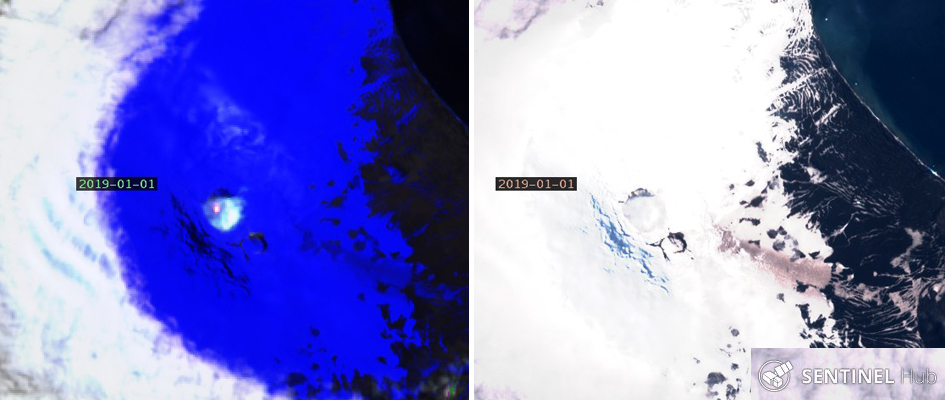 |
Figure 19. A thermal anomaly and dense steam were recorded at the summit of Mount Michael on Saunders Island on 1 January 2019 in Sentinel-2 Satellite imagery with Atmospheric Penetration rendering (bands 12, 11, 8a) (left). The same image shown with Natural Color rendering (bands 4,3,2) (right) shows a recent streak of brown particulates drifting SE from the summit crater. Courtesy of Sentinel Hub Playground. |
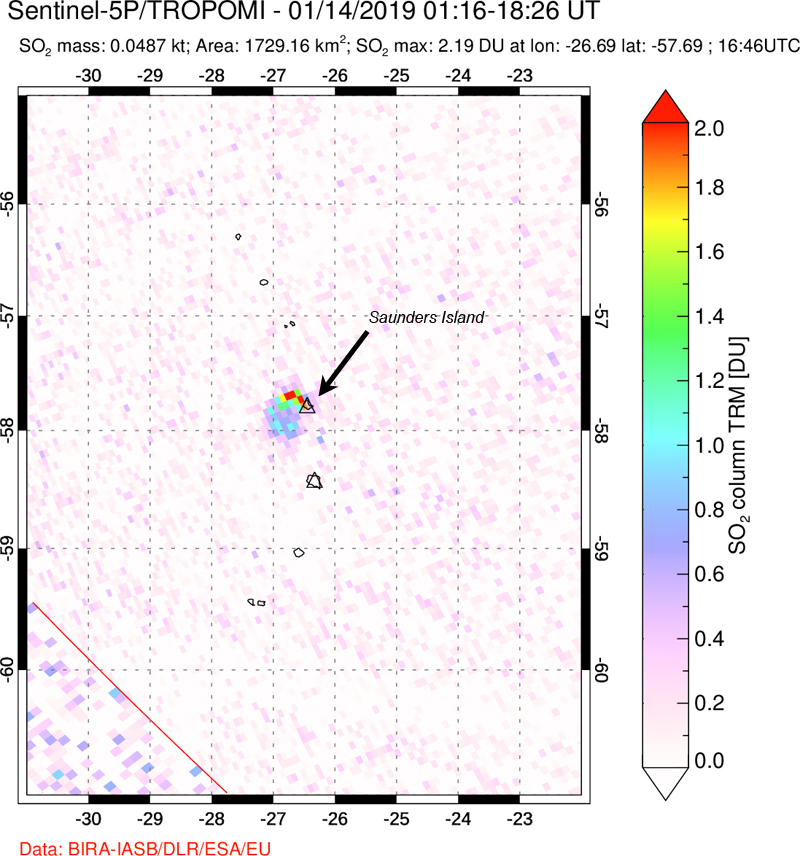 |
Figure 20. A distinct SO2 plume was recorded drifting NW from Saunders Island by the TROPOMI instrument on the Sentinel 5-P satellite on 14 January 2019. Courtesy of NASA Goddard Space Flight Center. |
Multiple sources of satellite data and sea-based visual observation confirmed activity during February 2019. SO2 emissions were recorded with the TROPOMI instrument on 10, 11, 15, and 16 February (figure 21). A Landsat image from 10 February showed a dense steam plume drifting NW from the summit crater, with the dark rim of the summit crater well exposed (figure 22). Sentinel-2 images in natural color and atmospheric penetration renderings identified a dense steam plume drifting S and a thermal anomaly within the summit crater on 15 February (figure 23). An expedition to the South Sandwich Islands between 15 February and 8 March 2019 sponsored by the UK government sailed by Saunders in late February and observed a stream of ash on the NNE flank beneath the cloud cover (figure 24).
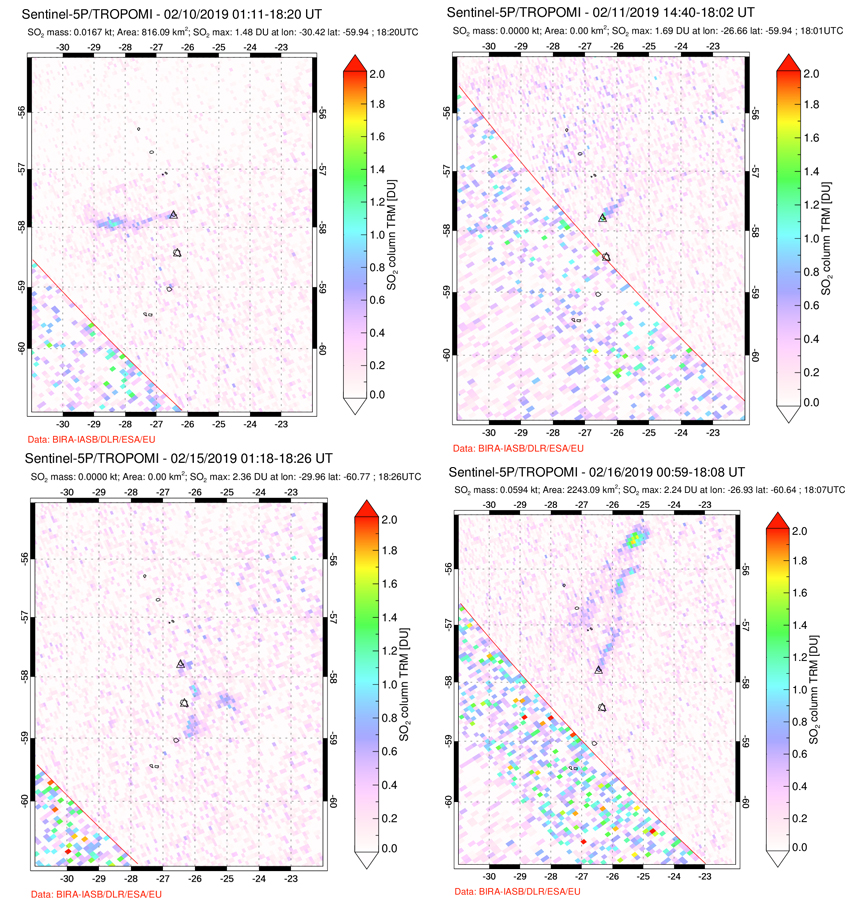 |
Figure 21. Faint but distinct SO2 plumes were recorded drifting away from Saunders Island in various directions on 10, 11, 15, and 16 February 2019. Courtesy of NASA Goddard Space Flight Center. |
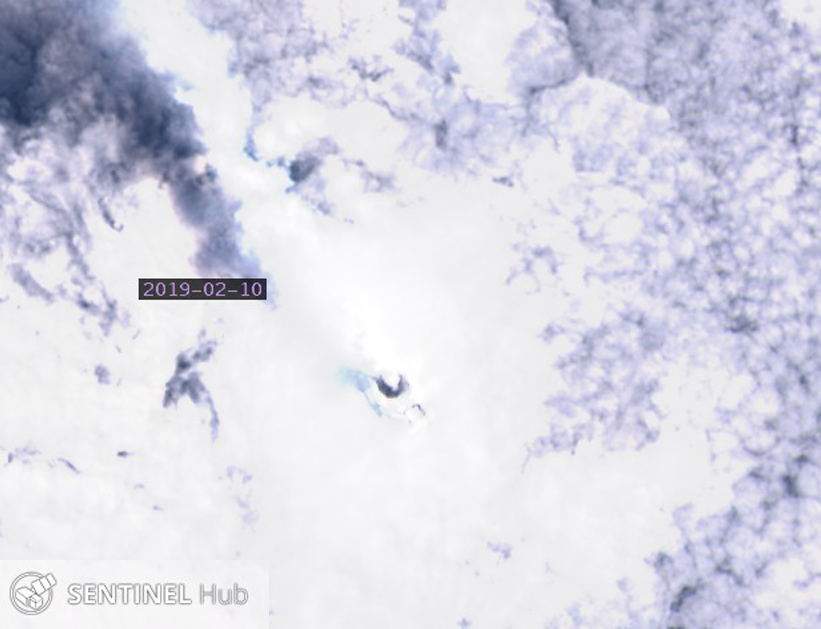 |
Figure 22. The dark summit crater of Mount Michael on Saunders Island was visible in Landsat imagery on 10 February 2019. A dense steam plume drifted NW and cast a dark shadow on the underlying cloud cover. Courtesy of Sentinel Hub Playground. |
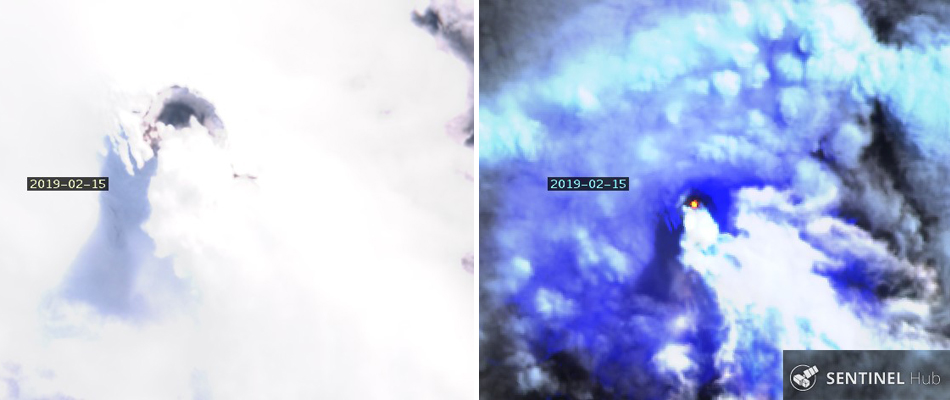 |
Figure 23. At the summit of Mount Michael on Saunders Island, Sentinel-2 images in Natural Color (bands 4,3,2) (left) and Atmospheric Penetration (bands 12, 11, 8a) (right) renderings identified a dense steam plume drifting S and a thermal anomaly within the summit crater on 15 February 2019. Courtesy of Sentinel Hub Playground. |
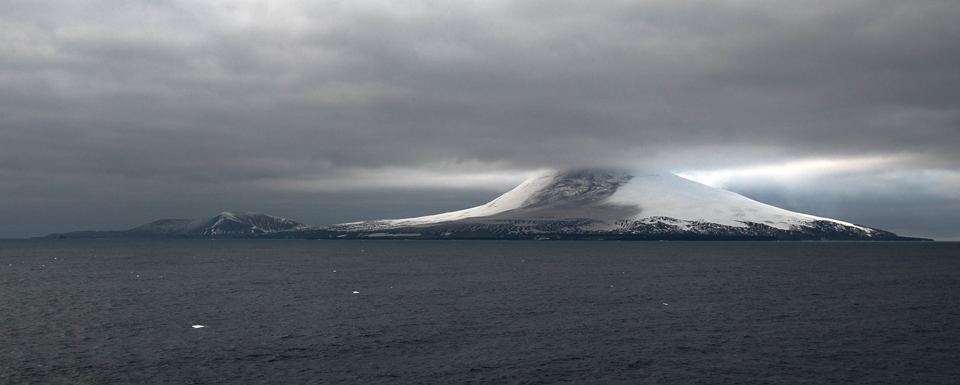 |
Figure 24. Recent ash covered the NNE flank of Mount Michael on Saunders Island in late February 2019 when observed by an expedition to the South Sandwich Islands sponsored by the UK government. Courtesy of Chris Darby. |
Faint SO2 emissions were recorded twice during March 2019 (figure 25), and a dense steam plume near the summit crater was visible in Landsat imagery on 23 March (figure 26). Two thermal anomalies were captured in the MIROVA data during April 2019 (figure 17).
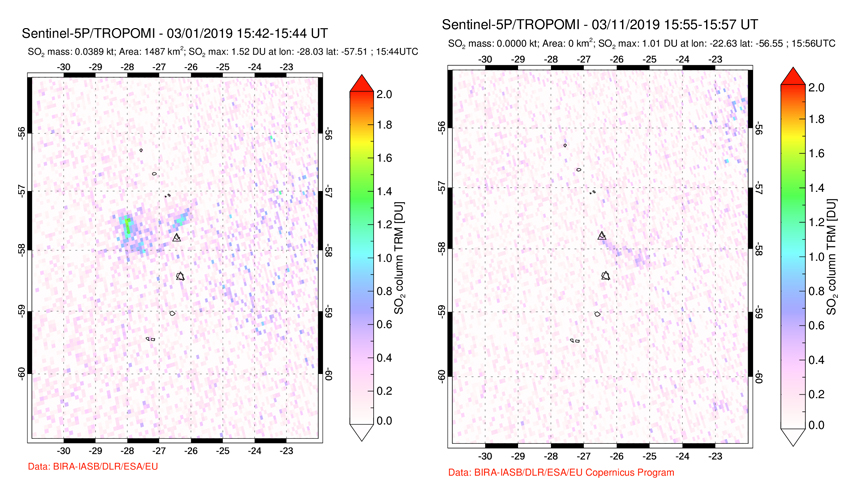 |
Figure 25. Faint SO2 plumes were recorded on 1 and 11 March 2019 emerging from Saunders Island. Courtesy of NASA Goddard Space Flight Center. |
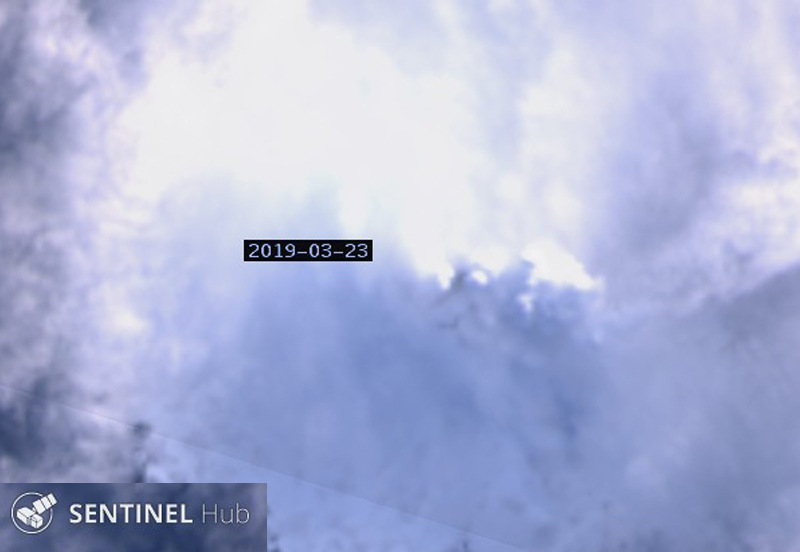 |
Figure 26. A dense steam plume drifted E from the summit crater of Mount Michael at Saunders Island on 25 March 2019. Landsat-8 image courtesy of Sentinel Hub Playground. |
A volcano-related research project "SSIVOLC" explored the South Sandwich Islands volcanoes during 15 April-31 May 2019. A major aim of SSIVOLC was to collect photogrammetric data of the glacier-covered Mount Michael (Derrien and others, 2019). A number of still images were acquired on 17 and 22 May 2019 showing various features of the island (figures 27-30). The researchers visually observed brief, recurrent, and very weak glow at the summit of Mount Michael after dark on 17 May, which they interpreted as reflecting light from an active lava lake within the summit crater.
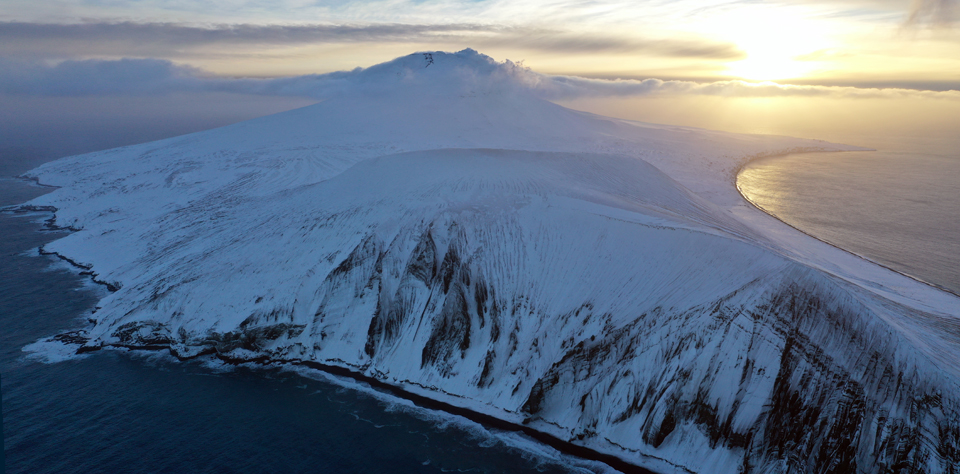 |
Figure 27. The steep slopes of an older eroded crater on the E end of Saunders island in the 'Ashen Hills' shows layers of volcanic deposits dipping away from the open half crater. In the background, steam and gas flow out of the summit crater of Mount Michael and drift down the far slope. Drone image PA-IS-03 taken during 17-22 May 2019, courtesy of Derrien and others (2019) used under Creative Commons Attribution 4.0 International (CC-BY 4.0) License. |
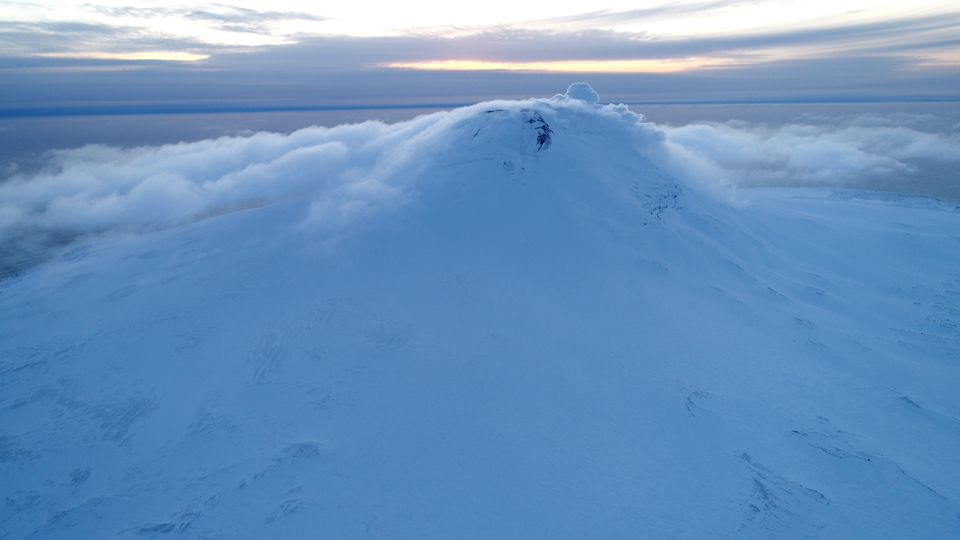 |
Figure 28. A dense steam plume drifts away from the summit of Mount Michael on Saunders Island in this drone image taken during 17-22 May 2019. The older summit crater is to the left of the dark patch in the middle of the summit. North is to the right. Image SU-3 courtesy of Derrien and others (2019) used under Creative Commons Attribution 4.0 International (CC-BY 4.0) License. |
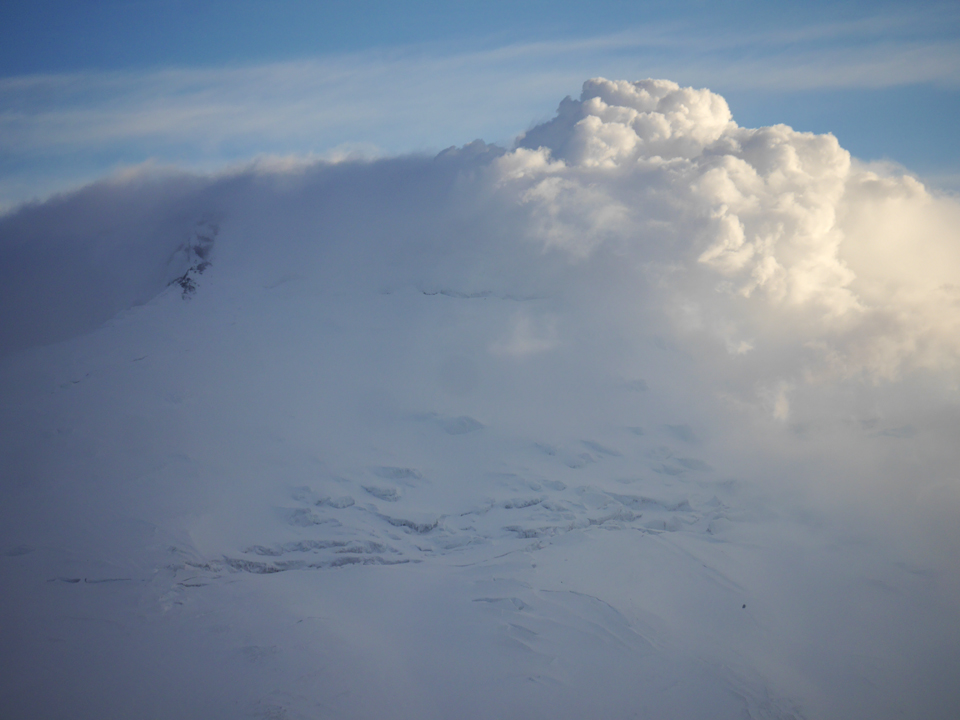 |
Figure 29. This close-up image of the summit of Mount Michael on Saunders Island shows steam plumes billowing from the summit crater, and large crevasses in the glacier covered flank, taken during 17-22 May 2019. The old crater is to the left. Image TL-SU-1 courtesy of Derrien and others (2019) used under Creative Commons Attribution 4.0 International (CC-BY 4.0) License. |
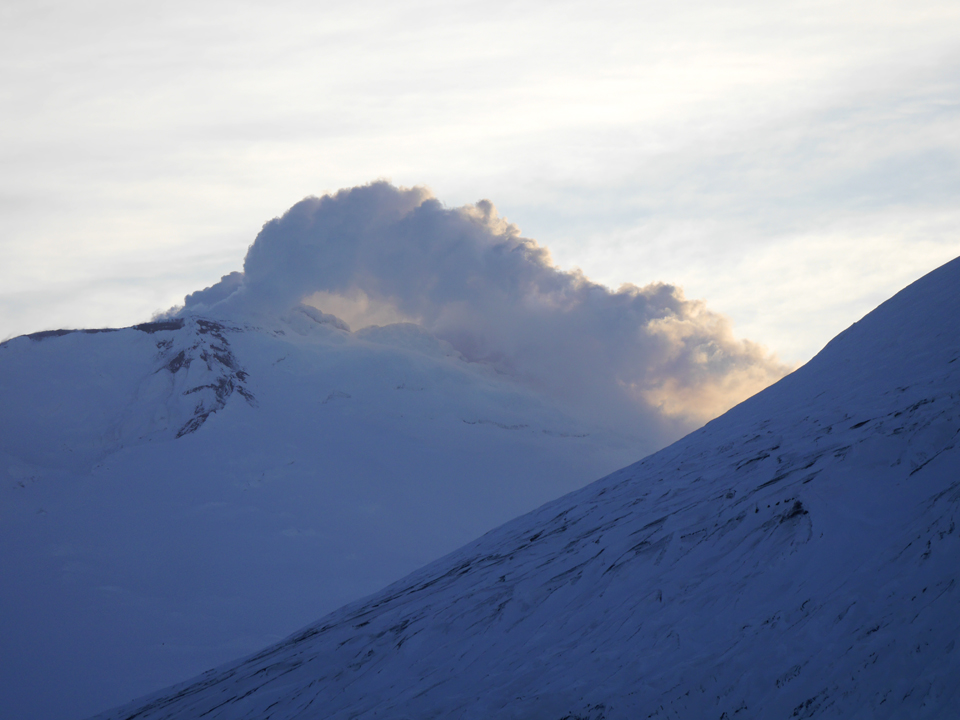 |
Figure 30. A dense plume of steam rises from the summit crater of Mount Michael on Saunders Island and drifts over mounds of frozen material during 17-22 May 2019. The older crater is to the left, and part of the Ashen Hills is in the foreground. Image TL-SU-2 courtesy of Derrien and others (2019) used under Creative Commons Attribution 4.0 International (CC-BY 4.0) License. |
References: Lachlan-Cope T, Smellie J L, Ladkin R, 2001. Discovery of a recurrent lava lake on Saunders Island (South Sandwich Islands) using AVHRR imagery. J. Volcanol. Geotherm. Res., 112: 105-116.
Gray D M, Burton-Johnson A, Fretwell P T, 2019. Evidence for a lava lake on Mt. Michael volcano, Saunders Island (South Sandwich Islands) from Landsat, Sentinel-2 and ASTER satellite imagery. J. Volcanol. Geotherm. Res., 379:60-71. https://doi.org/10.1016/j.volgeores.2019.05.002.
Derrien A, Richter N, Meschede M, Walter T, 2019. Optical DSLR camera- and UAV footage of the remote Mount Michael Volcano, Saunders Island (South Sandwich Islands), acquired in May 2019. GFZ Data Services. http://doi.org/10.5880/GFZ.2.1..2019.003
Information Contacts: MIROVA (Middle InfraRed Observation of Volcanic Activity), a collaborative project between the Universities of Turin and Florence (Italy) supported by the Centre for Volcanic Risk of the Italian Civil Protection Department (URL: http://www.mirovaweb.it/); Global Sulfur Dioxide Monitoring Page, Atmospheric Chemistry and Dynamics Laboratory, NASA Goddard Space Flight Center (NASA/GSFC), 8800 Greenbelt Road, Goddard, Maryland, USA (URL: https://so2.gsfc.nasa.gov/); Sentinel Hub Playground (URL: https://www.sentinel-hub.com/explore/sentinel-playground); Chris Darby (URL: https://twitter.com/ChrisDDarby, image at https://twitter.com/ChrisDDarby/status/1100686838568812544).
Elevated crater temperatures and gas emission through May 2020; research expedition
The glaciated Saunders Island is located in the remote South Sandwich Volcanic Arc in the South Atlantic between Candlemas (to the north) and Montagu (to the south) islands. The main volcanic features are Mount Michael, lava flows on the northern Blackstone Plain, and the Ashen hills complex near the eastern Nattriss Point (figure 31). The Ashen Hills complex is a group of overlapping craters formed through phreatomagmatic activity, with the largest crater opening towards the NW (figure 32). Gas emissions have been remotely observed from the ice-filled Old crater to the SE, with reports of gas plumes extending back to 1820 (LeMasurier et al., 1990; Patrick and Smellie, 2013; Liu et al., 2021). The current eruption period, centered at the 500-m-diameter Mount Michael summit crater, has been ongoing since at least 12 November 2014, based on remote sensing analysis (Gray et al., 2019). Activity consists of a lava lake, persistent degassing, and intermittent explosions producing ash plumes (Patrick and Smellie 2013; Gray et al. 2019). Visits are infrequent due to the remote location, and cloud and plume cover often prevents satellite observations. This report summarizes activity during June 2019 through May 2020 primarily using satellite data, as well as observations from visiting scientists.
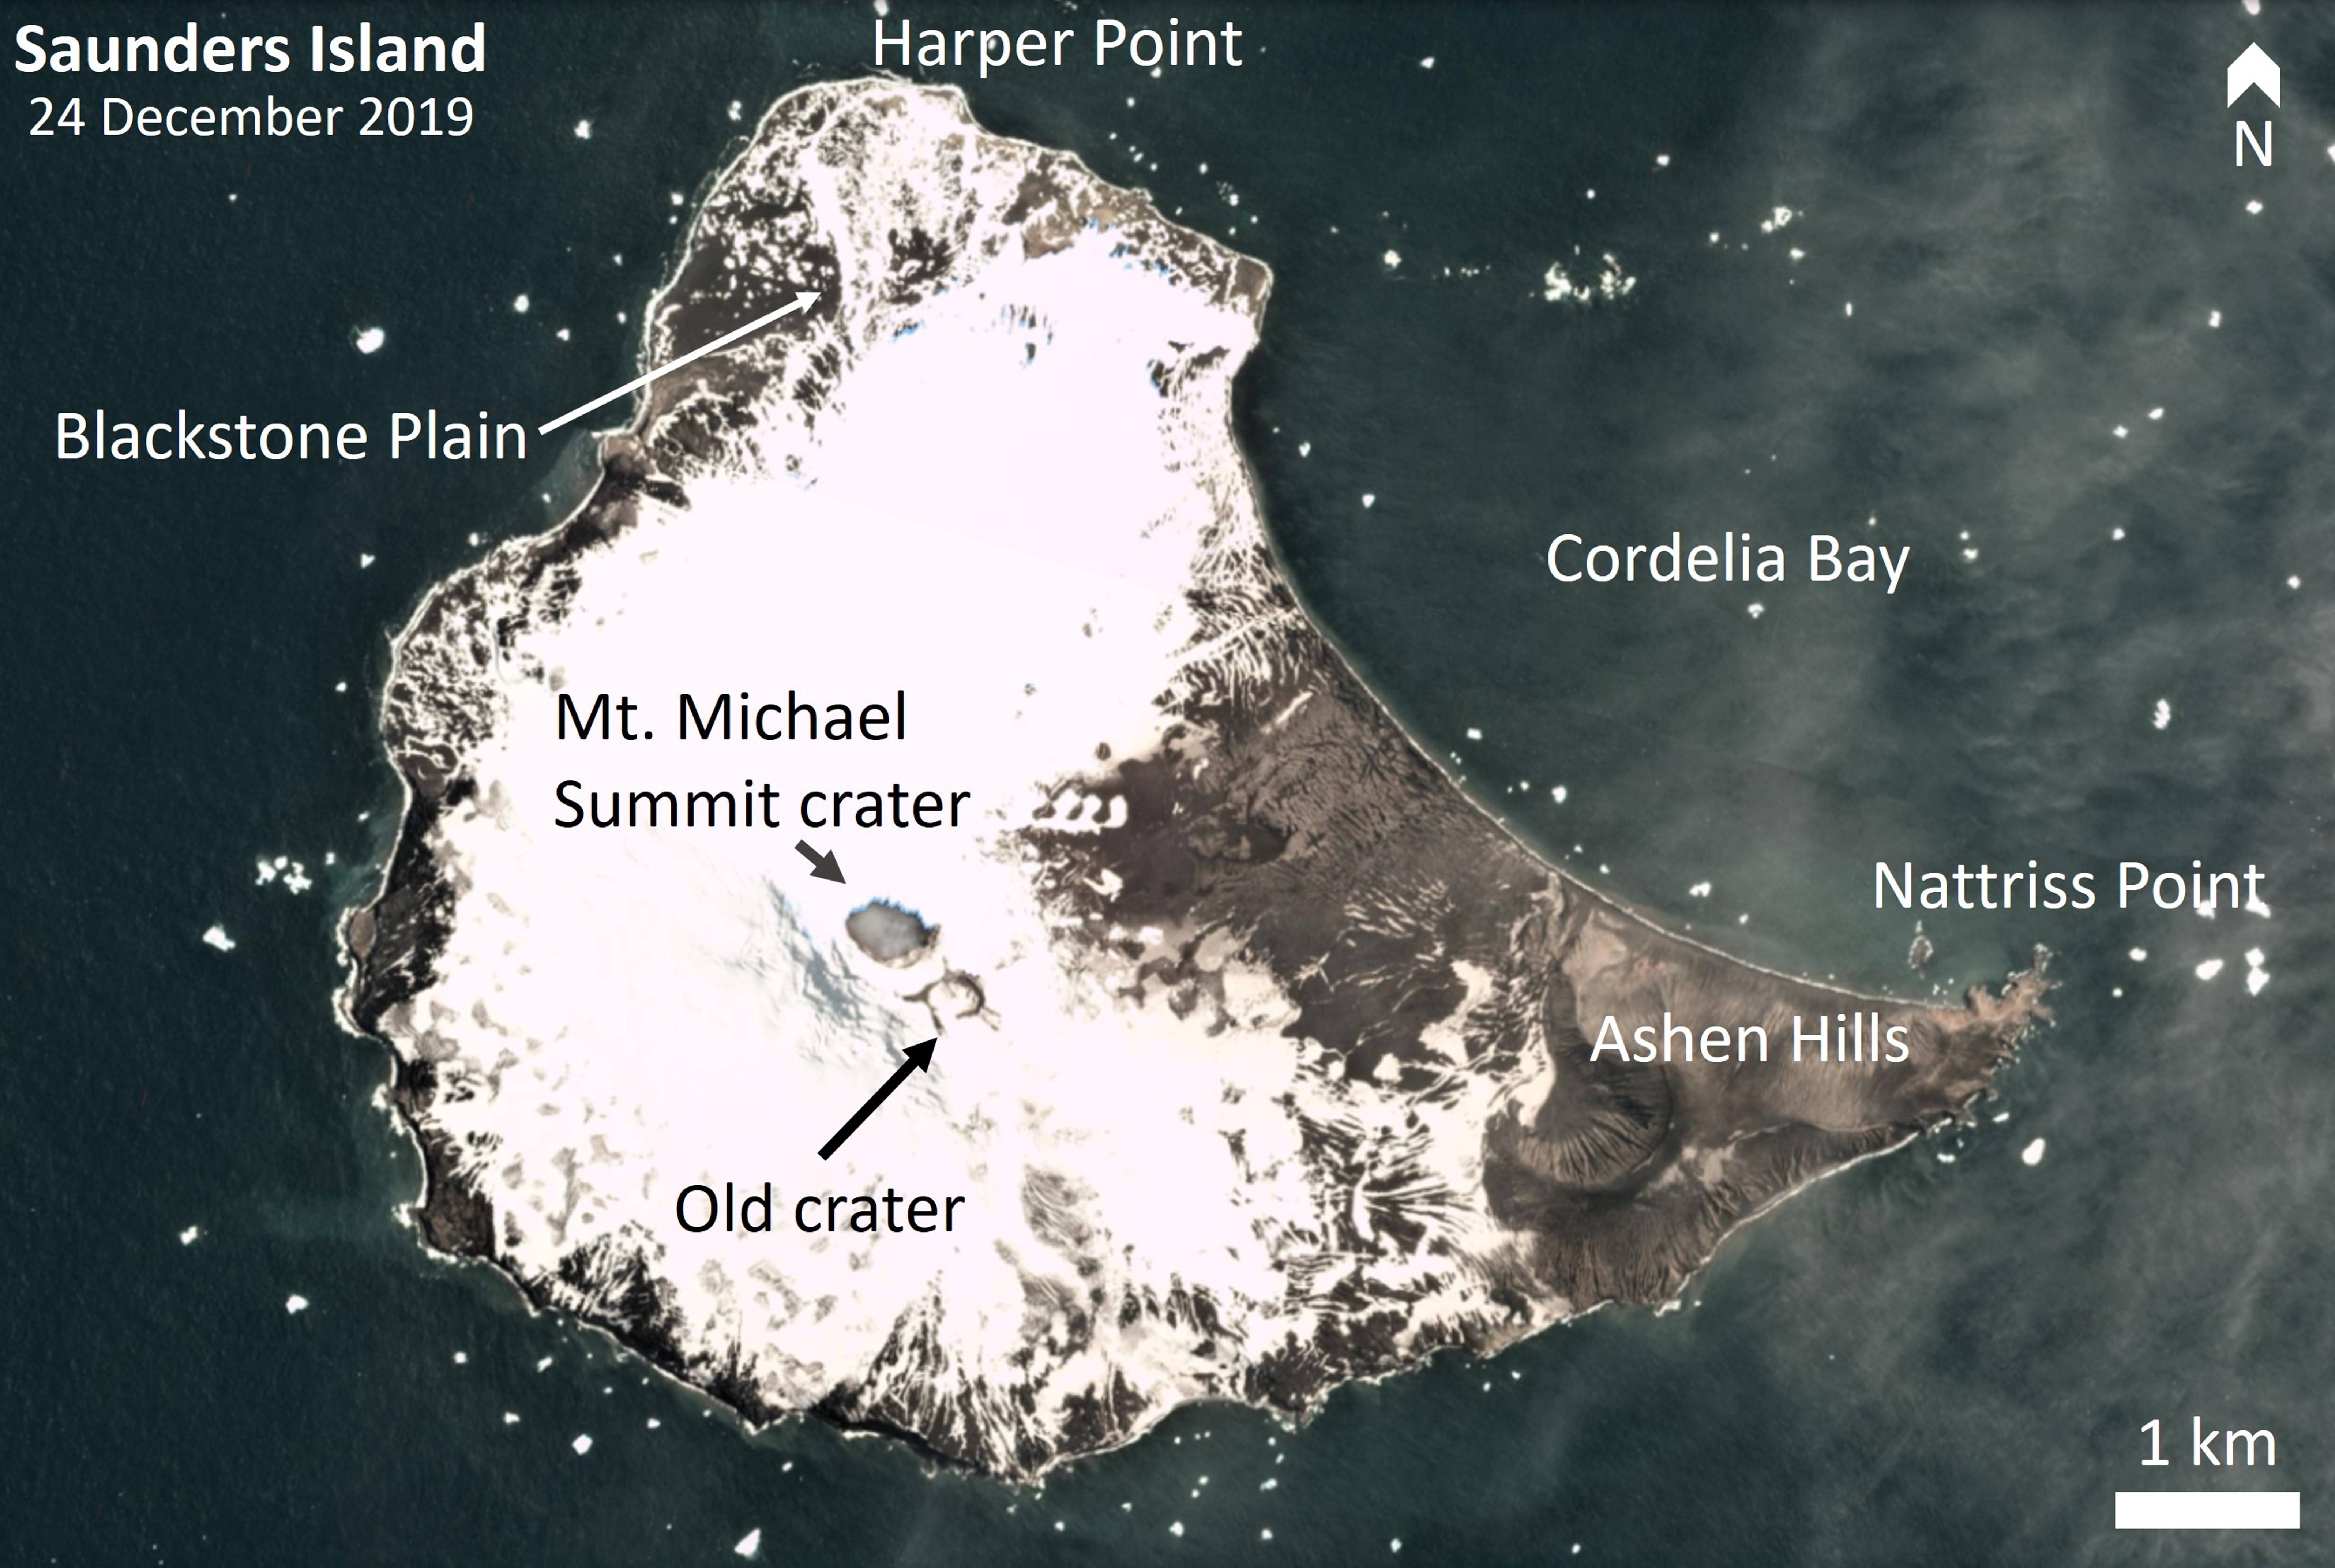 |
Figure 31. This 24 December 2019 satellite image of Saunders Island shows the locations of the active Mount Michael summit crater and other features on the island. Sentinel-2 image with Natural color (bands 4, 3, 2) rendering. Courtesy of Planet Labs. |
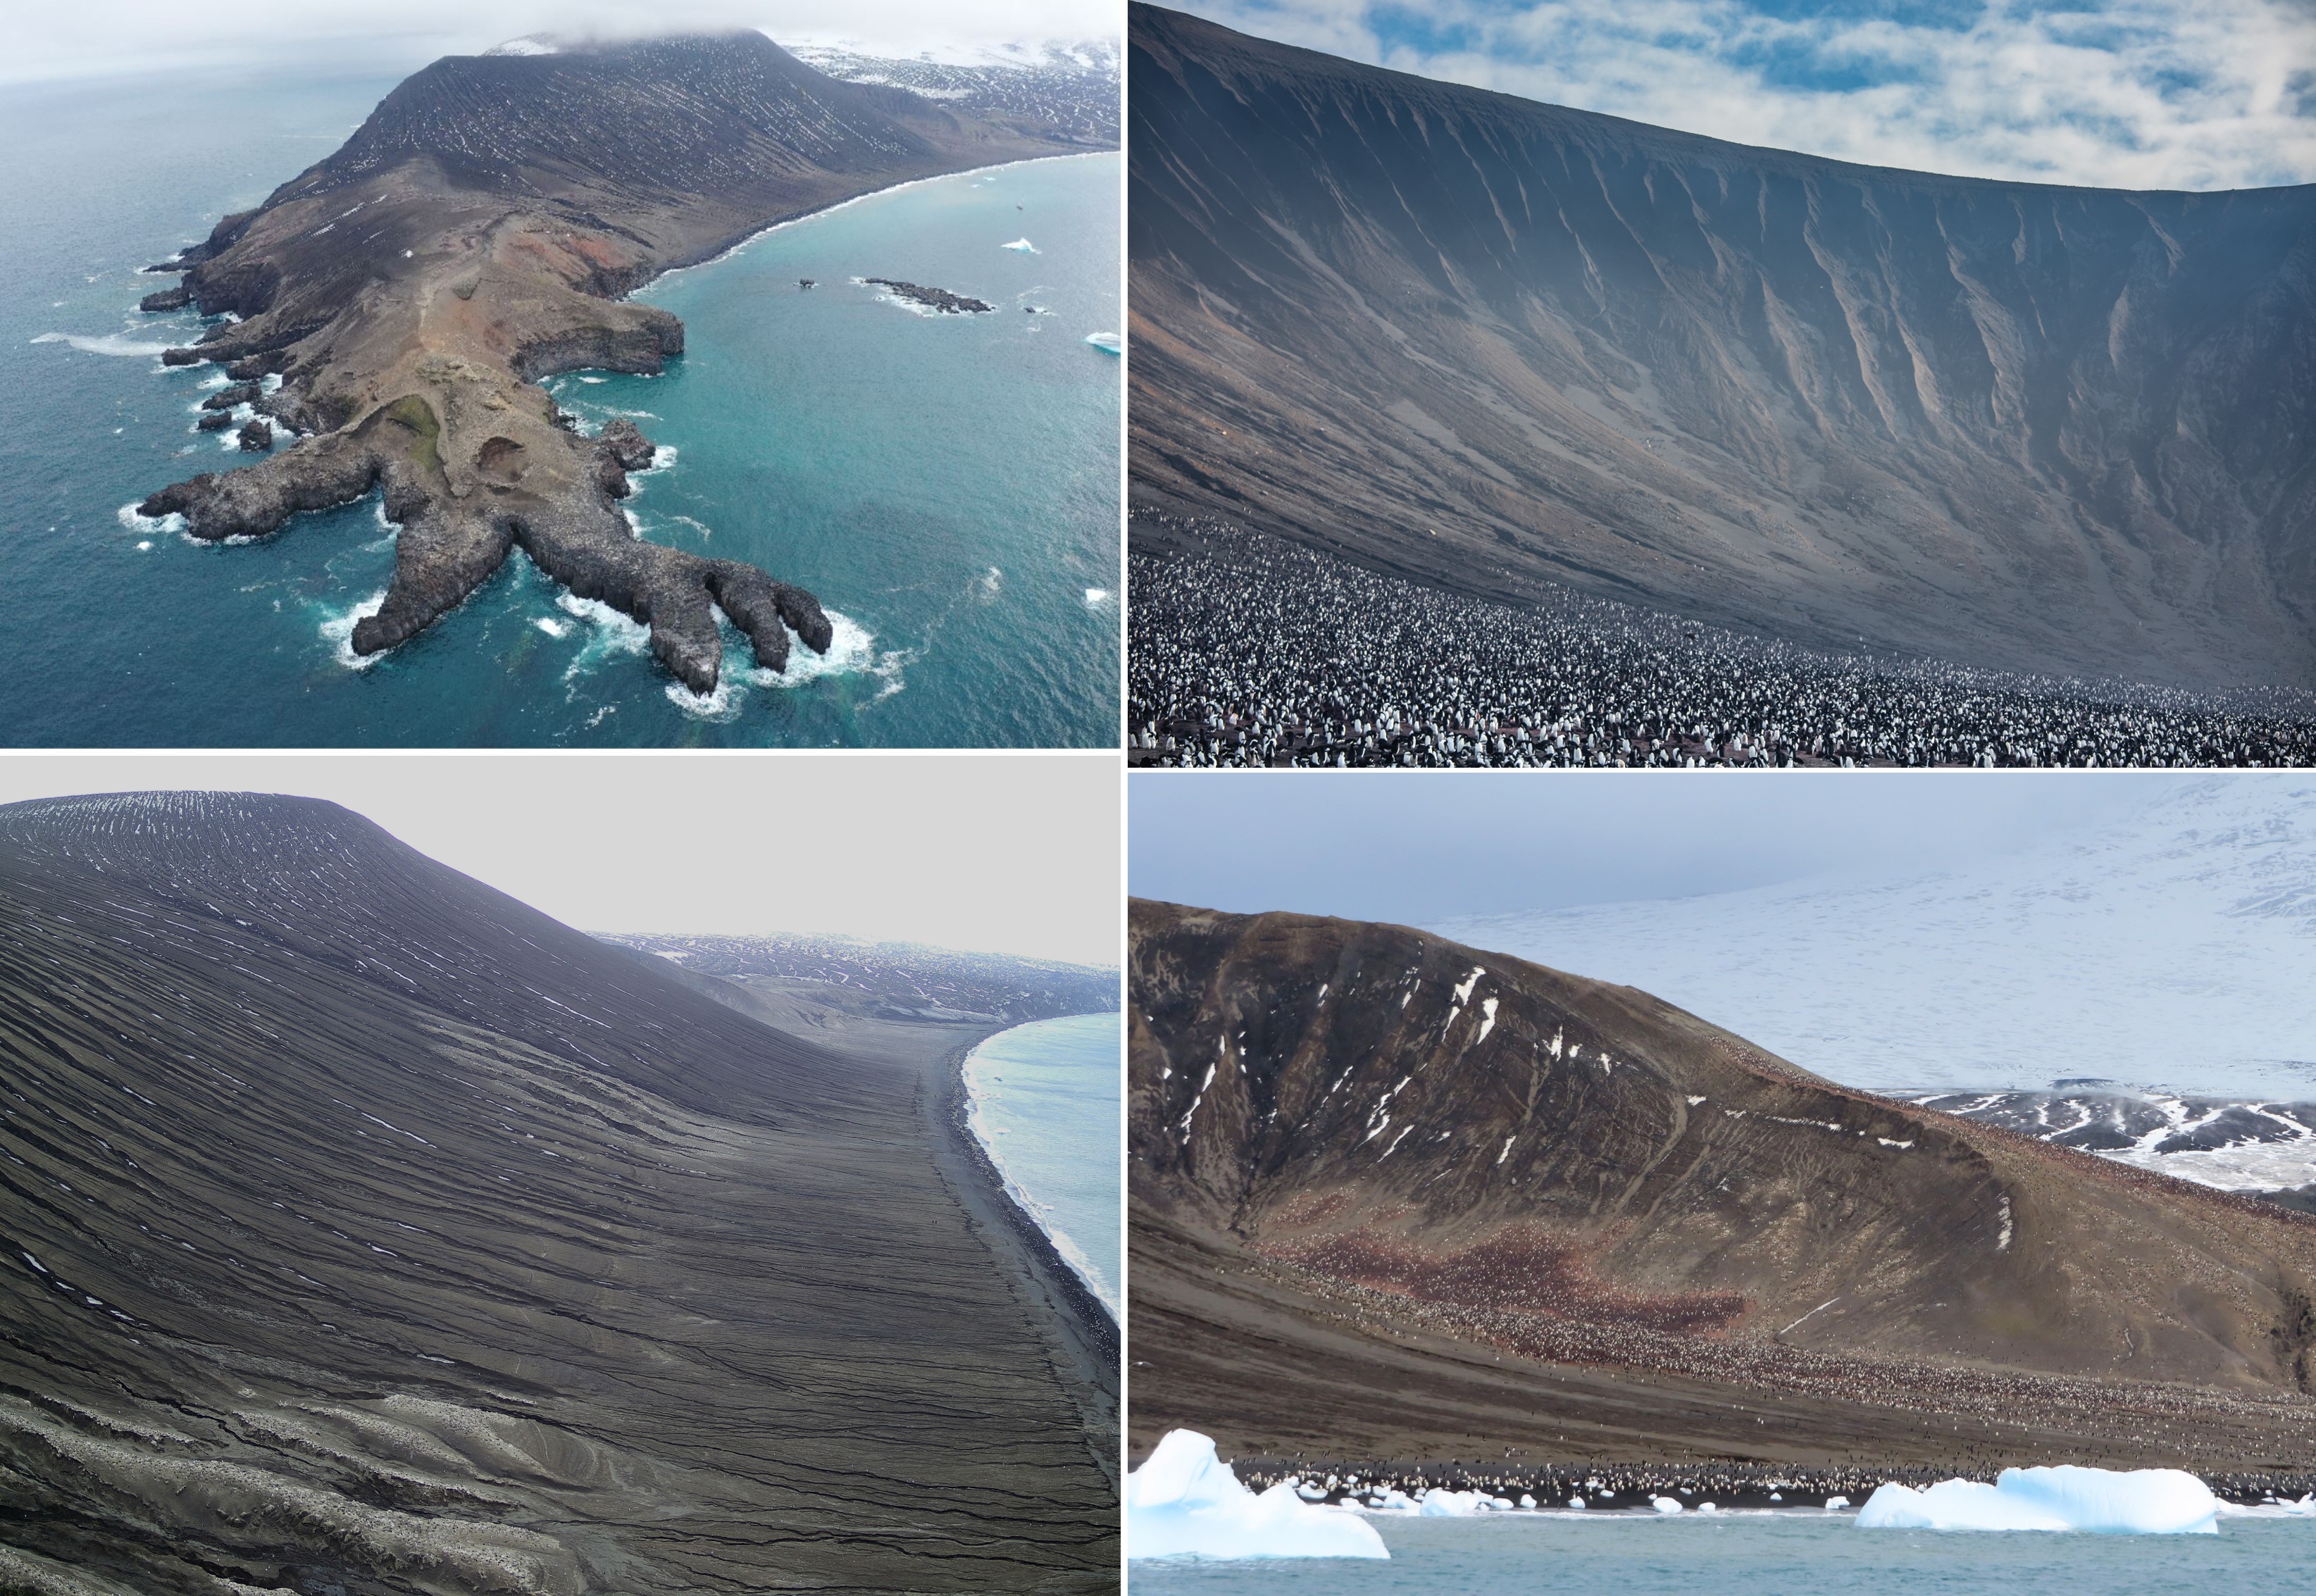 |
Figure 32. Images of the southeastern area of Saunders Island taken in January 2020. The top left image shows Nattriss Point with Ashen Hills in the background. The other photos show the crater and flanks of the Ashen Hills complex with rill and gully features from fluvial erosion. White and black speckled features in the images are penguins. Photos courtesy of Emma Liu and the 2020 Pelagic Australis expedition group. |
Activity during June-December 2019. Ashfall deposits on the flanks were sometimes visible on the snow and ice (figure 33). MIROVA thermal anomaly data during June 2019 through June 2020 showed few days where high temperatures were detected by this sensor, but the active summit crater floor is often obscured by cloud cover or condensed gas-and-steam plumes. The TROPOspheric Monitoring Instrument (TROPOMI) detected frequent sulfur dioxide (SO2) plumes of varying concentrations that are dispersed in different directions by wind (figure 34). Small condensed gas-and-steam plumes are often visible in satellite imagery within the crater, and some larger plumes are also imaged (figure 35). All satellite images where the summit crater was not obscured by either cloud cover or gas-and-steam plumes showed elevated temperatures within the summit crater, with three distinct areas visible possibly indicating multiple active vents (figure 36).
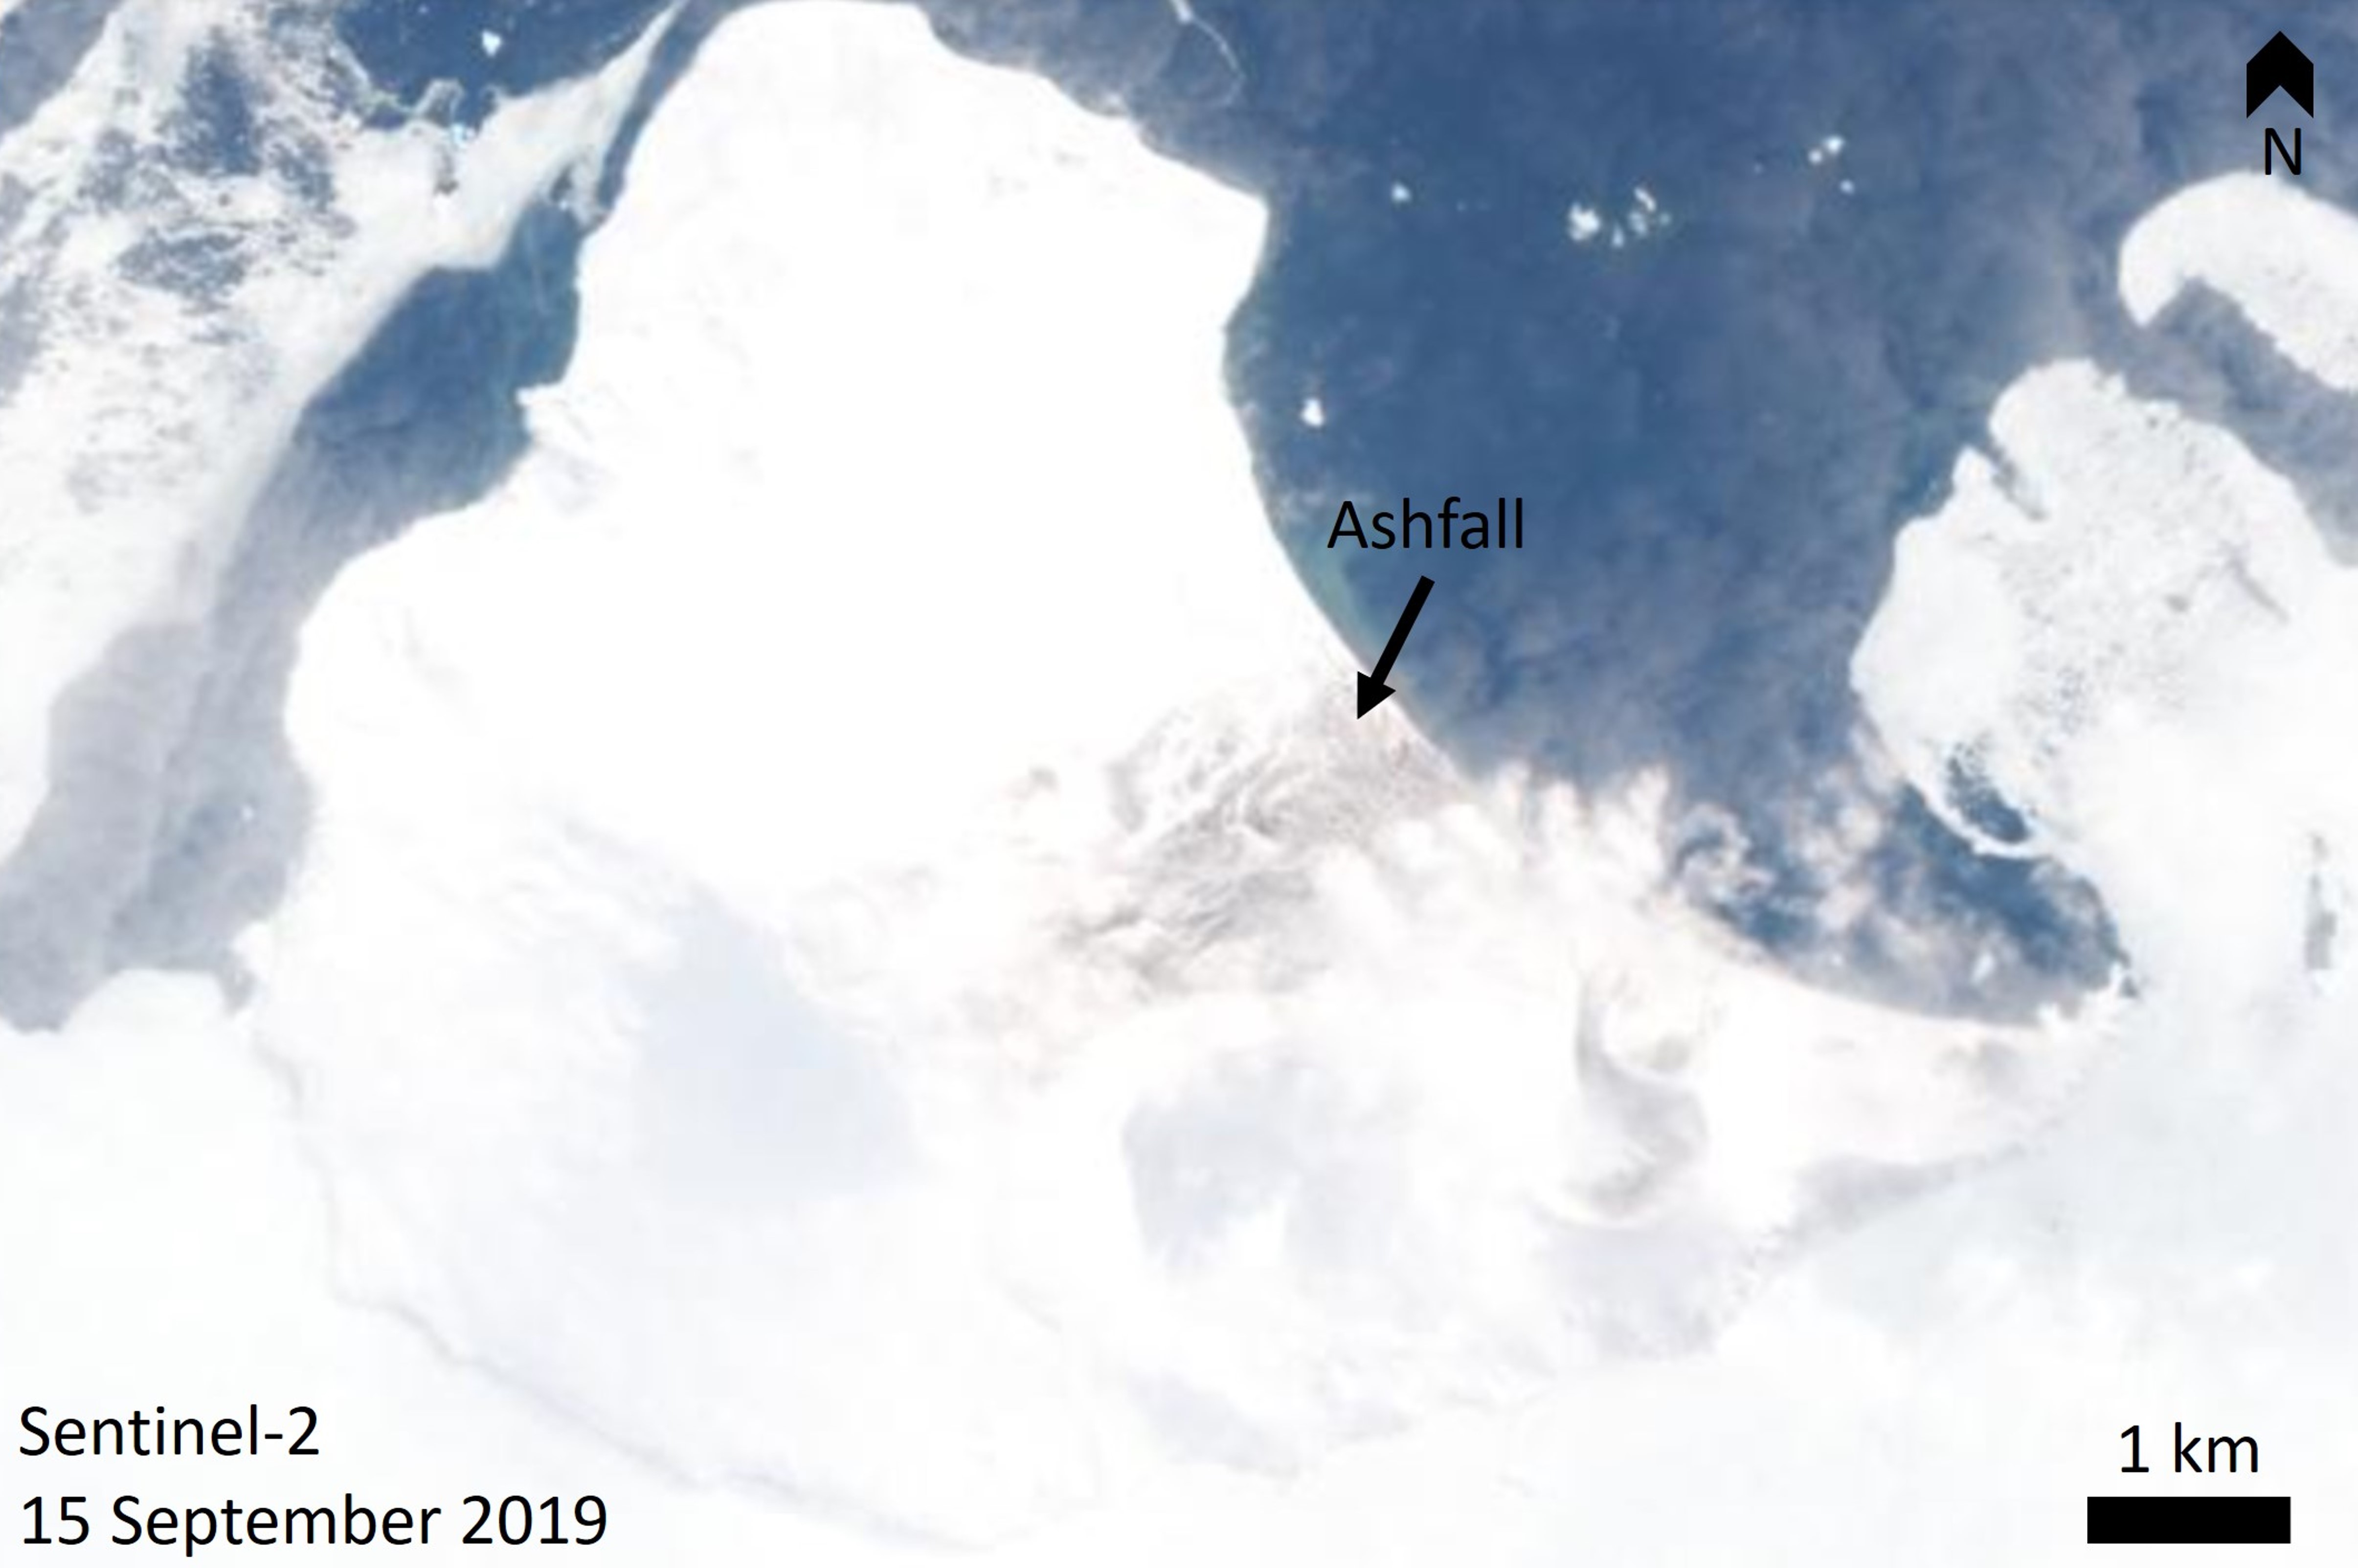 |
Figure 33. This satellite image of Saunders Island acquired on 15 September 2019 shows the snow and ice-covered island and a recent ashfall deposit on the NE flank towards Cordelia Bay, with a green sediment plume in the water. Sentinel-2 image with Natural color (bands 4, 3, 2) rendering. Courtesy of Planet Labs. |
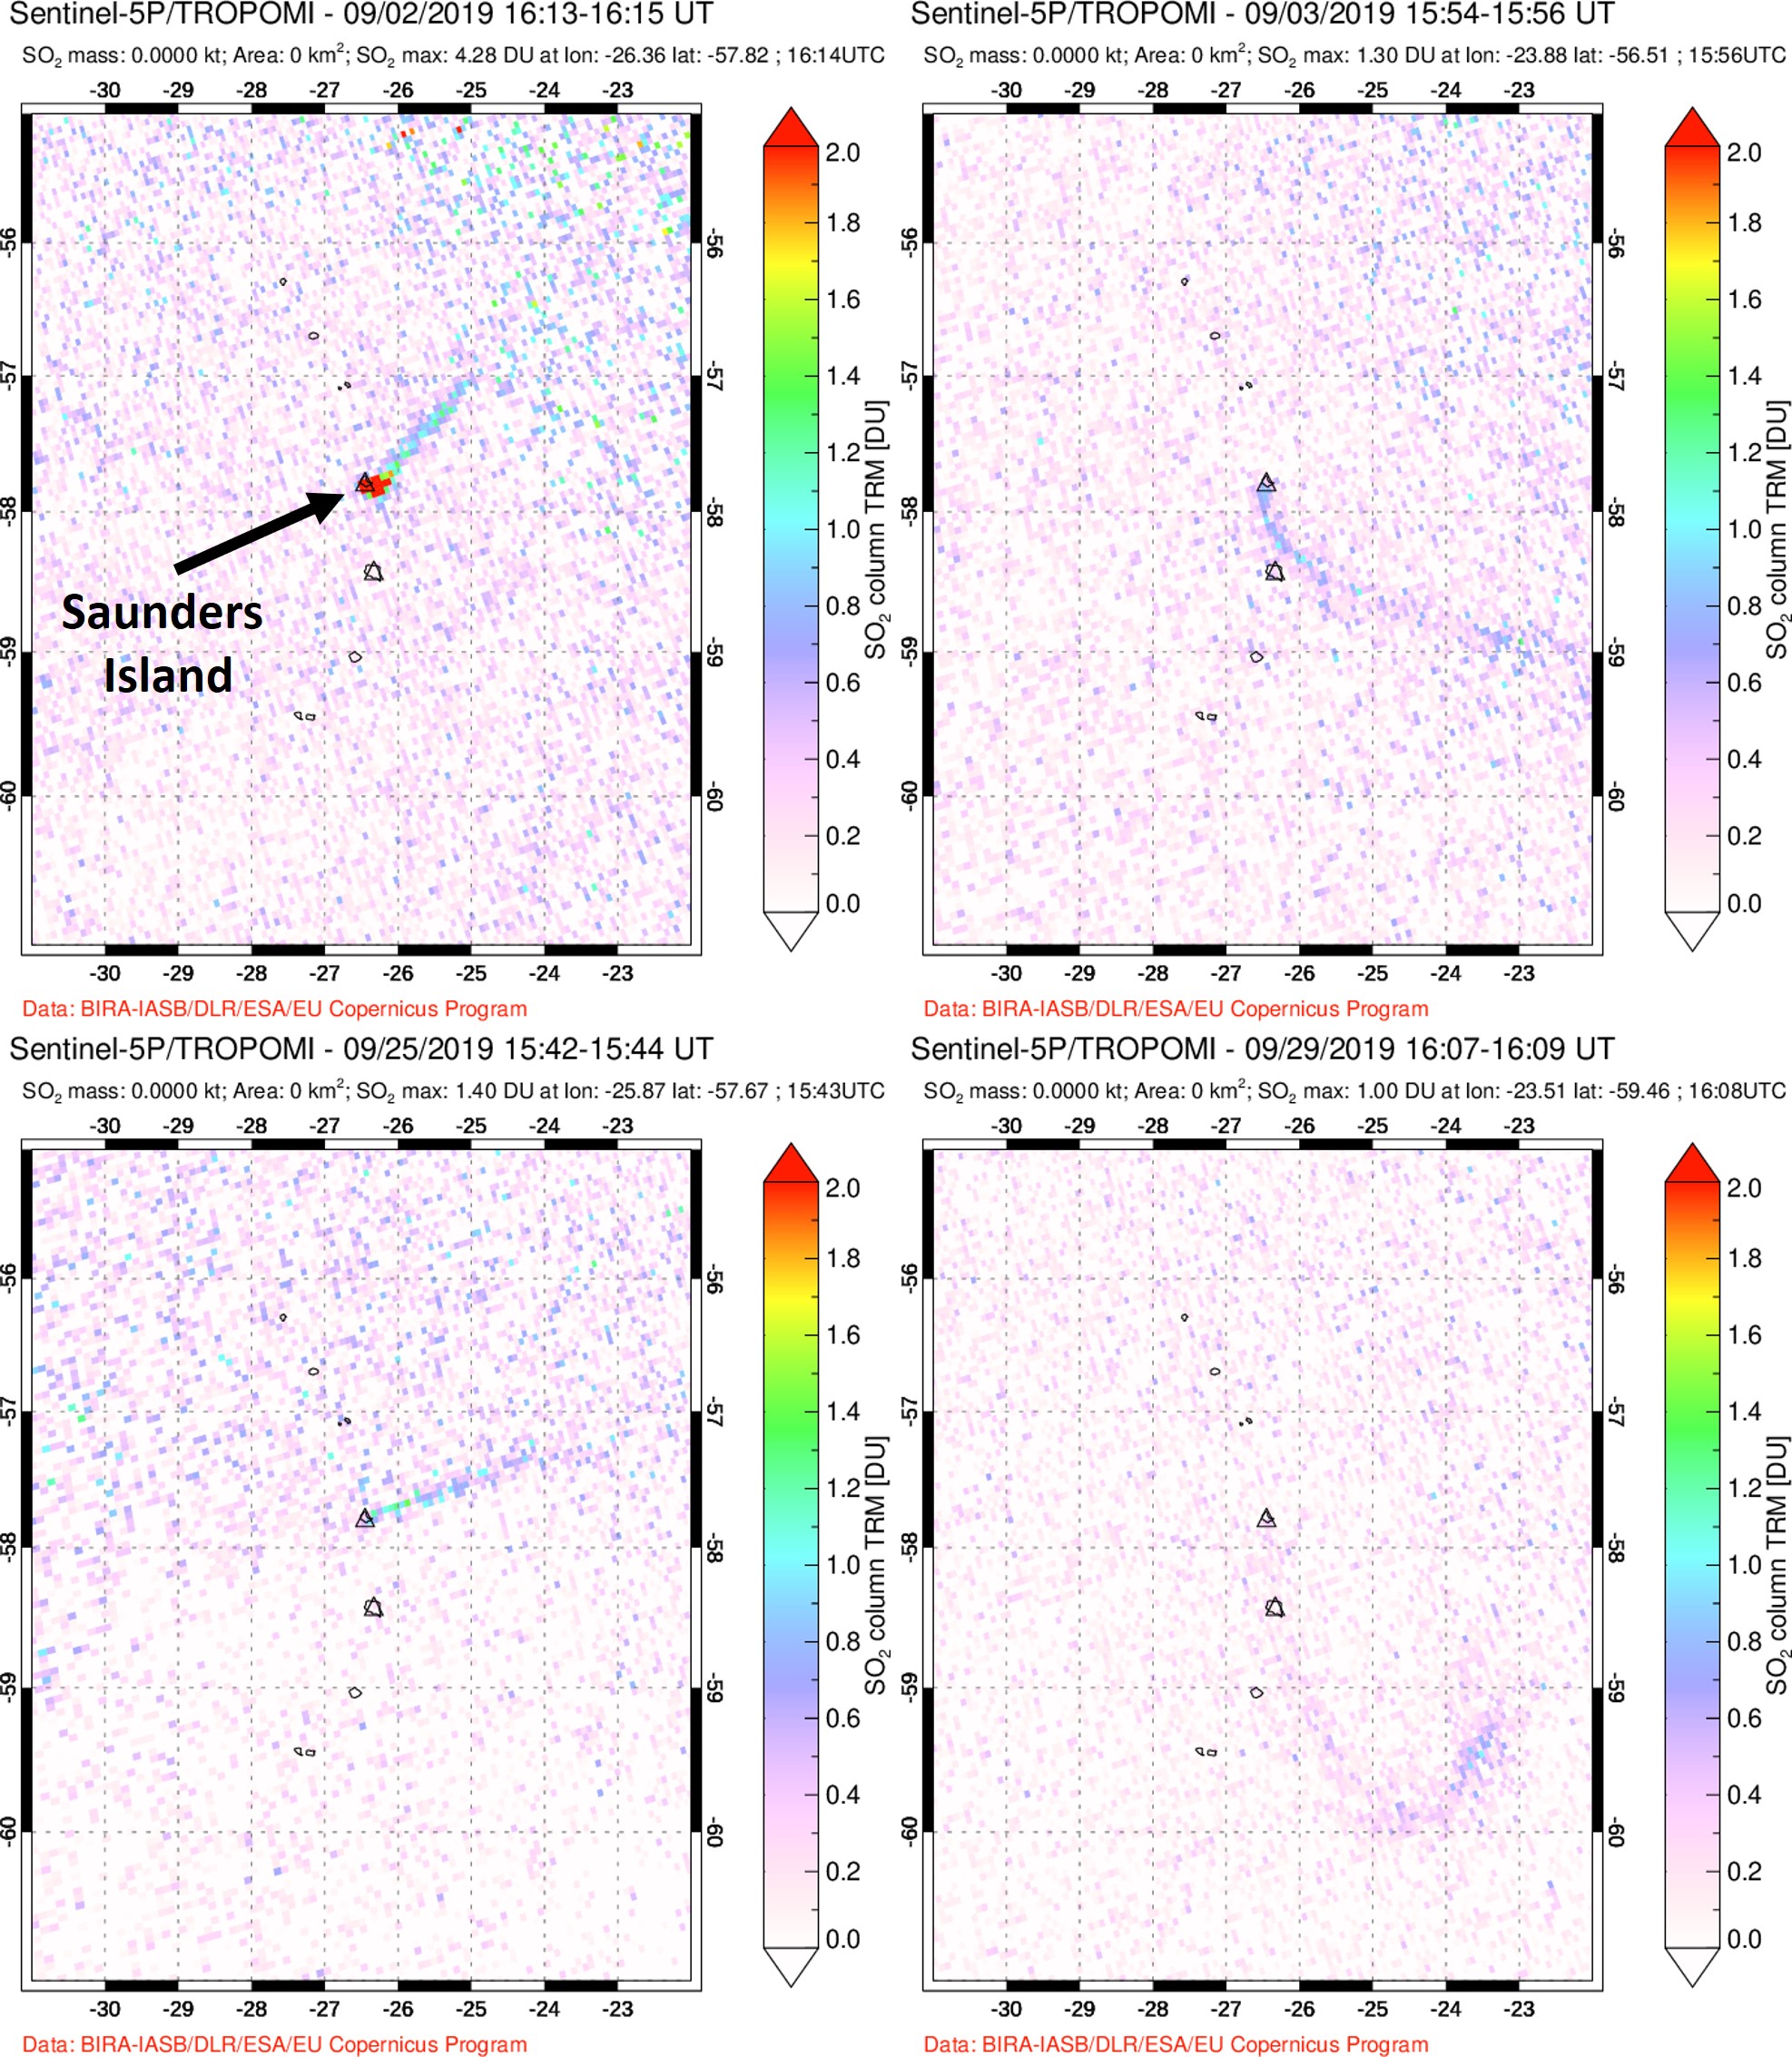 |
Figure 34. These images show data acquired by the TROPOspheric Monitoring Instrument (TROPOMI) that demonstrate detected SO2 (sulfur dioxide) from Mount Michael on Saunders Island on 2, 3, 25, and 29 September 2019. These are examples of gas plumes through the month with wind dispersing the plumes in different directions. Courtesy of NASA Global Sulfur Dioxide Monitoring Page. |
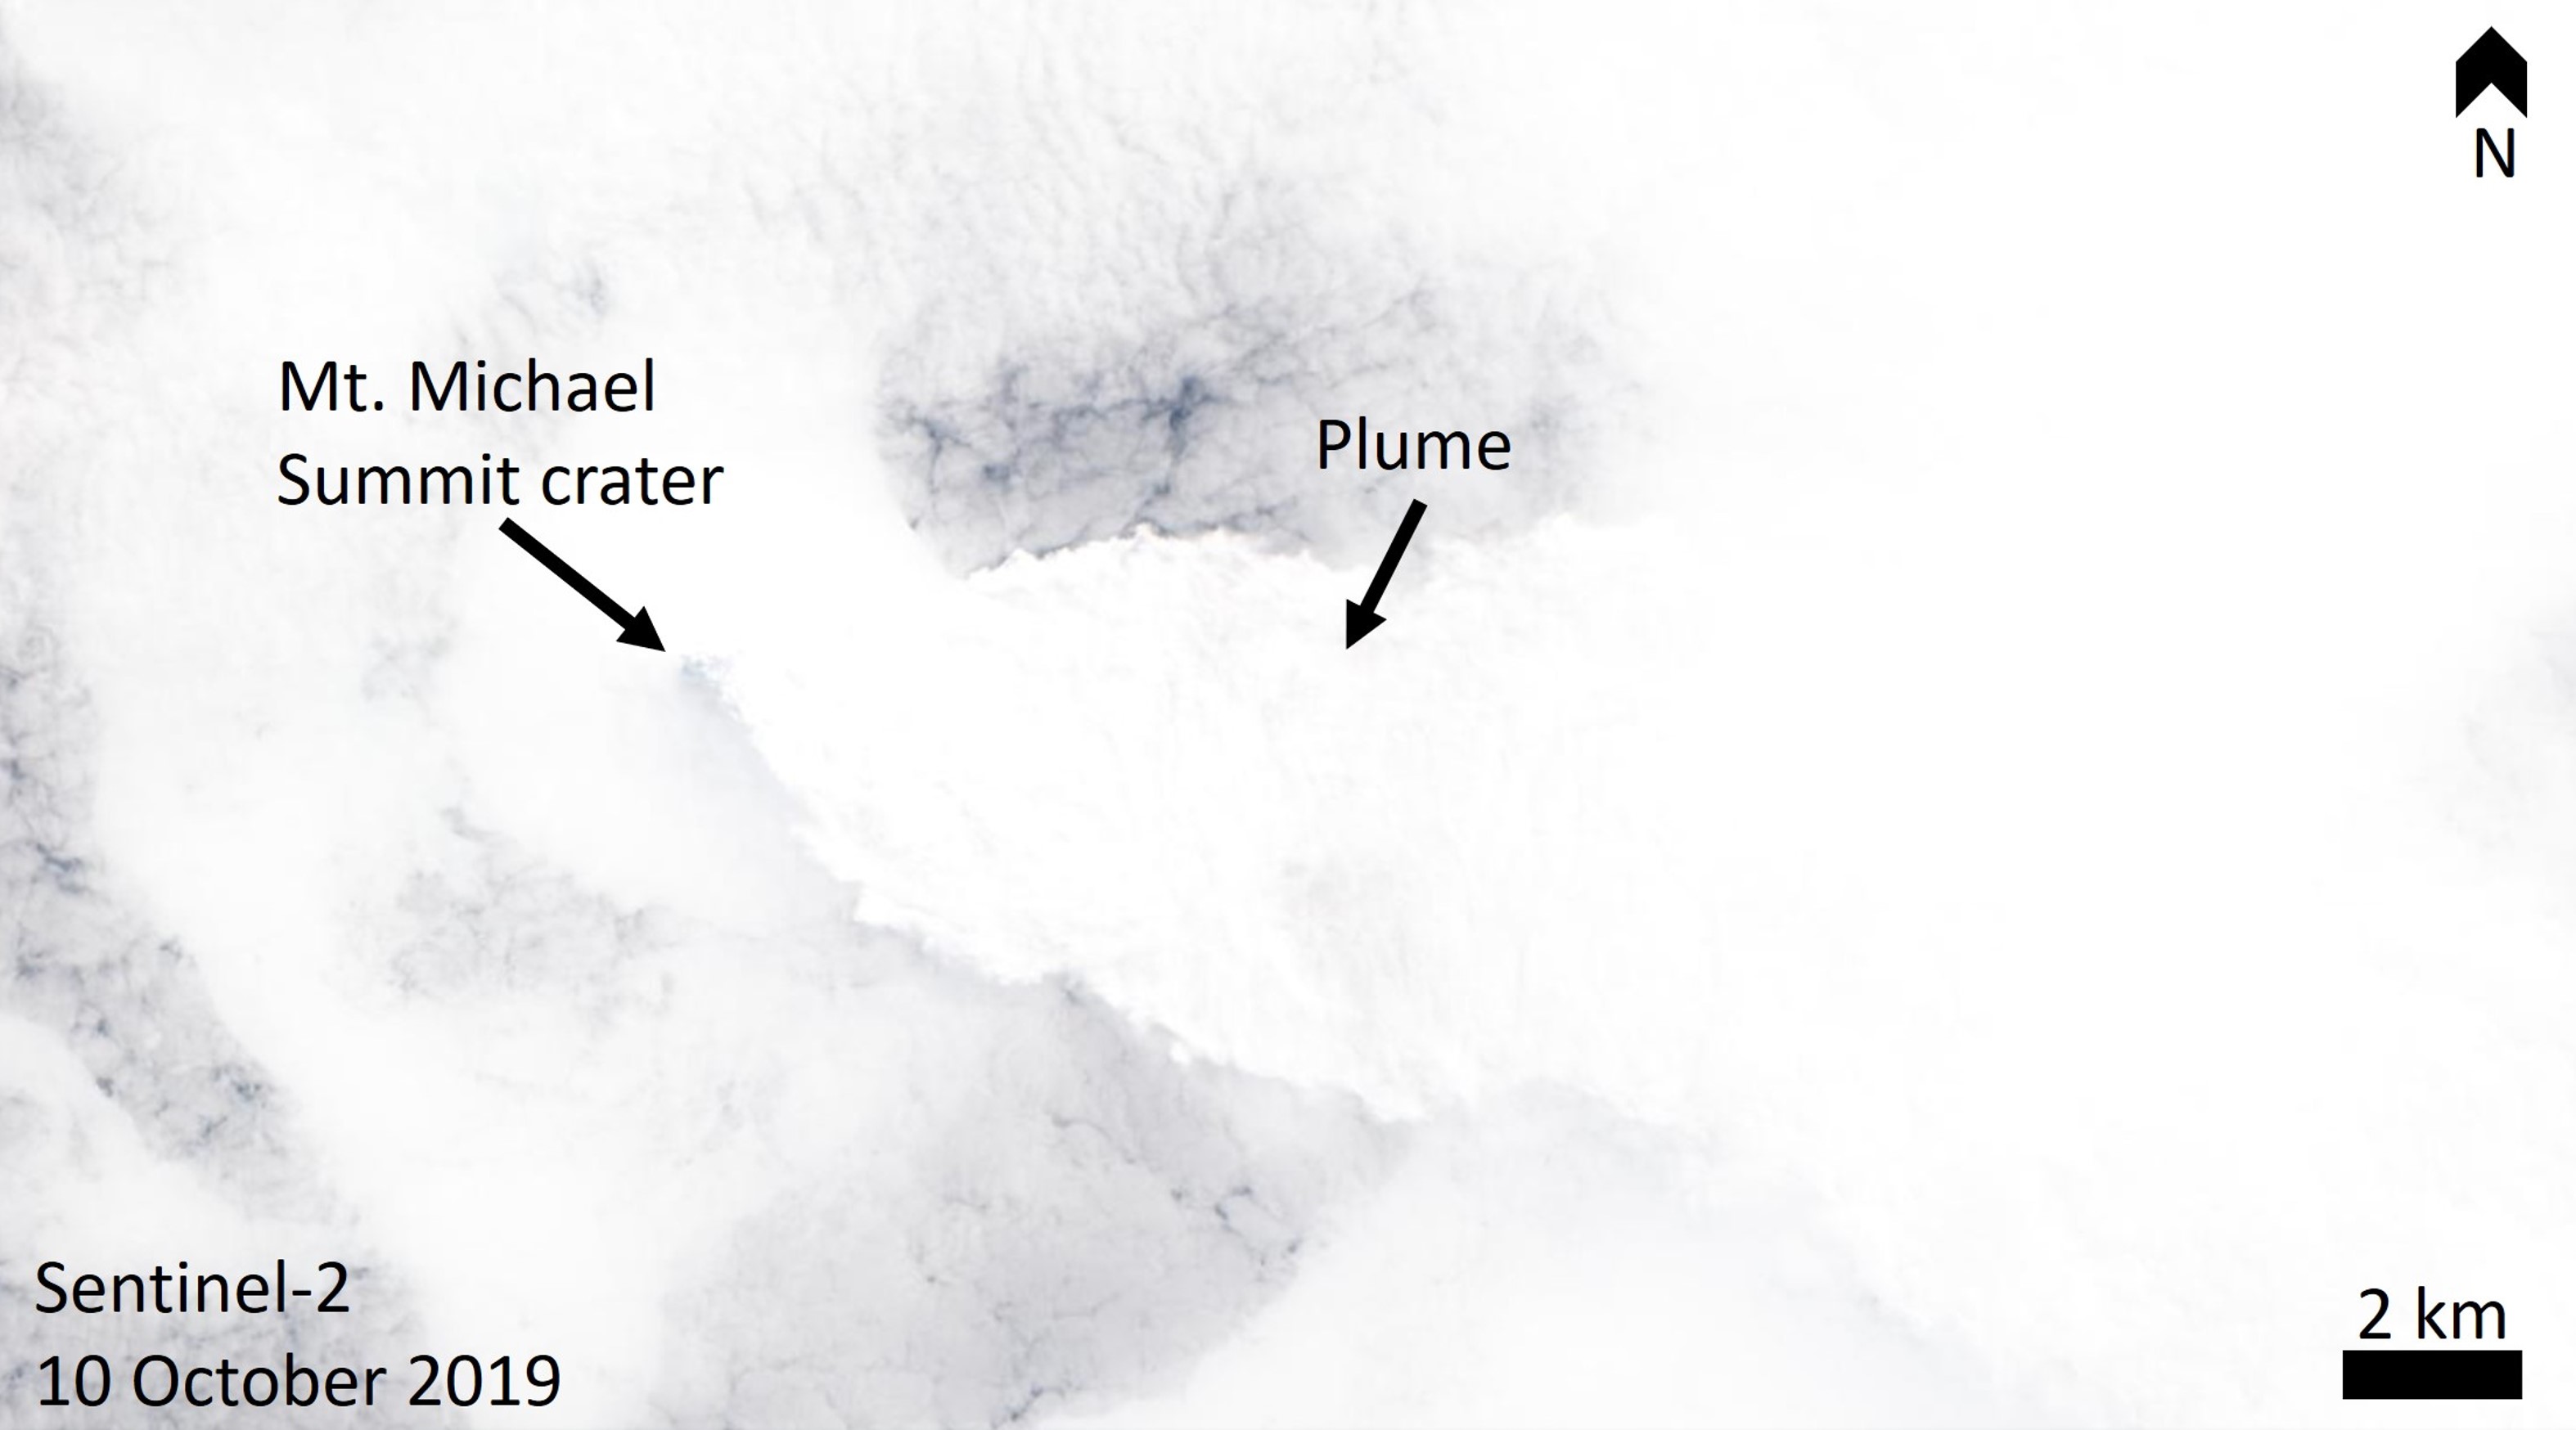 |
Figure 35. This 10 October 2019 satellite image shows Saunders Island and the surrounding area with light cloud cover, and a condensed gas-and-steam plume from the summit crater drifting towards the E to SE. Sentinel-2 image with Natural color (bands 4, 3, 2) rendering. Courtesy of Planet Labs. |
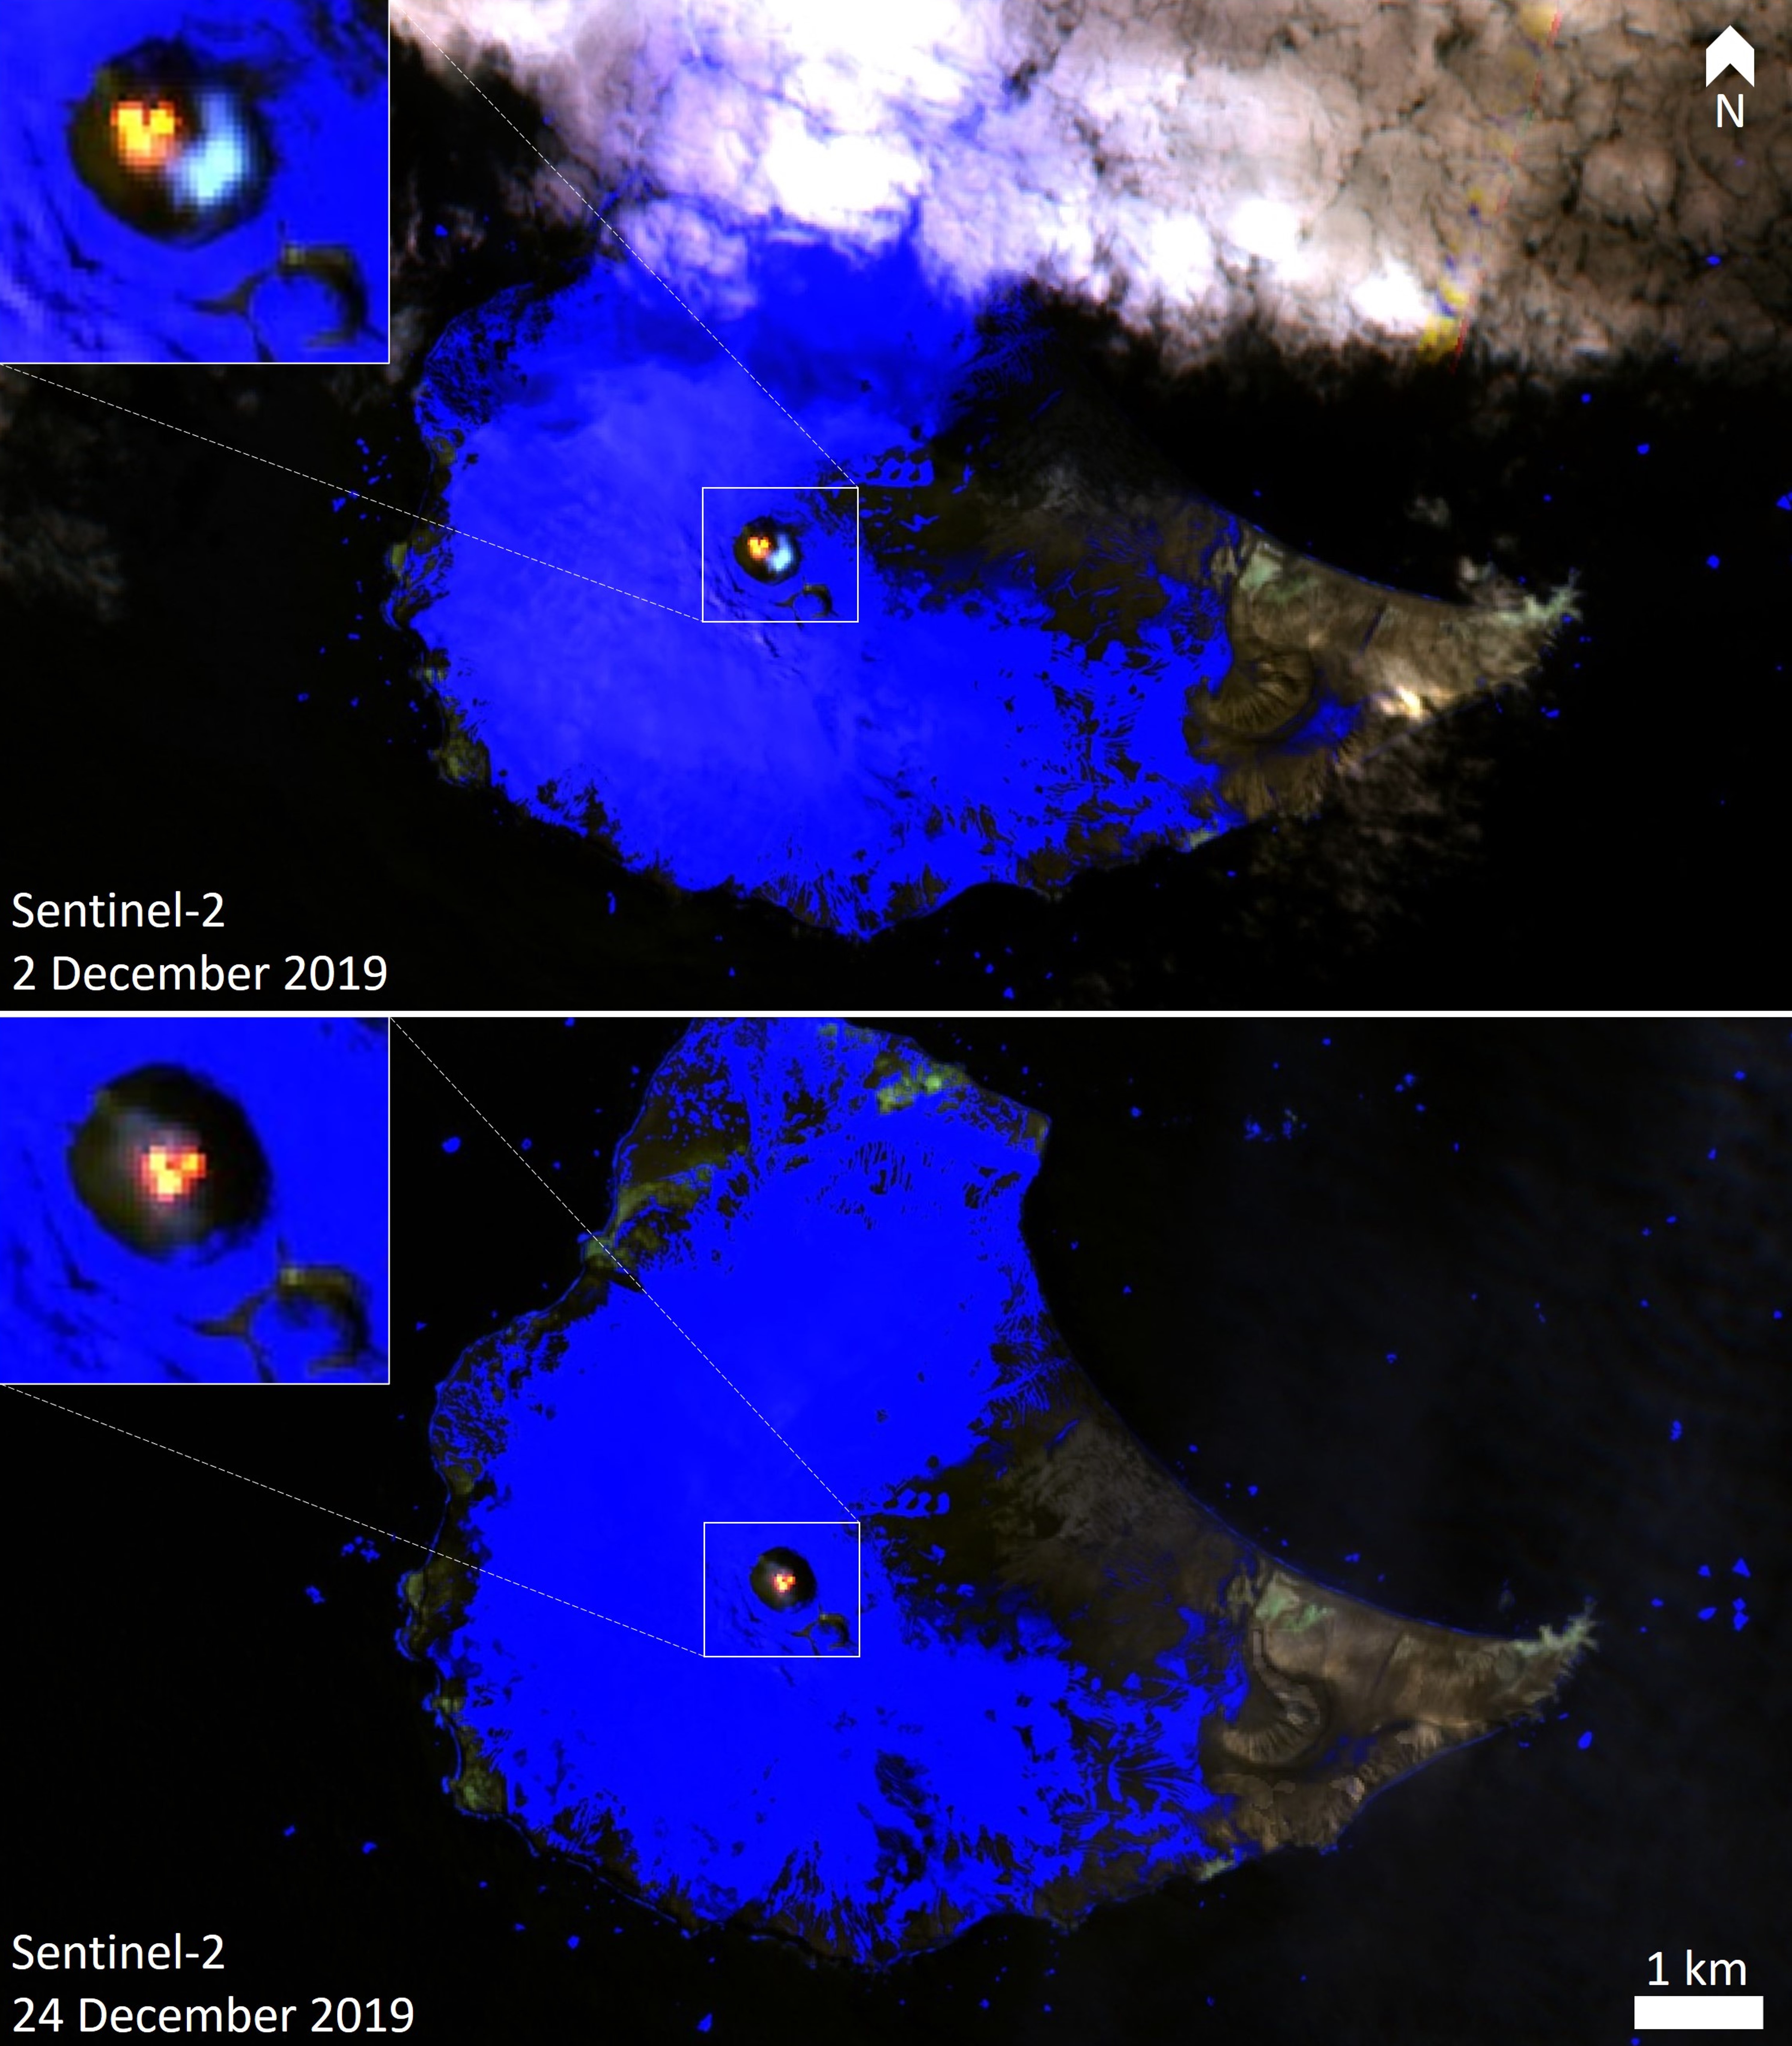 |
Figure 36. These two Sentinel-2 thermal satellite images of Saunders Island acquired on 2 and 24 December 2019 show three distinct areas of elevated temperature within the Mount Michael summit crater (yellow to red). While the locations of the thermal anomalies look different in these images, the angle of the view into the crater is not specified. Blue is Ice, black is ocean water. Sentinel-2 image with False color (Urban) (bands 12, 11, 4) rendering. Courtesy of Sentinel Hub Playground. |
Activity during January-May 2020. During January through May 2020 various remote sensing data showed the same activity as the previous seven months, with abundant cloud cover over the island. The Sentinel-2 satellite imaged a vertical plume on 13 March rising then being dispersed NE (figure 37). Intermittent observations of SO2 plumes continued through TROPOMI data analysis (figure 38). A clear view of the summit area on 29 May showed the ice-free active summit crater producing a weak gas-and-steam plume, and ash deposition on the NE to SE upper flanks (figure 39).
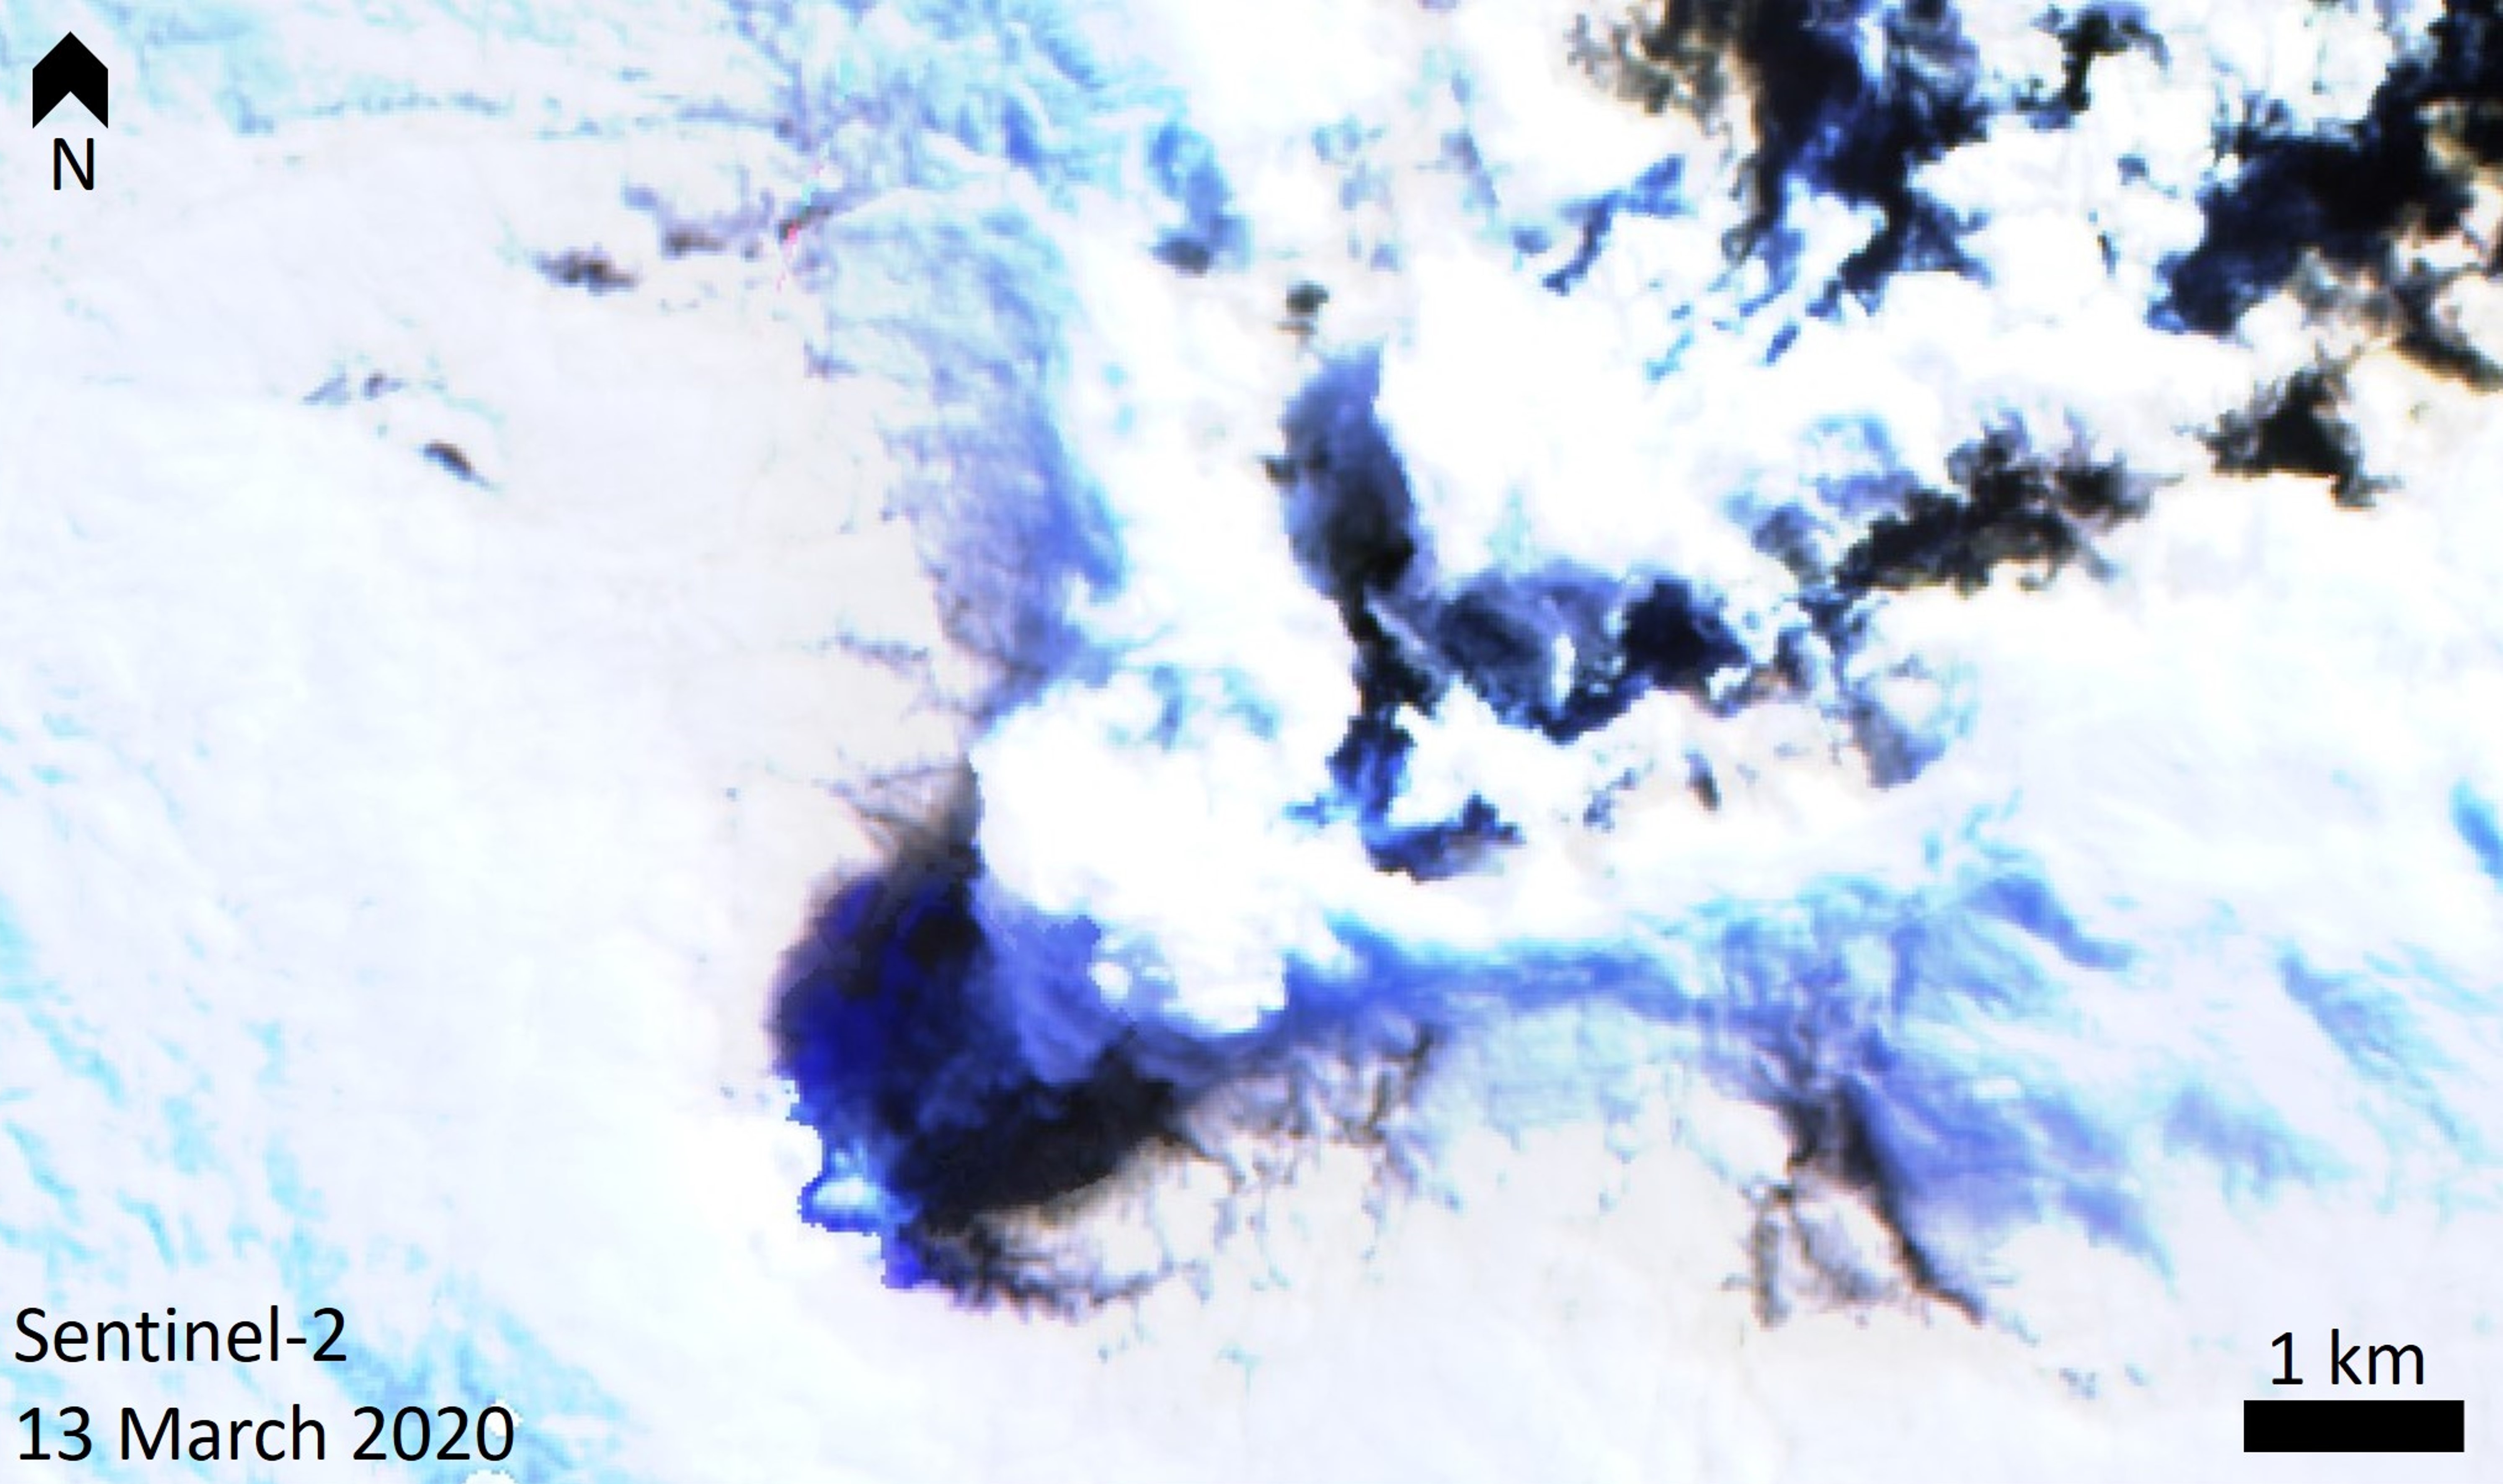 |
Figure 37. This Sentinel-2 satellite image of the Mount Michael summit area on Saunders Island with a gas-and-steam plume rising from the summit crater above the cloud cover, and dispersing NE. The plume and clouds are casting dark shadows below them. Sentinel-2 image with False color (Urban) (bands 12, 11, 4) rendering. Courtesy of Sentinel Hub Playground. |
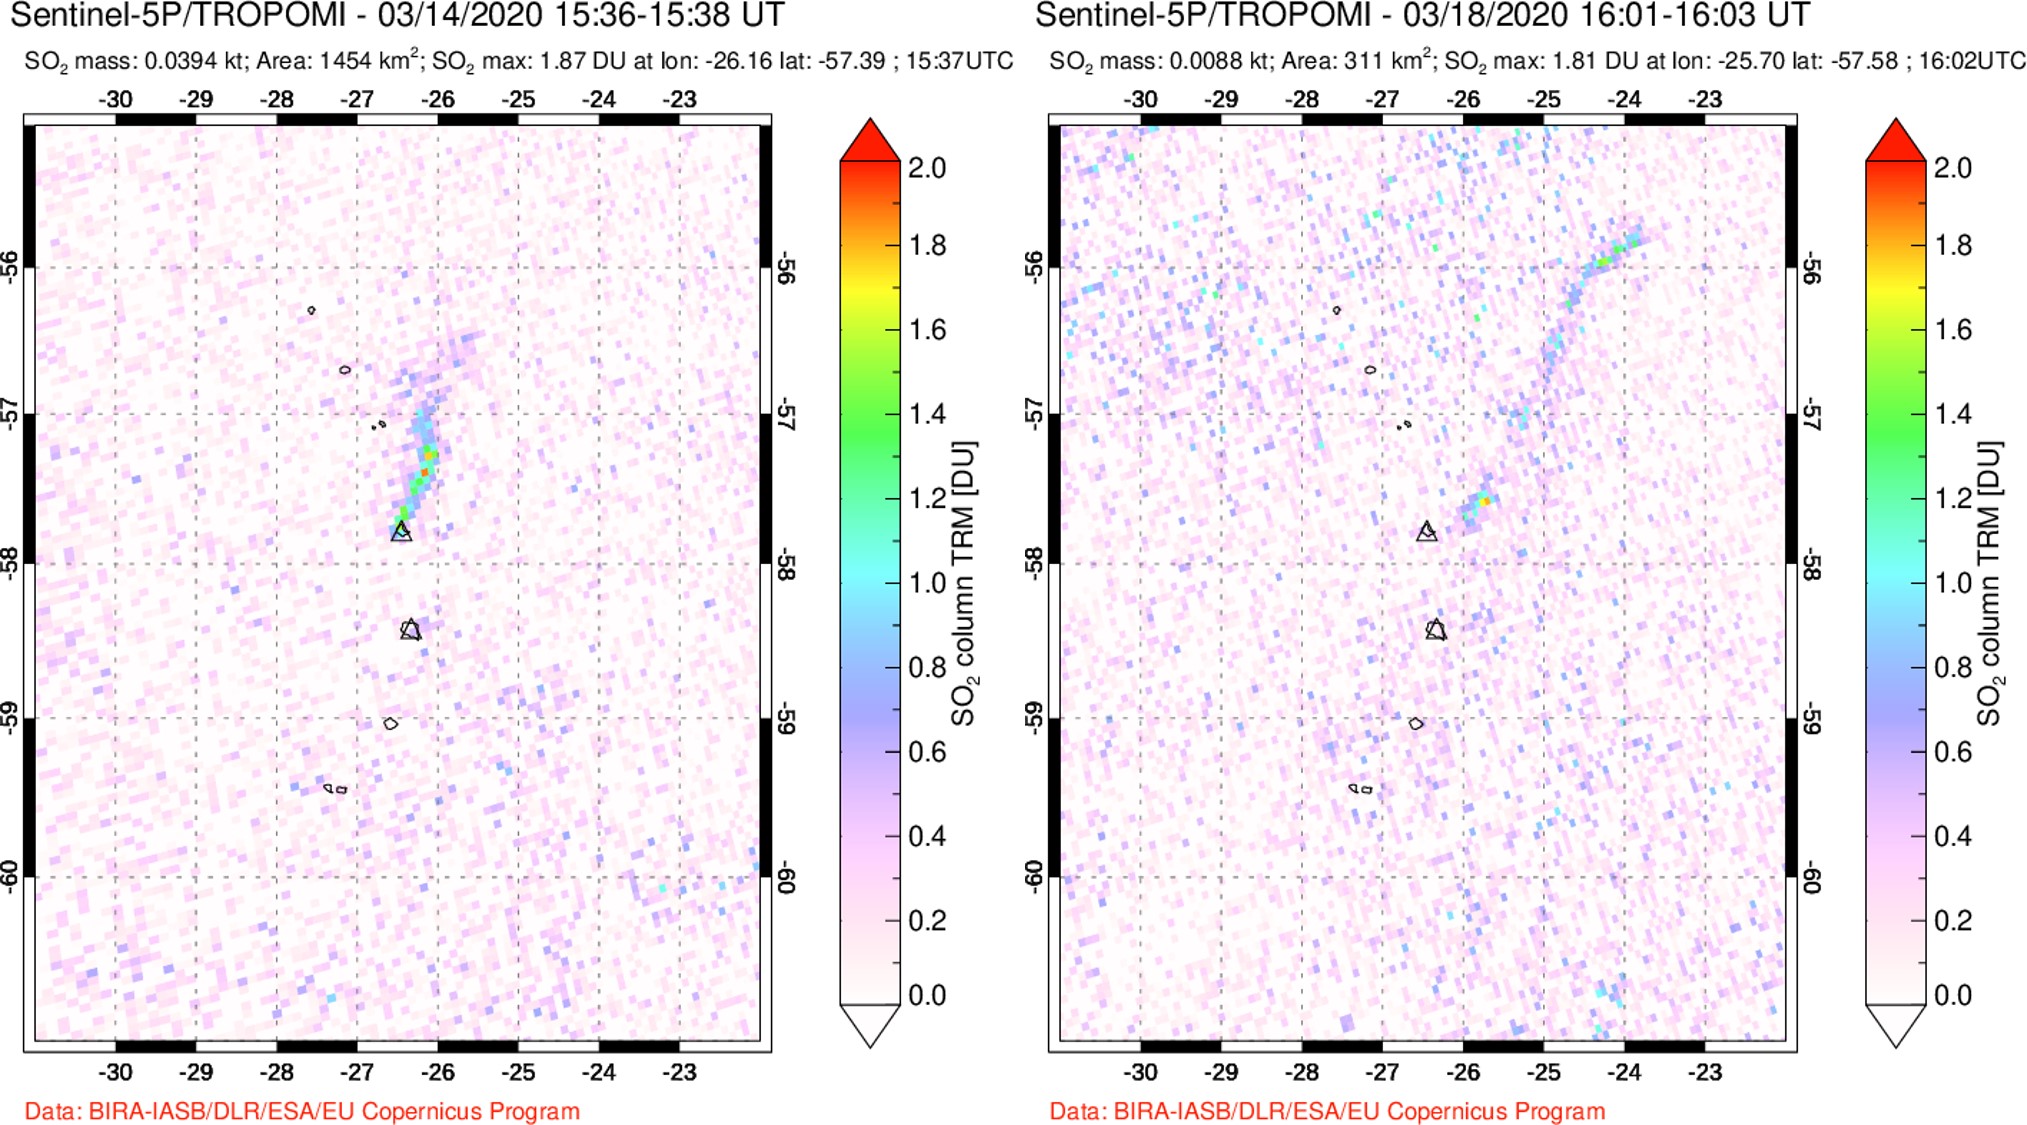 |
Figure 38. Examples of SO2 gas plumes originating from Saunders detected by the TROPOMI instrument on 14 and 18 March 2020. The plumes are dispersing N to NNE. Courtesy of NASA Global Sulfur Dioxide Monitoring Page. |
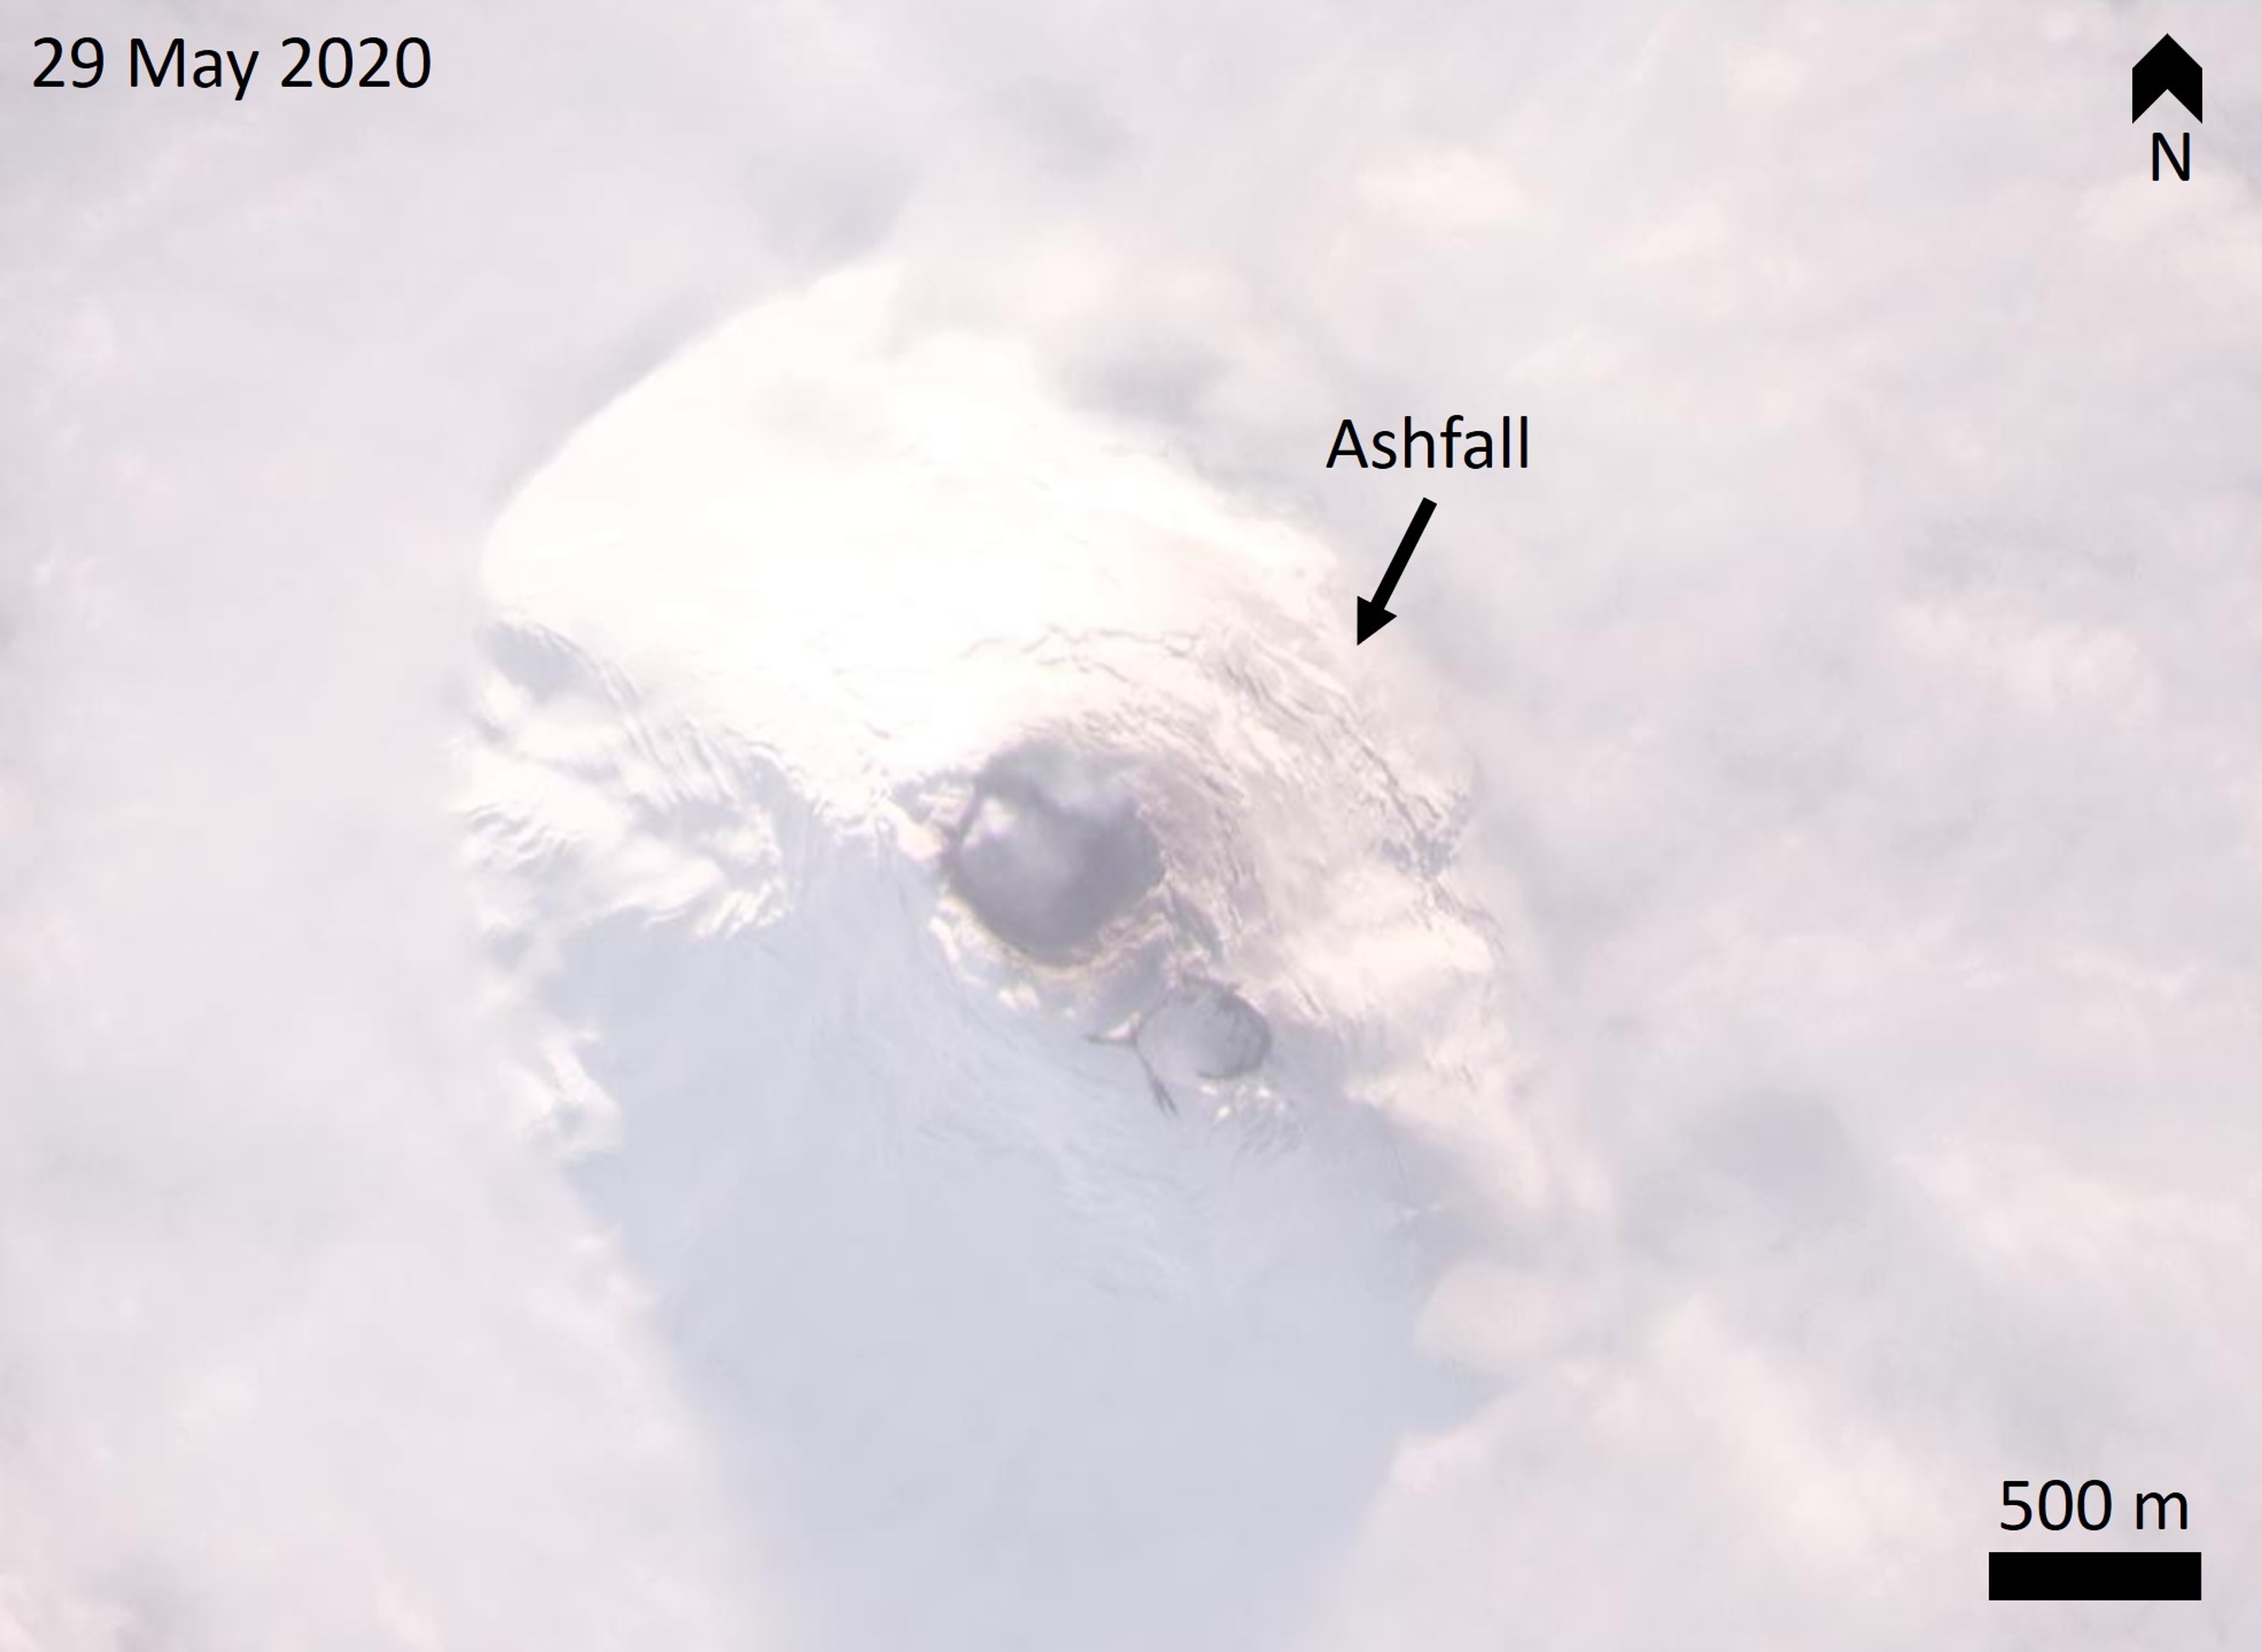 |
Figure 39. This 29 May 2020 Planet Scope satellite image shows the summit area of Mount Michael above cloud cover with the active summit crater and the old crater to the SE. There is a weak gas plume rising from the crater and ashfall on the upper E flank. Courtesy of Planet Labs. |
Research expedition in January 2020. The team of the 2020 Pelagic Australis expedition visited the island on 5-8 January 2020, with shore landings on the last three days, to quantify gas emissions from the island. The following information is from the published expedition results (Liu et al., 2021), with photos supplied by volcanologist Emma Liu.
Across the South Sandwich islands they used a combination of a ground-based and drone-mounted gas detectors (Multi-GAS), a UV imaging camera, sample collection, and NDIR spectrometer analyses to quantify gas output. They confirmed that the summit crater is a persistent source of gas emissions with 145 ± 59 tons per day of SO2 and a CO2 flux of 179 ± 76 tons per day. On the 5th they observed a vertical plume and on the 7th they observed the plume drifting down the E flank before rising (figure 40). They noted that the surface was steaming and was warm to the touch, suggesting widespread geothermal activity. The non-glaciated surfaces of the island contain tephra deposits, with units exposed by erosion and preserved within snow and ice (figure 41). Explosions have emplaced tephra layers across the island as well as ballistic blocks and bombs on the E flank (figure 42; Liu et al., 2021).
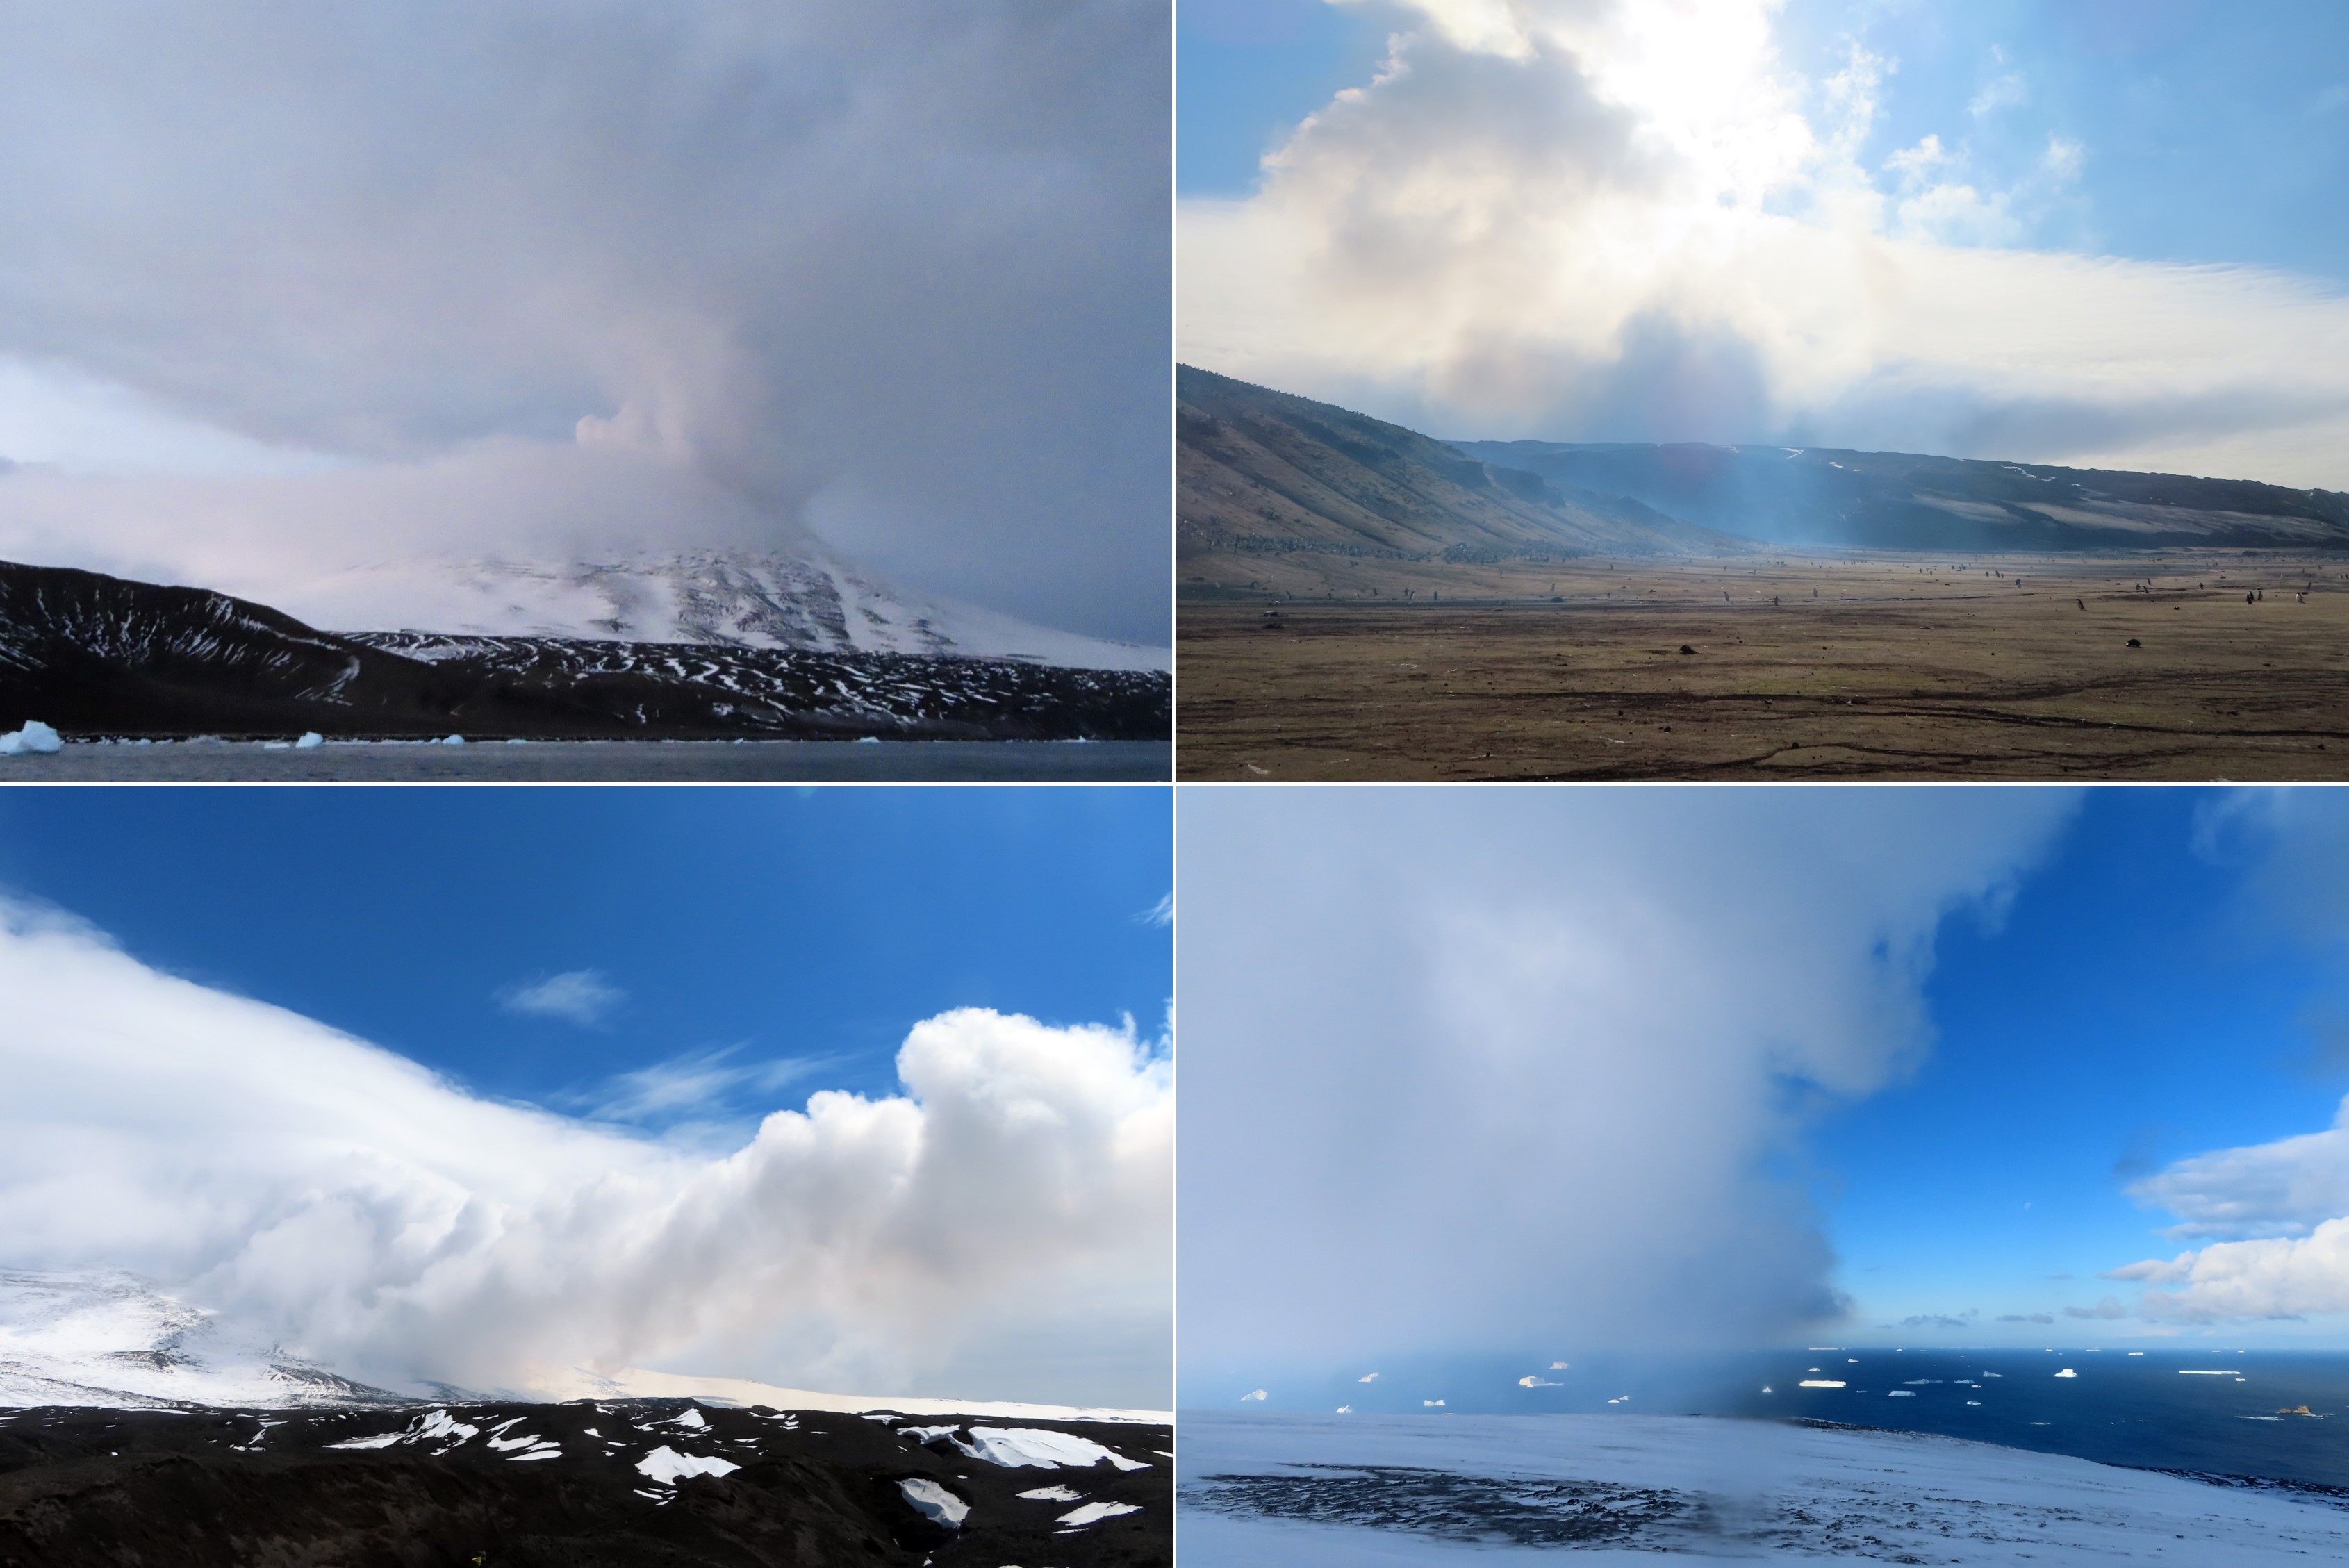 |
Figure 40. These images show the gas emissions from Mount Michael on Saunders Island in January 2020. The top right image is a vertical gas plume rising from the summit crater on the evening of the 5th. The two photos on the right are looking towards the E on the 7th. The bottom left image is a low-lying condensed gas plume on the 8th travelling down the E flank before rising. Courtesy of Emma Liu, and Liu et al. (2021). |
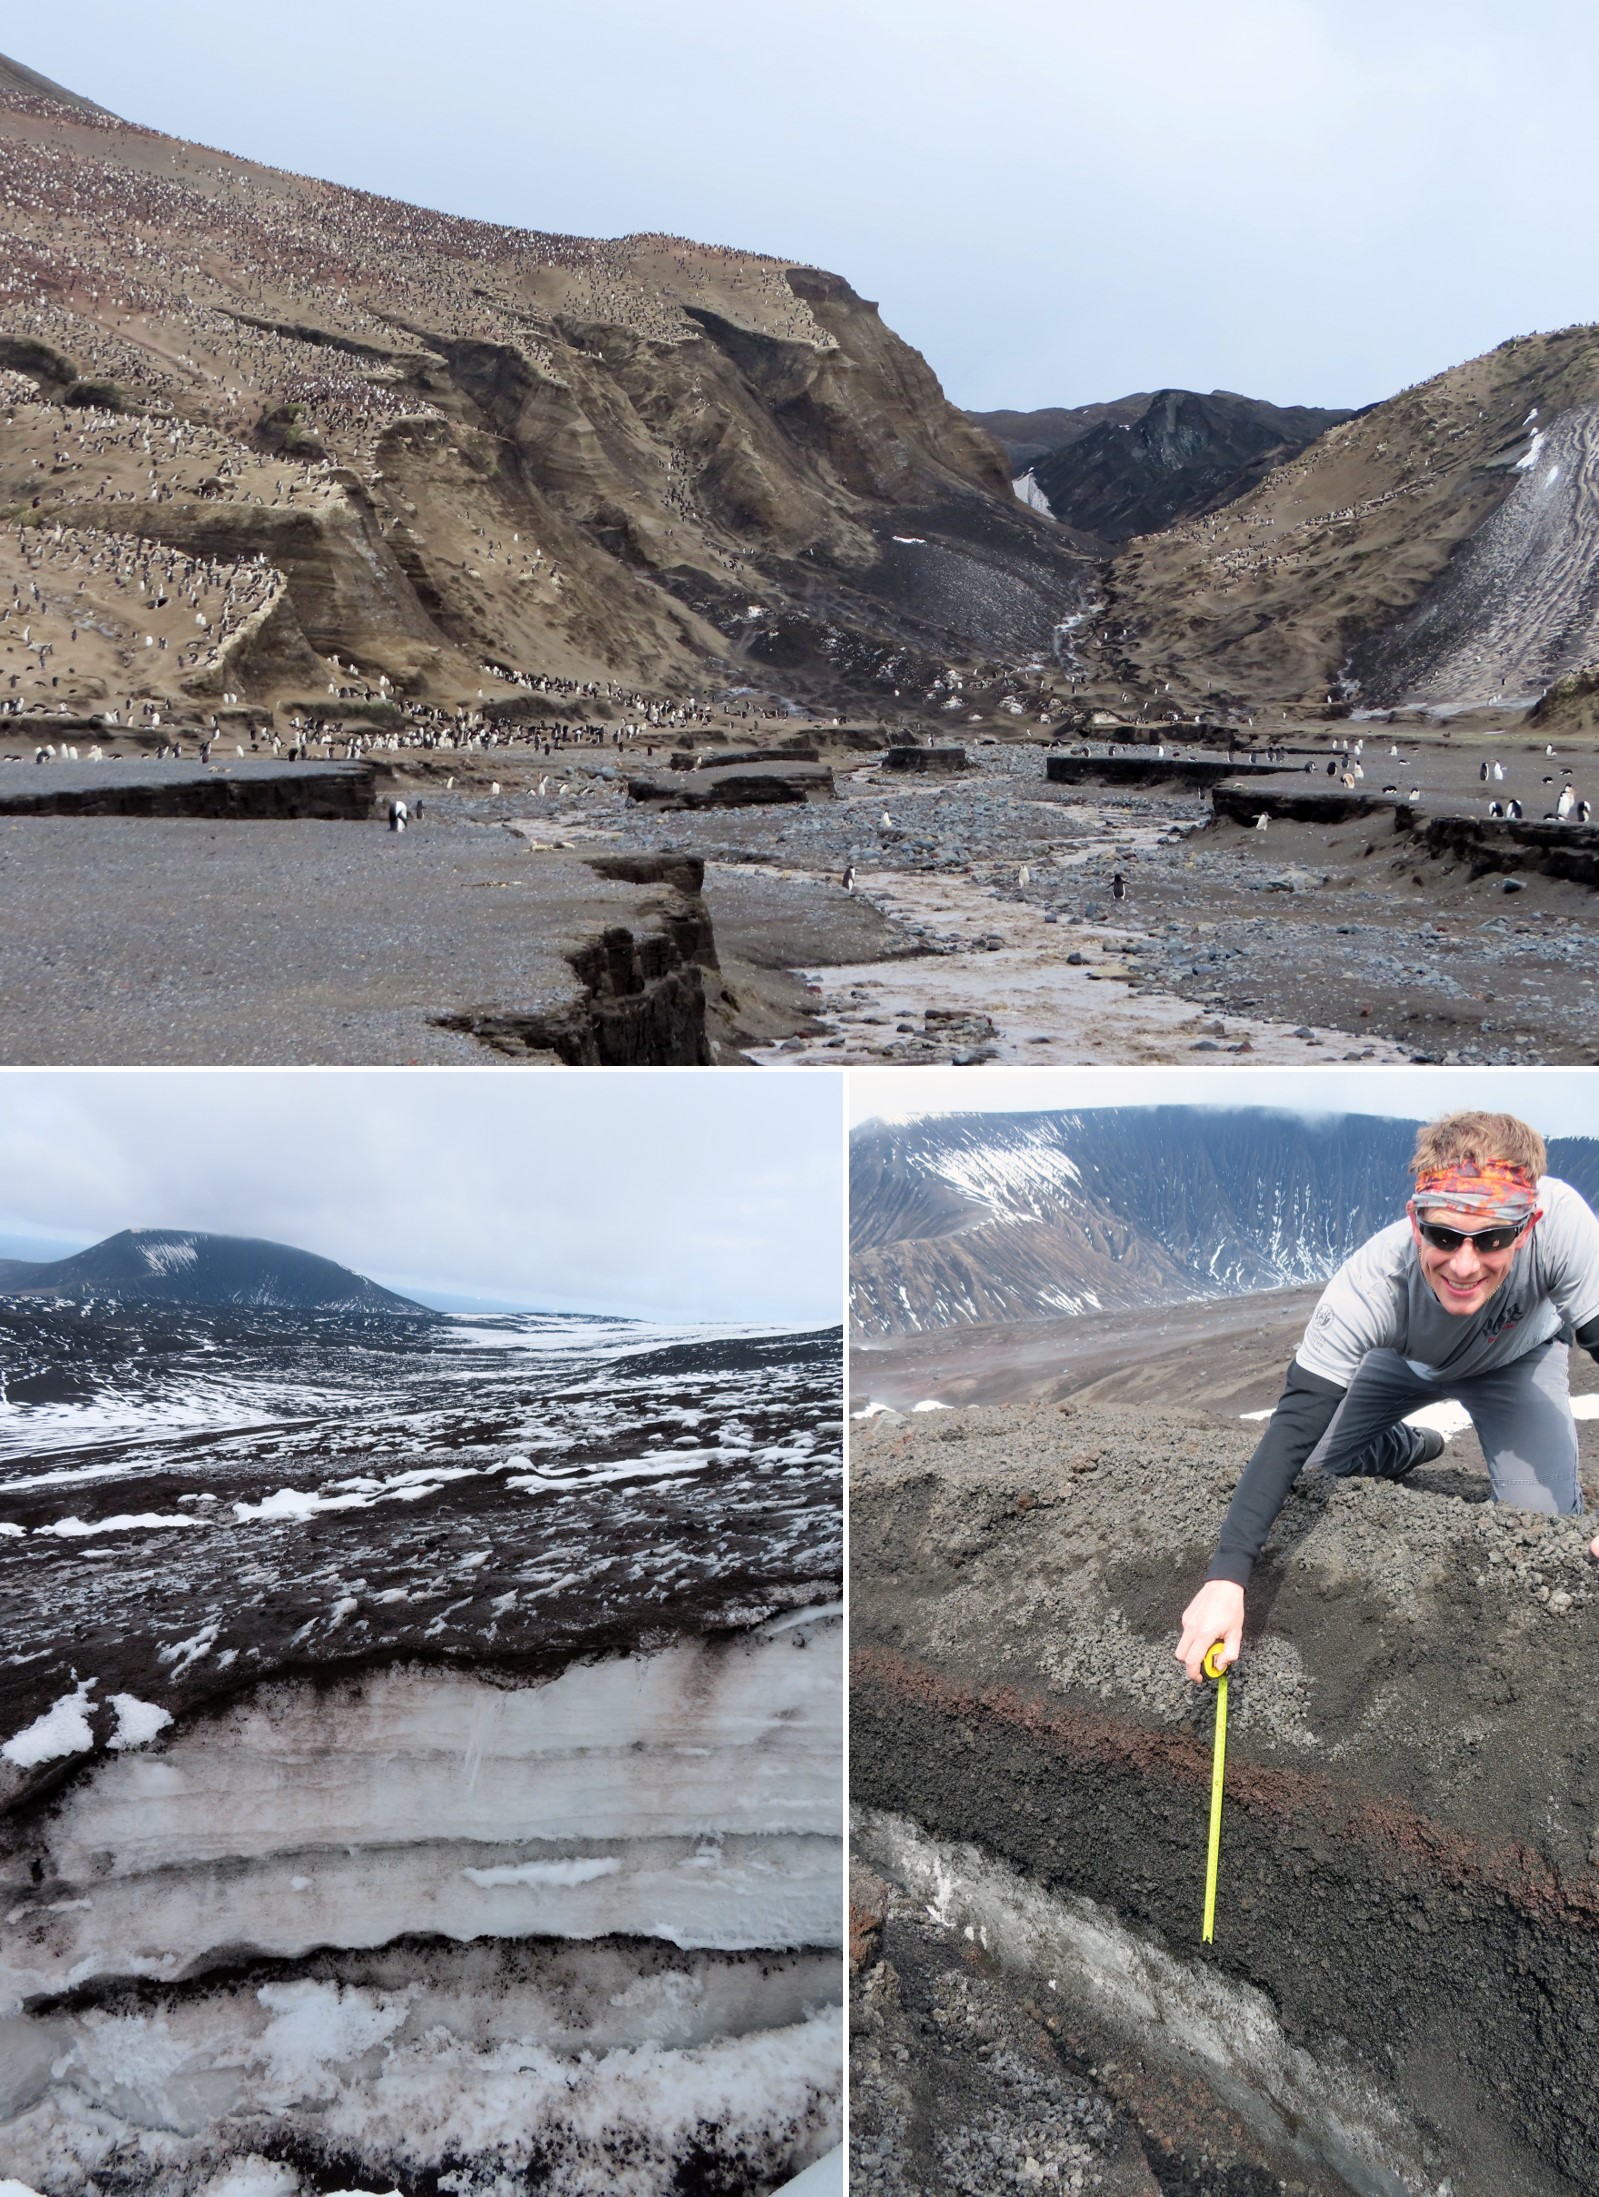 |
Figure 41. Tephra layers are preserved within the stratigraphy of snow and ice on Saunders Island. Scale shown by penguins (top) and volcanologist Kieran Wood (right). Photos courtesy of Emma Liu. |
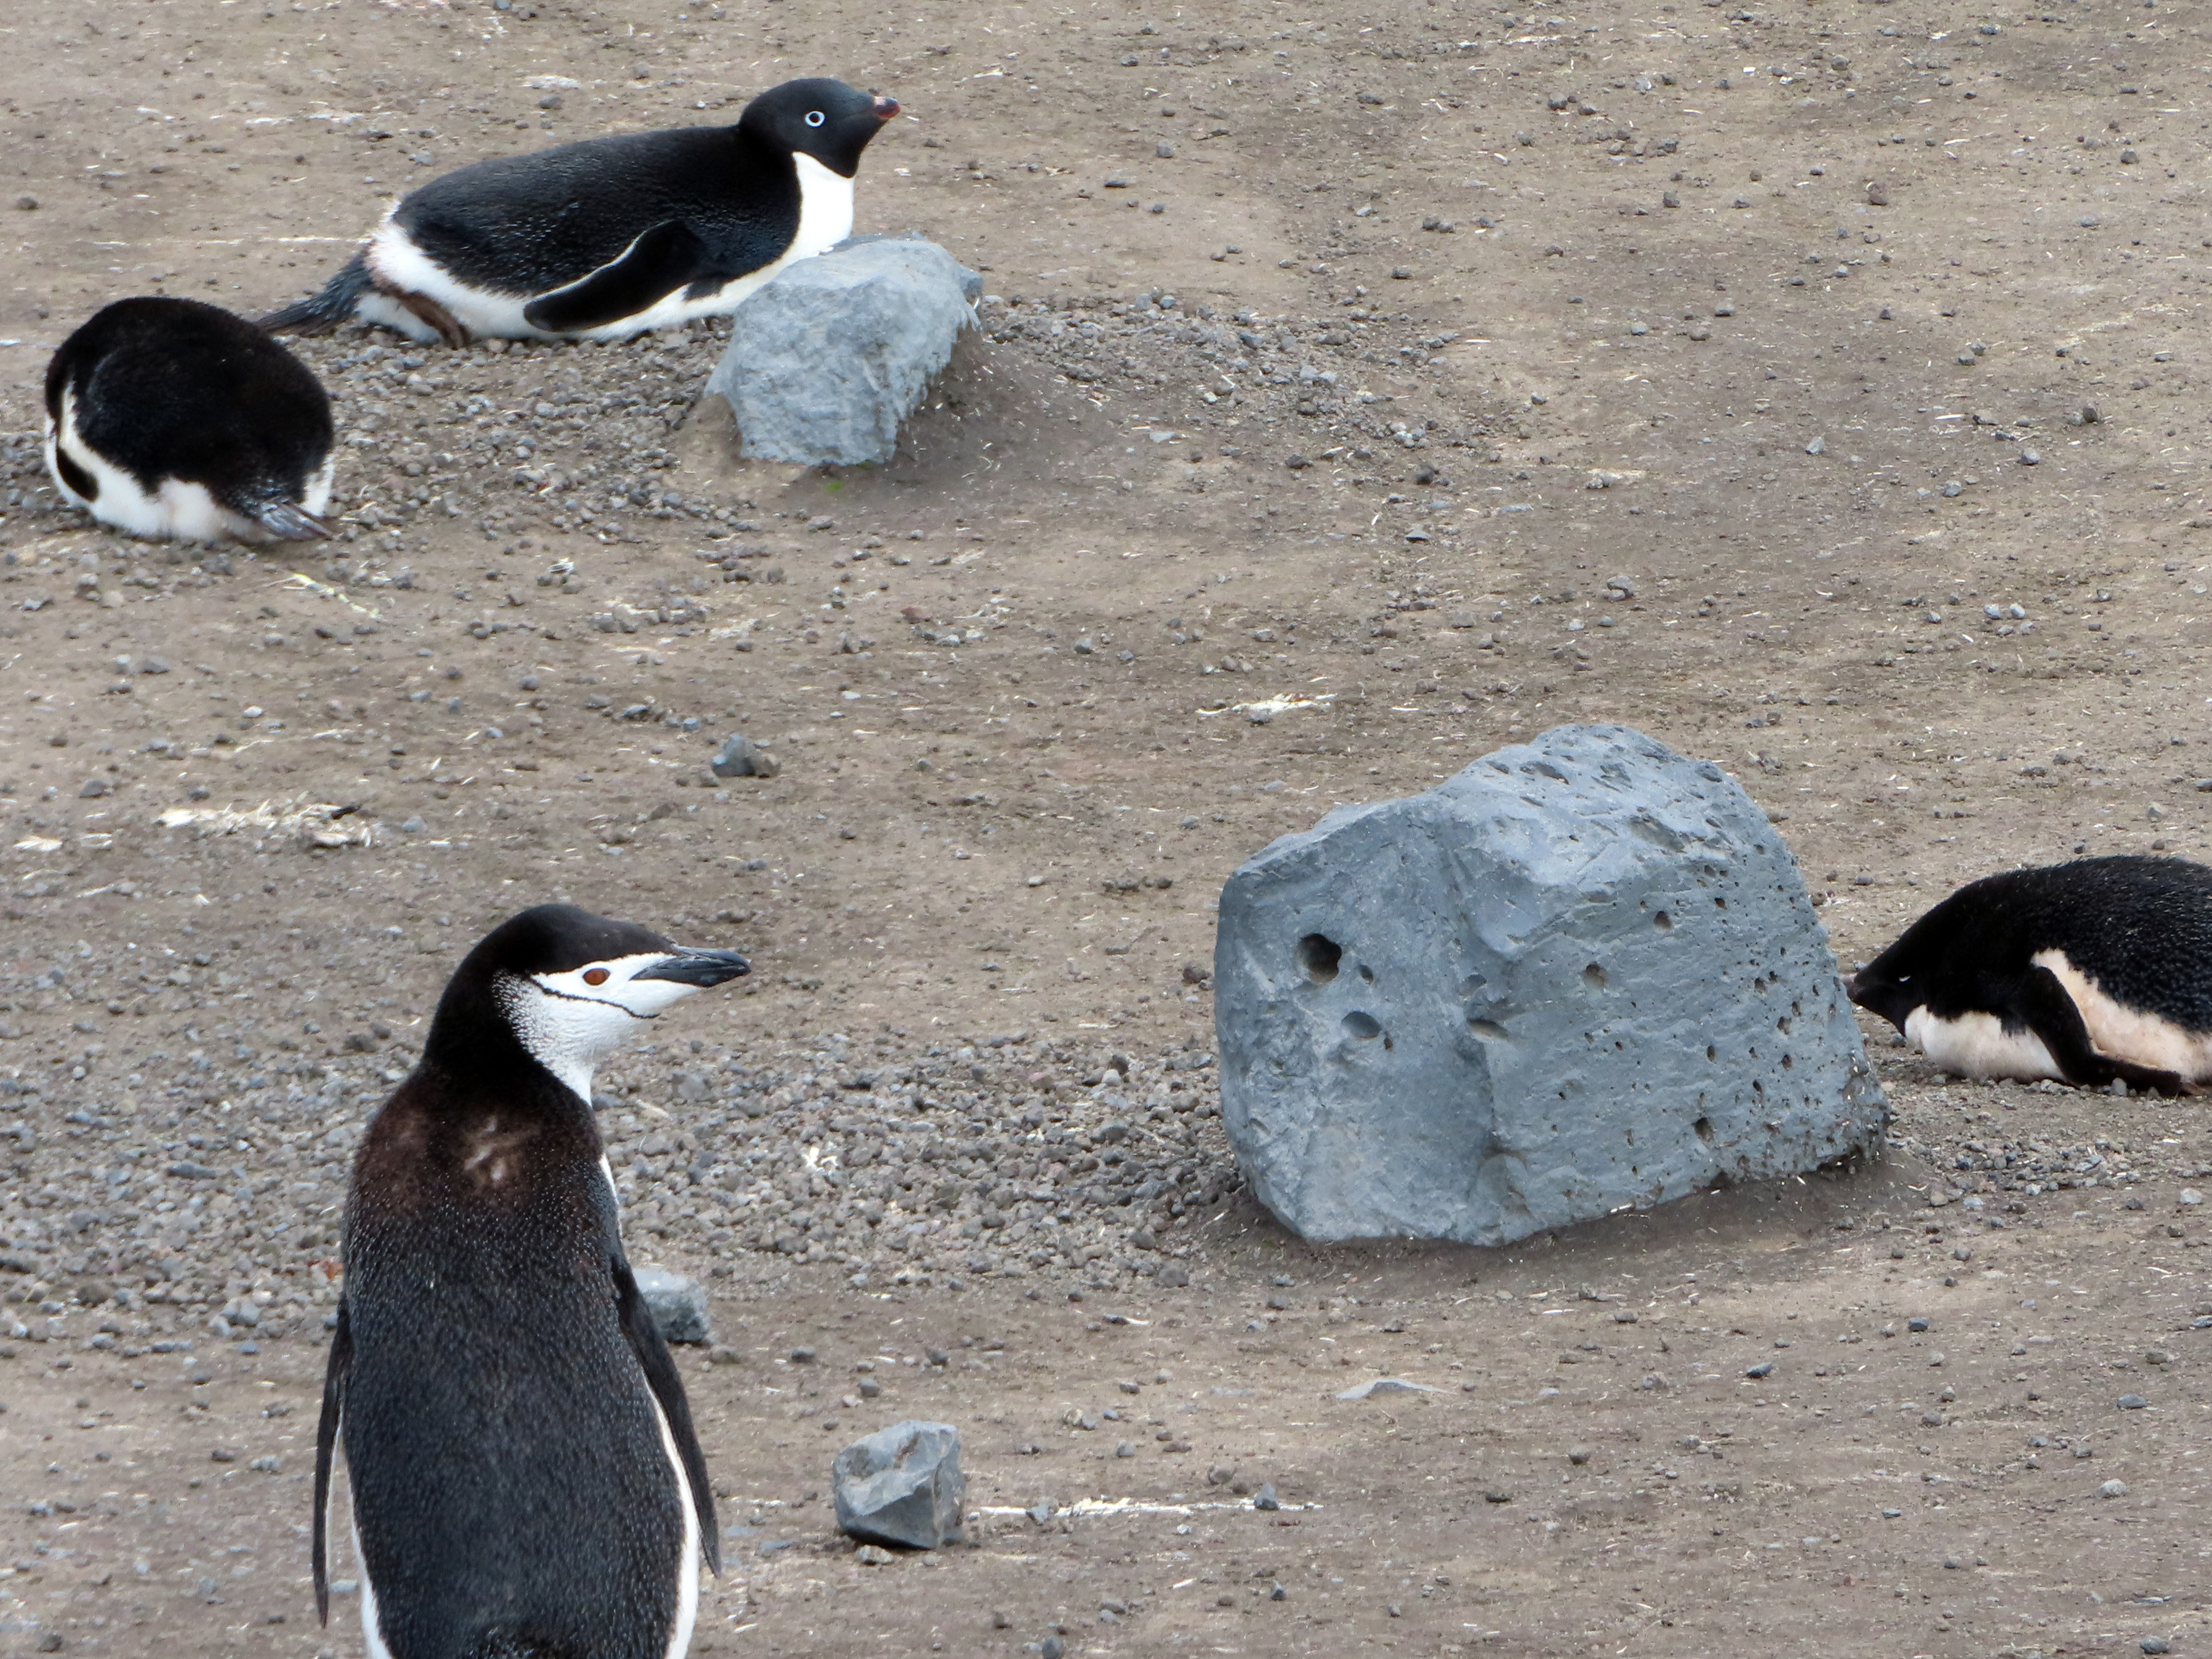 |
Figure 42. Dense volcanic blocks up to a meter in size are widespread on Saunders Island. The block in the foreground has a height of approximately 35 cm; the Chinstrap penguin in the foreground is around 50 cm tall. Courtesy of Emma Liu and Liu et al. (2021). |
References: Liu E J, Wood K, Aiuppa A, Giudice G, Bitetto M, Fischer T P, McCormick Kilbride B T, Plank T, Hart T, 2021. Volcanic activity and gas emissions along the South Sandwich Arc. Bull Volcanol 83. https://doi.org/10.1007/s00445-020-01415-2
LeMasurier W E, Thomson J W, Baker P E, Kyle P R, Rowley P D, Smellie J L, Verwoerd W J, 1990. Volcanoes of the Antarctic Plate and Southern Ocean. American Geophysical Union, Washington, D.C.
Lachlan-Cope T, Smellie J L, Ladkin R, 2001. Discovery of a recurrent lava lake on Saunders Island (South Sandwich Islands) using AVHRR imagery. J. Volcanol. Geotherm. Res. 112: 105-116.
Gray D M, Burton-Johnson A, Fretwell P T, 2019. Evidence for a lava lake on Mt. Michael volcano, Saunders Island (South Sandwich Islands) from Landsat, Sentinel-2 and ASTER satellite imagery. J. Volcanol. Geotherm. Res. 379:60-71. https://doi.org/10.1016/j.volgeores.2019.05.002
Derrien A, Richter N, Meschede M, Walter T, 2019. Optical DSLR camera- and UAV footage of the remote Mount Michael Volcano, Saunders Island (South Sandwich Islands), acquired in May 2019. GFZ Data Services. http://doi.org/10.5880/GFZ.2.1.2019.003
Patrick M R, Smellie J L, 2013. Synthesis A spaceborne inventory of volcanic activity in Antarctica and southern oceans, 2000–10. Antarct Sci 25:475–500. https://doi.org/10.1017/S0954102013000436
Information Contacts: Emma Liu, University College London, Kathleen Lonsdale Building, 5 Gower Place, London, WC1E 6BS, United Kingdom; Global Sulfur Dioxide Monitoring Page, Atmospheric Chemistry and Dynamics Laboratory, NASA Goddard Space Flight Center (NASA/GSFC), 8800 Greenbelt Road, Goddard, Maryland, USA (URL: https://so2.gsfc.nasa.gov/); MIROVA (Middle InfraRed Observation of Volcanic Activity), a collaborative project between the Universities of Turin and Florence (Italy) supported by the Centre for Volcanic Risk of the Italian Civil Protection Department (URL: http://www.mirovaweb.it/); Planet Labs, Inc. (URL: https://www.planet.com/); Sentinel Hub Playground (URL: https://www.sentinel-hub.com/explore/sentinel-playground).
Intermittent thermal anomalies and some gas-and-steam emissions during June 2020-January 2022
Saunders Island, located in the remote South Sandwich Volcanic Arc in the South Atlantic, consists of a large central edifice intersected by two seamount chains. The primary volcanic features include Mount Michael, which contains a 500-m-wide summit crater, the northern Blackstone Plain, and the Ashen Hills, which is a group of overlapping craters formed through phreatomagmatic activity. The current eruption period began during November 2014, characterized by elevated crater temperatures and gas-and-steam emissions (BGVN 46:02). Visits are infrequent because of the remote location and often views are obscured by cloudy weather. This report updates information during June 2020 through January 2022 primarily using satellite data.
Activity has been relatively low since June 2020; no thermal activity was detected in satellite data until November 2020, when it occurred intermittently until February 2021, according to MIROVA data (figure 43). Although weather clouds often obscured the views of the summit, gas-and-steam emissions drifting NE were possibly visible in satellite images on 24 October 2020. A clear view of the crater on 6 November showed a strong thermal anomaly on the crater floor in infrared satellite imagery (figure 44). According to Suomi NPP/VIIRs sensor data, thermal anomalies were detected on 3 and 8 November 2020 and 11 January 2021. On clear weather days during late 2020 into 2021, anomalies were strongly observed in the summit crater at Mount Michael, based on Sentinel-2 infrared satellite imagery (figure 44). Small gas-and-steam emissions were detected on 10 January 2021. On 9 February a grayish plume drifted W from the summit crater, according to natural color satellite imagery (figure 44).
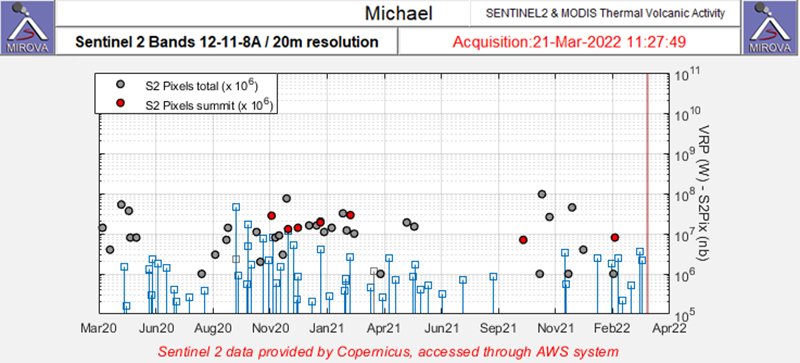 |
Figure 43. Few thermal anomalies (red dots) were detected at Saunders during November 2020 through February 2021, October 2021, and February 2022 as recorded by the Sentinel-2 MODIS Thermal Volcanic Activity data (bands 12, 11, 8A). Courtesy of MIROVA. |
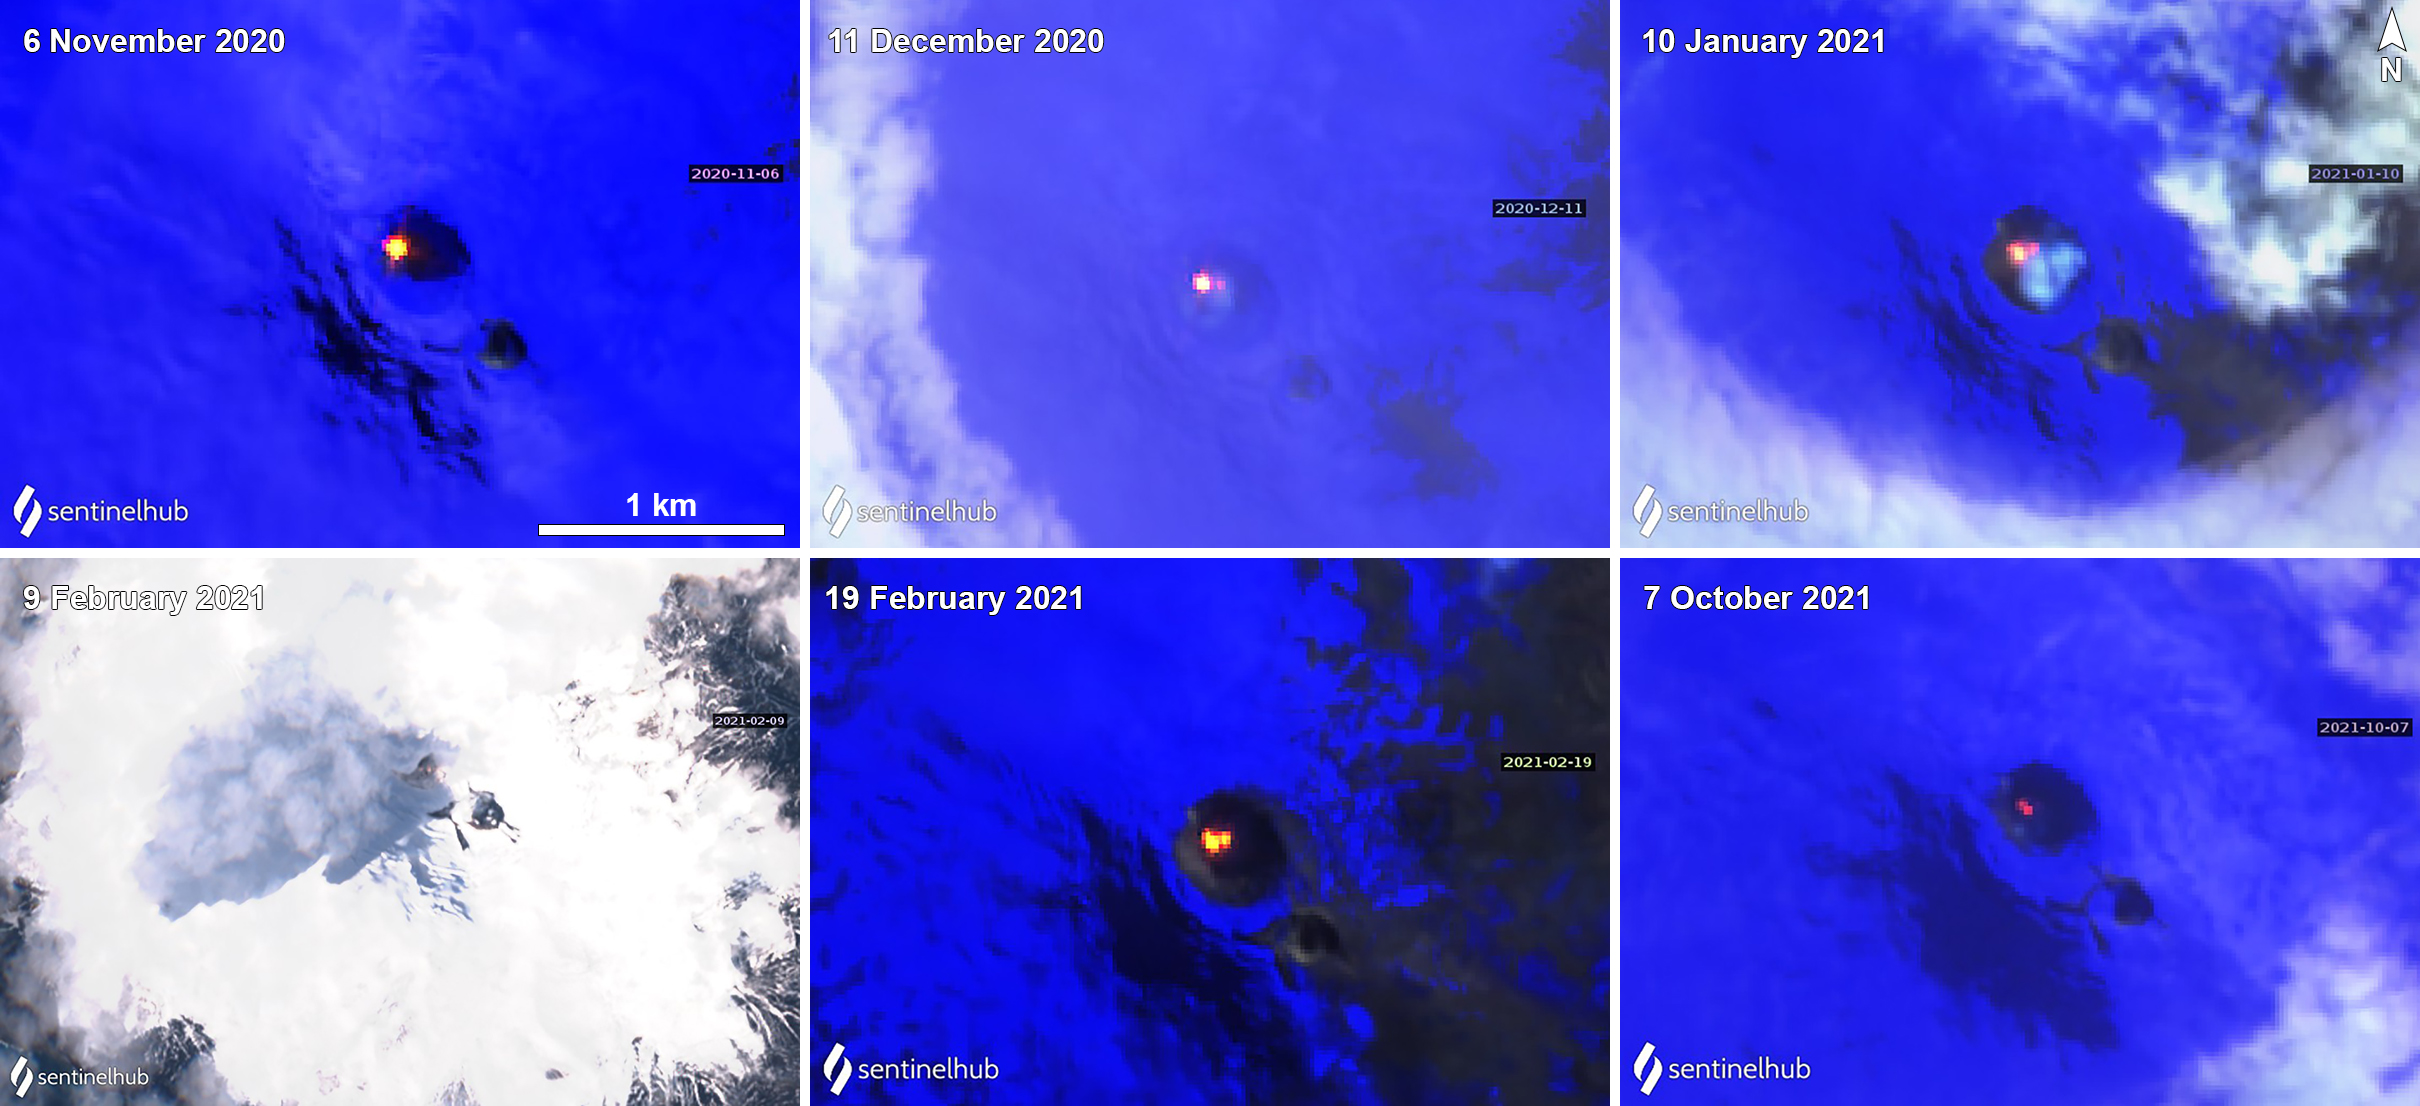 |
Figure 44. Sentinel-2 infrared and natural color images on clear weather days showing a strong thermal anomaly (bright yellow-orange) within the Mount Michael summit crater at Saunders on 6 November (top left), 11 December (top middle) 2020, 10 January (top right), 19 February (bottom middle), and 7 October (bottom right) 2021. Some degassing was visible on 10 January. A grayish plume was detected drifting W on 9 February (bottom left). By 7 October, the strength of the anomaly had declined. Images using “Atmospheric penetration” rendering (bands 12, 11, 8a) and “Natural color” (bands 4, 3, 2) rendering. Courtesy of Sentinel Hub Playground. |
Renewed anomalies were visible again during October 2021 in MIROVA data. Although on 7 October the strength of the anomaly had decreased visibly compared to the previous year (figure 44). Small sulfur dioxide emissions were visible on 24 October 2021, as detected by the TROPOMI instrument on the Sentinel-5P satellite (figure 45). Wispy sulfur dioxide emissions were more often detected during January 2022, which drifted generally N and SW.
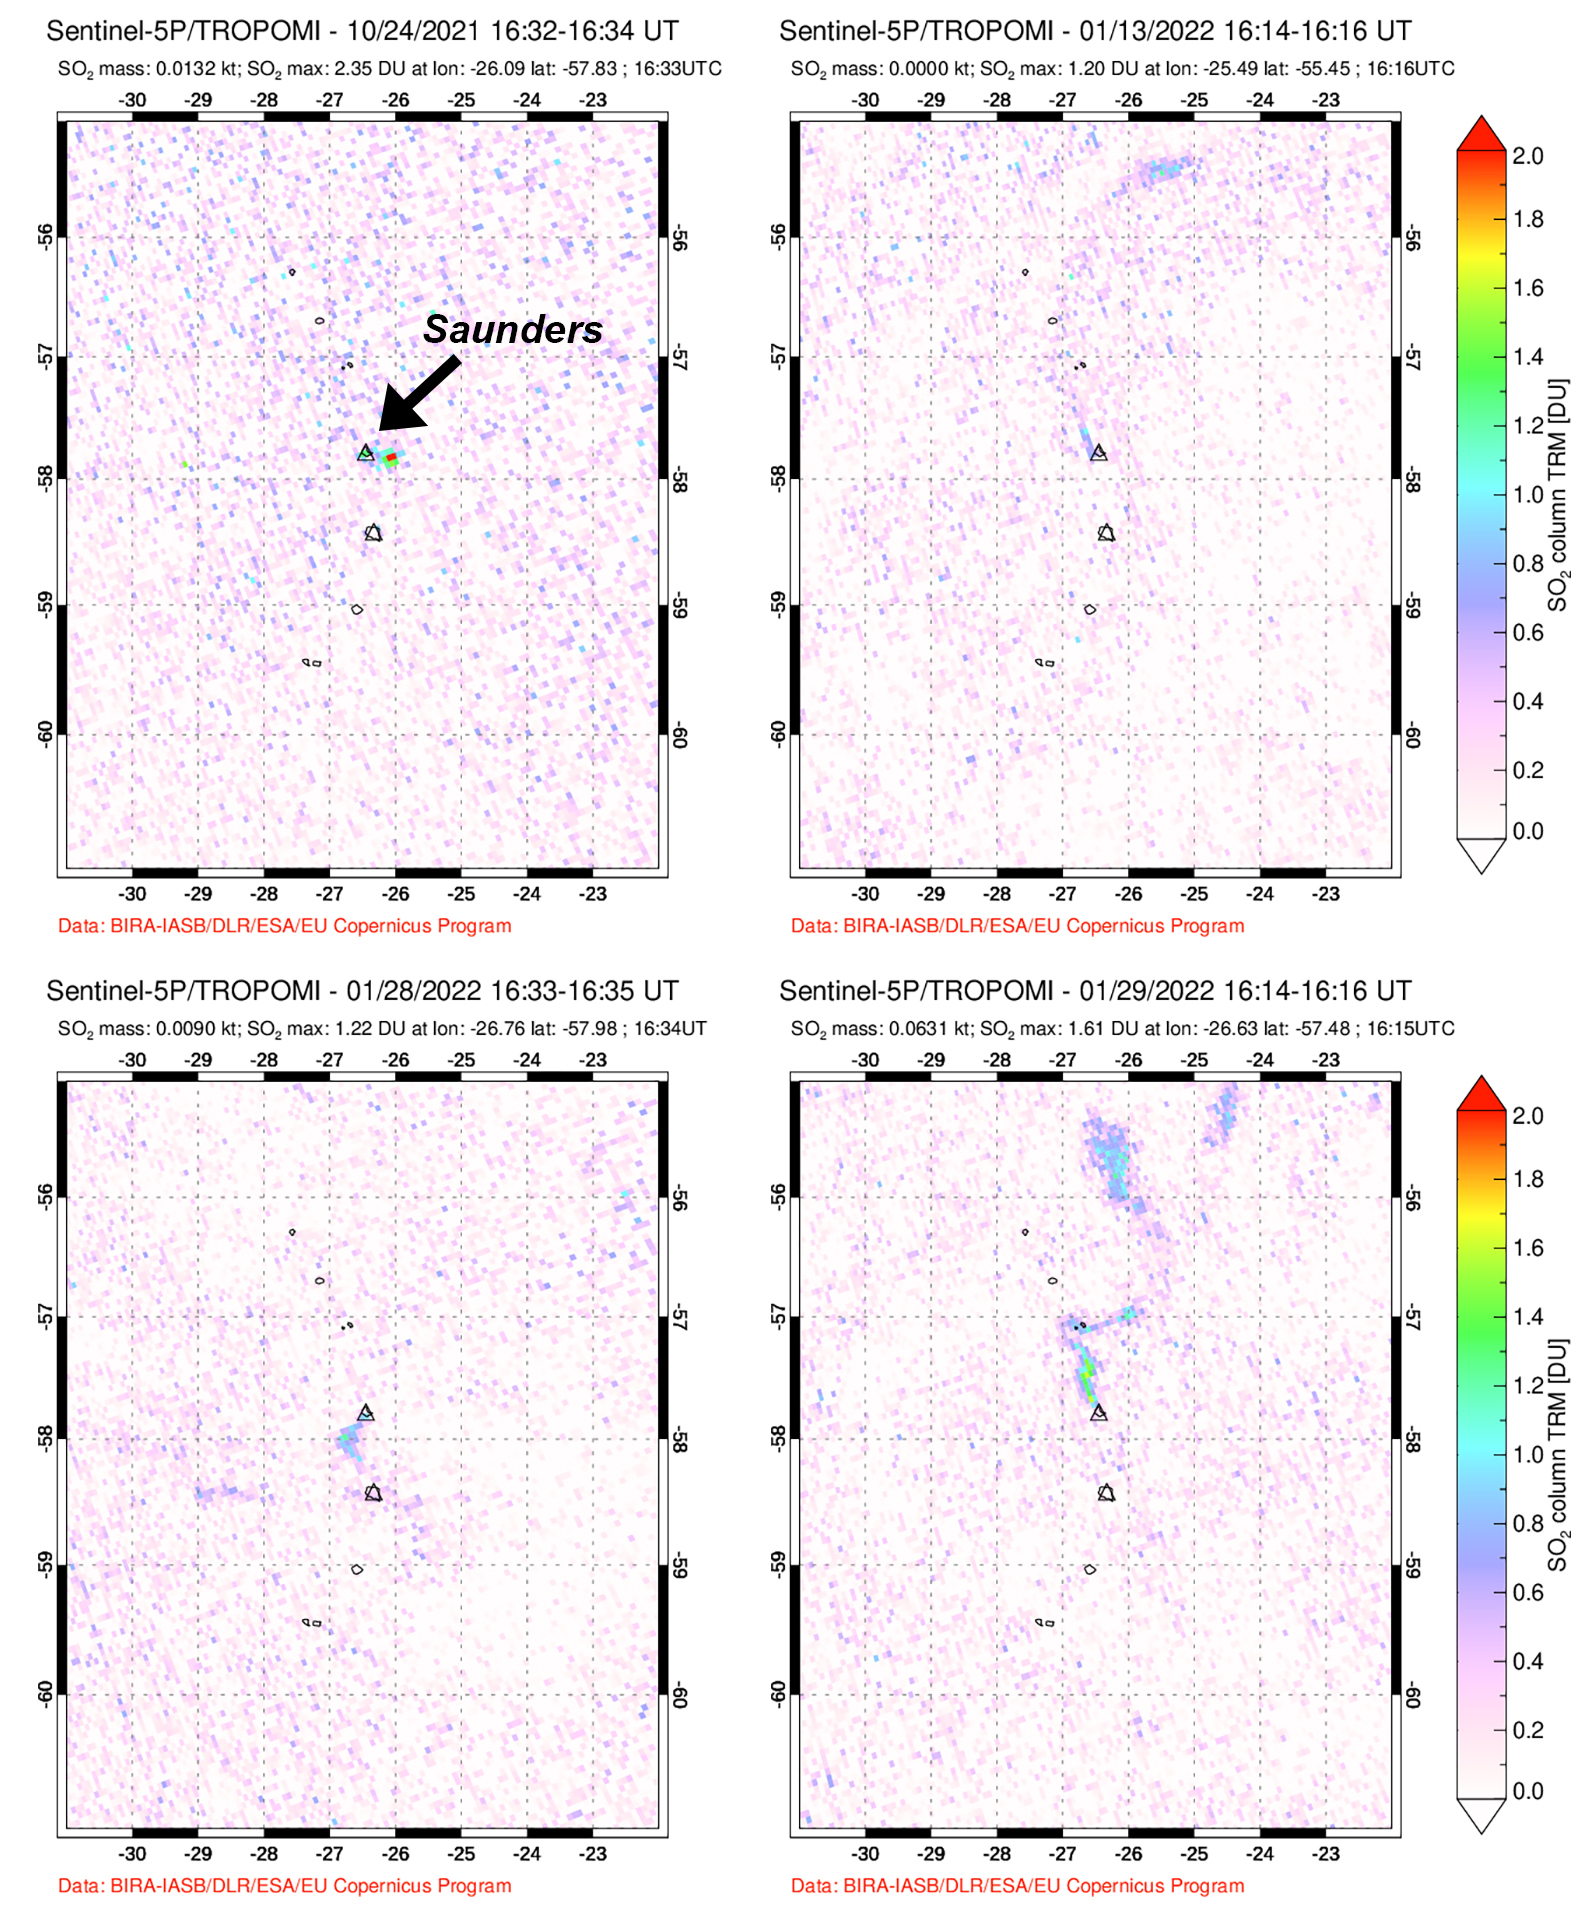 |
Figure 45. Small sulfur dioxide plumes rising from Saunders were detected by the TROPOMI instrument on the Sentinel-5P satellite on 24 October (top left) 2021, 13 January (top right), 28 January (bottom left), and 29 January (bottom right) 2022 that drifted SE, N, SW, and NW, respectively. Courtesy of NASA Global Sulfur Dioxide Monitoring Page. |
Information Contacts: MIROVA (Middle InfraRed Observation of Volcanic Activity), a collaborative project between the Universities of Turin and Florence (Italy) supported by the Centre for Volcanic Risk of the Italian Civil Protection Department (URL: http://www.mirovaweb.it/); NASA Global Sulfur Dioxide Monitoring Page, Atmospheric Chemistry and Dynamics Laboratory, NASA Goddard Space Flight Center (NASA/GSFC), 8800 Greenbelt Road, Goddard MD 20771, USA (URL: https://so2.gsfc.nasa.gov/); NASA Worldview (URL: https://worldview.earthdata.nasa.gov/); Sentinel Hub Playground (URL: https://www.sentinel-hub.com/explore/sentinel-playground).
Thermal activity continues during February 2022-January 2023
Saunders Island consists of a large central volcanic edifice intersected by two seamount chains in the remote South Sandwich Volcanic Arc in the South Atlantic. The young Mount Michael stratovolcano dominates the glacier-covered island, while two submarine plateaus, Harpers Bank and Saunders Bank, extend north. The symmetrical Michael has a 500-m-wide summit crater. Ash clouds were reported from the summit crater in 1819, and an effusive eruption was inferred to have occurred from a N-flank fissure around the end of the 19th century and beginning of the 20th. The current eruption period began in November 2014 and more recently has been characterized by intermittent thermal anomalies and gas-and-steam emissions (BGVN 47:03). Visits are infrequent because of the remote location, and views are often obscured by cloudy weather. This report covers activity from February 2022 through January 2023 primarily using satellite data.
Activity at the Mount Michael summit crater consisted of intermittent thermal activity during the reporting period. MIROVA (Middle InfraRed Observation of Volcanic Activity) analysis of MODIS satellite data showed a total of 15 low-power thermal anomalies detected near the summit crater (figure 46). One anomaly was recorded in late May, four in early June, two in late July, two in late September, one in early October, two in late November, one in mid-December 2022, and two in January 2023. Some of this thermal activity was also visible in Sentinel-2 infrared satellite imagery at the summit crater (figure 47). A strong gas-and-steam plume drifted NE on 6 February, based on a satellite image. On 24 September and 16 November two hotspots of similar size and intensity were detected at the summit crater. Weak sulfur dioxide emissions were recorded on 6, 11, 26, and 27 February, 2 and 3 March, 5, 6, and 8 October, 16 and 25 November, and 9 December as detected by the TROPOMI instrument on the Sentinel-5P satellite that drifted in different directions (figure 48).
|
Figure 46. A total of 15 thermal anomalies were detected near the Mount Michael summit crater at Saunders during 17 April 2022 through January 2023. One anomaly occurred during late May, four during early June, two during late July, two during late September, one during early October, two during late November, one in mid-December 2022, and two during January 2023. Courtesy of MIROVA. |
|
Figure 47. Sentinel-2 infrared satellite images showed an intermittent thermal anomaly (bright yellow-orange) within the Mount Michael summit crater at Saunders on 6 February 2022 (top left), 3 August 2022 (top right), 24 September 2022 (bottom left), and 16 November 2022 (bottom right). Strong gas-and-steam plumes were visible on 6 February. Two visible hotspots of similar size and brightness were visible in the images taken on 24 September and 16 November. Images use “Atmospheric penetration” rendering (bands 12, 11, 8a) rendering. Courtesy of Sentinel Hub Playground. |
|
Figure 48. Small sulfur dioxide plumes rising from Saunders were detected by the TROPOMI instrument on the Sentinel-5P satellite on 6 February 2022 (left) and 8 October 2022 (right) that drifted NW and SE, respectively. Courtesy of NASA Global Sulfur Dioxide Monitoring Page. |
Information Contacts: MIROVA (Middle InfraRed Observation of Volcanic Activity), a collaborative project between the Universities of Turin and Florence (Italy) supported by the Centre for Volcanic Risk of the Italian Civil Protection Department (URL: http://www.mirovaweb.it/); NASA Global Sulfur Dioxide Monitoring Page, Atmospheric Chemistry and Dynamics Laboratory, NASA Goddard Space Flight Center (NASA/GSFC), 8800 Greenbelt Road, Goddard MD 20771, USA (URL: https://so2.gsfc.nasa.gov/); Sentinel Hub Playground (URL: https://www.sentinel-hub.com/explore/sentinel-playground).
|
|
||||||||||||||||||||||||||
There is data available for 7 confirmed Holocene eruptive periods.
2014 Nov 12 - 2025 May 29 (continuing) Confirmed Eruption (Lava Lake) VEI: 1
| Episode 1 | Eruption (Lava Lake) | Mount Michael summit crater | ||||||||||||||||||||||||||||||||||||||||||||||||||||||||||||||||||||||||||||||||||||||||||||||||||||||||||||||||||||||||||||||||||||||||||||||||||||||||||||||||||||||||||||||||||||||||||||||||||||||||||||||||||||||||||||||||||||||||||||||||||||||||||||||||||||||||||||||||||||||||||||||||||||||||||||||||||||||||||||||||||||||||||||||
|---|---|---|---|---|---|---|---|---|---|---|---|---|---|---|---|---|---|---|---|---|---|---|---|---|---|---|---|---|---|---|---|---|---|---|---|---|---|---|---|---|---|---|---|---|---|---|---|---|---|---|---|---|---|---|---|---|---|---|---|---|---|---|---|---|---|---|---|---|---|---|---|---|---|---|---|---|---|---|---|---|---|---|---|---|---|---|---|---|---|---|---|---|---|---|---|---|---|---|---|---|---|---|---|---|---|---|---|---|---|---|---|---|---|---|---|---|---|---|---|---|---|---|---|---|---|---|---|---|---|---|---|---|---|---|---|---|---|---|---|---|---|---|---|---|---|---|---|---|---|---|---|---|---|---|---|---|---|---|---|---|---|---|---|---|---|---|---|---|---|---|---|---|---|---|---|---|---|---|---|---|---|---|---|---|---|---|---|---|---|---|---|---|---|---|---|---|---|---|---|---|---|---|---|---|---|---|---|---|---|---|---|---|---|---|---|---|---|---|---|---|---|---|---|---|---|---|---|---|---|---|---|---|---|---|---|---|---|---|---|---|---|---|---|---|---|---|---|---|---|---|---|---|---|---|---|---|---|---|---|---|---|---|---|---|---|---|---|---|---|---|---|---|---|---|---|---|---|---|---|---|---|---|---|---|---|---|---|---|---|---|---|---|---|---|---|---|---|---|---|---|---|---|---|---|---|---|---|---|---|---|---|---|---|---|---|---|---|---|---|---|---|---|---|---|---|---|---|---|---|---|---|---|---|---|---|
| 2014 Nov 12 - 2025 May 29 (continuing) | Evidence from Observations: Reported | ||||||||||||||||||||||||||||||||||||||||||||||||||||||||||||||||||||||||||||||||||||||||||||||||||||||||||||||||||||||||||||||||||||||||||||||||||||||||||||||||||||||||||||||||||||||||||||||||||||||||||||||||||||||||||||||||||||||||||||||||||||||||||||||||||||||||||||||||||||||||||||||||||||||||||||||||||||||||||||||||||||||||||||||
|
List of 65 Events for Episode 1 at Mount Michael summit crater
|
|||||||||||||||||||||||||||||||||||||||||||||||||||||||||||||||||||||||||||||||||||||||||||||||||||||||||||||||||||||||||||||||||||||||||||||||||||||||||||||||||||||||||||||||||||||||||||||||||||||||||||||||||||||||||||||||||||||||||||||||||||||||||||||||||||||||||||||||||||||||||||||||||||||||||||||||||||||||||||||||||||||||||||||||
2000 May 13 - 2013 Nov 16 Confirmed Eruption (Explosive / Effusive) VEI: 1
| Episode 1 | Eruption (Explosive / Effusive) | ||||||||||||||||||||
|---|---|---|---|---|---|---|---|---|---|---|---|---|---|---|---|---|---|---|---|---|
| 2000 May 13 - 2002 Nov 16 (?) ± 15 days | Evidence from Observations: Reported | |||||||||||||||||||
|
List of 2 Events for Episode 1
|
||||||||||||||||||||
| Episode 2 | Eruption (Explosive / Effusive) | ||||||||||||||||||||
|---|---|---|---|---|---|---|---|---|---|---|---|---|---|---|---|---|---|---|---|---|
| 2003 May 6 (?) - 2003 May 6 (?) | Evidence from Observations: Reported | |||||||||||||||||||
|
List of 2 Events for Episode 2
|
||||||||||||||||||||
| Episode 3 | Eruption (Explosive / Effusive) | ||||
|---|---|---|---|---|
| 2003 Oct 29 - 2013 Nov 16 | Evidence from Observations: Reported | |||
| Episode 4 | Eruption (Explosive / Effusive) | ||||||||||||||||||||
|---|---|---|---|---|---|---|---|---|---|---|---|---|---|---|---|---|---|---|---|---|
| 2005 Oct 2 (?) - 2006 Dec 6 (?) | Evidence from Observations: Reported | |||||||||||||||||||
|
List of 2 Events for Episode 4
|
||||||||||||||||||||
| Episode 5 | Eruption (Explosive / Effusive) | Old Crater | |||||||||||||||||||
|---|---|---|---|---|---|---|---|---|---|---|---|---|---|---|---|---|---|---|---|---|
| 2008 Jan 8 (?) - 2008 Jan 8 (?) | Evidence from Observations: Reported | |||||||||||||||||||
|
List of 2 Events for Episode 5 at Old Crater
|
||||||||||||||||||||
| Episode 6 | Eruption (Explosive / Effusive) | ||||||||||||||||||||
|---|---|---|---|---|---|---|---|---|---|---|---|---|---|---|---|---|---|---|---|---|
| 2008 Oct 25 (?) - 2008 Oct 25 (?) | Evidence from Observations: Reported | |||||||||||||||||||
|
List of 2 Events for Episode 6
|
||||||||||||||||||||
| Episode 7 | Uncertain | Old Crater | |||
|---|---|---|---|---|
| 2009 Nov 19 (?) - 2009 Nov 19 (?) | Evidence from Observations: Reported | |||
| Episode 8 | Eruption (Explosive / Effusive) | Main crater | |||||||||||||||||||
|---|---|---|---|---|---|---|---|---|---|---|---|---|---|---|---|---|---|---|---|---|
| 2010 Nov 17 (?) - 2010 Nov 17 (?) | Evidence from Observations: Reported | |||||||||||||||||||
|
List of 2 Events for Episode 8 at Main crater
|
||||||||||||||||||||
| Episode 9 | Eruption (Explosive / Effusive) | Old Crater | ||||||||||||||||||||||||
|---|---|---|---|---|---|---|---|---|---|---|---|---|---|---|---|---|---|---|---|---|---|---|---|---|---|
| 2010 Nov 17 - 2010 Nov 17 | Evidence from Observations: Reported | ||||||||||||||||||||||||
|
List of 3 Events for Episode 9 at Old Crater
|
|||||||||||||||||||||||||
| Episode 10 | Eruption (Explosive / Effusive) | ||||||||||||||||||||
|---|---|---|---|---|---|---|---|---|---|---|---|---|---|---|---|---|---|---|---|---|
| 2012 Jun 30 (?) - 2012 Nov 22 (?) | Evidence from Observations: Reported | |||||||||||||||||||
|
List of 2 Events for Episode 10
|
||||||||||||||||||||
1999 Jan 19 - 1999 Jan 19 Confirmed Eruption (Explosive / Effusive) VEI: 0
| Episode 1 | Eruption (Explosive / Effusive) | ||||||||||||||||||||
|---|---|---|---|---|---|---|---|---|---|---|---|---|---|---|---|---|---|---|---|---|
| 1999 Jan 19 - 1999 Jan 19 | Evidence from Observations: Reported | |||||||||||||||||||
|
List of 2 Events for Episode 1
|
||||||||||||||||||||
1995 Apr 16 (?) ± 15 days - 1998 Feb 16 (on or after) ± 15 days Confirmed Eruption (Explosive / Effusive) VEI: 0
| Episode 1 | Eruption (Explosive / Effusive) | ||||||||||||||||||||
|---|---|---|---|---|---|---|---|---|---|---|---|---|---|---|---|---|---|---|---|---|
| 1995 Apr 16 (?) ± 15 days - 1998 Feb 16 (on or after) ± 15 days | Evidence from Observations: Reported | |||||||||||||||||||
|
List of 2 Events for Episode 1
|
||||||||||||||||||||
1989 Jan 30 - 1990 Mar 22 Confirmed Eruption (Explosive / Effusive) VEI: 0
| Episode 1 | Eruption (Explosive / Effusive) | |||||||||||||||||||||||||
|---|---|---|---|---|---|---|---|---|---|---|---|---|---|---|---|---|---|---|---|---|---|---|---|---|---|
| 1989 Jan 30 - 1989 Apr 29 | Evidence from Observations: Reported | ||||||||||||||||||||||||
|
List of 3 Events for Episode 1
|
|||||||||||||||||||||||||
| Episode 2 | Eruption (Explosive / Effusive) | ||||
|---|---|---|---|---|
| 1990 Mar 6 - 1990 Mar 22 | Evidence from Observations: Reported | |||
1900 ± 10 years Confirmed Eruption (Explosive / Effusive) VEI: 0
| Episode 1 | Eruption (Explosive / Effusive) | North flank | |||||||||||||||||||
|---|---|---|---|---|---|---|---|---|---|---|---|---|---|---|---|---|---|---|---|---|
| 1900 ± 10 years - Unknown | Evidence from Correlation: Tephrochronology | |||||||||||||||||||
|
List of 2 Events for Episode 1 at North flank
|
||||||||||||||||||||
[ 1823 ] Uncertain Eruption
| Episode 1 | Eruption (Explosive / Effusive) | |||||||||||||||||||||||||
|---|---|---|---|---|---|---|---|---|---|---|---|---|---|---|---|---|---|---|---|---|---|---|---|---|---|
| 1823 - Unknown | Evidence from Unknown | ||||||||||||||||||||||||
|
List of 3 Events for Episode 1
|
|||||||||||||||||||||||||
1819 Dec 29 Confirmed Eruption (Explosive / Effusive) VEI: 2
| Episode 1 | Eruption (Explosive / Effusive) | |||||||||||||||||||||||||
|---|---|---|---|---|---|---|---|---|---|---|---|---|---|---|---|---|---|---|---|---|---|---|---|---|---|
| 1819 Dec 29 - Unknown | Evidence from Observations: Reported | ||||||||||||||||||||||||
|
List of 3 Events for Episode 1
|
|||||||||||||||||||||||||
This compilation of synonyms and subsidiary features may not be comprehensive. Features are organized into four major categories: Cones, Craters, Domes, and Thermal Features. Synonyms of features appear indented below the primary name. In some cases additional feature type, elevation, or location details are provided.
Cones |
||||
| Feature Name | Feature Type | Elevation | Latitude | Longitude |
| Ashen Hills | Cone | 57° 49' 29.00" S | 26° 27' 14.00" W | |
| Fin | Cone | -276 m | 58° 0' 0.00" S | 26° 45' 0.00" W |
| Humpback | Cone | -75 m | 57° 35' 21.00" S | 27° 3' 28.00" W |
| Michael
Miguel |
Stratovolcano | 843 m | 57° 48' 0.00" S | 26° 29' 0.00" W |
| Minke | Cone | -480 m | 57° 24' 0.00" S | 26° 27' 45.00" W |
| Orca | Cone | -344 m | 57° 32' 0.00" S | 26° 47' 30.00" W |
| Southern Right | Cone | -400 m | 58° 5' 0.00" S | 27° 0' 0.00" W |
| West Minke | Cone | -1500 m | 57° 22' 45.00" S | 26° 42' 45.00" W |
Craters |
||||
| Feature Name | Feature Type | Elevation | Latitude | Longitude |
| Old Crater | Crater | |||
There are no samples for Saunders in the Smithsonian's NMNH Department of Mineral Sciences Rock and Ore collection.
| Copernicus Browser | The Copernicus Browser replaced the Sentinel Hub Playground browser in 2023, to provide access to Earth observation archives from the Copernicus Data Space Ecosystem, the main distribution platform for data from the EU Copernicus missions. |
| MIROVA | Middle InfraRed Observation of Volcanic Activity (MIROVA) is a near real time volcanic hot-spot detection system based on the analysis of MODIS (Moderate Resolution Imaging Spectroradiometer) data. In particular, MIROVA uses the Middle InfraRed Radiation (MIR), measured over target volcanoes, in order to detect, locate and measure the heat radiation sourced from volcanic activity. |
| MODVOLC Thermal Alerts | Using infrared satellite Moderate Resolution Imaging Spectroradiometer (MODIS) data, scientists at the Hawai'i Institute of Geophysics and Planetology, University of Hawai'i, developed an automated system called MODVOLC to map thermal hot-spots in near real time. For each MODIS image, the algorithm automatically scans each 1 km pixel within it to check for high-temperature hot-spots. When one is found the date, time, location, and intensity are recorded. MODIS looks at every square km of the Earth every 48 hours, once during the day and once during the night, and the presence of two MODIS sensors in space allows at least four hot-spot observations every two days. Each day updated global maps are compiled to display the locations of all hot spots detected in the previous 24 hours. There is a drop-down list with volcano names which allow users to 'zoom-in' and examine the distribution of hot-spots at a variety of spatial scales. |
|
WOVOdat
Single Volcano View Temporal Evolution of Unrest Side by Side Volcanoes |
WOVOdat is a database of volcanic unrest; instrumentally and visually recorded changes in seismicity, ground deformation, gas emission, and other parameters from their normal baselines. It is sponsored by the World Organization of Volcano Observatories (WOVO) and presently hosted at the Earth Observatory of Singapore.
GVMID Data on Volcano Monitoring Infrastructure The Global Volcano Monitoring Infrastructure Database GVMID, is aimed at documenting and improving capabilities of volcano monitoring from the ground and space. GVMID should provide a snapshot and baseline view of the techniques and instrumentation that are in place at various volcanoes, which can be use by volcano observatories as reference to setup new monitoring system or improving networks at a specific volcano. These data will allow identification of what monitoring gaps exist, which can be then targeted by remote sensing infrastructure and future instrument deployments. |
| Volcanic Hazard Maps | The IAVCEI Commission on Volcanic Hazards and Risk has a Volcanic Hazard Maps database designed to serve as a resource for hazard mappers (or other interested parties) to explore how common issues in hazard map development have been addressed at different volcanoes, in different countries, for different hazards, and for different intended audiences. In addition to the comprehensive, searchable Volcanic Hazard Maps Database, this website contains information about diversity of volcanic hazard maps, illustrated using examples from the database. This site is for educational purposes related to volcanic hazard maps. Hazard maps found on this website should not be used for emergency purposes. For the most recent, official hazard map for a particular volcano, please seek out the proper institutional authorities on the matter. |
| IRIS seismic stations/networks | Incorporated Research Institutions for Seismology (IRIS) Data Services map showing the location of seismic stations from all available networks (permanent or temporary) within a radius of 0.18° (about 20 km at mid-latitudes) from the given location of Saunders. Users can customize a variety of filters and options in the left panel. Note that if there are no stations are known the map will default to show the entire world with a "No data matched request" error notice. |
| UNAVCO GPS/GNSS stations | Geodetic Data Services map from UNAVCO showing the location of GPS/GNSS stations from all available networks (permanent or temporary) within a radius of 20 km from the given location of Saunders. Users can customize the data search based on station or network names, location, and time window. Requires Adobe Flash Player. |
| DECADE Data | The DECADE portal, still in the developmental stage, serves as an example of the proposed interoperability between The Smithsonian Institution's Global Volcanism Program, the Mapping Gas Emissions (MaGa) Database, and the EarthChem Geochemical Portal. The Deep Earth Carbon Degassing (DECADE) initiative seeks to use new and established technologies to determine accurate global fluxes of volcanic CO2 to the atmosphere, but installing CO2 monitoring networks on 20 of the world's 150 most actively degassing volcanoes. The group uses related laboratory-based studies (direct gas sampling and analysis, melt inclusions) to provide new data for direct degassing of deep earth carbon to the atmosphere. |
| Large Eruptions of Saunders | Information about large Quaternary eruptions (VEI >= 4) is cataloged in the Large Magnitude Explosive Volcanic Eruptions (LaMEVE) database of the Volcano Global Risk Identification and Analysis Project (VOGRIPA). |
| EarthChem | EarthChem develops and maintains databases, software, and services that support the preservation, discovery, access and analysis of geochemical data, and facilitate their integration with the broad array of other available earth science parameters. EarthChem is operated by a joint team of disciplinary scientists, data scientists, data managers and information technology developers who are part of the NSF-funded data facility Integrated Earth Data Applications (IEDA). IEDA is a collaborative effort of EarthChem and the Marine Geoscience Data System (MGDS). |


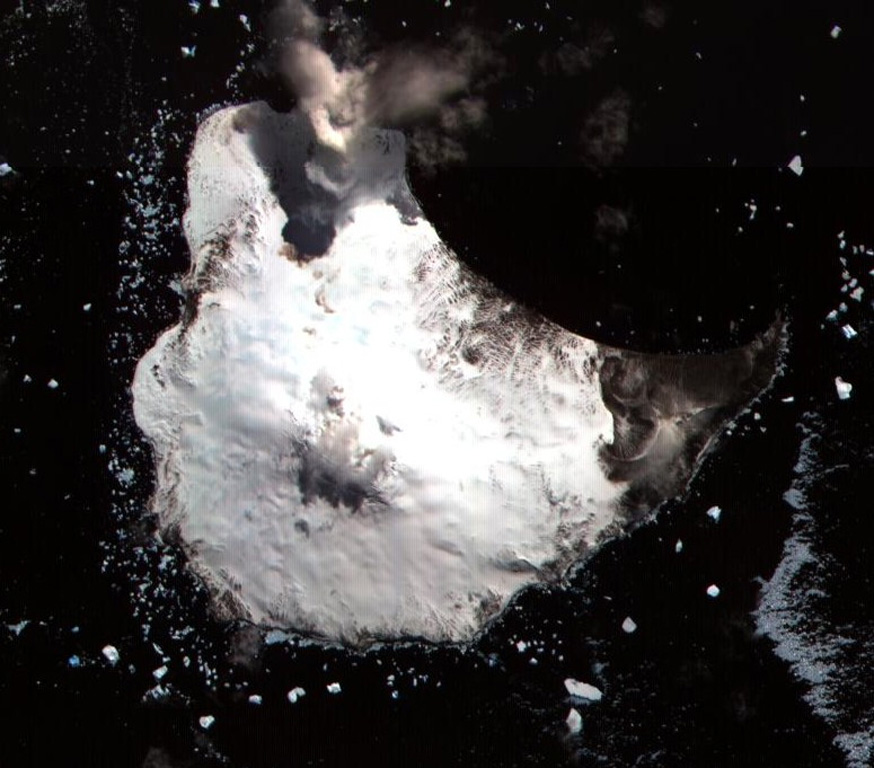
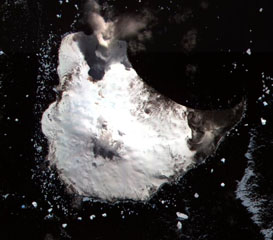 Glacier-covered Mount Michael stratovolcano dominates Saunders Island. Cordelia Bay lies between the Blackstone Plain (top) and the snow-free Ashen Hills (right), a cluster of parasitic cones on the SE flank. Ash clouds were reported from the summit crater in 1819, and an effusive eruption was inferred to have occurred from a north-flank fissure around the turn of the 19th century. Recent AVHRR and MODIS satellite imagery has revealed evidence for lava lake activity in the summit crater of Mount Michael.