Recently Published Bulletin Reports
Agung (Indonesia) Three eruptive events reported in April, May, and December 2022
Tengger Caldera (Indonesia) Minor ash emission in December 2023; persistent weak thermal anomaly in the Bromo crater
Saunders (United Kingdom) Persistent thermal anomalies from the summit crater lava lake during February 2023-January 2024
Shishaldin (United States) New eruption with significant Strombolian explosions, ash plumes, and ashfall
Ioto (Japan) New eruption with discolored water, ejecta, and floating pumice during October-December 2023
Purace (Colombia) Gas-and-ash emission on 16 November 2023
Etna (Italy) Strombolian explosions, lava fountains, and lava flows during July-August 2023
Suwanosejima (Japan) Eruption plumes, crater incandescence, and occasional explosions during July-October 2023
Aira (Japan) Explosions, ash plumes, ash fall, and crater incandescence during July-October 2023
Nishinoshima (Japan) Gray emissions during October 2023
Kilauea (United States) Strong lava fountains, lava flows, and spatter at Halema’uma’u during January-September 2023
Tinakula (Solomon Islands) Continued lava flows and thermal activity during June through November 2023
Agung (Indonesia) — January 2024  Cite this Report
Agung
Indonesia
8.343°S, 115.508°E; summit elev. 2997 m
All times are local (unless otherwise noted)
Three eruptive events reported in April, May, and December 2022
Mount Agung, located on the E end of the island of Bali, Indonesia, rises above the SE rim of the Batur caldera. The summit area extends 1.5 km E-W, with the highest point on the W and a steep-walled 800-m-wide crater on the E. Recorded eruptions date back to the early 19th century. A large and deadly explosive and effusive eruption occurred during 1963-64, which was characterized by voluminous ashfall, pyroclastic flows, and lahars that caused extensive damage and many fatalities. More recent activity was documented during November 2017-June 2019 that consisted of multiple explosions, significant ash plumes, lava flows at the summit crater, and incandescent ejecta. This report covers activity reported during April-May 2022 and December 2022 based on data from the Darwin Volcanic Ash Advisory Center (VAAC).
Activity during 2022 was relatively low and mainly consisted of a few ash plumes during April-May and December. An ash plume on 3 April rising to 3.7 km altitude (700 m above the summit) and drifting N was reported in a Darwin VAAC notice based on a ground report, with ash seen in HIMAWARI-8 visible imagery. Another ash plume was reported at 1120 on 27 May that rose to 5.5 km altitude (2.5 m above the summit); the plume was not visible in satellite or webcam images due to weather clouds. An eruption was reported based on seismic data at 0840 on 13 December, with an estimated plume altitude of 3.7 km; however, no ash was seen using satellite imagery in clear conditions before weather clouds obscured the summit.
Geologic Background. Symmetrical Agung stratovolcano, Bali's highest and most sacred mountain, towers over the eastern end of the island. The volcano, whose name means "Paramount," rises above the SE rim of the Batur caldera, and the northern and southern flanks extend to the coast. The summit area extends 1.5 km E-W, with the high point on the W and a steep-walled 800-m-wide crater on the E. The Pawon cone is located low on the SE flank. Only a few eruptions dating back to the early 19th century have been recorded in historical time. The 1963-64 eruption, one of the largest in the 20th century, produced voluminous ashfall along with devastating pyroclastic flows and lahars that caused extensive damage and many fatalities.
Information Contacts: Darwin Volcanic Ash Advisory Centre (VAAC), Bureau of Meteorology, Northern Territory Regional Office, PO Box 40050, Casuarina, NT 0811, Australia (URL: http://www.bom.gov.au/info/vaac/).
Tengger Caldera (Indonesia) — February 2024 Cite this Report
Tengger Caldera
Indonesia
7.942°S, 112.95°E; summit elev. 2329 m
All times are local (unless otherwise noted)
Minor ash emission in December 2023; persistent weak thermal anomaly in the Bromo crater
Tengger Caldera, located at the N end of a volcanic massif in Indonesia’s East Java, consists of five overlapping stratovolcanoes. The youngest and only active cone in the 16-km-wide caldera is Bromo, which typically produces gas-and-steam plumes, occasional ash plumes and explosions, and weak thermal signals (BGVN 44:05, 47:01). This report covers activity during January 2022-December 2023, consisting of mostly white gas-and-steam emissions and persistent weak thermal anomalies. Information was provided by the Pusat Vulkanologi dan Mitigasi Bencana Geologi (PVMBG, also known as Indonesian Center for Volcanology and Geological Hazard Mitigation, CVGHM) and satellite imagery. The Alert Level remained at 2 (on a scale of 1-4), and visitors were warned to stay at least 1 km from the crater.
Activity was generally low during the reporting period, similar to that in 2021. According to almost daily images from MAGMA Indonesia (a platform developed by PVMBG), white emissions and plumes rose from 50 to 900 m above the main crater during this period (figure 24). During several days in March and June 2022, white plumes reached heights of 1-1.2 km above the crater.
After an increase in activity at 2114 on 3 February 2023, a PVMBG team that was sent to observe white emissions rising as high as 300 m during 9-12 February and heard rumbling noises. A sulfur dioxide odor was also strong near the crater and measurements indicated that levels were above the healthy (non-hazardous) threshold of 5 parts per million; differential optical absorption spectroscopy (DOAS) measurements indicated an average flux of 190 metric tons per day on 11 February. Incandescence originating from a large fumarole in the NNW part of the crater was visible at night. The team observed that vegetation on the E caldera wall was yellow and withered. The seismic network recorded continuous tremor and deep and shallow volcanic earthquakes.
According to a PVMBG press release, activity increased on 13 December 2023 with white, gray, and brown emissions rising as high as 900 m above Bromo’s crater rim and drifting in multiple directions (figure 25). The report noted that tremor was continuous and was accompanied in December by three volcanic earthquakes. Deformation data indicated inflation in December. There was no observable difference in the persistent thermal anomaly in the crater between 11 and 16 December 2023.
All clear views of the Bromo crater throughout this time, using Sentinel-2 infrared satellite images, showed a weak persistent thermal anomaly; none of the anomalies were strong enough to cause MODVOLC Thermal Alerts. A fire in the SE part of the caldera in early September 2023 resulted in a brief period of strong thermal anomalies.
Geologic Background. The 16-km-wide Tengger caldera is located at the northern end of a volcanic massif extending from Semeru volcano. The massive volcanic complex dates back to about 820,000 years ago and consists of five overlapping stratovolcanoes, each truncated by a caldera. Lava domes, pyroclastic cones, and a maar occupy the flanks of the massif. The Ngadisari caldera at the NE end of the complex formed about 150,000 years ago and is now drained through the Sapikerep valley. The most recent of the calderas is the 9 x 10 km wide Sandsea caldera at the SW end of the complex, which formed incrementally during the late Pleistocene and early Holocene. An overlapping cluster of post-caldera cones was constructed on the floor of the Sandsea caldera within the past several thousand years. The youngest of these is Bromo, one of Java's most active and most frequently visited volcanoes.
Information Contacts: Pusat Vulkanologi dan Mitigasi Bencana Geologi (PVMBG, also known as Indonesian Center for Volcanology and Geological Hazard Mitigation, CVGHM), Jalan Diponegoro 57, Bandung 40122, Indonesia (URL: http://www.vsi.esdm.go.id/); MAGMA Indonesia, Kementerian Energi dan Sumber Daya Mineral (URL: https://magma.esdm.go.id/v1); Copernicus Browser, Copernicus Data Space Ecosystem, European Space Agency (URL: https://dataspace.copernicus.eu/browser/); Hawai'i Institute of Geophysics and Planetology (HIGP) - MODVOLC Thermal Alerts System, School of Ocean and Earth Science and Technology (SOEST), Univ. of Hawai'i, 2525 Correa Road, Honolulu, HI 96822, USA (URL: http://modis.higp.hawaii.edu/).
Saunders (United Kingdom) — February 2024 Cite this Report
Saunders
United Kingdom
57.8°S, 26.483°W; summit elev. 843 m
All times are local (unless otherwise noted)
Persistent thermal anomalies from the summit crater lava lake during February 2023-January 2024
Saunders is one of eleven islands that comprise the South Sandwich Islands in the South Atlantic. The active Mount Michael volcano has been in almost continuous eruption since November 2014 (BGVN 48:02). Recent activity has resulted in intermittent thermal anomalies and gas-and-steam emissions (BGVN 47:03, 48:02). Visits are infrequent due to its remote location, and cloud cover often prevents satellite observations. Satellite thermal imagery and visual observation of incandescence during a research expedition in 2019 (BGVN 28:02 and 44:08) and a finding confirmed by a National Geographic Society research team that summited Michael in November 2022 reported the presence of a lava lake.
Although nearly constant cloud cover during February 2023 through January 2024 greatly limited satellite observations, thermal anomalies from the lava lake in the summit crater were detected on clear days, especially around 20-23 August 2023. Anomalies similar to previous years (eg. BGVN 48:02) were seen in both MIROVA (Middle InfraRed Observation of Volcanic Activity) data from MODIS instruments and in Sentinel 2 infrared imagery. The only notable sulfur dioxide plume detected near Saunders was on 25 September 2023, with the TROPOMI instrument aboard the Sentinel-5P satellite.
Geologic Background. Saunders Island consists of a large central volcanic edifice intersected by two seamount chains, as shown by bathymetric mapping (Leat et al., 2013). The young Mount Michael stratovolcano dominates the glacier-covered island, while two submarine plateaus, Harpers Bank and Saunders Bank, extend north. The symmetrical Michael has a 500-m-wide summit crater and a remnant of a somma rim to the SE. Tephra layers visible in ice cliffs surrounding the island are evidence of recent eruptions. Ash clouds were reported from the summit crater in 1819, and an effusive eruption was inferred to have occurred from a N-flank fissure around the end of the 19th century and beginning of the 20th century. A low ice-free lava platform, Blackstone Plain, is located on the north coast, surrounding a group of former sea stacks. A cluster of cones on the SE flank, the Ashen Hills, appear to have been modified since 1820 (LeMasurier and Thomson, 1990). Analysis of satellite imagery available since 1989 (Gray et al., 2019; MODVOLC) suggests frequent eruptive activity (when weather conditions allow), volcanic clouds, steam plumes, and thermal anomalies indicative of a persistent, or at least frequently active, lava lake in the summit crater. Due to this observational bias, there has been a presumption when defining eruptive periods that activity has been ongoing unless there is no evidence for at least 10 months.
Information Contacts: MIROVA (Middle InfraRed Observation of Volcanic Activity), a collaborative project between the Universities of Turin and Florence (Italy) supported by the Centre for Volcanic Risk of the Italian Civil Protection Department (URL: http://www.mirovaweb.it/); NASA Global Sulfur Dioxide Monitoring Page, Atmospheric Chemistry and Dynamics Laboratory, NASA Goddard Space Flight Center (NASA/GSFC), 8800 Greenbelt Road, Goddard MD 20771, USA (URL: https://so2.gsfc.nasa.gov/); Copernicus Browser (URL: https://dataspace.copernicus.eu/browser).
Shishaldin (United States) — December 2023 Cite this Report
Shishaldin
United States
54.756°N, 163.97°W; summit elev. 2857 m
All times are local (unless otherwise noted)
New eruption with significant Strombolian explosions, ash plumes, and ashfall
Shishaldin is located on the eastern half of Unimak Island, one of the Aleutian Islands. Frequent explosive activity, primarily consisting of Strombolian ash eruptions from the small summit crater, but sometimes producing lava flows, has been recorded since the 18th century. The previous eruption ended in May 2020 and was characterized by intermittent thermal activity, increased seismicity and surface temperatures, ash plumes, and ash deposits (BGVN 45:06). This report covers a new eruption during July through November 2023, which consisted of significant explosions, ash plumes, ashfall, and lava fountaining. Information comes from daily, weekly, and special reports from the Alaska Volcano Observatory (AVO) and various satellite data. AVO monitors the volcano using local seismic and infrasound sensors, satellite data, web cameras, and remote infrasound and lightning networks.
AVO reported that intermittent tremor and low-frequency earthquakes had gradually become more regular and consistent during 10-13 July. Strongly elevated surface temperatures at the summit were identified in satellite images during 10-13 July. On 11 July AVO raised the Aviation Color Code (ACC) to Yellow (the second color on a four-color scale) and Volcano Alert Level (VAL) to Advisory (the second level on a four-level scale) at 1439. Later in the day on 11 July summit crater incandescence was observed in webcam images. Observations of the summit suggested that lava was likely present at the crater, which prompted AVO to raise the ACC to Orange (the second highest color on a four-color scale) and the VAL to Watch (the second highest level on a four-level scale). The US Coast Guard conducted an overflight on 12 July and confirmed that lava was erupting from the summit. That same day, sulfur dioxide emissions were detected in satellite images.
A significant explosion began at 0109 on 14 July that produced an ash plume that rose to 9-12 km altitude and drifted S over the Pacific Ocean (figure 43). Webcam images and photos taken around 0700 from a ship SW off Unimak Island showed small lahar deposits, which were the result of the interaction of hot pyroclastic material and snow and ice on the flanks. There was also ashfall on the SW and N flanks. A smaller explosion at 0710 generated an ash plume that rose to 4.5 km altitude. Webcam images and pilot reports showed continued low-level ash emissions during the morning, rising to less than 4.6 km altitude; those emissions included a small ash plume near the summit around 1030 resulting from a small explosion.
Seismic tremor amplitude began increasing at around 1700 on 15 July; strongly elevated surface temperatures were also reported. An ash plume rose to 4.6 km altitude and drifted SSE at 2100, based on a satellite image. A continuous ash plume during 2150 through 2330 rose to 5 km altitude and extended 125 km S. At 2357 AVO raised the ACC to Red (the highest color on a four-color scale) and the VAL to Warning (the highest level on a four-level scale), noting that seismicity remained elevated for more than six hours and explosion signals were frequently detected by regional infrasound (pressure sensor) networks. Explosions generated an ash plume that rose to 4.9 km altitude and drifted as far as 500 km SE. Activity throughout the night declined and by 0735 the ACC was lowered to Orange and the VAL to Watch. High-resolution satellite images taken on 16 July showed pyroclastic deposits extending as far as 3 km from the vent; these deposits generated lahars that extended further down the drainages on the flanks. Ash deposits were mainly observed on the SSE flank and extended to the shore of Unimak Island. During 16-17 July lava continued to erupt at the summit, which caused strongly elevated surface temperatures that were visible in satellite imagery.
Lava effusion increased at 0100 on 18 July, as noted in elevated surface temperatures identified in satellite data, increasing seismic tremor, and activity detected on regional infrasound arrays. A significant ash plume at 0700 rose to 7 km altitude and continued until 0830, eventually reaching 9.1 km altitude and drifting SSE (figure 44). As a result, the ACC was raised to Red and the VAL to Warning. By 0930 the main plume detached, but residual low-level ash emissions continued for several hours, remaining below 3 km altitude and drifting S. The eruption gradually declined and by 1208 the ACC was lowered to Orange and the VAL was lowered to Watch. High-resolution satellite images showed ash deposits on the SW flank and pyroclastic deposits on the N, E, and S flanks, extending as far as 3 km from the vent; lahars triggered by the eruption extended farther down the flanks (figure 45). Lava continued to erupt from the summit crater on 19 July.
Elevated surface temperatures were detected in satellite images during 19-25 July, despite occasional weather cloud cover, which was consistent with increased lava effusion. During 22-23 July satellite observations acquired after the eruption from 18 July showed pyroclastic flow and lahar deposits extending as far as 3 km down the N, NW, and NE flanks and as far as 1.5 km down the S and SE flanks. Ash deposits covered the SW and NE flanks. No lava flows were observed outside the crater. On 22 July a sulfur dioxide plume was detected in satellite data midday that had an estimated mass of 10 kt. In a special notice issued at 1653 on 22 July AVO noted that eruptive activity had intensified over the previous six hours, which was characterized by an hours-long steady increase in seismic tremor, intermittent infrasound signals consistent with small explosions, and an increase in surface temperatures that were visible in satellite data. Pilots first reported low-level ash plumes at around 1900. At 2320 an ash plume had risen to 9 km altitude based on additional pilot reports and satellite images. The ACC was increased to Red and the VAL to Warning at 2343. Satellite images indicated growth of a significantly higher ash plume that rose to 11 km altitude continued until 0030 and drifted NE. During the early morning hours of 23 July ash plumes had declined to 4.6 k altitude. Seismic tremor peaked at 0030 on 23 July and began to rapidly decline at 0109; active ash emissions were no longer visible in satellite data by 0130. The ACC was lowered to Orange and the VAL to Watch at 0418; bursts of increased seismicity were recorded throughout the morning, but seismicity generally remained at low levels. Elevated surface temperatures were visible in satellite data until about 0600. On 24 July pilots reported seeing vigorous gas-and-steam plumes rising to about 3 km altitude; the plumes may have contained minor amounts of ash.
During 24-25 July low level seismicity and volcanic tremor were detected at low levels following the previous explosion on 23 July. Strongly elevated surface temperatures were observed at the summit crater in satellite data. Around 2200 on 25 July seismicity began to increase, followed by infrasound signals of explosions after 0200 on 26 July. An ash plume rose to 3 km altitude at 0500 and drifted ENE, along with an associated sulfur dioxide plume that drifted NE and had an estimated mass of 22 kt. Diffuse ash emissions were visible in satellite data and rose to 6.1-7.6 km altitude and extended 125 km from the volcano starting around 1130. These ash events were preceded by about seven hours of seismic tremor, infrasound detections of explosions, and five hours of increased surface temperatures visible in satellite data. Activity began to decline around 1327, which included low-frequency earthquakes and decreased volcanic tremor, and infrasound data no longer detected significant explosions. Surface temperatures remained elevated through the end of the month.
Seismicity, volcanic tremor, and ash emissions remained at low levels during early August. Satellite images on 1 August showed that some slumping had occurred on the E crater wall due to the recent explosive activity. Elevated surface temperatures continued, which was consistent with cooling lava. On 2 August small explosive events were detected, consistent with low-level Strombolian activity. Some episodes of volcanic tremor were reported, which reflected low-level ash emissions. Those ash emissions rose to less than 3 km altitude and drifted as far as 92.6 km N. Pilots that were located N of the volcano observed an ash plume that rose to 2.7 km altitude. Seismicity began to increase in intensity around 0900 on 3 August. Seismicity continued to increase throughout the day and through the night with strongly elevated surface temperatures, which suggested that lava was active at the surface.
An ash cloud that rose to 7.6-7.9 km altitude and drifted 60-75 km NE was visible in a satellite image at 0520 on 4 August. Pilots saw and reported the plume at 0836 (figure 46). By 0900 the plume had risen to 9.1 km altitude and extended over 100 km NE. AVO raised the ACC to Red and the VAL to Warning as a result. Seismic tremor levels peaked at 1400 and then sharply declined at 1500 to slightly elevated levels; the plume was sustained during the period of high tremor and drifted N and NE. The ACC was lowered to Orange and the VAL to Watch at 2055. During 5-14 August seismicity remained low and surface temperatures were elevated based on satellite data due to cooling lava. On 9 August a small lava flow was observed that extended from the crater rim to the upper NE flank. It had advanced to 55 m in length and appeared in satellite imagery on 11 August. Occasional gas-and-steam plumes were noted in webcam images. At 1827 AVO noted that seismic tremor had steadily increased during the afternoon and erupting lava was visible at the summit in satellite images.
Strong explosion signals were detected at 0200 on 15 August. An ash cloud that was visible in satellite data extended 100 km NE and may have risen as high as 11 km altitude around 0240. By 0335 satellite images showed the ash cloud rising to 7.6 km altitude and drifting NE. Significant seismicity and explosions were detected by the local AVO seismic and infrasound networks, and volcanic lightning was detected by the World Wide Lightning Location Network (WWLLN). A sulfur dioxide plume associated with the eruption drifted over the S Bering Sea and parts of Alaska and western Canada. Seismicity was significantly elevated during the eruption but had declined by 1322. A pilot reported that ash emissions continued, rising as high as 4.9 km altitude. Elevated surface temperatures detected in satellite data were caused by hot, eruptive material (pyroclastic debris and lava) that accumulated around the summit. Eruptive activity declined by 16 August and the associated sulfur dioxide plume had mostly dissipated; remnants continued to be identified in satellite images at least through 18 August. Surface temperatures remained elevated based on satellite images, indicating hot material on the upper parts of the volcano. Small explosions were detected in infrasound data on the morning of 19 August and were consistent with pilot reports of small, short-lived ash plumes that rose to about 4.3 km altitude. Low-level explosive activity was reported during 20-24 August, according to seismic and infrasound data, and weather clouds sometimes prevented views. Elevated surface temperatures were observed in satellite images, which indicated continued hot material on the upper parts of the volcano.
Seismic tremor began to increase at around 0300 on 25 August and was followed by elevated surface temperatures identified in satellite images, consistent with erupting lava. Small explosions were recorded in infrasound data. The ACC was raised to Red and the VAL to Warning at 1204 after a pilot reported an ash plume that rose to 9.1 km altitude. Seismicity peaked at 1630 and began to rapidly decline at around 1730. Ash plumes rose as high as 10 km altitude and drifted as far as 400 km NE. By 2020 the ash plumes had declined to 6.4 km altitude and continued to drift NE. Ash emissions were visible in satellite data until 0000 on 26 August and seismicity was at low levels. AVO lowered the ACC to Orange and the VAL to Watch at 0030. Minor explosive activity within the summit crater was detected during 26-28 August and strongly elevated surface temperatures were still visible in satellite imagery through the rest of the month. An AVO field crew working on Unimak Island observed a mass flow that descended the upper flanks beginning around 1720 on 27 August. The flow produced a short-lived ash cloud that rose to 4.5 km altitude and rapidly dissipated. The mass flow was likely caused by the collapse of spatter that accumulated on the summit crater rim.
Similar variable explosive activity was reported in September, although weather observations sometimes prevented observations. A moderate resolution satellite image from the afternoon of 1 September showed gas-and-steam emissions filling the summit crater and obscuring views of the vent. In addition, hot deposits from the previous 25-26 August explosive event were visible on the NE flank near the summit, based on a 1 September satellite image. On 2 and 4 September seismic and infrasound data showed signals of small, repetitive explosions. Variable gas-and-steam emissions from the summit were visible but there was no evidence of ash. Possible summit crater incandescence was visible in nighttime webcam images during 3-4 September.
Seismicity began to gradually increase at around 0300 on 5 September and activity escalated at around 0830. A pilot reported an ash plume that rose to 7.6 km altitude at 0842 and continued to rise as high as possibly 9.7 km altitude and drifted SSE based on satellite images (figure 47). The ACC was raised to Red and the VAL to Warning at 0900. In addition to strong tremor and sustained explosions, the eruption produced volcanic lightning that was detected by the WWLLN. Around 1100 seismicity decreased and satellite data confirmed that the altitude of the ash emissions had declined to 7.6 km altitude. By 1200 the lower-altitude portion of the ash plume had drifted 125 km E. Significant ash emissions ended by 1330 based on webcam images. The ACC was lowered to Orange and the VAL to Watch at 1440. Satellite images showed extensive pyroclastic debris flows on most of the flanks that extended 1.2-3.3 km from the crater rim.
During 6-13 September elevated surface temperatures continued to be observed in satellite data, seismicity remained elevated with weak but steady tremor, and small, low-frequency earthquakes and small explosions were reported, except on 12 September. On 6 September a low-level ash plume rose to 1.5-1.8 km altitude and drifted SSE. Occasional small and diffuse gas-and-steam emissions at the summit were visible in webcam images. Around 1800 on 13 September seismic tremor amplitudes began to increase, and small explosions were detected in seismic and infrasound data. Incandescent lava at the summit was seen in a webcam image taken at 0134 on 14 September during a period of elevated tremor. No ash emissions were reported during the period of elevated seismicity. Lava fountaining began around 0200, based on webcam images. Satellite-based radar observations showed that the lava fountaining activity led to the growth of a cone in the summit crater, which refilled most of the crater. By 0730 seismicity significantly declined and remained at low levels.
Seismic tremor began to increase around 0900 on 15 September and rapidly intensified. An explosive eruption began at around 1710, which prompted AVO to raise the ACC to Red and the VAL to Warning. Within about 30 minutes ash plumes drifted E below a weather cloud at 8.2 km altitude. The National Weather Service estimated that an ash-rich plume rose as high as 12.8 km altitude and produced volcanic lightning. The upper part of the ash plume detached from the vent around 1830 and drifted E, and was observed over the Gulf of Alaska. Around the same time, seismicity dramatically decreased. Trace ashfall was reported in the community of False Pass (38 km ENE) between 1800-2030 and also in King Cove and nearby marine waters. Activity declined at around 1830 although seismicity remained elevated, ash emissions, and ashfall continued until 2100. Lightning was again detected beginning around 1930, which suggested that ash emissions continued. Ongoing explosions were detected in infrasound data, at a lower level than during the most energetic phase of this event. Lightning was last detected at 2048. By 2124 the intensity of the eruption had decreased, and ash emissions were likely rising to less than 6.7 km altitude. Seismicity returned to pre-eruption levels. On 16 September the ACC was lowered to Orange and the VAL to Watch at 1244; the sulfur dioxide plume that was emitted from the previous eruption event was still visible over the northern Pacific Ocean. Elevated surface temperatures, gas-and-steam emissions from the vent, and new, small lahars were reported on the upper flanks based on satellite and webcam images. Minor deposits were reported on the flanks which were likely the result of collapse of previously accumulated lava near the summit crater.
Elevated seismicity with tremor, small earthquakes, and elevated surface temperatures were detected during 17-23 September. Minor gas-and-steam emissions were visible in webcam images. On 20 September small volcanic debris flows were reported on the upper flanks. On 21 September a small ash deposit was observed on the upper flanks extending to the NE based on webcam images. Seismic tremor increased significantly during 22-23 September. Regional infrasound sensors suggested that low-level eruptive activity was occurring within the summit crater by around 1800 on 23 September. Even though seismicity was at high levels, strongly elevated surface temperatures indicating lava at the surface were absent and no ash emissions were detected; weather clouds at 0.6-4.6 km altitude obscured views. At 0025 on 24 September AVO noted that seismicity continued at high levels and nearly continuous small infrasound signals began, likely from low-level eruptive activity. Strongly elevated surface temperatures were identified in satellite images by 0900 and persisted throughout the day; the higher temperatures along with infrasound and seismic data were consistent with lava erupting at the summit. Around 1700 similarly elevated surface temperatures were detected from the summit in satellite data, which suggested that more vigorous lava fountaining had started. Starting around 1800 low-level ash emissions rose to altitudes less than 4.6 km altitude and quickly dissipated.
Beginning at midnight on 25 September, a series of seismic signals consistent with volcanic flows were recorded on the N side of the volcano. A change in seismicity and infrasound signals occurred around 0535 and at 0540 a significant ash cloud formed and quickly reached 14 km altitude and drifted E along the Alaska Peninsula. The cloud generated at least 150 lightning strokes with thunder that could be heard by people in False Pass. Seismicity rapidly declined to near background levels around 0600. AVO increased the ACC to Red and the VAL to Warning at 0602. The ash cloud detached from the volcano at around 0700, rose to 11.6 km altitude, and drifted ESE. Trace to minor amounts of ashfall were reported by the communities of False Pass, King Cove, Cold Bay, and Sand Point around 0700. Ash emissions continued at lower altitudes of 6-7.6 km altitude at 0820. Small explosions at the vent area continued to be detected in infrasound data and likely represented low-level eruptive activity near the vent. Due to the significant decrease in seismicity and ash emissions the ACC was lowered to Orange and the VAL to Watch at 1234. Radar data showed significant collapses of the crater that occurred on 25 September. Satellite data also showed significant hot, degassing pyroclastic and lahar deposits on all flanks, including more extensive flows on the ENE and WSW sections below two new collapse scarps. Following the significant activity during 24-25 September, only low-level activity was observed. Seismicity decreased notably near the end of the strong activity on 25 September and continued to decrease through the end of the month, though tremor and small earthquakes were still reported. No explosive activity was detected in infrasound data through 2 October. Gas-and-steam emissions rose to 3.7 km altitude, as reported by pilots and seen in satellite images. Satellite data from 26 September showed that significant collapses had occurred at the summit crater and hot, steaming deposits from pyroclastic flows and lahars were present on all the flanks, particularly to the ENE and WSW. A small ash cloud was visible in webcam images on 27 September, likely from a collapse at the summit cone. High elevated surface temperatures were observed in satellite imagery during 27-28 September, which were likely the result of hot deposits on the flanks erupted on 25 September. Minor steaming at the summit crater and from an area on the upper flanks was visible in webcam images on 28 September.
During October, explosion events continued between periods of low activity. Seismicity significantly increased starting at around 2100 on 2 October; around the same time satellite images showed an increase in surface temperatures consistent with lava fountaining. Small, hot avalanches of rock and lava descended an unspecified flank. In addition, a distinct increase in infrasound, seismicity, and lightning detections was followed by an ash plume that rose to 12.2 km altitude and drifted S and E at 0520 on 3 October, based on satellite images. Nighttime webcam images showed incandescence due to lava fountaining at the summit and pyroclastic flows descending the NE flank. AVO reported that a notable explosive eruption started at 0547 and lasted until 0900 on 3 October, which prompted a rise in the ACC to Red and the VAL to Warning. Subsequent ash plumes rose to 6-7.6 km altitude by 0931. At 1036 the ACC was lowered back to Orange and the VAL to Watch since both seismic and infrasound data quieted substantially and were slightly above background levels. Gas-and-steam emissions were observed at the summit, based on webcam images. Trace amounts of ashfall were observed in Cold Bay. Resuspended ash was present at several kilometers altitude near the volcano. During the afternoon, low-level ash plumes were visible at the flanks, which appeared to be largely generated by rock avalanches off the summit crater following the explosive activity. These ash plumes rose to 3 km altitude and drifted W. Trace amounts of ashfall were reported by observers in Cold Bay and Unalaska and flights to these communities were disrupted by the ash cloud. Satellite images taken after the eruption showed evidence of pyroclastic flows and lahar deposits in drainages 2 km down the SW flank and about 3.2 km down the NE flank, and continued erosion of the crater rim. Small explosion craters at the end of the pyroclastic flows on the NE flank were noted for the first time, which may have resulted from gas-and-steam explosions when hot deposits interact with underlying ice.
During 4 October seismicity, including frequent small earthquakes, remained elevated, but was gradually declining. Ash plumes were produced for over eight hours until around 1400 that rose to below 3.7 km altitude. These ash plumes were primarily generated off the sides of the volcano where hot rock avalanches from the crater rim had entered drainages to the SW and NE. Two explosion craters were observed at the base of the NE deposits about 3.2 km from the crater rim. Webcam images showed the explosion craters were a source of persistent ash emissions; occasional collapse events also generated ash. Seismicity remained elevated with sulfur dioxide emissions that had a daily average of more than 1,000 tons per day, and frequent small earthquakes through the end of the month. Frequent elevated surface temperatures were identified in satellite images and gas-and-steam plumes were observed in webcam images, although weather conditions occasionally prevented clear views of the summit. Emissions were robust during 14-16 October and were likely generated by the interaction of hot material and snow and ice. During the afternoon of 21 October a strong gas-and-steam plume rose to 3-4.6 km altitude and extended 40 km WSW, based on satellite images and reports from pilots. On 31 October the ACC was lowered to Yellow and the VAL was lowered to Advisory.
Activity in November was characterized by elevated seismicity with ongoing seismic tremor and small, low-frequency earthquakes, elevated surface temperatures, and gas-and-steam emissions. There was an increase in seismic and infrasound tremor amplitudes starting at 1940 on 2 November. As a result, the ACC was again raised to Orange and the VAL was increased to Watch, although ash was not identified in satellite data. An ash cloud rose to 6.1 km altitude and drifted W according to satellite data at 2000. By 0831 on 3 November ash emissions were no longer visible in satellite images. On 6 and 9 November air pressure sensors detected signals consistent with small explosions. Small explosions were detected in infrasound data consistent with weak Strombolian activity on 19 and 21 November. Seismicity started to decrease on 21 November. On 25 November gas-and-steam emissions were emitted from the vent as well as from a scarp on the NE side of the volcano near the summit. A gas-and-steam plume extended about 50 km SSE and was observed in satellite and webcam images on 26 November. On 28 November small explosions were observed in seismic and local infrasound data and gas-and-steam emissions were visible from the summit and from the upper NE collapse scarp based on webcam images. Possible small explosions were observed in infrasound data on 30 November. Weakly elevated surface temperatures and a persistent gas-and-steam plume from the summit and collapse scarps on the upper flanks. A passing aircraft reported the gas-and-steam plume rose to 3-3.4 km altitude on 30 November, but no significant ash emissions were detected.
Satellite data. MODIS thermal anomaly data provided through MIROVA (Middle InfraRed Observation of Volcanic Activity) showed a strong pulse of thermal activity beginning in July 2023 that continued through November 2023 (figure 48). This strong activity was due to Strombolian explosions and lava fountaining events at the summit crater. According to data from MODVOLC thermal alerts, a total of 101 hotspots were detected near the summit crater in July (11-14, 16-19, 23-24 and 26), August (4, 25-26, and 29), September (5, 12, and 17), and October (3, 4, and 8). Infrared satellite data showed large lava flows descending primarily the northern and SE flanks during the reporting period (figure 49). Sulfur dioxide plumes often exceeded two Dobson Units (DUs) and drifted in different directions throughout the reporting period, based on satellite data from the TROPOMI instrument on the Sentinel-5P satellite (figure 50).
Geologic Background. The symmetrical glacier-covered Shishaldin in the Aleutian Islands is the westernmost of three large stratovolcanoes in the eastern half of Unimak Island. The Aleuts named the volcano Sisquk, meaning "mountain which points the way when I am lost." Constructed atop an older glacially dissected edifice, it is largely basaltic in composition. Remnants of an older edifice are exposed on the W and NE sides at 1,500-1,800 m elevation. There are over two dozen pyroclastic cones on its NW flank, which is covered by massive aa lava flows. Frequent explosive activity, primarily consisting of Strombolian ash eruptions from the small summit crater, but sometimes producing lava flows, has been recorded since the 18th century. A steam plume often rises from the summit crater.
Information Contacts: Alaska Volcano Observatory (AVO), a cooperative program of a) U.S. Geological Survey, 4200 University Drive, Anchorage, AK 99508-4667 USA (URL: https://avo.alaska.edu/), b) Geophysical Institute, University of Alaska, PO Box 757320, Fairbanks, AK 99775-7320, USA, and c) Alaska Division of Geological & Geophysical Surveys, 794 University Ave., Suite 200, Fairbanks, AK 99709, USA (URL: http://dggs.alaska.gov/); MIROVA (Middle InfraRed Observation of Volcanic Activity), a collaborative project between the Universities of Turin and Florence (Italy) supported by the Centre for Volcanic Risk of the Italian Civil Protection Department (URL: http://www.mirovaweb.it/); Hawai'i Institute of Geophysics and Planetology (HIGP) - MODVOLC Thermal Alerts System, School of Ocean and Earth Science and Technology (SOEST), Univ. of Hawai'i, 2525 Correa Road, Honolulu, HI 96822, USA (URL: http://modis.higp.hawaii.edu/); NASA Global Sulfur Dioxide Monitoring Page, Atmospheric Chemistry and Dynamics Laboratory, NASA Goddard Space Flight Center (NASA/GSFC), 8800 Greenbelt Road, Goddard, Maryland, USA (URL: https://so2.gsfc.nasa.gov/); Copernicus Browser, Copernicus Data Space Ecosystem, European Space Agency (URL: https://dataspace.copernicus.eu/browser/).
Ioto
Japan
24.751°N, 141.289°E; summit elev. 169 m
All times are local (unless otherwise noted)
New eruption with discolored water, ejecta, and floating pumice during October-December 2023
Ioto (Iwo-jima), located about 1,200 km S of Tokyo, lies within a 9-km-wide submarine caldera along the Izu-Bonin-Mariana volcanic arc. Previous eruptions date back to 1889 and have consisted of dominantly phreatic explosions, pumice deposits during 2001, and discolored water. A submarine eruption during July through December 2022 was characterized by discolored water, pumice deposits, and gas emissions (BGVN 48:01). This report covers a new eruption during October through December 2023, which consisted of explosions, black ejecta, discolored water, and floating pumice, based on information from the Japan Meteorological Association (JMA), the Japan Coast Guard (JCG), and satellite data.
JMA reported that an eruption had been occurring offshore of Okinahama on the SE side of the island since 21 October, which was characterized by volcanic tremor, according to the Japan Maritime Self-Defense Force (JMSDF) Iwo Jima Air Base (figure 22). According to an 18 October satellite image a plume of discolored water at the site of this new eruption extended NE (figure 23). During an overflight conducted on 30 October, a vent was identified about 1 km off the coast of Okinahama. Observers recorded explosions every few minutes that ejected dark material about 20 m above the ocean and as high as 150 m. Ejecta from the vent formed a black-colored island about 100 m in diameter, according to observations conducted from the air by the Earthquake Research Institute of the University of Tokyo in cooperation with the Mainichi newspaper (figure 24). Occasionally, large boulders measuring more than several meters in size were also ejected. Observations from the Advanced Land Observing Satellite Daichi-2 and Sentinel-2 satellite images also confirmed the formation of this island (figure 23). Brown discolored water and floating pumice were present surrounding the island.
The eruption continued during November. During an overflight on 3 November observers photographed the island and noted that material was ejected 169 m high, according to a news source. Explosions gradually became shorter, and, by the 3rd, they occurred every few seconds; dark and incandescent material were ejected about 800 m above the vent. On 4 November eruptions were accompanied by explosive sounds. Floating, brown-colored pumice was present in the water surrounding the island. There was a brief increase in the number of volcanic earthquakes during 8-14 November and 24-25 November. The eruption temporarily paused during 9-11 November and by 12 November eruptions resumed to the W of the island. On 10 November dark brown-to-dark yellow-green discolored water and a small amount of black floating material was observed (figure 25). A small eruption was reported on 18 November off the NE coast of the island, accompanied by white gas-and-steam plumes (figure 23). Another pause was recorded during 17-19 November, which then resumed on 20 November and continued erupting intermittently. According to a field survey conducted by the National Institute for Disaster Prevention Science and Technology on 19 November, a 30-m diameter crater was visible on the NE coast where landslides, hot water, and gray volcanic ash containing clay have occurred and been distributed previously. Erupted blocks about 10 cm in diameter were distributed about 90-120 m from the crater. JCG made observations during an overflight on 23 November and reported a phreatomagmatic eruption. Explosions at the main vent generated dark gas-and-ash plumes that rose to 200 m altitude and ejected large blocks that landed on the island and in the ocean (figure 26). Discolored water also surrounded the island. The size of the new island had grown to 450 m N-S x 200 m E-W by 23 November, according to JCG.
The eruption continued through 11 December, followed by a brief pause in activity, which then resumed on 31 December, according to JMA. Intermittent explosions produced 100-m-high black plumes at intervals of several minutes to 30 minutes during 1-10 December. Overflights were conducted on 4 and 15 December and reported that the water surrounding the new island was discolored to dark brown-to-dark yellow-green (figure 27). No floating material was reported during this time. In comparison to the observations made on 23 November, the new land had extended N and part of it had eroded away. In addition, analysis by the Geospatial Information Authority of Japan using SAR data from Daichi-2 also confirmed that the area of the new island continued to decrease between 4 and 15 December. Ejected material combined with wave erosion transformed the island into a “J” shape, 500-m-long and with the curved part about 200 m offshore of Ioto. The island was covered with brown ash and blocks, and the surrounding water was discolored to greenish-brown and contained an area of floating pumice. JCG reported from an overflight on 4 December that volcanic ash-like material found around the S vent on the NE part of the island was newly deposited since 10 November (figure 28). By 15 December the N part of the “J” shaped island had separated and migrated N, connecting to the Okinahama coast and the curved part of the “J” had eroded into two smaller islands (figure 27).
References. Ukawa, M., Fujita, E., Kobayashi, T., 2002, Recent volcanic activity of Iwo Jima and the 2001 eruption, Monthly Chikyu, Extra No. 39, 157-164.
Geologic Background. Ioto, in the Volcano Islands of Japan, lies within a 9-km-wide submarine caldera. The volcano is also known as Ogasawara-Iojima to distinguish it from several other "Sulfur Island" volcanoes in Japan. The triangular, low-elevation, 8-km-long island narrows toward its SW tip and has produced trachyandesitic and trachytic rocks that are more alkalic than those of other volcanoes in this arc. The island has undergone uplift for at least the past 700 years, accompanying resurgent doming of the caldera; a shoreline landed upon by Captain Cook's surveying crew in 1779 is now 40 m above sea level. The Motoyama plateau on the NE half of the island consists of submarine tuffs overlain by coral deposits and forms the island's high point. Many fumaroles are oriented along a NE-SW zone cutting through Motoyama. Numerous recorded phreatic eruptions, many from vents on the W and NW sides of the island, have accompanied the uplift.
Information Contacts: Japan Meteorological Agency (JMA), 1-3-4 Otemachi, Chiyoda-ku, Tokyo 100-8122, Japan (URL: http://www.jma.go.jp/jma/indexe.html); Japan Coast Guard (JCG) Volcano Database, Hydrographic and Oceanographic Department, 3-1-1, Kasumigaseki, Chiyoda-ku, Tokyo 100-8932, Japan (URL: https://www1.kaiho.mlit.go.jp/GIJUTSUKOKUSAI/kaiikiDB/kaiyo22-2.htm); Copernicus Browser, Copernicus Data Space Ecosystem, European Space Agency (URL: https://dataspace.copernicus.eu/browser/); Asahi, 5-3-2, Tsukiji, Chuo Ward, Tokyo, 104-8011, Japan (URL: https://www.asahi.com/ajw/articles/15048458).
Purace (Colombia) — December 2023 Cite this Report
Purace
Colombia
2.3095°N, 76.3948°W; summit elev. 4650 m
All times are local (unless otherwise noted)
Gas-and-ash emission on 16 November 2023
Puracé, located in Colombia, is a stratovolcano that contains a 500-m-wide summit crater. It is part of the Los Coconucos volcanic chain that is a NW-SE trending group of seven cones and craters. The most recent eruption occurred during March 2022 that was characterized by frequent seismicity and gas-and-steam emissions (BGVN 47:06). This report covers a brief eruption during November 2023 based on monthly reports from the Popayán Observatory, part of the Servicio Geologico Colombiano (SGC).
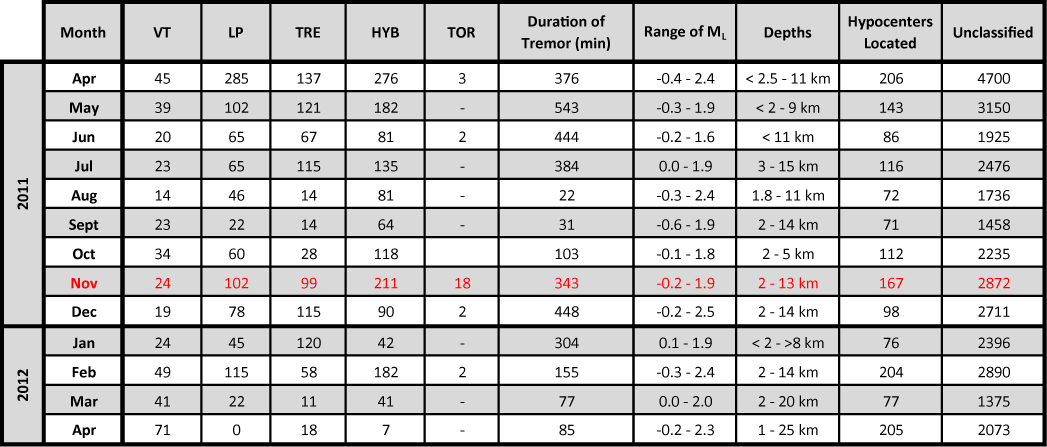
Activity during November 2022 through November 2023 primarily consisted of seismicity: VT-type events, LP-type events, HB-type events, and TR-type events (table 4). Maximum sulfur dioxide values were measured weekly and ranged from 259-5,854 tons per day (t/d) during November 2022 through April 2023. White gas-and-steam emissions were also occasionally reported.
SGC issued a report on 25 October that noted a significant increase in the number of earthquakes associated with rock fracturing. These earthquakes were located SE of the crater between Puracé and Piocollo at depths of 1-4 km. There were no reported variations in sulfur dioxide values, but SGC noted high carbon dioxide values, compared to those recorded in the first half of 2023.
SGC reported that at 1929 on 16 November the seismic network detected a signal that was possibly associated with a gas-and-ash emission, though it was not confirmed in webcam images due to limited visibility. On 17 November an observer confirmed ash deposits on the N flank. Webcam images showed an increase in degassing both inside the crater and from the NW flank, rising 700 m above the crater.
Table 4. Seismicity at Puracé during November 2022-November 2023. Volcano-tectonic (VT), long-period (LP), hybrid (HB), and tremor (TR) events are reported each month. Courtesy of SGC.
| Month |
Volcano-tectonic |
Long-period |
Hybrid |
Tremor |
| Nov 2022 |
429 |
2,023 |
5 |
831 |
| Dec 2022 |
423 |
1,390 |
9 |
834 |
| Jan 2023 |
719 |
1,622 |
0 |
957 |
| Feb 2023 |
598 |
1,701 |
2 |
1,124 |
| Mar 2023 |
331 |
2,408 |
147 |
607 |
| Apr 2023 |
614 |
4,427 |
33 |
148 |
| May 2023 |
620 |
3,717 |
170 |
109 |
| Jun 2023 |
467 |
3,293 |
86 |
148 |
| Jul 2023 |
1,116 |
5,809 |
183 |
542 |
| Aug 2023 |
692 |
2,927 |
94 |
321 |
| Sep 2023 |
887 |
1,505 |
82 |
848 |
| Oct 2023 |
2,373 |
2,949 |
135 |
692 |
| Nov 2023 |
1,212 |
2,302 |
69 |
293 |
Geologic Background. Puracé is an active andesitic volcano with a 600-m-diameter summit crater at the NW end of the Los Coconucos Volcanic Chain. This volcanic complex includes nine composite and five monogenetic volcanoes, extending from the Puracé crater more than 6 km SE to the summit of Pan de Azúcar stratovolcano. The dacitic massif which the complex is built on extends about 13 km NW-SE and 10 km NE-SW. Frequent small to moderate explosive eruptions reported since 1816 CE have modified the morphology of the summit crater, with the largest eruptions in 1849, 1869, and 1885.
Information Contacts: Servicio Geologico Colombiano (SGC), Diagonal 53 No. 34-53 - Bogotá D.C., Colombia (URL: https://www.sgc.gov.co/volcanes).
Etna
Italy
37.748°N, 14.999°E; summit elev. 3357 m
All times are local (unless otherwise noted)
Strombolian explosions, lava fountains, and lava flows during July-August 2023
Etna, located on the Italian island of Sicily, has had documented eruptions dating back to 1500 BCE. Activity typically originates from multiple cones at the summit, where several craters have formed and evolved. The currently active craters are Northeast Crater (NEC), Voragine (VOR), and Bocca Nuova (BN), and the Southeast Crater (SEC); VOR and BN were previously referred to as the “Central Crater”. The original Southeast crater formed in 1978, and a second eruptive site that opened on its SE flank in 2011 was named the New Southeast Crater (NSEC). Another eruptive site between the SEC and NSEC developed during early 2017 and was referred to as the "cono della sella" (saddle cone). The current eruption period began in November 2022 and has been characterized by intermittent Strombolian activity, lava flows, and ash plumes (BGVN 48:08). This report updates activity during July through October 2023, which includes primarily gas-and-steam emissions; during July and August Strombolian explosions, lava fountains, and lava flows were reported, based on weekly and special reports by the Osservatorio Etneo (OE), part of the Catania Branch of Italy's Istituo Nazionale di Geofisica e Vulcanologica (INGV) and satellite data.
Variable fumarolic degassing was reported at all summit craters (BN, VOR, NEC, and SEC) throughout the entire reporting period (table 15). The MIROVA (Middle InfraRed Observation of Volcanic Activity) volcano hotspot detection system based on the analysis of MODIS data showed frequent low-to-moderate power thermal anomalies during the reporting period (figure 399). During mid-August there was a pulse in activity that showed an increase in the power of the anomalies due to Strombolian activity, lava fountains, and lava flows. Infrared satellite imagery captured strong thermal anomalies at the central and southeast summit crater areas (figure 400). Accompanying thermal activity were occasional sulfur dioxide plumes that exceeded 2 Dobson Units (DUs) recorded by the TROPOMI instrument on the Sentinel-5P satellite (figure 401).
Table 15. Summary of activity at the four primary crater areas at the summit of Etna during July-October 2023. Information is from INGV weekly reports.
| Month |
Bocca Nuova (BN) |
Voragine (VOR) |
Northeast Crater (NEC) |
Southeast Crater (SEC) |
| Jul 2023 |
Continuous degassing. |
No observations. |
Weak gas emissions. |
Continuous degassing. Sporadic and weak-to-moderate ash emissions. Strombolian explosions. |
| Aug 2023 |
Continuous degassing. |
No observations. |
No observations. |
Continuous degassing. Occasional ash emissions. Strombolian activity, lava fountaining, and lava flows. |
| Sep 2023 |
Variable degassing. Crater incandescence. |
Weak fumarolic activity. |
Weak fumarolic activity. |
Variable degassing. |
| Oct 2023 |
Continuous degassing. |
Weak fumarolic activity. |
Weak fumarolic activity. |
Continuous degassing. |
Activity during July and August was relatively low and mainly consisted of degassing at the summit craters, particularly at SEC and BN. Cloudy weather prevented clear views of the summit during early July. During the night of 2 July some crater incandescence was visible at SEC. Explosive activity resumed at SEC during 9-10 July, which was characterized by sporadic and weak ash emissions that rapidly dispersed in the summit area (figure 402). INGV reported moderate Strombolian activity began at 2034 on 14 July and was confined to the inside of the crater and fed by a vent located in the E part of SEC. An ash emission was detected at 2037. A new vent opened on 15 July in the SE part of BN and began to produce continuous gas-and-steam emissions. During an inspection carried out on 28 July pulsating degassing, along with audible booms, were reported at two active vents in BN. Vigorous gas-and-steam emissions intermittently generated rings. On rare occasions, fine, reddish ash was emitted from BN1 and resuspended by the gas-and-steam emissions.
Around 2000 on 13 August INGV reported a sudden increase in volcanic tremor amplitude. Significant infrasonic activity coincided with the tremor increase. Incandescent flashes were visible through the cloud cover in webcam images of SEC (figure 403). Strombolian activity at SEC began to gradually intensify starting at 2040 as seismicity continued to increase. The Aviation Color Code (ACC) was raised to Yellow (the second lowest-level on a four-color scale) at 2126 and then to Orange (the second highest-level on a four-color scale) at 2129 due to above-background activity. The activity rapidly transitioned from Strombolian activity to lava fountains around 2333 that rose 300-400 m above the crater (figure 403). Activity was initially focused on the E vent of the crater, but then the vent located above the S flank of the cone also became active. A lava flow from this vent traveled SW into the drainage created on 10 February 2022, overlapping with previous flows from 10 and 21 February 2022 and 21 May 2023, moving between Monte Barbagallo and Monte Frumento Supino (figure 404). The lava flow was 350 m long, oriented NNE-SSW, and descended to an elevation of 2.8 km. Flows covered an area of 300,000 m2 and had an estimated volume of 900,000 m3. The ACC was raised to Red at 2241 based on strong explosive activity and ashfall in Rifugio Sapienza-Piano Vetore at 1.7 km elevation on the S flank. INGV reported that pyroclastic flows accompanied this activity.
Activity peaked between 0240 and 0330 on 14 August, when roughly 5-6 vents erupted lava fountains from the E to SW flank of SEC. The easternmost vents produced lava fountains that ejected material strongly to the E, which caused heavy fallout of incandescent pyroclastic material on the underlying flank, triggering small pyroclastic flows. This event was also accompanied by lightning both in the ash column and in the ash clouds that were generated by the pyroclastic flows. A fracture characterized by a series of collapse craters (pit craters) opened on the upper SW flank of SEC. An ash cloud rose a few kilometers above the crater and drifted S, causing ash and lapilli falls in Rifugio Sapienza and expanding toward Nicolosi, Mascalucia, Catania, and up to Syracuse. Ashfall resulted in operational problems at the Catania airport (50 km S), which lasted from 0238 until 2000. By 0420 the volcanic tremor amplitude values declined to background levels. After 0500 activity sharply decreased, although the ash cloud remained for several hours and drifted S. By late morning, activity had completely stopped. The ACC was lowered to Orange as volcanic ash was confined to the summit area. Sporadic, minor ash emissions continued throughout the day. At 1415 the ACC was lowered to Yellow and then to Green at 1417.
During the night of 14-15 August only occasional flashes were observed, which were more intense during avalanches of material inside the eruptive vents. Small explosions were detected at SEC at 2346 on 14 August and at 0900 on 26 August that each produced ash clouds which rapidly dispersed into the atmosphere (figure 405). According to a webcam image, an explosive event detected at 2344 at SEC generated a modest ash cloud that was rapidly dispersed by winds. The ACC was raised to Yellow at 2355 on 14 August due to increasing unrest and was lowered to Green at 0954 on 15 August.
Activity during September and October was relatively low and mainly characterized by variable degassing from BN and SEC. Intense, continuous, and pulsating degassing was accompanied by roaring sounds and flashes of incandescence at BN both from BN1 and the new pit crater that formed during late July (figure 406). The degassing from the new pit crater sometimes emitted vapor rings. Cloudy weather during 6-8 September prevented observations of the summit craters .
Geologic Background. Mount Etna, towering above Catania on the island of Sicily, has one of the world's longest documented records of volcanism, dating back to 1500 BCE. Historical lava flows of basaltic composition cover much of the surface of this massive volcano, whose edifice is the highest and most voluminous in Italy. The Mongibello stratovolcano, truncated by several small calderas, was constructed during the late Pleistocene and Holocene over an older shield volcano. The most prominent morphological feature of Etna is the Valle del Bove, a 5 x 10 km caldera open to the east. Two styles of eruptive activity typically occur, sometimes simultaneously. Persistent explosive eruptions, sometimes with minor lava emissions, take place from one or more summit craters. Flank vents, typically with higher effusion rates, are less frequently active and originate from fissures that open progressively downward from near the summit (usually accompanied by Strombolian eruptions at the upper end). Cinder cones are commonly constructed over the vents of lower-flank lava flows. Lava flows extend to the foot of the volcano on all sides and have reached the sea over a broad area on the SE flank.
Information Contacts: Sezione di Catania - Osservatorio Etneo, Istituto Nazionale di Geofisica e Vulcanologia (INGV), Sezione di Catania, Piazza Roma 2, 95123 Catania, Italy (URL: http://www.ct.ingv.it/it/); MIROVA (Middle InfraRed Observation of Volcanic Activity), a collaborative project between the Universities of Turin and Florence (Italy) supported by the Centre for Volcanic Risk of the Italian Civil Protection Department (URL: http://www.mirovaweb.it/); NASA Global Sulfur Dioxide Monitoring Page, Atmospheric Chemistry and Dynamics Laboratory, NASA Goddard Space Flight Center (NASA/GSFC), 8800 Greenbelt Road, Goddard MD 20771, USA (URL: https://so2.gsfc.nasa.gov/); Copernicus Browser, Copernicus Data Space Ecosystem, European Space Agency (URL: https://dataspace.copernicus.eu/browser/).
Suwanosejima (Japan) — December 2023 Cite this Report
Suwanosejima
Japan
29.638°N, 129.714°E; summit elev. 796 m
All times are local (unless otherwise noted)
Eruption plumes, crater incandescence, and occasional explosions during July-October 2023
Suwanosejima is an 8-km-long island that consists of a stratovolcano and two active summit craters, located in the northern Ryukyu Islands, Japan. Volcanism over the past century has been characterized by Strombolian explosions, ash plumes, and ashfall. The current eruption began in October 2004 and has more recently consisted of frequent eruption plumes, explosions, and incandescent ejecta (BGVN 48:07). This report covers similar activity of ash plumes, explosions, and crater incandescence during July through October 2023 using monthly reports from the Japan Meteorological Agency (JMA) and satellite data.
Thermal activity during the reporting period was relatively low; only one low-power thermal anomaly was detected during mid-July and one during early August, based on a MIROVA (Middle InfraRed Observation of Volcanic Activity) Log Radiative Power graph of the MODIS thermal anomaly data. On two clear weather days, a thermal anomaly was visible in infrared satellite images (figure 81).
Low-level activity was reported at the Otake crater during July and no explosions were detected. Eruption plumes rose as high as 1.8 km above the crater. On 13 July an ash plume rose 1.7 km above the crater rim, based on a webcam image. During the night of the 28th crater incandescence was visible in a webcam image. An eruptive event reported on 31 July produced an eruption plume that rose 2.1 km above the crater. Seismicity consisted of 11 volcanic earthquakes on the W flank, the number of which had decreased compared to June (28) and 68 volcanic earthquakes near the Otake crater, which had decreased from 722 in the previous month. According to observations conducted by the University of Tokyo Graduate School of Science, Kyoto University Disaster Prevention Research Institute, Toshima Village, and JMA, the amount of sulfur dioxide emissions released during the month was 400-800 tons per day (t/d).
Eruptive activity in the Otake crater continued during August and no explosions were reported. An eruptive event produced a plume that rose 1 km above the crater at 1447 on 12 August. Subsequent eruptive events were recorded at 0911 on 16 August, at 1303 on 20 August, and at 0317 on 21 August, which produced ash plumes that rose 1-1.1 km above the crater and drifted SE, SW, and W. On 22 August an ash plume was captured in a webcam image rising 1.4 km above the crater (figure 82). Multiple eruptive events were detected on 25 August at 0544, 0742, 0824, 1424, and 1704, which generated ash plumes that rose 1.1-1.2 km above the crater and drifted NE, W, and SW. On 28 August a small amount of ashfall was observed as far as 1.5 km from the crater. There were 17 volcanic earthquakes recorded on the W flank of the volcano and 79 recorded at the Otake crater during the month. The amount of sulfur dioxide emissions released during the month was 400-800 t/d.
Activity continued at the Otake crater during September. Occasionally, nighttime crater incandescence was observed in webcam images and ashfall was reported. An eruptive event at 1949 on 4 September produced an ash plume that rose 1 km above the crater and drifted SW. On 9 September several eruption events were detected at 0221, 0301, and 0333, which produced ash plumes that rose 1.1-1.4 km above the crater rim and drifted W; continuous ash emissions during 0404-0740 rose to a maximum height of 2 km above the crater rim (figure 83). More eruptive events were reported at 1437 on 10 September, at 0319 on 11 September, and at 0511 and 1228 on 15 September, which generated ash plumes that rose 1-1.8 km above the crater. During 25, 27, and 30 September, ash plumes rose as high as 1.3 km above the crater rim. JMA reported that large blocks were ejected as far as 300 m from the center of the crater. There were 18 volcanic earthquakes detected beneath the W flank and 82 volcanic earthquakes detected near the Otake crater. The amount of sulfur dioxide released during the month ranged from 600 to 1,600 t/d.
Activity during early-to-mid-October consisted of occasional explosions, a total number of 13, and ash plumes that rose as high as 1.9 km above the Otake crater rim on 29 October (figure 84). These explosions are the first to have occurred since June 2023. Continuous ash emissions were reported during 0510-0555 on 1 October. Explosions were recorded at 0304, 2141, and 2359 on 2 October, at 0112 on 3 October, and at 1326 on 6 October, which produced ash plumes that rose as high as 1 km above the crater rim and drifted SW and W. An explosion was noted at 0428 on 3 October, but emission details were unknown. A total of eight explosions were recorded by the seismic network at 1522 on 14 October, at 0337, 0433, 0555, 1008, and 1539 on 15 October, and at 0454 and 0517 on 16 October. Ash plumes from these explosions rose as high as 900 m above the crater and drifted SE. Eruptive events during 25-27 and 29-30 October generated plumes that rose as high as 1.9 km above the crater and drifted SE, S, and SW. Ash was deposited in Toshima village (3.5 km SSW). Eruptive activity occasionally ejected large volcanic blocks as far as 600 m from the crater. Nighttime crater incandescence was visible in webcams. Intermittent ashfall was reported as far as 1.5 km from the crater. There were 43 volcanic earthquakes detected on the W flank during the month, and 184 volcanic earthquakes detected near the Otake crater. The amount of sulfur dioxide emitted ranged between 400 and 900 t/d.
Geologic Background. The 8-km-long island of Suwanosejima in the northern Ryukyu Islands consists of an andesitic stratovolcano with two active summit craters. The summit is truncated by a large breached crater extending to the sea on the E flank that was formed by edifice collapse. One of Japan's most frequently active volcanoes, it was in a state of intermittent Strombolian activity from Otake, the NE summit crater, between 1949 and 1996, after which periods of inactivity lengthened. The largest recorded eruption took place in 1813-14, when thick scoria deposits covered residential areas, and the SW crater produced two lava flows that reached the western coast. At the end of the eruption the summit of Otake collapsed, forming a large debris avalanche and creating an open collapse scarp extending to the eastern coast. The island remained uninhabited for about 70 years after the 1813-1814 eruption. Lava flows reached the eastern coast of the island in 1884. Only about 50 people live on the island.
Information Contacts: Japan Meteorological Agency (JMA), 1-3-4 Otemachi, Chiyoda-ku, Tokyo 100-8122, Japan (URL: http://www.jma.go.jp/jma/indexe.html); MIROVA (Middle InfraRed Observation of Volcanic Activity), a collaborative project between the Universities of Turin and Florence (Italy) supported by the Centre for Volcanic Risk of the Italian Civil Protection Department (URL: http://www.mirovaweb.it/); Hawai'i Institute of Geophysics and Planetology (HIGP) - MODVOLC Thermal Alerts System, School of Ocean and Earth Science and Technology (SOEST), Univ. of Hawai'i, 2525 Correa Road, Honolulu, HI 96822, USA (URL: http://modis.higp.hawaii.edu/); Copernicus Browser, Copernicus Data Space Ecosystem, European Space Agency (URL: https://dataspace.copernicus.eu/browser/).
Aira
Japan
31.5772°N, 130.6589°E; summit elev. 1117 m
All times are local (unless otherwise noted)
Explosions, ash plumes, ash fall, and crater incandescence during July-October 2023
Aira caldera, located in the northern half of Kagoshima Bay, Japan, contains the post-caldera Sakurajima volcano. Eruptions typically originate from the Minamidake crater, and since the 8th century, ash deposits have been recorded in the city of Kagoshima (10 km W), one of Kyushu’s largest cities. The Minamidake summit cone and crater has had persistent activity since 1955; the Showa crater on the E flank has also been intermittently active since 2006. The current eruption period began during March 2017 and has recently been characterized by intermittent explosions, eruption plumes, and ashfall (BGVN 48:07). This report updates activity during July through October 2023 and describes explosive events, ash plumes, nighttime crater incandescence, and ashfall, according to monthly activity reports from the Japan Meteorological Agency (JMA) and satellite data.
Thermal activity remained at low levels during this reporting period, according to the MIROVA (Middle InfraRed Observation of Volcanic Activity) system (figure 149). There was a slight increase in the number of anomalies during September through October. Occasional thermal anomalies were visible in infrared satellite images mainly at the Minamidake crater (Vent A is located to the left and Vent B is located to the right) (figure 150).
Table 30. Number of monthly explosive events, days of ashfall, area of ash covered, and sulfur dioxide emissions from Sakurajima’s Minamidake crater at Aira during July-October 2023. Note that smaller ash events are not listed. Ashfall days were measured at Kagoshima Local Meteorological Observatory and ashfall amounts represent material covering all the Kagoshima Prefecture. Data courtesy of JMA monthly reports.
| Month |
Explosive events |
Days of ashfall |
Ashfall amount (g/m2) |
SO2 emissions (tons/day) |
| Jul 2023 |
3 |
0 |
0 |
1,600-3,200 |
| Aug 2023 |
3 |
10 |
7 |
1,800-3,300 |
| Sep 2023 |
3 |
7 |
3 |
1,600-2,300 |
| Oct 2023 |
33 |
8 |
61 |
2,200-4,200 |
JMA reported that during July, there were eight eruptions, three of which were explosion events in the Showa crater. Large blocks were ejected as far as 600 m from the Showa crater. Very small eruptions were occasionally reported at the Minamidake crater. Nighttime incandescence was observed in both the Showa and Minamidake crater. Explosions were reported on 16 July at 2314 and on 17 July at 1224 and at 1232 (figure 151). Resulting eruption plumes rose 700-2,500 m above the crater and drifted N. On 23 July the number of volcanic earthquakes on the SW flank of the volcano increased. A strong Mw 3.1 volcanic earthquake was detected at 1054 on 26 July. The number of earthquakes recorded throughout the month was 545, which markedly increased from 73 in June. No ashfall was observed at the Kagoshima Regional Meteorological Observatory during July. According to a field survey conducted during the month, the daily amount of sulfur dioxide emissions was 1,600-3,200 tons per day (t/d).
There were three eruptions reported at the Minamidake crater during August, each of which were explosive. The explosions occurred on 9 August at 0345, on 13 August at 2205, and on 31 August at 0640, which generated ash plumes that rose 800-2,000 m above the crater and drifted W. There were two eruptions detected at Showa crater; on 4 August at 2150 ejecta traveled 800 m from the Showa crater and associated eruption plumes rose 2.3 km above the crater. The explosion at 2205 on 13 August generated an ash plume that rose 2 km above the crater and was accompanied by large blocks that were ejected 600 m from the Minamidake crater (figure 152). Nighttime crater incandescence was visible in a high-sensitivity surveillance camera at both craters. Seismicity consisted of 163 volcanic earthquakes, 84 of which were detected on the SW flank. According to the Kagoshima Regional Meteorological Observatory there was a total of 7 g/m2 of ashfall over the course of 10 days during the month. According to a field survey, the daily amount of sulfur dioxide emitted was 1,800-3,300 t/d.
During September, four eruptions were reported, three of which were explosion events. These events occurred at 1512 on 9 September, at 0018 on 11 September, and at 2211 on 13 September. Resulting ash plumes generally rose 800-1,100 m above the crater. An explosion produced an ash plume at 2211 on 13 September that rose as high as 1.7 km above the crater. Large volcanic blocks were ejected 600 m from the Minamidake crater. Smaller eruptions were occasionally observed at the Showa crater. Nighttime crater incandescence was visible at the Minamidake crater. Seismicity was characterized by 68 volcanic earthquakes, 28 of which were detected beneath the SW flank. According to the Kagoshima Regional Meteorological Observatory there was a total of 3 g/m2 of ashfall over the course of seven days during the month. A field survey reported that the daily amount of sulfur dioxide emitted was 1,600-2,300 t/d.
Eruptive activity during October consisted of 69 eruptions, 33 of which were described as explosive. These explosions occurred during 4 and 11-21 October and generated ash plumes that rose 500-3,600 m above the crater and drifted S, E, SE, and N. On 19 October at 1648 an explosion generated an ash plume that rose 3.6 km above the crater (figure 153). No eruptions were reported in the Showa crater; white gas-and-steam emissions rose 100 m above the crater from a vent on the N flank. Nighttime incandescence was observed at the Minamidake crater. On 24 October an eruption was reported from 0346 through 0430, which included an ash plume that rose 3.4 km above the crater. Ejected blocks traveled 1.2 km from the Minamidake crater. Following this eruption, small amounts of ashfall were observed from Arimura (4.5 km SE) and a varying amount in Kurokami (4 km E) (figure 154). The number of recorded volcanic earthquakes during the month was 190, of which 14 were located beneath the SW flank. Approximately 61 g/m2 of ashfall was reported over eight days of the month. According to a field survey, the daily amount of sulfur dioxide emitted was 2,200-4,200 t/d.
Geologic Background. The Aira caldera in the northern half of Kagoshima Bay contains the post-caldera Sakurajima volcano, one of Japan's most active. Eruption of the voluminous Ito pyroclastic flow accompanied formation of the 17 x 23 km caldera about 22,000 years ago. The smaller Wakamiko caldera was formed during the early Holocene in the NE corner of the caldera, along with several post-caldera cones. The construction of Sakurajima began about 13,000 years ago on the southern rim and built an island that was joined to the Osumi Peninsula during the major explosive and effusive eruption of 1914. Activity at the Kitadake summit cone ended about 4,850 years ago, after which eruptions took place at Minamidake. Frequent eruptions since the 8th century have deposited ash on the city of Kagoshima, located across Kagoshima Bay only 8 km from the summit. The largest recorded eruption took place during 1471-76.
Information Contacts: Japan Meteorological Agency (JMA), 1-3-4 Otemachi, Chiyoda-ku, Tokyo 100-8122, Japan (URL: http://www.jma.go.jp/jma/indexe.html); MIROVA (Middle InfraRed Observation of Volcanic Activity), a collaborative project between the Universities of Turin and Florence (Italy) supported by the Centre for Volcanic Risk of the Italian Civil Protection Department (URL: http://www.mirovaweb.it/); Copernicus Browser, Copernicus Data Space Ecosystem, European Space Agency (URL: https://dataspace.copernicus.eu/browser/).
Nishinoshima (Japan) — November 2023 Cite this Report
Nishinoshima
Japan
27.247°N, 140.874°E; summit elev. 100 m
All times are local (unless otherwise noted)
Gray emissions during October 2023
Nishinoshima is a small island in the Ogasawara Arc, about 1,000 km S of Tokyo, Japan. It contains prominent submarine peaks to the S, W, and NE. Recorded eruptions date back to 1973, with the current eruption period beginning in October 2022. Eruption plumes and fumarolic activity characterize recent activity (BGVN 48:10). This report covers the end of the eruption for September through October 2023, based on information from monthly reports of the Japan Meteorological Agency (JMA) monthly reports, and satellite data.
No eruptive activity was reported during September 2023, although JMA noted that the surface temperature was slightly elevated compared to the surrounding area since early March 2023. The Japan Coast Guard (JCG) conducted an overflight on 20 September and reported white gas-and-steam plumes rising 3 km above the central crater of the pyroclastic cone, as well as multiple white gas-and-steam emissions emanating from the N, E, and S flanks of the crater to the coastline. In addition, dark reddish brown-to-green discolored water was distributed around almost the entire circumference of the island.
Similar low-level activity was reported during October. Multiple white gas-and-steam emissions rose from the N, E, and S flanks of the central crater of the pyroclastic cone and along the coastline; these emissions were more intense compared to the previous overflight observations. Dark reddish brown-to-green discolored water remained visible around the circumference of the island. On 4 October aerial observations by JCG showed a small eruption consisting of continuous gas-and-steam emissions emanating from the central crater, with gray emissions rising to 1.5 km altitude (figure 129). According to observations from the marine weather observation vessel Keifu Maru on 26 October, white gas-and-steam emissions persisted from the center of the pyroclastic cone, as well as from the NW, SW, and SE coasts of the island for about five minutes. Slightly discolored water was visible up to about 1 km.
Frequent low-to-moderate power thermal anomalies were recorded in the MIROVA graph (Middle InfraRed Observation of Volcanic Activity) during September (figure 130). Occasional anomalies were detected during October, and fewer during November through December. A thermal anomaly was visible in the crater using infrared satellite imagery on 6, 8, 11, 16, 18, 21, and 23 September and 8, 13, 21, 26, and 28 October (figure 131).
Geologic Background. The small island of Nishinoshima was enlarged when several new islands coalesced during an eruption in 1973-74. Multiple eruptions that began in 2013 completely covered the previous exposed surface and continued to enlarge the island. The island is the summit of a massive submarine volcano that has prominent peaks to the S, W, and NE. The summit of the southern cone rises to within 214 m of the ocean surface 9 km SSE.
Information Contacts: Japan Meteorological Agency (JMA), 1-3-4 Otemachi, Chiyoda-ku, Tokyo 100-8122, Japan (URL: http://www.jma.go.jp/jma/indexe.html); MIROVA (Middle InfraRed Observation of Volcanic Activity), a collaborative project between the Universities of Turin and Florence (Italy) supported by the Centre for Volcanic Risk of the Italian Civil Protection Department (URL: http://www.mirovaweb.it/); Copernicus Browser, Copernicus Data Space Ecosystem, European Space Agency (URL: https://dataspace.copernicus.eu/browser/).
Kilauea (United States) — October 2023 Cite this Report
Kilauea
United States
19.421°N, 155.287°W; summit elev. 1222 m
All times are local (unless otherwise noted)
Strong lava fountains, lava flows, and spatter at Halema’uma’u during January-September 2023
Kīlauea is on the island of Hawai’i and overlaps the E flank of the Mauna Loa volcano. Its East Rift Zone (ERZ) has been intermittently active for at least 2,000 years. An extended eruption period began in January 1983 and was characterized by open lava lakes and lava flows from the summit caldera and the East Rift Zone. During May 2018 magma migrated into the Lower East Rift Zone (LERZ) and opened 24 fissures along a 6-km-long NE-trending fracture zone that produced lava flows traveling in multiple directions. As lava emerged from the fissures, the lava lake at Halema'uma'u drained and explosions sent ash plumes to several kilometers altitude (BGVN 43:10).
The current eruption period started during September 2021 and has been characterized by low-level lava effusions in the active Halema’uma’u lava lake (BGVN 48:01). This report covers three notable eruption periods during February, June, and September 2023 consisting of lava fountaining, lava flows, and spatter during January through September 2023 using information from daily reports, volcanic activity notices, and abundant photo, map, and video data from the US Geological Survey's (USGS) Hawaiian Volcano Observatory (HVO).
Activity during January 2023. Small earthquake swarms were recorded on 2 January 2023; increased seismicity and changes in the pattern of deformation were noted on the morning of 5 January. At around 1500 both the rate of deformation and seismicity drastically increased, which suggested magma movement toward the surface. HVO raised the Volcano Alert Level (VAL) to Watch (the second highest level on a four-level scale) and the Aviation Color Code (ACC) to Orange (the second highest color on a four-color scale) at 1520.
Multiple lava fountains and lava effusions from vents in the central eastern portion of the Halema’uma’u crater began on 5 January around 0434; activity was confined to the eastern half of the crater and within the basin of the western half of the crater, which was the focus of the eruption in 2021-2022 (figure 525). Incandescence was visible in webcam images at 1634 on 5 January, prompting HVO to raise the VAL to Warning (the highest level on a four-level scale) and the ACC to Red (the highest color on a four-color scale). Lava fountains initially rose as high as 50 m above the vent at the onset of the eruption (figure 526) but then declined to a more consistent 5-6 m height in the proceeding days. By 1930 that same day, lava had covered most of the crater floor (an area of about 1,200,000 m2) and the lava lake had a depth of 10 m. A higher-elevation island that formed during the initial phase of the December 2020 eruption remained exposed, appearing darker in images, along with a ring of older lava around the lava lake that was active prior to December 2022. Overnight during 5-6 January the lava fountains continued to rise 5 m high, and the lava effusion rate had slowed.
On 6 January at 0815 HVO lowered the VAL to Watch and the ACC to Orange due to the declining effusion rates. Sulfur dioxide emission rates ranged from 3,000-12,500 tonnes per day (t/d), the highest value of which was recorded on 6 January. Lava continued to erupt from the vents during 6-8 January, although the footprint of the active area had shrunk; a similar progression has been commonly observed during the early stages of recent eruptions at Halema’uma’u. On 9 January HVO reported one dominant lava fountain rising 6-7 m high in the E half of the crater. Lava flows built up the margins of the lake, causing the lake to be perched. On 10 January the eastern lava lake had an area of approximately 120,000 m2 that increased to 250,000 m2 by 17 January. During 13-31 January several small overflows occurred along the margins of the E lake. A smaller area of lava was active within the basin in the W half of the crater that had been the focus of activity during 2021-2022. On 19 January just after 0200 a small ooze-out was observed on the crater’s W edge.
Activity during February 2023. Activity continued in the E part of Halema’uma’u crater, as well as in a smaller basin in the W part of the 2021-2022 lava lake (figure 527). The E lava lake contained a single lava fountain and frequent overflows. HVO reported that during the morning of 1 February the large E lava lake began to cool and crust over in the center of the lake; two smaller areas of lava were observed on the N and S sides by the afternoon. The dominant lava fountain located in the S part of the lava lake paused for roughly 45 minutes at 2315 and resumed by midnight, rising 1-2 m. At 0100 on 2 February lava from the S part was effusing across the entire E lava lake area, covering the crusted over portion in the center of the lake and continuing across the majority of the previously measured 250,000 m2 by 0400. A small lava pond near the E lake produced an overflow around 0716 on 2 February. On 3 February some lava crust began to form against the N and E levees, which defined the 250,000 m2 eastern lava lake. The small S lava fountain remained active, rising 1-6 m high during 3-9 February; around 0400 on 5 February occasional bursts doubled the height of the lava fountain.
A large breakout occurred overnight during 2100 on 4 February to 0900 on 5 February on the N part of the crater floor, equal to or slightly larger in size than the E lava lake. A second, smaller lava fountain appeared in the same area of the E lava lake between 0300 and 0700 on 5 February and was temporarily active. This large breakout continued until 7 February. A small, brief breakout was reported in the S of the E lava lake around midnight on 7 February. In the W lake, as well as the smaller lava pond in the central portion of the crater floor, contained several overflows during 7-10 February and intermittent fountaining. Activity at the S small lava pond and the small S lava fountain within the E lake declined during 9-10 February. The lava pond in the central portion of the crater floor had nearly continuous, expansive flows during 10-13 February; channels from the small central lava pond seemed to flow into the larger E lake. During 13-18 February a small lava fountain was observed in the small lava pond in the central portion of the crater floor. Continuous overflows persisted during this time.
Activity in the eastern and central lakes began to decline in the late afternoon of 17 February. By 18 February HVO reported that the lava effusions had significantly declined, and that the eastern and central lakes were no longer erupting. The W lake in the basin remained active but at a greatly reduced level that continued to decline. HVO reported that this decrease in activity is attributed to notable deflationary tilt that began early on the morning of 17 February and lasted until early 19 February. By 19 February the W lake was mostly crusted over although some weak lava flows remained, which continued through 28 February. The sulfur dioxide emission rates ranged 250-2,800 t/d, the highest value of which was recorded on 6 February.
Activity during March 2023. The summit eruption at Halema’uma’u crater continued at greatly reduced levels compared to the previous two months. The E and central vents stopped effusing lava, and the W lava lake remained active with weak lava flows; the lake was mostly crusted over, although slowly circulating lava intermittently overturned the crust. By 6 March the lava lake in the W basin had stopped because the entire surface was crusted over. The only apparent surface eruptive activity during 5-6 March was minor ooze-outs of lava onto the crater floor, which had stopped by 7 March. Several hornitos on the crater floor still glowed through 12 March according to overnight webcam images, but they did not erupt any lava. A small ooze-out of lava was observed just after 1830 in the W lava lake on 8 March, which diminished overnight. The sulfur dioxide emission rate ranged from 155-321 t/d on 21 March. The VAL was lowered to Advisory, and the ACC was lowered to Yellow (the second lowest on a four-color scale) on 23 March due to a pause in the eruption since 7 March.
Activity during April-May 2023. The eruption at Halema’uma’u crater was paused; no lava effusions were visible on the crater floor. Sulfur dioxide emission rates ranged from 75-185 t/d, the highest of which was measured on 22 April. During May and June summit seismicity was elevated compared to seismicity that preceded the activity during January.
Activity during June 2023. Earthquake activity and changes in the patterns of ground deformation beneath the summit began during the evening of 6 June. The data indicated magma movement toward the surface, prompting HVO to raise the VAL to Watch and the ACC to Orange. At about 0444 on 7 June incandescence in Halema’uma’u crater was visible in webcam images, indicating that a new eruption had begun. HVO raised the VAL to Warning and the ACC to Red (the highest color on a four-color scale). Lava flowed from fissures that had opened on the crater floor. Multiple minor lava fountains were active in the central E portion of the Halema’uma’u crater, and one vent opened on the W wall of the caldera (figure 528). The eruptive vent on the SW wall of the crater continued to effuse into the lava lake in the far SW part of the crater (figure 529). The largest lava fountain consistently rose 15 m high; during the early phase of the eruption, fountain bursts rose as high as 60 m. Lava flows inundated much of the crater floor and added about 6 m depth of new lava within a few hours, covering approximately 10,000 m2. By 0800 on 7 June lava filled the crater floor to a depth of about 10 m. During 0800-0900 the sulfur dioxide emission rate was about 65,000 t/d. Residents of Pahala (30 km downwind of the summit) reported minor deposits of fine, gritty ash and Pele’s hair. A small spatter cone had formed at the vent on the SW wall by midday, and lava from the cone was flowing into the active lava lake. Fountain heights had decreased from the onset of the eruption and were 4-9 m high by 1600, with occasional higher bursts. Inflation switched to deflation and summit earthquake activity greatly diminished shortly after the eruption onset.
At 0837 on 8 June HVO lowered the VAL to Watch and the ACC to Orange because the initial high effusion rates had declined, and no infrastructure was threatened. The surface of the lava lake had dropped by about 2 m, likely due to gas loss by the morning of 8 June. The drop left a wall of cooled lava around the margins of the crater floor. Lava fountain heights decreased during 8-9 June but continued to rise to 10 m high. Active lava and vents covered much of the W half of Halema’uma’u crater in a broad, horseshoe-shape around a central, uplifted area (figure 530). The preliminary average effusion rate for the first 24 hours of the eruption was about 150 cubic meters per second, though the estimate did not account for vesiculated lava and variations in crater floor topography. The effusion rate during the very earliest phases of the eruption appeared significantly higher than the previous three summit eruptions based on the rapid coverage of the entire crater floor. An active lava lake, also referred to as the “western lava lake” was centered within the uplifted area and was fed by a vent in the NE corner. Two small active lava lakes were located just SE from the W lava lake and in the E portion of the crater floor.
During 8-9 June the lava in the central lava lake had a thickness of approximately 1.5 m, based on measurements from a laser rangefinder. During 9-12 June the height of the lava fountains decreased to 9 m high. HVO reported that the previously active lava lake in the E part of the crater appeared stagnant during 10-11 June. The surface of the W lake rose approximately 1 m overnight during 11-12 June, likely due to the construction of a levee around it. Only a few small fountains were active during 12-13 June; the extent of the active lava had retreated so that all activity was concentrated in the SW and central parts of Halema’uma’u crater. Intermittent spattering from the vent on the SW wall was visible in overnight webcam images during 13-18 June. On the morning of 14 June a weak lava effusion originated from near the western eruptive vent, but by 15 June there were no signs of continued activity. HVO reported that other eruptive vents in the SW lava lake had stopped during this time, following several days of waning activity; lava filled the lake by about 0.5 m. Lava circulation continued in the central lake and no active lava was reported in the northern or eastern parts of the crater. Around 0800 on 15 June the top of the SW wall spatter cone collapsed, which was followed by renewed and constant spattering from the top vent and a change in activity from the base vent; several new lava flows effused from the top of the cone, as well as from the pre-existing tube-fed flow from its base. Accumulation of lava on the floor resulted in a drop of the central basin relative to the crater floor, allowing several overflows from the SW lava lake to cascade into the basin during the night of 15 June into the morning of 16 June.
Renewed lava fountaining was reported at the eruptive vent on the SW side of the crater during 16-19 June, which effused lava into the far SW part of the crater. This activity was described as vigorous during midday on 16 June; a group of observatory geologists estimated that the lava was consistently ejected at least 10 m high, with some spatter ejected even higher and farther. Deposits from the fountain further heightened and widened the spatter cone built around the original eruptive vent in the lower section of the crater wall. Multiple lava flows from the base of the cone were fed into the SW lava lake and onto the southwestern-most block from the 2018 collapse within Halema’uma’u on 17 June (figure 531); by 18 June they focused into a single flow feeding into the SW lava lake. On the morning of 19 June a second lava flow from the base of the eruptive cone advanced into the SW lava lake.
Around 1600 on 19 June there was a rapid decline in lava fountaining and effusion at the eruptive vent on the SW side of the crater; vent activity had been vigorous up to that point (figure 532). Circulation in the lava lake also slowed, and the lava lake surface dropped by several meters. Overnight webcam images showed some previously eruptive lava still flowing onto the crater floor, which continued until those flows began to cool. By 21 June no lava was erupting in Halema’uma’u crater. Overnight webcam images during 29-30 June showed some incandescence from previously erupted lava flows as they continued to cool. Seismicity in the crater declined to low levels. Sulfur dioxide emission rates ranged 160-21,000 t/d throughout the month, the highest measurement of which was recorded on 8 June. On 30 June the VAL was lowered to Advisory (the second level on a four-level scale) and the ACC was lowered to Yellow. Gradual inflation was detected at summit tiltmeters during 19-30 June.
Activity during July-August 2023. During July, the eruption paused; no lava was erupting in Halema’uma’u crater. Nighttime webcam images showed some incandescence from previously erupted lava as it continued to cool on the crater floor. During the week of 14 August HVO reported that the rate in seismicity increased, with 467 earthquakes of Mw 3.2 and smaller occurring. Sulfur dioxide emission rates remained low, ranging from 75-86 t/d, the highest of which was recorded on 10 and 15 August. On 15 August beginning at 0730 and lasting for several hours, a swarm of approximately 50 earthquakes were detected at a depth of 2-3 km below the surface and about 2 km long directly S of Halema’uma’u crater. HVO reported that this was likely due to magma movement in the S caldera region. During 0130-0500 and 1700-2100 on 21 August two small earthquake swarms of approximately 20 and 25 earthquakes, respectively, occurred at the same location and at similar depths. Another swarm of 50 earthquakes were recorded during 0430-0830 on 23 August. Elevated seismicity continued in the S area through the end of the month.
Activity during September 2023. Elevated seismicity persisted in the S summit with occasional small, brief seismic swarms. Sulfur dioxide measurements were relatively low and were 70 t/d on 8 September. About 150 earthquakes occurred during 9-10 September, and tiltmeter and Global Positioning System (GPS) data showed inflation in the S portion of the crater.
At 0252 on 10 September HVO raised the VAL to Watch and the ACC to Orange due to increased earthquake activity and changes in ground deformation that indicated magma moving toward the surface. At 1515 the summit eruption resumed in the E part of the caldera based on field reports and webcam images. Fissures opened on the crater floor and produced multiple minor lava fountains and flows (figure 533). The VAL and ACC were raised to Warning and Red, respectively. Gas-and-steam plumes rose from the fissures and drifted downwind. A line of eruptive vents stretched approximately 1.4 km from the E part of the crater into the E wall of the down dropped block by 1900. The lava fountains at the onset of the eruption had an estimated 50 m height, which later rose 20-25 m high. Lava erupted from fissures on the down dropped block and expanded W toward Halema’uma’u crater. Data from a laser rangefinder recorded about 2.5 m thick of new lava added to the W part of the crater. Sulfur dioxide emissions were elevated in the eruptive area during 1600-1500 on 10 September, measuring at least 100,000 t/d.
At 0810 on 11 September HVO lowered the VAL and ACC back to Watch and Orange due to the style of eruption and the fissure location had stabilized. The initial extremely high effusion rates had declined (but remained at high levels) and no infrastructure was threatened. An eruption plume, mainly comprised of sulfur dioxide and particulates, rose as high as 3 km altitude. Several lava fountains were active on the W side of the down dropped block during 11-15 September, while the easternmost vents on the down dropped block and the westernmost vents in the crater became inactive on 11 September (figure 534). The remaining vents spanned approximately 750 m and trended roughly E-W. The fed channelized lava effusions flowed N and W into Halema’uma’u. The E rim of the crater was buried by new lava flows; pahoehoe lava flows covered most of the crater floor except areas of higher elevation in the SW part of the crater. The W part of the crater filled about 5 m since the start of the eruption, according to data from a laser rangefinder during 11-12 September. Lava fountaining continued, rising as high as 15 m by the morning of 12 September. During the morning of 13 September active lava flows were moving on the N and E parts of the crater. The area N of the eruptive vents that had active lava on its surface became perched and was about 3 m higher than the surrounding ground surface. By the morning of 14 September active lava was flowing on the W part of the down dropped block and the NE parts of the crater. The distances of the active flows progressively decreased. Spatter had accumulated on the S (downwind) side of the vents, forming ramparts about 20 m high.
Vigorous spattering was restricted to the westernmost large spatter cone with fountains rising 10-15 m high. Minor spattering occurred within the cone to the E of the main cone, but HVO noted that the fountains remained mostly below the rim of the cone. Lava continued to effuse from these cones and likely from several others as well, traveled N and W, confined to the W part of the down-dropped block and the NE parts of Halema’uma’u. Numerous ooze-outs of lava were visible over other parts of the crater floor at night. Laser range-finder measurements taken of the W part of the crater during 14-15 September showed that lava filled the crater by 10 m since the start of the eruption. Sulfur dioxide emissions remained elevated after the onset of the eruption, ranging 20,000-190,000 t/d during the eruption activity, the highest of which occurred on 10 September.
Field crews observed the eruptive activity on 15 September; they reported a notable decrease or stop in activity at several vents. Webcam images showed little to no fountaining since 0700 on 16 September, though intermittent spattering continued from the westernmost large cone throughout the night of 15-16 September. Thermal images showed that lava continued to flow onto the crater floor. On 16 September HVO reported that the eruption stopped around 1200 and that there was no observable activity anywhere overnight or on the morning of 17 September. HVO field crews reported that active lava was no longer flowing onto Halema’uma’u crater floor and was restricted to a ponded area N of the vents on the down dropped block. They reported that spattering stopped around 1115 on 16 September. Nighttime webcam images showed some incandescence on the crater floor as lava continued to cool. Field observations supported by geophysical data showed that eruptive tremor in the summit region decreased over 15-16 September and returned to pre-eruption levels by 1700 on 16 September. Sulfur dioxide emissions were measured at a rate of 800 t/d on 16 September while the eruption was waning, and 200 t/d on 17 September, which were markedly lower compared to measurements taken the previous week of 20,000-190,000 t/d.
Geologic Background. Kilauea overlaps the E flank of the massive Mauna Loa shield volcano in the island of Hawaii. Eruptions are prominent in Polynesian legends; written documentation since 1820 records frequent summit and flank lava flow eruptions interspersed with periods of long-term lava lake activity at Halemaumau crater in the summit caldera until 1924. The 3 x 5 km caldera was formed in several stages about 1,500 years ago and during the 18th century; eruptions have also originated from the lengthy East and Southwest rift zones, which extend to the ocean in both directions. About 90% of the surface of the basaltic shield volcano is formed of lava flows less than about 1,100 years old; 70% of the surface is younger than 600 years. The long-term eruption from the East rift zone between 1983 and 2018 produced lava flows covering more than 100 km2, destroyed hundreds of houses, and added new coastline.
Information Contacts: Hawaiian Volcano Observatory (HVO), U.S. Geological Survey, PO Box 51, Hawai'i National Park, HI 96718, USA (URL: http://hvo.wr.usgs.gov/).
Tinakula (Solomon Islands) — December 2023 Cite this Report
Tinakula
Solomon Islands
10.386°S, 165.804°E; summit elev. 796 m
All times are local (unless otherwise noted)
Continued lava flows and thermal activity during June through November 2023
Tinakula is a remote 3.5 km-wide island in the Solomon Islands, located 640 km ESE of the capital, Honiara. The current eruption period began in December 2018 and has more recently been characterized by intermittent lava flows and thermal activity (BGVN 48:06). This report covers similar activity during June through November 2023 using satellite data.
During clear weather days (20 July, 23 September, 23 October, and 12 November), infrared satellite imagery showed lava flows that mainly affected the W side of the island and were sometimes accompanied by gas-and-steam emissions (figure 54). The flow appeared more intense during July and September compared to October and November. According to the MODVOLC thermal alerts, there were a total of eight anomalies detected on 19 and 21 July, 28 and 30 October, and 16 November. Infrared MODIS satellite data processed by MIROVA (Middle InfraRed Observation of Volcanic Activity) detected a small cluster of thermal activity occurring during late July, followed by two anomalies during August, two during September, five during October, and five during November (figure 55).
Geologic Background. The small 3.5-km-wide island of Tinakula is the exposed summit of a massive stratovolcano at the NW end of the Santa Cruz islands. It has a breached summit crater that extends from the summit to below sea level. Landslides enlarged this scarp in 1965, creating an embayment on the NW coast. The Mendana cone is located on the SE side. The dominantly andesitic volcano has frequently been observed in eruption since the era of Spanish exploration began in 1595. In about 1840, an explosive eruption apparently produced pyroclastic flows that swept all sides of the island, killing its inhabitants. Recorded eruptions have frequently originated from a cone constructed within the large breached crater. These have left the upper flanks and the steep apron of lava flows and volcaniclastic debris within the breach unvegetated.
Information Contacts: MIROVA (Middle InfraRed Observation of Volcanic Activity), a collaborative project between the Universities of Turin and Florence (Italy) supported by the Centre for Volcanic Risk of the Italian Civil Protection Department (URL: http://www.mirovaweb.it/); Hawai'i Institute of Geophysics and Planetology (HIGP) - MODVOLC Thermal Alerts System, School of Ocean and Earth Science and Technology (SOEST), Univ. of Hawai'i, 2525 Correa Road, Honolulu, HI 96822, USA (URL: http://modis.higp.hawaii.edu/); Copernicus Browser, Copernicus Data Space Ecosystem, European Space Agency (URL: https://dataspace.copernicus.eu/browser/).
Search Bulletin Archive by Publication Date
Select a month and year from the drop-downs and click "Show Issue" to have that issue displayed in this tab.
The default month and year is the latest issue available.
Bulletin of the Global Volcanism Network - Volume 37, Number 04 (April 2012)
Galeras (Colombia)
Frequent seismic swarms, elevated SO2; ash explosions begin in May 2012
Galunggung (Indonesia)
One possible 2008 ash plume, crater lake anomalies in 2011-2012
Gamkonora (Indonesia)
Instability followed by confusing news claims of minor June 2012 eruption
Iliamna (United States)
Rockfalls and fumarolic activity continue with spike in early 2012
Masaya (Nicaragua)
Continuous monitoring of emissions and new investigations from collaborators
Semeru (Indonesia)
Increased seismicity with lava flows and pyroclastic flows during February-April 2012
Soputan (Indonesia)
Alert level raised in May 2012 based on increased seismic activity
Galeras
Colombia
1.22°N, 77.37°W; summit elev. 4276 m
All times are local (unless otherwise noted)
Frequent seismic swarms, elevated SO2; ash explosions begin in May 2012
Our last report focused on the VEI 2 eruption of August 2010 as well as results from regular monitoring through May 2011 by the Instituto Colombiano de Geología y Minería (INGEOMINAS) based in Pasto, the provincial capital located ~10 km E of Galeras. Here we discuss the continuing efforts to monitor Galeras from June 2011 through April 2012. We highlight regular measurements from telemetered tiltmeter data, SO2 flux values, and earthquake cataloging and analysis. Additional monitoring activities, including radon gas assessments and thermal measurements, were conducted by INGEOMINAS and reported in weekly and monthly reports online. We briefly mention ash explosions that began on 13 May 2012.
April 2011-April 2012 Seismicity. During this reporting period, INGEOMINAS characterized five types of earthquake events: volcano-tectonic (VT), long-period (LP), tremor (TRE), hybrid (HYB), and tornillo (TOR). This data is available in online reports on the INGEOMINAS website for various years.
Earthquakes during this time were rarely deeper than 20 km and clustered ~2 km below the summit, and at times, ranging 5-8 km (table 13). Seismicity was dominated by hybrid events, signals characterizing fracturing and fluid movement. Tremor frequently occurred from May-July 2011 and December 2011-January 2012. From January-March 2012, the duration of tremor was longer than 800 minutes/month (table 13). LP events occurred most frequently in April 2011 and February 2012; VT events primarily appeared in March and April 2012. Tornillo events had been rare in 2011 but were the cause for alarm in November 2011 when INGEOMINAS detected 18 events. The seismic pattern of "tornillo-type" earthquakes has been associated with pre-eruptive conditions - in particular, explosive activity in 1992 and 2010 was preceded by episodes of tornillos (BGVN 34:12). The Alert Level was raised in November (to Orange, on a four-color scale) but lowered again in December (to Yellow) when these signals disappeared from the records; only two events were recorded in December 2011, then again in February 2012.
June 2011. INGEOMINAS reported that seismic energy was relatively low this month compared to May 2011. Inflation and deformation events were recorded by two tilt stations (Cráter and Calabazo); other stations, however, were stable (see figure 116 for monitoring station locations). The most proximal tilt station, Cráter, recorded the largest changes in deformation, and especially the radial component (often an order of magnitude larger than the tangential component). During this reporting period, INGEOMINAS frequently included data from the two component tiltmeters and calculated the vectors for Cráter (see INGEOMINAS online reports).
Large amounts of steam and gas rose from Galeras' crater in June; a plume was frequently observed with a height up to 400 m above the crater. The plume was primarily water vapor, and measurements of SO2 flux showed high variability. INGEOMINAS reported values from ScanDOAS and MobileDOAS ranging from 41-1,455 tons/day; a total of 22 measurements with wind direction and velocity were taken between 1-30 June. The maximum measurement of SO2 flux was made by ScanDOAS from the Santa Bárbara station located 7.0 km NNW from the summit. The minimum value was measured along a traverse with MobileDOAS between the towns La Buitrera and Sandoná (see figure 116 for locations, La Buitera is beyond the map).
July 2011. Seismic energy was 75% higher in July compared with calculations in June. A low-energy seismic swarm of LP events was recorded during 18-19 July. Seismic swarms have occurred periodically at Galeras, the last episode was recorded in early April 2011; this was also the last time tornillo earthquakes were detected (table 13). Deformation continued with fluctuations, however, fieldwork was necessary to reinstall the Cráter tiltmeter (located 0.8 km E of the main crater and at 4,060 m above sea level) when it was disrupted by electric storms on 11 July 2011; the tiltmeter was back online on 20 July.
During clear conditions, a steam plume was visible from Galeras which reached a maximum of 1.5 km above the crater. The maximum SO2 flux for July was 1,080 tons/day which was obtained on 11 July at the Santa Bárbara station with ScanDOAS. A total of 15 measurements with wind direction and velocity were taken between 6 and 23 July. The minimum measurement of SO2 flux was made on 19 July by ScanDOAS, also from the Santa Bárbara station (stations Alto Jiménez and Alto Tinajillas were also recording values).
August 2011. An hour-long seismic swarm was recorded starting at 1800 on 24 August. INGEOMINAS classified these earthquakes as primarily long-period, suggesting that hydrothermal processes were active beneath Galeras. Three of the tiltmeters (Cráter, Huairatola, and Calabozo) indicated deformation and two stations (Peladitos and Cobanegra) showed no change.
Emissions continued to be visible from the crater; a white plume was frequently observed that rose 800 m above the crater rim. SO2 levels were significantly low in August; INGEOMINAS calculated the maximum SO2 flux as 185 tons/day from the Santa Bárbara station on 3 August. A total of 26 measurements were recorded from 1 to 31 August. The lowest value, 25 tons/day, was recorded during a traverse along the northeastern route (between the towns of Genoy and Nariño) on 9 August with MobileDOAS.
September 2011. Seismicity continued at low levels and few earthquakes were large enough to locate (table 13). On 6 September a swarm of hybrid earthquakes was recorded; this was a small episode that occurred between 0600 and 0800. Tilt stations Cráter and Huairatola recorded fluctuations while Calabozo, Peladitos, and Cobanegra showed no significant changes.
The summit was visible for much of September; the plume rose typically less than 500 m above the crater. According to INGEOMINAS, SO2 levels were low in September. A total of 16 measurements were recorded by ScanDOAS from one fixed station (Santa Bárbara station), flux ranged from 51-225 tons/day.
October 2011. INGEOMINAS reported that an earthquake swarm occurred during 25-30 October. Events were characterized as hybrids, suggesting fluid movement and hydrothermal processes; hypocenters were very shallow, less than 2 km beneath the crater. Tilt stations Cráter, Huairatola, and Calabozo recorded fluctuations while Peladitos and Urcunina showed no significant changes.
In October, conditions were favorable for observing the summit area of Galeras. A column of white vapor was visible during most of the month; the plume rose to a height of 800 m above the rim. SO2 flux was relatively low; 19 values were recorded between 1-31 October. The maximum value was 340 tons/day as recorded on 1 October by the Alto Jiménez station (located 10.8 km NW of the summit). The lowest value, 32 tons/day, was recorded at the Santa Bárbara station on 10 October.
November 2011.INGEOMINAS continued registering swarms of shallow VT earthquakes. These events were primarily located at depths less than 1 km from the crater with magnitudes
Several overflights of the crater were conducted in November by INGEOMINAS along with the Colombian Air Force (figure 118). During these flights, staff observed conditions within the crater and noted a strong sulfur odor. Thermal anomalies were detected with a forward-looking infrared (FLIR) camera; on 2 and 26 November, investigators recorded maximum temperatures around 200°C.
INGEOMINAS reported significant changes in tilt from the Cráter station (figure 119). Between 7 September and 30 November, there were variations between 3,720 and 920 µrad with increasing and decreasing trends for tangential and radial components, respectively. Trends were also recorded from stations: Peladitos, Huairatola, and Cobanegra. Stations Calabozo and Urcunina showed small fluctuations and were considered stable.
INGEOMINAS reported that SO2 flux in November ranged from 5 to 178 tons/day. The highest values were recorded by stations implementing ScanDOAS; the Alto Jiménez station recorded the maximum on 5 November. The lowest value was from a MobileDOAS traverse along the Sandoná route on 30 November.
December 2011. The Alert Level was lowered from Orange to Yellow on 6 December due to reduced seismicity; tornillo events were no longer recorded. The tilt station Cráter continued to register changes. INGEOMINAS determined that the NE sector of the volcano exhibited deflation from 7 September to 24 November (figure 119) and beginning on 24 November a change occurred and inflation began. The records suggested that the Huairatola station was detecting deflation of the NE sector from 6 August to 31 December. Data from Cobanegra, from 28 February to 31 December, was also consistent with showing changes in the NE. The Peladitos, Urcunina, and Cóndor stations showed small variations and were considered stable.
In collaboration with the Colombian Air Force, INGEOMINAS conducted an overflight of the crater on 6 December. Several thermal images were taken with a FLIR camera (figure 120). The highest temperature recorded was 200°C.
Increased degassing was noted from two sites on the N edge of the crater, Paisita and Chavas (for a crater location map, see figure 87 in BGVN 23:01). SO2 flux was measured by three fixed ScanDOAS stations; a total of 12 measurements were recorded during 1-22 December. Emissions were low and ranging from 21 to 310 tons/day. INGEOMINAS recorded the maximum value from Alto Tinajillas (located 13.3 km W of the crater, figure 116) on 14 December; the minimum was from Santa Bárbara on 9 December.
January 2012. On 31 January, INGEOMINAS reported that a seismic swarm dominated by short-period VT events was recorded. Deformation detected by the Cráter station suggested three unique episodes where radial tilt was increasing, stabilized, and decreased. The tangential component exhibited an inversion of this trend: decreasing, stabilization, and increasing. INGEOMINAS calculated 657 µrad of inflation within the central crater, followed by stabilization and later, deflation measured as 264 µrad.
Steam continued to rise from Paisita and Chavas craters. A white plume was typically visible low over the crater however, on 5, 11, and 21 January, the plume height varied between 500 and 800 m. INGEOMINAS reported that SO2 flux continued at low levels, ranging from 32-259 tons/day. A total of 12 values were obtained from fixed ScanDOAS stations. The maximum value was recorded at the Santa Bárbara station on 27 January.
February 2012. Seismic swarms occurred in February consisting primarily of small, shallow events. At 2148 on 27 February the short-period seismic station Anganoy (located 0.8 km E of the crater, figure 116) recorded an event INGEOMINAS characterized as a 'pseudo-Tornillo'; this event had a dominant frequency of 4.1 Hz and a duration of 36 seconds.
Pseudo-tornillos appeared to be rare events and had occurred previously in November 2011. These have much shorter codas (tails) compared to those of the tornillo signals. The latter last up to several minutes, have small amplitudes compared to duration, and generally decay progressively so their seismic traces appear screw-like in appearance (tornillos is Spanish for screw). These features and various other subtypes and their diagnostic signal characteristics and names are discussed in Narváez and others (1997).
Deformation measured by the Cráter station recorded 774 µrad of deflation in the central crater. The Cobanegra station registered decreasing trends; the stations Peladitos, Urcunina, and Cóndor were considered stable.
A white plume from the crater was visible by webcameras and reached heights less than 800 m above the rim. SO2 flux in February remained low and ranged from 8 to 498 tons/day. A total of 27 values were recorded from fixed ScanDOAS and MobileDOAS measurements. The maximum flux was recorded on 22 February at the Alto Jiménez station.
March 2012. In March, seismic energy decreased by 89.1% compared to February, and few earthquakes were located. However, tremor continued (table 13). The Cráter tiltmeter recorded variability in early March, and from 22 to 31 March, 1,440 µrad of inflation was recorded within the central crater. The Cobanegra station recorded decreasing trends with both components while the stations Peladitos, Urcunina, Cóndor, Calabozo, and Arlés were considered stable.
A white plume was visible during most of the month except for four days. Plume height was maintained below 1.9 km. On 2 March, the National Park reported strong sulfur odors and also received alerts from the municipal committee of Sandoná that gas was noticeable.
Based on fixed and mobile detectors, INGEOMINAS reported that SO2 flux increased dramatically in March. A maximum of 3,390 tons/day was recorded by the Alto Jiménez station on 15 March. The lowest value recorded was 305 tons/day during a traverse along the Consaca-Sandoná route on 30 March. A total of 33 measurements were collected from 1 to 31 March.
April 2012. INGEOMINAS reported that seismic swarms occurred during 5-8 and 11-16 April consisting primarily of small, shallow VT events. The Cráter and Huairatola tilt stations registered variability suggesting inflation in the W sector of Galeras, an area known for high seismicity. The Cobanegra station recorded decreasing trends from both components between 85 and 430 µrad. The other stations were considered stable.
A white plume was frequently visible above the crater in April. Webcameras and observers recorded a maximum height of 2,000 m. On 16 April, the local committee for the prevention of disasters (CLOPAD) of the provincial capital, Pasto, received reports from inhabitants near the N flank of Galeras; gas emissions were visible and people could hear noises from the crater.
SO2 flux continued at elevated levels in April. INGEOMINAS recorded 33 measurements during April. A maximum of 1,477 tons/day was recorded at the Alto Jiménez station on 2 April. The highest levels of SO2 emissions were recorded within the first week of April, averaging 1,012 tons/day. The lowest value was recorded on 13 April, 10 tons/day, along the La Florida-Sandoná route with MobileDOAS.
Editor's Note: INGEOMINAS and the Washington Volcanic Ash Advisory Center (VAAC) reported that ash emissions were detected in early May 2012 (figure 121) and continued into early June.
Reference. Narváez, L.M., Torres, R.A., Gómez, D.M., Cortez, G.P., Cepeda, H.V., and Stix, J., 1997. 'Tornillo'-type seismic signals at Galeras volcano, Colombia, 1992-1993, Journal of Volcanology and Geothermal Research, 77: 159-171.
Geologic Background. Galeras, a stratovolcano with a large breached caldera located immediately west of the city of Pasto, is one of Colombia's most frequently active volcanoes. The dominantly andesitic complex has been active for more than 1 million years, and two major caldera collapse eruptions took place during the late Pleistocene. Long-term extensive hydrothermal alteration has contributed to large-scale edifice collapse on at least three occasions, producing debris avalanches that swept to the west and left a large open caldera inside which the modern cone has been constructed. Major explosive eruptions since the mid-Holocene have produced widespread tephra deposits and pyroclastic flows that swept all but the southern flanks. A central cone slightly lower than the caldera rim has been the site of numerous small-to-moderate eruptions since the time of the Spanish conquistadors.
Information Contacts: Instituto Colombiano de Geologia y Mineria (INGEOMINAS), Observatorio Vulcanológico y Sismológico de Pasto, Pasto, Colombia (URL: https://www2.sgc.gov.co/volcanes/index.html); Washington Volcanic Ash Advisory Center (VAAC), Satellite Analysis Branch (SAB), NOAA/NESDIS E/SP23, NOAA Science Center Room 401, 5200 Auth Rd, Camp Springs, MD 20746, USA (URL: http://www.ospo.noaa.gov/Products/atmosphere/vaac/).
Galunggung (Indonesia) — April 2012 Cite this Report
Galunggung
Indonesia
7.25°S, 108.058°E; summit elev. 2168 m
All times are local (unless otherwise noted)
One possible 2008 ash plume, crater lake anomalies in 2011-2012
This report mentions a possible ash plume from Galunggung volcano in July 2008 and various other anomalies, including discolored crater lake water during parts of 2011 and 2012. Our last report on Galunggung was in 1984 (SEAN 09:02), following a deadly eruption that began in mid-1982 and ended in early 1983.
The following background information on the volcano was provided in 13 February and 28 May 2012 reports from the Indonesian Center of Volcanology and Geological Hazard Mitigation (CVGHM). According to the latest report from CVGHM, the present-day lake in the conical crater of Galunggung volcano has a diameter of 1 km and a typical depth of 11 m. In the middle of the lake sits a small, 30 m high, 250 x 165 m scoria cone which was produced during the final stage of the 1982-83 eruption. Galunggung's hazards include phreatic and phreatomagmatic eruptions capable of draining the lake and producing mud flows.
As further background, some of the historical eruptions were explosive, centered at the volcano's crater lake. These eruptions occurred four times, in 1822, 1894, 1918, and 1982-1983. The eruption of 1982-1983 occurred over a period of 21 months, from 5 April 1982-8 January 1984 (SEAN 07:04, 07:06, 07:07, 07:08, 07:09, 07:10, 07:11, and 07:12). In late June 1982, a British Airways jumbo jet encountered an ash cloud that stalled all four of its engines and abraded its windshield and wing surfaces. The aircraft lost 7.5 km of altitude before the engines could be restarted, but it landed safely in Jakarta (SEAN 07:06).
Incorrect report of 2002 eruption; questionable one in 2008. Based on erroneous information from a pilot report, the Darwin Volcanic Ash Advisory Centre (VAAC) stated that an eruption occurred at Galunggung at 1748 hr on 23 August 2002. It produced a W-drifting low-level plume. No ash was visible on satellite imagery. Subsequently, Dali Ahmad of CVGHM had advised Dan Shackelford (amateur volcanist, now deceased) that the report of an eruption on 23 August 2002 was incorrect. It turned out that the likely cause of the incident was a bushfire near the volcano that led observers to believe that an eruption was occurring.
Based on a pilot report and inconclusive observations of satellite imagery, the Darwin VAAC reported that on 17 July 2008 a possible ash plume from Galunggung rose to an altitude of 5.5 km and drifted SW. However, CVGHM did not report eruptive activity and advised that the volcanic activity status was "normal" at that time.
2011-2012 observations. CVGHM reported that from September 2011 to 8 February 2012 the crater lake water at Galunggung was discolored. In addition, a sudden increase in water temperature was measured, from 27° C on 5 February to 40° C on 8 February. Based on seismic data and crater lake observations, CVGHM raised the Alert Level from 1 to 2 (on a scale of 1-4) on 12 February and recommended that people stay at least 500 m away from the lake shore.
CVGHM reported that after the Alert Level was raised, seismic activity at Galunggung decreased drastically through 27 May 2012. Moreover, on 27 April, plants around the crater area looked green and lush, small fish were swimming in the water, and insects around the crater were active. Based on seismic data, crater lake water temperature and pH data, and visual observations, CVGHM lowered the Alert Level from 2 to 1 on 28 May 2012.
MODVOLC satellite thermal alerts were absent at Galunggung during 2011-2012 (and at least since 2000). CVCHM noted in its 28 May 2012 report that throughout the first half of 2012 Galunggung volcano was often covered in mist.
Geologic Background. The forested slopes of Galunggung in western Java SE of Bandung are cut by a 2-km-wide collapse scarp open towards the ESE. The "Ten Thousand Hills of Tasikmalaya" dotting the plain below the volcano are debris-avalanche hummocks from the collapse about 4,200 years ago. An eruption in 1822 produced pyroclastic flows and lahars that killed over 4,000 people. A series of major explosive eruptions starting in April 1982 destroyed a number of villages, killed as many as 30 people, and forced over 60,000 to evacuate. Pyroclastic flows and heavy widespread ash caused significant damage. A large passenger jet that encountered the ash plume on 24 June lost power to all four engines but managed to land safely in Jakarta. The 1982 activity destroyed a 1918 dome and formed the Warirang crater, almost as wide as the valley, about 2 km down from the summit.
Information Contacts: Center of Volcanology and Geological Hazard Mitigation (CVGHM) (URL: http://www.vsi.esdm.go.id); Darwin Volcanic Ash Advisory Centre (VAAC) (URL: http://www.noaa.gov/VAAC/OTH/AU/messages.html).
Gamkonora (Indonesia) — April 2012 Cite this Report
Gamkonora
Indonesia
1.38°N, 127.53°E; summit elev. 1635 m
All times are local (unless otherwise noted)
Instability followed by confusing news claims of minor June 2012 eruption
Previous Bulletin reports on Gamkonora highlighted an eruption in 1981, minor explosions in April 1987 (SEAN 06:07), and a phreatic eruption in early July 2007 (BGVN 32:10). Reports by the Center of Volcanology and Geological Hazard Mitigation (CVGHM) noted tiny diffuse white plumes in 2009 and again in 2011 when the observatory recorded an average of 2 volcanic earthquakes per day. During mid-2011 through mid-2012, in addition to intervals with several shallow volcanic earthquakes per day, instruments also recorded increasing tremor and hundreds of signals of inferred emissions described as hot-air blasts. The hazard status rose accordingly and remained elevated as this report goes to press on 29 June 2012 at Alert Level 3 (on a scale of 1-4).
As this report goes to press a potentially inaccurate news report indicated an eruption starting 13 June 2012 (see subsection below). That behavior remained unconfirmed by CVGHM or the Darwin Volcanic Ash Advisory Centre (VAAC) as discussed further in a subsection below.
Figures 2-4 provide broad regional context on Gamkonora near the northern margin of Indonesia. A previous map (figure 1 in BGVN 32:10) shows Gamkonora and other Holocene volcanoes on a map of Halmahera and adjacent islands.
CVGHM reports were scarce during 1982-2011. One report noted that seismic activity increased somewhat on 24 March 2008. The increase included an episode of continuous tremor.
On 23 March 2009, CVGHM lowered the Alert Level from 2 to 1 based on visual observations and decreased seismicity since January. Diffuse white plumes rose 50-150 m above the crater. Residents and visitors were reminded not to approach or climb into the crater.
CVGHM reported that during January-April 2011, diffuse white plumes rose 25-100 m above Gamkonora's crater rim. Seismicity increased during 29 April-3 May 2011.
On 1 May, white plumes rose 150 m above the crater rim. The next day, white plumes were observed rising 300 m above the crater rim and observers saw incandescence from the crater. Residents near the volcano's base noted a sulfur smell. On 3 May 2011 the Alert level was raised to 2.
Various types of earthquakes were noted during January to April 2011. They included shallow volcanic earthquakes (2 per day average), deep volcanic earthquakes (once per day average), local tectonic earthquakes (1-7 per day average), and far tectonic earthquakes (4 per day average).
A 13 June 2012 CVGHM report noted that during May and June 2012 the emissions were sparsely to medium white in color and rising 75 to 200 m above the crater rim. Absent were sulfurous smells, open flames, eruptive noises, and other similar anomalous symptoms.
The same CVGHM report noted that seismic signals since 3 May 2010 included emission signals (hot-air blasts, averaging 10-12 daily), harmonic tremor (averaging 10-15 events daily), shallow volcanic earthquakes (averaging 2 daily, but for the one specific case given, during the interval 31 May to 11 June 2012, only 1 occurred), and distant tectonic earthquakes (averaging 4 daily). Table 1 presents a breakdown of the interpreted seismic signals during 1 May to 12 June 2012.
Table 1. Seismic data released on 13 June 2012 for Gamkonora. The entries represent total events during specified intervals during May and early June 2012 ("--" signifies absence of data). Courtesy of CVGHM.
| Dates |
Tremor Events (amplitude range) |
Emission signals |
Deep volcanic |
Distant tectonic |
Local tectonic |
| 01 May-10 May 2012 |
125 (2-14 mm) |
22 |
18 |
49 |
-- |
| 11 May-20 May 2012 |
186 (1.5-10 mm) |
81 |
4 |
54 |
-- |
| 21 May-30 May 2012 |
233 (2-13 mm) |
209 |
2 |
48 |
95 |
| 31 May-11 Jun 2012 |
246 (2-7 mm) |
183 |
8 |
49 |
-- |
| 12 Jun 2012 |
38 (2-5 mm) |
2 |
-- |
1 |
2 |
The authors of the 13 June report made no further comment about the air-blast signals that had become common at the volcano (table 1). They did note that since the beginning of May 2012, tremor had increased. They interpreted this and the overall seismicity as due to magma intruding upward and approaching shallow depths within the volcano. The authors noted that intrusions could lead to increased pressure within the volcano, although they viewed this pressure as yet relatively small.
As previously noted, starting on 3 May 2011, the volcano's hazard status rose to Alert Level 2. On 3 May 2012 it rose to Level 3, where it remained at least as late as 29 June 2012. The Level 3 status excluded residents, visitors, and tourists from approaching closer than 3 km from the summit. The report also prompted local governments to coordinate with the volcano's monitoring post, which is located in the village of Gamsungi (or with CVGHM's main office in Bandung).
News claims of eruption on 13 June 2012. The English language version of Antara News released a report (edited by Ella Syafputri) at 1913 on 13 June stating that Gamakonora had erupted that afternoon. The eruption, if it did occur, escaped clear mention in available CVGHM reports. The news report said that the eruption sent a plume of undisclosed type or color 3 km "into the sky" (a term that could imply a plume to 3 km altitude or could mean a plume 3 km over the ~1.6 km summit, in effect to ~4.6 km altitude). The news report said the event had the effect of "forcing hundreds of residents living on the volcano's slope to evacuate to safer areas."
Despite the headline "Mount Gamkonora erupts" and directly under that, the sentence "The volcanic ash spread to as far as Tobelo, the capital of North Halmahera district", the two quotes referred to events at two separate volcanoes. In the 5th paragraph of the article the topic shifted to Dukono, another volcano in the region, which turned out to have been the source of the ash (not Gamkonora).
The news report spawned no fewer than 10-20 English-language reports on as many websites. Some of these derivative reports continued to mistakenly attribute Dukono ashfall to Gamkonora, and in some cases they added further errors.
Reference. Simkin, T. and Siebert, L., 1994, Volcanoes of the World: a Regional Directory, Gazetteer, and Chronology of Volcanism During the Last 10,000 Years. (2nd ed.) Geoscience Press, Tucson, 368 pp.
Geologic Background. The shifting of eruption centers on Gamkonora, the highest peak of Halmahera, has produced an elongated series of summit craters along a N-S trending rift. Youthful-looking lava flows originate near the cones of Gunung Alon and Popolojo, south of Gamkonora. Since its first recorded eruption in the 16th century, typical activity has been small-to-moderate explosive eruptions. Its largest recorded eruption, in 1673, was accompanied by tsunamis that inundated villages.
Information Contacts: Center of Volcanology and Geological Hazard Mitigation (CVGHM), Jalan Diponegoro 57, Bandung 40122, Indonesia (URL: http://www.vsi.esdm.go.id/); Lyn Topinka, United States Geological Survey, 1300 SE Cardinal Court, Bldg. 10, Suite 100, Vancouver, WA, 98683; UNOSAT (URL: https://unitar.org/unosat/); Darwin Volcanic Ash Advisory Centre (VAAC), Bureau of Meteorology, Northern Territory Regional Office, PO Box 40050, Casuarina, NT 0811, Australia (URL: http://www.bom.gov.au/info/vaac/); Antara News (URL: http://www.antaranews.com/en/news/).
Iliamna (United States) — April 2012 Cite this Report
Iliamna
United States
60.032°N, 153.09°W; summit elev. 3053 m
All times are local (unless otherwise noted)
Rockfalls and fumarolic activity continue with spike in early 2012
Iliamna was last discussed in September 1997 (BGVN 22:09). This report is largely based on seismic data extracted from Alaska Volcano Observatory (AVO) yearly reports for 1997 to 2011, with the exception of an increase of seismicity during early 2012 that was reported by various sources. From the start of 2012, both rockfalls and seismicity progressively increased; this prompted AVO to increase the Alert Level to Advisory in March 2012. A map showing the location of Iliamna in relation to nearby volcanoes and communities is depicted in figure 1. Figures 2 and 3 are topographic maps showing Iliamna's known debris avalanches and rockfall deposits.
Most of the upper edifice exposes highly altered, unstable rock and shows scars from mass wasting. The E scar has been the source of frequent non-volcanic gravitational collapses producing mixed avalanches of ice, snow, rock, and mud that typically extend several kilometers downslope. Some are large enough to be visible from the Kenai Peninsula (Neal and others, 1995; McGimsey and Wallace, 1999).
Reports on Iliamna's seismicity since early 1997 are sparse. According to AVO, a pilot reported a fresh deposit of mud and rock on the upper NE flank on 6 July 1999. However, spring and summer avalanches are common on the glacier-dominated summit.
On 25 July 2003, an avalanche of snow, ice, and rock occurred. The event lasted four minutes and was recorded by seismometers located 75 km away on Augustine volcano. The avalanche presumably originated from the same vicinity as in previous years, a steep portion of the SE flank adjacent to an extensive permanent fumarolic zone above a debris-avalanche deposit (figure 3; Neal and others, 1995; McGimsey and Wallace, 1999; McGimsey and others, 2004).
On 15 May 2005, AVO seismologists noted a swarm of unusual seismic activity at Iliamna. The events were emergent and prolonged (the longest lasted 5-8 minutes) and were strongest at seismic station ILS, located on the S flank of South Twin (figure 4). The activity began at about 1250 UTC and tapered off at 1718 UTC. Analysis revealed that the signals most likely were caused by a surficial process, such as a snow avalanche (a common occurrence on Iliamna), but this particular event lacked the usual precursory seismicity preceding other Iliamna snow and ice avalanches ( Caplan-Auerbach and others, 2004; J. Caplan-Auerbach, written commun., 2005; Caplan-Auerbach and Huggel, 2007).
During an overflight on 16 May 2005, Lee Fink of Lake Clark National Park observed a large, fresh rock slide (not a snow or ice avalanche) SE of Iliamna that began at ~1,980 m elevation on the SE flank of South Twin, and ran down to ~365 m elevation (figure 5a). Along the lengthy ridge extending S of Iliamna (including both South Twin, North Twin, and a large unnamed massif) are steep, exposed sections of bedrock. The 15 May rockfall occurred below the ridge (figure 5b).
During Iliamna's mid-May 2005 rock slide, earthquakes at Augustine volcano, ~100 km SSW of Iliamna in the Cook Inlet, increased from 2 per day in April to 70 per day by the end of the year (McGimsey, 2008). However, no evidence exists that this increase disturbed Iliamna. Other factors such as temperature changes, ice and snow mass (and other conditions) would have contributed to the weakening of the summit material at Iliamna.
According to AVO, earthquake numbers increased significantly between 2008-2009, but returned to near-normal levels in 2010 (table 1).
Table 1. Numbers and types of earthquakes at Iliamna between 2008 and 2010. Key: VT, volcanic tremor; LF, low frequency; Mc, magnitude of completion (lowest magnitude detectable); and '--', not reported. Courtesy of AVO.
| Year |
Total Earthquakes |
Volcanic Tremor |
Low-frequency |
Other |
Magnitude of completion (lowest magnitude detectable) |
| 2008 |
102 |
-- |
-- |
-- |
-- |
| 2009 |
173 |
159 |
13 |
1 |
0.3 |
| 2010 |
76 |
61 |
15 |
0 |
0.2 |
Early 2012 elevated seismicity. AVO reported that during December 2011-February 2012, earthquake activity steadily increased. During the first week of March 2012, numerous earthquakes occurred that varied in number and magnitude. According to a press account (Alaskan Dispatch), on 8 March, a moderate M 4.1 earthquake struck the region. On 9 March, AVO increased the Alert Level to Advisory and the Aviation Color Code to Yellow. AVO reported that the increased activity was a significant change, but also noted that a similarly energetic episode of seismic unrest from September 1996 to February 1997 did not lead to an eruption.
Between 9 March through at least 3 April 2012, seismicity remained above background levels. Satellite images acquired during 9-16 March showed a plume drifting 56 km downwind that was likely water vapor. An AVO report noted that long-lived fumaroles at the summit of Iliamna frequently produced visible plumes, but the current plume appeared to be more robust than usual. Scientists aboard an overflight on 17 March observed vigorous and plentiful fumaroles at the summit, consistent with elevated gas emissions. Gas measurements indicated that the volcano was emitting elevated levels of SO2 and CO2, consistent with a magmatic source. During the overflight, scientists did not observe obvious signs of recent rockfalls, such as large areas of newly exposed bedrock or unusual disturbance of the glacial ice. Some deformation of the ice at the headwall of the Red Glacier on the E side of the summit was observed, but it is not clear that this was related to the current volcanic unrest; glacier avalanching is common on this very steep area and was last seen in 2008. During 25-27 March, activity declined somewhat to just above background levels. When not obscured by clouds, satellite and web camera views showed nothing unusual.
References. Caplan-Auerbach, J., Prejean, S.G., and Power, J.A., 2004, Seismic recordings of ice and debris avalanches of Iliamna Volcano (Alaska): Acta Vulcanologica, v. 16, n. 1-2, p. 9-20.
Caplan-Auerbach, J., and Huggel, C., 2007, Precursory seismicity associated with frequent, large ice avalanches on Iliamna volcano, Alaska, USA: Journal of Glaciology, v. 53, n. 180, p. 128-140.
Detterman, R.L., and Hartsock, J.K., 1966, Geology of the Iniskin-Tuxedni region, Alaska: U.S. Geological Survey Professional Paper 512, 78 p.
Dixon, J.P., and Stihler, S.D., 2009, Catalog of earthquake hypocenters at Alaskan volcanoes: January 1 through December 31, 2008: U.S. Geological Survey Data Series 467, 88 p. Available at http://pubs.usgs.gov/ds/467/
Dixon, J.P., Stihler, S.D., Power, J.A., and Searcy, C.K., 2010, Catalog of earthquake hypocenters at Alaskan volcanoes: January 1 through December 31, 2009: U.S. Geological Survey Data Series 531, 84 p. Available online at http://pubs.usgs.gov/ds/531/
McGimsey, R.G., and Wallace, K.L., 1999, 1997 volcanic activity in Alaska and Kamchatka: Summary of events and response of the Alaska Volcano Observatory: U.S. Geological Survey Open-File Report OF 99-0448, 42 p.
McGimsey, R.G., Neal, C.A., and Girina, O., 2004, 1999 Volcanic activity in Alaska and Kamchatka: Summary of events and response of the Alaska Volcano Observatory: U.S. Geological Survey Open-File Report OF 2004-1033, 49 p.
McGimsey, R.G., Neal, C.A., Dixon, J.P., and Ushakov, S., 2008, 2005 Volcanic activity in Alaska, Kamchatka, and the Kurile Islands: Summary of events and response of the Alaska Volcano Observatory: U.S. Geological Survey Scientific Investigations Report 2007-5269, 94 p.
Neal, C.A., Doukas, M.P., and McGimsey, R.G., 1995, 1994 volcanic activity in Alaska-Summary of events and response of Alaska Volcano Observatory: U.S. Geological Survey Open-File Report OF 95-271, 18 p. [Iliamna, p. 4-5].
Waythomas, C.F. and Miller, T.P., 1999, Preliminary Volcano-Hazard Assessment for Iliamna Volcano, U.S. Geological Survey Open-File Report OF 99-373.
Geologic Background. Iliamna is a prominent glacier-covered stratovolcano in Lake Clark National Park on the western side of Cook Inlet, about 225 km SW of Anchorage. Its flat-topped summit is flanked on the south, along a 5-km-long ridge, by the North and South Twin Peaks lava dome complexes. The Johnson Glacier dome complex lies on the NE flank. Steep headwalls on the S and E flanks expose an inaccessible cross-section of the volcano. Major glaciers radiate from the summit, and valleys below the summit contain debris avalanche and lahar deposits. Only a few major Holocene explosive eruptions have occurred from the deeply dissected volcano, which lacks a distinct crater. Most of the reported eruptions may represent plumes from vigorous fumaroles E and SE of the summit, which are often mistaken for eruption columns (Miller et al., 1998). Eruptions producing pyroclastic flows have been dated to 1778-1779 and 1876 CE. Elevated seismicity accompanying dike emplacement beneath the volcano was recorded in 1996.
Information Contacts: Alaska Volcano Observatory (AVO), a cooperative program of a) U.S. Geological Survey, 4200 University Drive, Anchorage, AK 99508-4667 USA (URL: http://www.avo.alaska.edu/), b) Geophysical Institute, University of Alaska, PO Box 757320, Fairbanks, AK 99775-7320, USA, and c) Alaska Division of Geological & Geophysical Surveys, 794 University Ave., Suite 200, Fairbanks, AK 99709, USA (URL: http://www.dggs.alaska.gov/); Alaskan Dispatch (URL: http://www.alaskadispatch.com/).
Masaya
Nicaragua
11.9844°N, 86.1688°W; summit elev. 594 m
All times are local (unless otherwise noted)
Continuous monitoring of emissions and new investigations from collaborators
In our last report on Masaya volcano, we reviewed field investigations and gas measurements from 2008-2011 including the attempt to launch a small Zeppelin as an experiment to measure gas emissions in March 2011 (BGVN 36:11). Here we present results from monitoring efforts focused on the elevated activity that has continued from Masaya's Santiago crater, one of the nested summit craters in Nindirí cone (figure 30). New gas measurements and field observations have become available from the Instituto Nicaragüense de Estudios Territoriales (INETER) from November 2011 through March 2012. Reports were also available for Masaya's Comalito cinder cone, a site of continuous gas emissions and elevated temperatures. In February 2012, INETER met with collaborators from both Simon Fraser University (Canada) and The Open University (UK). We highlight some of the results from these collaborators including mapping and modeling of Masaya's hydrothermal complex, results from long-term SO2 flux monitoring, and a conceptual model that links magma chamber dynamics with intermittent explosive activity.
The false-color image of Masaya (figure 30) and the surrounding area is a standard composite image (bands 4,3,2) captured by Landsat on 25 March 2001, during Nicaragua's dry season (November through April). Here, vegetation appears in shades of red (darker in areas with denser vegetation), urban areas are cyan blue, and soils vary from dark to light browns. Located just 500 m E of Santiago crater, Masaya crater is distinguished by older deposits, last active around 150 AD, and contains a ring of vegetation (which appears as a pale pink circle). Masaya's recent lava flows have been contained within the larger caldera except for those dating from 1670 when lava ponded along the northern caldera rim and spilled over to cover more than 1 km2 outside the caldera.
In November 2011, INETER recorded little activity from Masaya. No field visits were made and no earthquakes were large enough to locate hypocenters. Seismicity that month was low, at 50 RSAM units.
On 12 December 2011, INETER conducted site visits to Masaya's active crater (Santiago) and Comalito cinder cone. With an infrared thermometer, temperatures were measured from vents within Santiago crater; the highest temperatures measured were 42 and 45°C. The field investigators learned from National Park personnel that, recently during a 2-hour period, booming noises were heard from Santiago crater. INETER suggested that the noise resulted from strong gas release from deep within the crater - no visible material was ejected during the episodes. Areas of gas release could be visually identified within the crater; these were also locations where debris had been shed from the S and SW walls. Rockfalls from these locations were likely affecting gas emissions.
Additional visits to Comalito cone (figure 30), a satellite cone located less than 2 km NE of Santiago crater, allowed in situ measurements of fumarole temperatures. Four sites were measured; the highest temperature was 79°C, the lowest was 75°C (fumaroles 4 and 1 respectively). These temperatures were considered typical compared to others during 2011 (as compiled by INETER; figure 31). The lowest temperatures of the year 2011 were recorded in May and July with some values as low as 60-65°C.
To quantify SO2 gas emissions, INETER used a mobile Mini DOAS throughout the year transported on two different routes. The road between Ticuantepe and San Juan de la Concepción was the closest route available when the plume trended SW. An additional route, at a greater distance (figure 25 from BGVN 36:11) was available between Las Quatro Esquinas and El Crucero. On 13 December, cloud cover limited the number of successful traverses; however, an average SO2 flux of 648 metric tons per day (t/d) was calculated from three of the six traverses. This was a significant increase compared to values obtained in October 2011 when 13 successful traverses that month yielded an average of 153 t/d. These values (and others in this report) have not been corrected for meteorological conditions and error calculations were not available during this reporting period.
On 23 January 2012 INETER conducted traverses below Masaya's plume with a Mini DOAS. Measurements along both routes, proximal (Ticuantepe and San Juan de la Concepción) and distal (Las Quatro Esquinas and El Crucero) were attempted. From 10 calculations, SO2 flux from the proximal route yielded 801 t/d. From the distal route, the average flux rate was 543 t/d.
INETER conducted fieldwork during 30-31 January 2012, visiting Santiago crater and Comalito cone. Temperatures from fumarole sites on Comalito had maximum temperatures of 70°C (fumarole 4) and 78°C (fumarole 2) on 30 January. The maximum temperature measured from Santiago crater had increased to 95°C.
On 1 February 2012, INETER visited Comalito cone and reported fumarole temperatures. The highest temperature was 97°C (fumarole 1); on 23 February the highest temperature was 86°C (fumarole 2). Fieldwork also included visits to Santiago crater; temperatures within the crater were relatively low, 75 and 70°C (from 1 February and 23 February, respectively). SO2 flux from Mini DOAS from the closest route (Ticuantepe and San Juan de la Concepción) yielded an average of 943 t/d based on 12 traverses, continuing the trend of increased SO2 emissions since December 2011.
In March 2012, National Park personnel reported that acoustic noise from the crater was less frequent compared to the previous month. Also, visible gas emissions appeared concentrated at the SW and innermost portions of Santiago crater. On 12 March 2012, INETER visited Masaya and measured temperatures from Santiago crater. A wide range of values was recorded: 100°C to 43°C. Relatively stable temperatures were measured from Comalito cone: 73°C to 76°C. The highest temperatures were measured at fumaroles 3 and 4.
On 20 March INETER conducted Mini DOAS traverses beneath Masaya's SW-trending gas plume. On the proximal route, 12 traverses were successful and determined an average SO2 flux of 1002 t/d suggesting the increasing trend that began in early December 2011 was continuing. Without error calculations and assessing meteorological conditions, however, this trend could not be directly interpreted.
Geohydrology. Long-term interest in diffuse CO2 gas emissions spurred recent investigations into Masaya's hydrothermal system. Mauri and others (2012) found active hydrothermal anomalies under many of the cinder cones and investigated these conditions with field measurements of soil CO2 concentration, self-potential (SP), soil temperatures, and flow-path modeling (figure 32). Self potential methods make observations "of the static natural voltage existing between sets of points on the ground (Sheriff, 1982)". From Comalito cone, Nindirí cone, and the lower slopes of Masaya, CO2 gas concentrations ranged from 26 to 43 ppm (mean values). During a 5-year investigation, the authors collected SP geophysical data over extensive transects within the caldera. The datasets yielded significant correlations between high CO2 soil concentrations and SP anomalies. Water depths were determined by processing the SP data with mathematical techniques (wavelets from the Poisson kernel family). They concluded that interconnected structures (ring faults, fissures, and dikes) serve as flow paths for gas, fluids, and heat. These structures also have the potential to block groundwater flow, a conclusion suggested by their models of groundwater contributions to Masaya Lake (Laguna de Masaya) (figure 32).
In Figure 32a, we see the spatial localization of uprising fluids associated with hydrothermal activity (green diamonds) and gravitational water flow (blue squares) within Masaya caldera for which depths have been determined. The names of volcanic cones are in blue; crater names and ground structures are in dark red; dark green dashed lines are the fissure vent structures; solid red lines represent the inferred structures (faults, fissures) based on previous work by Crenshaw and others (1982) and Harris (2009). The red dashed lines are the hypothetical structures (faults, fissures) (Crenshaw and others, 1982). The black dashed line is the inferred limit of the caldera.
The three segments traced in Figure 32a correspond to cross-sections along A-D-B (figure 32b) and C-D-B (figure 32c). Cross-section A-D-B represents the water flow direction across the caldera while the cross-section along profile C-D-B represents the water flow direction through the active Santiago crater and across the caldera. The dashed red lines represent underground structures in cases where the dip orientation is unknown and are based on the work of Williams (1983) and Crenshaw and others (1982). Blue lines with a single dot above the center represent water flow having a flow direction different than the cross-section view. Solid arrows represent the flow direction inferred from the self potential/elevation gradient. Elevations of the shallow flow direction (blue and solid green arrows) were estimated from multi-scale wavelet tomography (MWT). MWT is a signal processing method based on waves that allow for location of dipole and monopole sources which correspond to the electrical anomalies generated by water flow through bedrock. The dashed grey line and dashed blue arrows are deep hypothetical flows from the transient electromagnetic method (TEM) results (MacNeil and others, 2007). TEM results were considered in this study because they offered a different level of sensitivity to SP method and, at the time of the study, direct well data was not available to correlate results, making it difficult to determine which model (MWT or TEM) best represented the true water depth.
Long-term SO2 fluxes and windspeed-induced errors. Nadeau and Williams-Jones (2009) consolidated data spanning three decades (figure 33) and assessed current methods for constraining uncertainties in SO2 data collected on traverses with UV correlation spectrometers (COSPEC/DOAS/FLYSPEC). The authors agreed with previous investigators that the following factors contribute to uncertainties: variable local windspeed, emission rate, dry deposition of sulfur from the plume, and conversion of SO2 to sulfate aerosols within the plume. Of these factors, the authors stressed that for low-lying volcanoes such as Masaya, the local wind patterns cause the largest errors. "One must be wary of using one blanket plume speed value for all data collected at different locations, as it can result in misleading variations within the SO2 flux dataset (Nadeau and Williams-Jones, 2009)." At Masaya, this led to as much a 50% apparent decrease in measured SO2 flux between the proximal and distal routes.
Modeling Masaya's magma system. Glyn Williams-Jones from Simon Fraser University visited Masaya with student researchers on 21 February 2012. At the National Park facilities, this group presented recent research and results from the 8-year-long collaborative effort between Simon Fraser University, The Open University, and INETER. Williams-Jones reviewed the primary monitoring techniques applied to Masaya and preliminary results regarding the environmental impact of the persistent degassing. In particular, gravity measurements, GPS, and DOAS/FLYSPEC have been used to characterize activity. SO2 flux and air quality measurements have been part of an additional effort to characterize environmental impacts related to resident's health. The varying trend in the SO2 flux observed since 1976 has been interpreted as being related to varying rates of magma convection in the volcanic plumbing system, as opposed to models invoking intermittent magma supply (Williams-Jones and others, 2003; Stix, 2007).
The model invoking convection within the system links Masaya's periodic explosive activity with intense, long-term degassing (Williams-Jones and others, 2003; Stix, 2007). The accumulation of a gas-rich magma within a shallow reservoir could develop a buoyant, pressurized foam. This setting would be susceptible to disruptions (by convection cells or structural adjustments, for example) and could be destabilized, leading to explosive activity.
References. Crenshaw, W.B., Williams, S.N., and Stoiber, R.E., 1982, Fault location by radon and mercury detection at an active volcano in Nicaragua, Nature, 300: 345?346.
Harris, A.J.L., 2009, The pit-craters and pit-crater-filling lavas of Masaya volcano, Bulletin of Volcanology, 71(5): 541?558.
MacNeil, R.E., Sanford, W.E., Connor, C.B., Sandberg, S.K., and Diez, M., 2007, Investigation of the groundwater system at Masaya Caldera, Nicaragua, using transient electromagnetics and numerical simulation, Journal of Volcanology and Geothermal Research, 166(3?4): 216?232.
Mauri, G., Williams-Jones, G., Saracco, G., and Zurek, J.M., 2012, A geochemical and geophysical investigation of the hydrothermal complex of Masaya volcano, Nicaragua, Journal of Volcanology and Geothermal Research, 227?228: 15?31.
Nadeau, P.A. and Williams-Jones, G., 2009, Apparent downwind depletion of volcanic SO2 flux-lessons from Masaya Volcano, Nicaragua, Bulletin of Volcanology, 71: 389?400.
NASA Landsat Program, 2007, Landsat ETM+ scene 7dx20010325, Orthorectified, USGS, Sioux Falls, Mar. 25, 2001.
Sheriff, R.E., 1982, Encyclopedic Dictionary of Exploration Geophysics, Eighth Edition, Society of Exploration Geophysicists, Tulsa, OK, 266 pp.
Stix, J., 2007, Stability and instability of quiescently active volcanoes: the case of Masaya, Nicaragua. Geology, 35(6):535?538.
Williams, S.N., 1983, Geology and eruptive mechanisms of Masaya Caldera complex, Nicaragua [PhD Thesis]: Hanover, New Hampshire, Dartmouth College, 169 p.
Williams-Jones, G., Rymer, H., and Rothery, D.A., 2003, Gravity changes and passive SO2 degassing at the Masaya caldera complex, Nicaragua, Journal of Volcanology and Geothermal Research, 123: 137?160.
Geologic Background. Masaya volcano in Nicaragua has erupted frequently since the time of the Spanish Conquistadors, when an active lava lake prompted attempts to extract the volcano's molten "gold" until it was found to be basalt rock upon cooling. It lies within the massive Pleistocene Las Sierras caldera and is itself a broad, 6 x 11 km basaltic caldera with steep-sided walls up to 300 m high. The caldera is filled on its NW end by more than a dozen vents that erupted along a circular, 4-km-diameter fracture system. The Nindirí and Masaya cones, the source of observed eruptions, were constructed at the southern end of the fracture system and contain multiple summit craters, including the currently active Santiago crater. A major basaltic Plinian tephra erupted from Masaya about 6,500 years ago. Recent lava flows cover much of the caldera floor and there is a lake at the far eastern end. A lava flow from the 1670 eruption overtopped the north caldera rim. Periods of long-term vigorous gas emission at roughly quarter-century intervals have caused health hazards and crop damage.
Information Contacts: Instituto Nicaragüense de Estudios Territoriales (INETER), Apartado Postal 2110, Managua, Nicaragua (URL: http://www.ineter.gob.ni/); Glyn Williams-Jones, Department of Earth Sciences, Simon Fraser University, Burnaby, Canada (URL: http://www.sfu.ca/earth-sciences.html); Hazel Rymer, Department of Environment, Earth and Ecosystems, The Open University, Milton Keynes, UK (URL: http://www8.open.ac.uk/science/environment-earth-ecosystems/).
Semeru
Indonesia
8.108°S, 112.922°E; summit elev. 3657 m
All times are local (unless otherwise noted)
Increased seismicity with lava flows and pyroclastic flows during February-April 2012
Semeru is one of the most active volcanoes worldwide and is of special concern because the drainage area is heavily populated. The volcano has a steep canyon that extends from the summit to the SE, which has funneled pyroclastic flows and lahars into populated areas. The decades-long seismicity from Semeru has typically included mildly explosive Strombolian style eruptions, earthquakes and tremor, ash plumes, and occasional pyroclastic flows (BGVN 32:03, 34:05, and 35:08). See the location of Semeru with respect to the regional setting in figure 17.
According to reporting by the Center of Volcanology and Geological Hazard Mitigation (CVGHM) and the USGS Volcano Disaster Assistance Program (VDAP), six large explosions between 1981 and 2002 resulted in many fatalities. They noted that since 1995, pyroclastic flows have been restricted to S drainages such as Kali Kembar; however, a small proportion of recent flows have entered the headwaters of Kali Koboan on the SE, which leads to heavily populated areas, including Sumberrejo and Candipuro (figure 18). This report discusses activity between February 2010 (the end of the previous report) and 2 May 2012.
On 4 November 2010, CVGHM reported that from August to October 2010 seismic activity at Semeru had increased, and "smoke" and occasional gas plumes rose 400-500 m above the crater. During September incandescent avalanches traveled 400 m SE into the Besuk Kembar drainage on three occasions. Incandescence from the crater was observed in October. Incandescent avalanches traveled 600 m into Besuk Kembar on 2 November. Two days later, they reached 4 km into the Besuk Kembar and Besuk Bang (S) drainages (figure 18). CVGHM noted that the lava dome in the Jonggring Saloko crater was growing. The Alert Level remained at 2 (on a scale of 1-4).
According to the Darwin Volcanic Ash Advisory Centre (VAAC), during 18-19 November 2010, ash plumes rose to an altitude of 4.6 km and drifted 75-110 km N and NW. Sulfur dioxide gas was detected 75 km SW.
According to Volcano Discovery, the group observed 2-3 small-to-medium ash explosions per day during a photo expedition in May 2011, but noted that activity had increased during the past weeks.
In an account posted online by Volcano Discovery on 15 September 2011, the group visited the volcano and noted that an active lava dome was growing inside the crater and that 3-4 eruptions occurred daily. They inferred that the size and frequency of the eruptions had apparently increased in the past days (figure 19).
CVGHM reported that on 29 December 2011, both earthquakes and tremor increased, and dense white-and-gray plumes rose as high as 600 m above the active crater. During January 2012, crater incandescence was observed, and avalanches carried incandescent material 200-400 m away from the crater. According to a 4 January 2012 article in the Jakara Globe, a government official indicated that authorities had closed the trail to the peak of Semeru because of heavy rain and an increased danger of landslides.
On 2 February 2012 a large explosion was reported and incandescent material fell up to 2.5 km from the crater. Tables 20 and 21 indicate the types and numbers of earthquakes and other seismic events reported by CVGHM for February to April 2012. Based on the increased seismic activity and visual observations, CVGHM raised the Alert Level from 2 to 3 on 2 February 2012.
Table 20. Types and numbers of earthquakes and plumes observed at Semeru during February-April 2012. Courtesy of CVGHM.
| Month |
Deep |
Shallow |
Long-distance |
Local |
Eruptive |
Explosive |
Harmonic Tremor |
Pyroclastic Flow |
| Feb 2012 |
4 |
1 |
61 |
-- |
80 |
2336 |
116 |
430 |
| Mar 2012 |
17 |
5 |
60 |
23 |
-- |
1665 |
610 |
40 |
| Apr 2012 |
7 |
2 |
44 |
-- |
-- |
3447 |
66 |
4 |
Table 21. Observed Semeru plumes during February-April 2012. Data from CVGHM. The only other plume noted by the Darwin VAAC between February 2010 and May 2012 was on 18-19 November 2010; this plume was noted in the text. Courtesy of CVGHM.
| Month |
Number of observed plumes |
Plume height above crater |
| Feb 2012 |
22 |
100-500 m |
| Mar 2012 |
9 |
100-400 m |
| Apr 2012 |
155 |
100-500 m |
CVGHM reported that during 1-29 February 2012 multiple pyroclastic flows from Semeru traveled 500 and 2,500 m into the Besuk Kembar and Besuk Kobokan rivers (on the S flank), respectively. Government officials set up an exclusion zone on the SE flank where pyroclastic flows had occurred.
During 1 February-30 April 2012, dense gray-to-white plumes rose 100-500 m above Jongring Seloko crater and drifted W and N. Incandescence was visible up to 50 m above the crater during 1 February-31 March. Seismicity decreased toward the end of April, although the lava dome grew that month.
According to a news account (People's Daily Online) on 1 March 2012, seismic activity had increased from 28 to 38 tremors per day. According to the news account, Dr. Surono, head of CVGHM, stated that the volcano was erupting daily, emitting ash plumes, and tremor occurred every 15-30 minutes. He also noted that the volcanic dome was increasing in size.
According to Volcano Discovery, an expedition leader visiting Semeru observed frequent explosions every few minutes on 27 March 2012, with many powerful enough to eject glowing bombs that produced small glowing avalanches down the S flank.
According to CVGHM and VDAP, a new lava dome started to extrude in late 2011 directly over a dome formed in 2010. The new dome probably will not completely fill the summit crater because it is being drained by two new lava flows, both flowing SE. The longer of the two lava flows extended about 1.9 km from the summit vent. Pyroclastic flows are being generated by collapse of the steep termini of the lava flows, and their deposits extend to 3.2 km from the summit, i.e. 0.7 km from the front shown in figure 18. In addition, the collapsing lava flow fronts are resulting in high levels of avalanche and rockfall activity. According to CVGHM and VDAP, the closest villages in the highest-risk areas on the S and SE flanks are about 10 km from the summit.
On 2 May 2012 CVGHM lowered the Alert Level to 2, but reminded the public not to approach the crater within a 4-km radius.
Geologic Background. Semeru, the highest volcano on Java, and one of its most active, lies at the southern end of a volcanic massif extending north to the Tengger caldera. The steep-sided volcano, also referred to as Mahameru (Great Mountain), rises above coastal plains to the south. Gunung Semeru was constructed south of the overlapping Ajek-ajek and Jambangan calderas. A line of lake-filled maars was constructed along a N-S trend cutting through the summit, and cinder cones and lava domes occupy the eastern and NE flanks. Summit topography is complicated by the shifting of craters from NW to SE. Frequent 19th and 20th century eruptions were dominated by small-to-moderate explosions from the summit crater, with occasional lava flows and larger explosive eruptions accompanied by pyroclastic flows that have reached the lower flanks of the volcano.
Information Contacts: Center of Volcanology and Geological Hazard Mitigation (CVGHM), Jalan Diponegoro 57, Bandung 40122, Indonesia (URL: http://www.vsi.esdm.go.id/); Volcano Disaster Assistance Program (VDAP), US Geological Survey (USGS), 1300 SE Cardinal Court, Bldg. 10, Suite 100, Vancouver, WA 98683; Darwin Volcanic Ash Advisory Centre (VAAC), Bureau of Meteorology, Northern Territory Regional Office, PO Box 40050, Casuarina, NT 0811, Australia (URL: http://www.bom.gov.au/info/vaac); Jakarta Globe (URL: http://www.thejakartaglobe.com); People’s Daily Online (URL: english.peopledaily.com; Volcano Discovery (URL: http://mobile.volcanodiscovery.com).
Soputan (Indonesia) — April 2012 Cite this Report
Soputan
Indonesia
1.112°N, 124.737°E; summit elev. 1785 m
All times are local (unless otherwise noted)
Alert level raised in May 2012 based on increased seismic activity
Our previous report of Soputan volcano chronicled activity during July-September 2011 (BGVN 36:11). Table 9 gives a brief history of activity and highlights activity through early May 2012. The data sources are the Darwin Volcanic Ash Advisory Centre (VAAC) for satellite monitoring of ash plumes and the Indonesian Center of Volcanology and Geological Hazard Mitigation (CVGHM) for seismic monitoring and assignment of alert levels. According to a 28 May 2012 report by CVGHM, Soputan's activities are characterized by the growth of lava domes that have been accreting steadily since 1991. The accretion of these lava domes has been frequently accompanied by ash/cinder eruptions.
Table 9. Summary of volcanic ash observations and other activity at Soputan volcano from late June 2011 through mid-2012. 'VA' refers to volcanic ash. Courtesy of Darwin VAAC and CVGHM.
| Date |
Observations |
Remarks |
| 21 Jun-02 Jul 2011 |
Seismic activity increased |
-- |
| 02 Jul 2011 |
-- |
Alert Level 2 to 3 |
| 03 Jul-04 Jul 2011 |
Explosive eruption of incandescent material with pyroclastic flow 4 km to W; VA plume to 4.6-14 km extending 407 km W |
-- |
| 04 Jul 2011 |
High-level eruption has ceased, dissipating |
-- |
| 19 Jul 2011 |
-- |
Alert Level 3 to 2 |
| 14 Aug 2011 |
Two eruptions; VA plume to 3.7 km extending 107 km W |
Alert Level 2 to 3; VA not identifiable on satellite imagery |
| 14 Aug-07 Sep 2011 |
Seismic Activity significantly decreased after eruption |
-- |
| 08 Sep 2011 |
Hot air blasts of smoke from the mass of the lava dome |
Alert Level 3 to 2 |
| 28 May 2012 |
Seismic activity significantly increased |
Alert Level 2 to 3 |
On 28 May 2012, CVGHM raised the Alert Level of Soputan from 2 to 3 (on a scale of 1-4) following increasing sesimic activity. According to CVGHM, increasing activity had been observed from 21-27 May, when the volcano spewed out white smoke to heights of between 50 to 150 m above the summit. Seismicity increased significantly on 25 May.
CVGHM called on local residents to stay beyond a 6 km radius from the volcano's summit. It also warned residents of the threat of a lahar, urging people living near Ranowangko, Pentu, Lawian and Popang rivers to remain alert and aware.
MODVOLC Thermal Alerts. MODVOLC satellite thermal alerts were measured at Soputan on 2-3 July, 9 July, and 14-15 August 2011, all on the volcano's W flank. These were the first such measurements since the volcano's last eruption, during late October to early November 2008 (BGVN 33:09). Since 8 August 2011 to early March 2012, no alerts have been measured.
Geologic Background. The Soputan stratovolcano on the southern rim of the Quaternary Tondano caldera on the northern arm of Sulawesi Island is one of Sulawesi's most active volcanoes. The youthful, largely unvegetated volcano is the only active cone in the Sempu-Soputan volcanic complex, which includes the Soputan caldera, Rindengan, and Manimporok (3.5 km ESE). Kawah Masem maar was formed in the W part of the caldera and contains a crater lake; sulfur has been extracted from fumarolic areas in the maar since 1938. Recent eruptions have originated at both the summit crater and Aeseput, a prominent NE-flank vent that formed in 1906 and was the source of intermittent major lava flows until 1924.
Information Contacts: Center of Volcanology and Geological Hazard Mitigation (CVGHM), Volcanological Survey of Indonesia (VSI), Jalan Diponegoro 57 Bandung, Jawa Barat 40122, Indonesia (URL: http://vsi.esdm.go.id/); Darwin Volcanic Ash Advisory Centre (VAAC), Bureau of Meteorology, Northern Territory Regional Office, PO Box 40050, Casuarina, Northern Territory 0811, Australia (URL: http://www.bom.gov.au/info/vaac); MODVOLC, Hawai'i Institute of Geophysics and Planetology (HIGP) Thermal Alerts System, School of Ocean and Earth Science and Technology (SOEST), Univ. of Hawai'i, 2525 Correa Road, Honolulu, HI 96822, USA (URL: http://modis.higp.hawaii.edu/); Jakarta Post (URL: http://www.thejakartapost.com).