Recently Published Bulletin Reports
Shishaldin (United States) New eruption with significant Strombolian explosions, ash plumes, and ashfall
Ioto (Japan) New eruption with discolored water, ejecta, and floating pumice during October-December 2023
Purace (Colombia) Gas-and-ash emission on 16 November 2023
Etna (Italy) Strombolian explosions, lava fountains, and lava flows during July-August 2023
Suwanosejima (Japan) Eruption plumes, crater incandescence, and occasional explosions during July-October 2023
Aira (Japan) Explosions, ash plumes, ash fall, and crater incandescence during July-October 2023
Nishinoshima (Japan) Gray emissions during October 2023
Kilauea (United States) Strong lava fountains, lava flows, and spatter at Halema’uma’u during January-September 2023
Tinakula (Solomon Islands) Continued lava flows and thermal activity during June through November 2023
Fuego (Guatemala) Daily explosions, gas-and-ash plumes, and block avalanches during August-November 2023
Santa Maria (Guatemala) Continuing lava effusion, explosions, ash plumes, and pyroclastic flows during August-November 2023
Karangetang (Indonesia) Incandescent avalanches, pyroclastic flows, and ash plumes during July-September 2023
Shishaldin (United States) — December 2023  Cite this Report
Shishaldin
United States
54.756°N, 163.97°W; summit elev. 2857 m
All times are local (unless otherwise noted)
New eruption with significant Strombolian explosions, ash plumes, and ashfall
Shishaldin is located on the eastern half of Unimak Island, one of the Aleutian Islands. Frequent explosive activity, primarily consisting of Strombolian ash eruptions from the small summit crater, but sometimes producing lava flows, has been recorded since the 18th century. The previous eruption ended in May 2020 and was characterized by intermittent thermal activity, increased seismicity and surface temperatures, ash plumes, and ash deposits (BGVN 45:06). This report covers a new eruption during July through November 2023, which consisted of significant explosions, ash plumes, ashfall, and lava fountaining. Information comes from daily, weekly, and special reports from the Alaska Volcano Observatory (AVO) and various satellite data. AVO monitors the volcano using local seismic and infrasound sensors, satellite data, web cameras, and remote infrasound and lightning networks.
AVO reported that intermittent tremor and low-frequency earthquakes had gradually become more regular and consistent during 10-13 July. Strongly elevated surface temperatures at the summit were identified in satellite images during 10-13 July. On 11 July AVO raised the Aviation Color Code (ACC) to Yellow (the second color on a four-color scale) and Volcano Alert Level (VAL) to Advisory (the second level on a four-level scale) at 1439. Later in the day on 11 July summit crater incandescence was observed in webcam images. Observations of the summit suggested that lava was likely present at the crater, which prompted AVO to raise the ACC to Orange (the second highest color on a four-color scale) and the VAL to Watch (the second highest level on a four-level scale). The US Coast Guard conducted an overflight on 12 July and confirmed that lava was erupting from the summit. That same day, sulfur dioxide emissions were detected in satellite images.
A significant explosion began at 0109 on 14 July that produced an ash plume that rose to 9-12 km altitude and drifted S over the Pacific Ocean (figure 43). Webcam images and photos taken around 0700 from a ship SW off Unimak Island showed small lahar deposits, which were the result of the interaction of hot pyroclastic material and snow and ice on the flanks. There was also ashfall on the SW and N flanks. A smaller explosion at 0710 generated an ash plume that rose to 4.5 km altitude. Webcam images and pilot reports showed continued low-level ash emissions during the morning, rising to less than 4.6 km altitude; those emissions included a small ash plume near the summit around 1030 resulting from a small explosion.
Seismic tremor amplitude began increasing at around 1700 on 15 July; strongly elevated surface temperatures were also reported. An ash plume rose to 4.6 km altitude and drifted SSE at 2100, based on a satellite image. A continuous ash plume during 2150 through 2330 rose to 5 km altitude and extended 125 km S. At 2357 AVO raised the ACC to Red (the highest color on a four-color scale) and the VAL to Warning (the highest level on a four-level scale), noting that seismicity remained elevated for more than six hours and explosion signals were frequently detected by regional infrasound (pressure sensor) networks. Explosions generated an ash plume that rose to 4.9 km altitude and drifted as far as 500 km SE. Activity throughout the night declined and by 0735 the ACC was lowered to Orange and the VAL to Watch. High-resolution satellite images taken on 16 July showed pyroclastic deposits extending as far as 3 km from the vent; these deposits generated lahars that extended further down the drainages on the flanks. Ash deposits were mainly observed on the SSE flank and extended to the shore of Unimak Island. During 16-17 July lava continued to erupt at the summit, which caused strongly elevated surface temperatures that were visible in satellite imagery.
Lava effusion increased at 0100 on 18 July, as noted in elevated surface temperatures identified in satellite data, increasing seismic tremor, and activity detected on regional infrasound arrays. A significant ash plume at 0700 rose to 7 km altitude and continued until 0830, eventually reaching 9.1 km altitude and drifting SSE (figure 44). As a result, the ACC was raised to Red and the VAL to Warning. By 0930 the main plume detached, but residual low-level ash emissions continued for several hours, remaining below 3 km altitude and drifting S. The eruption gradually declined and by 1208 the ACC was lowered to Orange and the VAL was lowered to Watch. High-resolution satellite images showed ash deposits on the SW flank and pyroclastic deposits on the N, E, and S flanks, extending as far as 3 km from the vent; lahars triggered by the eruption extended farther down the flanks (figure 45). Lava continued to erupt from the summit crater on 19 July.
Elevated surface temperatures were detected in satellite images during 19-25 July, despite occasional weather cloud cover, which was consistent with increased lava effusion. During 22-23 July satellite observations acquired after the eruption from 18 July showed pyroclastic flow and lahar deposits extending as far as 3 km down the N, NW, and NE flanks and as far as 1.5 km down the S and SE flanks. Ash deposits covered the SW and NE flanks. No lava flows were observed outside the crater. On 22 July a sulfur dioxide plume was detected in satellite data midday that had an estimated mass of 10 kt. In a special notice issued at 1653 on 22 July AVO noted that eruptive activity had intensified over the previous six hours, which was characterized by an hours-long steady increase in seismic tremor, intermittent infrasound signals consistent with small explosions, and an increase in surface temperatures that were visible in satellite data. Pilots first reported low-level ash plumes at around 1900. At 2320 an ash plume had risen to 9 km altitude based on additional pilot reports and satellite images. The ACC was increased to Red and the VAL to Warning at 2343. Satellite images indicated growth of a significantly higher ash plume that rose to 11 km altitude continued until 0030 and drifted NE. During the early morning hours of 23 July ash plumes had declined to 4.6 k altitude. Seismic tremor peaked at 0030 on 23 July and began to rapidly decline at 0109; active ash emissions were no longer visible in satellite data by 0130. The ACC was lowered to Orange and the VAL to Watch at 0418; bursts of increased seismicity were recorded throughout the morning, but seismicity generally remained at low levels. Elevated surface temperatures were visible in satellite data until about 0600. On 24 July pilots reported seeing vigorous gas-and-steam plumes rising to about 3 km altitude; the plumes may have contained minor amounts of ash.
During 24-25 July low level seismicity and volcanic tremor were detected at low levels following the previous explosion on 23 July. Strongly elevated surface temperatures were observed at the summit crater in satellite data. Around 2200 on 25 July seismicity began to increase, followed by infrasound signals of explosions after 0200 on 26 July. An ash plume rose to 3 km altitude at 0500 and drifted ENE, along with an associated sulfur dioxide plume that drifted NE and had an estimated mass of 22 kt. Diffuse ash emissions were visible in satellite data and rose to 6.1-7.6 km altitude and extended 125 km from the volcano starting around 1130. These ash events were preceded by about seven hours of seismic tremor, infrasound detections of explosions, and five hours of increased surface temperatures visible in satellite data. Activity began to decline around 1327, which included low-frequency earthquakes and decreased volcanic tremor, and infrasound data no longer detected significant explosions. Surface temperatures remained elevated through the end of the month.
Seismicity, volcanic tremor, and ash emissions remained at low levels during early August. Satellite images on 1 August showed that some slumping had occurred on the E crater wall due to the recent explosive activity. Elevated surface temperatures continued, which was consistent with cooling lava. On 2 August small explosive events were detected, consistent with low-level Strombolian activity. Some episodes of volcanic tremor were reported, which reflected low-level ash emissions. Those ash emissions rose to less than 3 km altitude and drifted as far as 92.6 km N. Pilots that were located N of the volcano observed an ash plume that rose to 2.7 km altitude. Seismicity began to increase in intensity around 0900 on 3 August. Seismicity continued to increase throughout the day and through the night with strongly elevated surface temperatures, which suggested that lava was active at the surface.
An ash cloud that rose to 7.6-7.9 km altitude and drifted 60-75 km NE was visible in a satellite image at 0520 on 4 August. Pilots saw and reported the plume at 0836 (figure 46). By 0900 the plume had risen to 9.1 km altitude and extended over 100 km NE. AVO raised the ACC to Red and the VAL to Warning as a result. Seismic tremor levels peaked at 1400 and then sharply declined at 1500 to slightly elevated levels; the plume was sustained during the period of high tremor and drifted N and NE. The ACC was lowered to Orange and the VAL to Watch at 2055. During 5-14 August seismicity remained low and surface temperatures were elevated based on satellite data due to cooling lava. On 9 August a small lava flow was observed that extended from the crater rim to the upper NE flank. It had advanced to 55 m in length and appeared in satellite imagery on 11 August. Occasional gas-and-steam plumes were noted in webcam images. At 1827 AVO noted that seismic tremor had steadily increased during the afternoon and erupting lava was visible at the summit in satellite images.
Strong explosion signals were detected at 0200 on 15 August. An ash cloud that was visible in satellite data extended 100 km NE and may have risen as high as 11 km altitude around 0240. By 0335 satellite images showed the ash cloud rising to 7.6 km altitude and drifting NE. Significant seismicity and explosions were detected by the local AVO seismic and infrasound networks, and volcanic lightning was detected by the World Wide Lightning Location Network (WWLLN). A sulfur dioxide plume associated with the eruption drifted over the S Bering Sea and parts of Alaska and western Canada. Seismicity was significantly elevated during the eruption but had declined by 1322. A pilot reported that ash emissions continued, rising as high as 4.9 km altitude. Elevated surface temperatures detected in satellite data were caused by hot, eruptive material (pyroclastic debris and lava) that accumulated around the summit. Eruptive activity declined by 16 August and the associated sulfur dioxide plume had mostly dissipated; remnants continued to be identified in satellite images at least through 18 August. Surface temperatures remained elevated based on satellite images, indicating hot material on the upper parts of the volcano. Small explosions were detected in infrasound data on the morning of 19 August and were consistent with pilot reports of small, short-lived ash plumes that rose to about 4.3 km altitude. Low-level explosive activity was reported during 20-24 August, according to seismic and infrasound data, and weather clouds sometimes prevented views. Elevated surface temperatures were observed in satellite images, which indicated continued hot material on the upper parts of the volcano.
Seismic tremor began to increase at around 0300 on 25 August and was followed by elevated surface temperatures identified in satellite images, consistent with erupting lava. Small explosions were recorded in infrasound data. The ACC was raised to Red and the VAL to Warning at 1204 after a pilot reported an ash plume that rose to 9.1 km altitude. Seismicity peaked at 1630 and began to rapidly decline at around 1730. Ash plumes rose as high as 10 km altitude and drifted as far as 400 km NE. By 2020 the ash plumes had declined to 6.4 km altitude and continued to drift NE. Ash emissions were visible in satellite data until 0000 on 26 August and seismicity was at low levels. AVO lowered the ACC to Orange and the VAL to Watch at 0030. Minor explosive activity within the summit crater was detected during 26-28 August and strongly elevated surface temperatures were still visible in satellite imagery through the rest of the month. An AVO field crew working on Unimak Island observed a mass flow that descended the upper flanks beginning around 1720 on 27 August. The flow produced a short-lived ash cloud that rose to 4.5 km altitude and rapidly dissipated. The mass flow was likely caused by the collapse of spatter that accumulated on the summit crater rim.
Similar variable explosive activity was reported in September, although weather observations sometimes prevented observations. A moderate resolution satellite image from the afternoon of 1 September showed gas-and-steam emissions filling the summit crater and obscuring views of the vent. In addition, hot deposits from the previous 25-26 August explosive event were visible on the NE flank near the summit, based on a 1 September satellite image. On 2 and 4 September seismic and infrasound data showed signals of small, repetitive explosions. Variable gas-and-steam emissions from the summit were visible but there was no evidence of ash. Possible summit crater incandescence was visible in nighttime webcam images during 3-4 September.
Seismicity began to gradually increase at around 0300 on 5 September and activity escalated at around 0830. A pilot reported an ash plume that rose to 7.6 km altitude at 0842 and continued to rise as high as possibly 9.7 km altitude and drifted SSE based on satellite images (figure 47). The ACC was raised to Red and the VAL to Warning at 0900. In addition to strong tremor and sustained explosions, the eruption produced volcanic lightning that was detected by the WWLLN. Around 1100 seismicity decreased and satellite data confirmed that the altitude of the ash emissions had declined to 7.6 km altitude. By 1200 the lower-altitude portion of the ash plume had drifted 125 km E. Significant ash emissions ended by 1330 based on webcam images. The ACC was lowered to Orange and the VAL to Watch at 1440. Satellite images showed extensive pyroclastic debris flows on most of the flanks that extended 1.2-3.3 km from the crater rim.
During 6-13 September elevated surface temperatures continued to be observed in satellite data, seismicity remained elevated with weak but steady tremor, and small, low-frequency earthquakes and small explosions were reported, except on 12 September. On 6 September a low-level ash plume rose to 1.5-1.8 km altitude and drifted SSE. Occasional small and diffuse gas-and-steam emissions at the summit were visible in webcam images. Around 1800 on 13 September seismic tremor amplitudes began to increase, and small explosions were detected in seismic and infrasound data. Incandescent lava at the summit was seen in a webcam image taken at 0134 on 14 September during a period of elevated tremor. No ash emissions were reported during the period of elevated seismicity. Lava fountaining began around 0200, based on webcam images. Satellite-based radar observations showed that the lava fountaining activity led to the growth of a cone in the summit crater, which refilled most of the crater. By 0730 seismicity significantly declined and remained at low levels.
Seismic tremor began to increase around 0900 on 15 September and rapidly intensified. An explosive eruption began at around 1710, which prompted AVO to raise the ACC to Red and the VAL to Warning. Within about 30 minutes ash plumes drifted E below a weather cloud at 8.2 km altitude. The National Weather Service estimated that an ash-rich plume rose as high as 12.8 km altitude and produced volcanic lightning. The upper part of the ash plume detached from the vent around 1830 and drifted E, and was observed over the Gulf of Alaska. Around the same time, seismicity dramatically decreased. Trace ashfall was reported in the community of False Pass (38 km ENE) between 1800-2030 and also in King Cove and nearby marine waters. Activity declined at around 1830 although seismicity remained elevated, ash emissions, and ashfall continued until 2100. Lightning was again detected beginning around 1930, which suggested that ash emissions continued. Ongoing explosions were detected in infrasound data, at a lower level than during the most energetic phase of this event. Lightning was last detected at 2048. By 2124 the intensity of the eruption had decreased, and ash emissions were likely rising to less than 6.7 km altitude. Seismicity returned to pre-eruption levels. On 16 September the ACC was lowered to Orange and the VAL to Watch at 1244; the sulfur dioxide plume that was emitted from the previous eruption event was still visible over the northern Pacific Ocean. Elevated surface temperatures, gas-and-steam emissions from the vent, and new, small lahars were reported on the upper flanks based on satellite and webcam images. Minor deposits were reported on the flanks which were likely the result of collapse of previously accumulated lava near the summit crater.
Elevated seismicity with tremor, small earthquakes, and elevated surface temperatures were detected during 17-23 September. Minor gas-and-steam emissions were visible in webcam images. On 20 September small volcanic debris flows were reported on the upper flanks. On 21 September a small ash deposit was observed on the upper flanks extending to the NE based on webcam images. Seismic tremor increased significantly during 22-23 September. Regional infrasound sensors suggested that low-level eruptive activity was occurring within the summit crater by around 1800 on 23 September. Even though seismicity was at high levels, strongly elevated surface temperatures indicating lava at the surface were absent and no ash emissions were detected; weather clouds at 0.6-4.6 km altitude obscured views. At 0025 on 24 September AVO noted that seismicity continued at high levels and nearly continuous small infrasound signals began, likely from low-level eruptive activity. Strongly elevated surface temperatures were identified in satellite images by 0900 and persisted throughout the day; the higher temperatures along with infrasound and seismic data were consistent with lava erupting at the summit. Around 1700 similarly elevated surface temperatures were detected from the summit in satellite data, which suggested that more vigorous lava fountaining had started. Starting around 1800 low-level ash emissions rose to altitudes less than 4.6 km altitude and quickly dissipated.
Beginning at midnight on 25 September, a series of seismic signals consistent with volcanic flows were recorded on the N side of the volcano. A change in seismicity and infrasound signals occurred around 0535 and at 0540 a significant ash cloud formed and quickly reached 14 km altitude and drifted E along the Alaska Peninsula. The cloud generated at least 150 lightning strokes with thunder that could be heard by people in False Pass. Seismicity rapidly declined to near background levels around 0600. AVO increased the ACC to Red and the VAL to Warning at 0602. The ash cloud detached from the volcano at around 0700, rose to 11.6 km altitude, and drifted ESE. Trace to minor amounts of ashfall were reported by the communities of False Pass, King Cove, Cold Bay, and Sand Point around 0700. Ash emissions continued at lower altitudes of 6-7.6 km altitude at 0820. Small explosions at the vent area continued to be detected in infrasound data and likely represented low-level eruptive activity near the vent. Due to the significant decrease in seismicity and ash emissions the ACC was lowered to Orange and the VAL to Watch at 1234. Radar data showed significant collapses of the crater that occurred on 25 September. Satellite data also showed significant hot, degassing pyroclastic and lahar deposits on all flanks, including more extensive flows on the ENE and WSW sections below two new collapse scarps. Following the significant activity during 24-25 September, only low-level activity was observed. Seismicity decreased notably near the end of the strong activity on 25 September and continued to decrease through the end of the month, though tremor and small earthquakes were still reported. No explosive activity was detected in infrasound data through 2 October. Gas-and-steam emissions rose to 3.7 km altitude, as reported by pilots and seen in satellite images. Satellite data from 26 September showed that significant collapses had occurred at the summit crater and hot, steaming deposits from pyroclastic flows and lahars were present on all the flanks, particularly to the ENE and WSW. A small ash cloud was visible in webcam images on 27 September, likely from a collapse at the summit cone. High elevated surface temperatures were observed in satellite imagery during 27-28 September, which were likely the result of hot deposits on the flanks erupted on 25 September. Minor steaming at the summit crater and from an area on the upper flanks was visible in webcam images on 28 September.
During October, explosion events continued between periods of low activity. Seismicity significantly increased starting at around 2100 on 2 October; around the same time satellite images showed an increase in surface temperatures consistent with lava fountaining. Small, hot avalanches of rock and lava descended an unspecified flank. In addition, a distinct increase in infrasound, seismicity, and lightning detections was followed by an ash plume that rose to 12.2 km altitude and drifted S and E at 0520 on 3 October, based on satellite images. Nighttime webcam images showed incandescence due to lava fountaining at the summit and pyroclastic flows descending the NE flank. AVO reported that a notable explosive eruption started at 0547 and lasted until 0900 on 3 October, which prompted a rise in the ACC to Red and the VAL to Warning. Subsequent ash plumes rose to 6-7.6 km altitude by 0931. At 1036 the ACC was lowered back to Orange and the VAL to Watch since both seismic and infrasound data quieted substantially and were slightly above background levels. Gas-and-steam emissions were observed at the summit, based on webcam images. Trace amounts of ashfall were observed in Cold Bay. Resuspended ash was present at several kilometers altitude near the volcano. During the afternoon, low-level ash plumes were visible at the flanks, which appeared to be largely generated by rock avalanches off the summit crater following the explosive activity. These ash plumes rose to 3 km altitude and drifted W. Trace amounts of ashfall were reported by observers in Cold Bay and Unalaska and flights to these communities were disrupted by the ash cloud. Satellite images taken after the eruption showed evidence of pyroclastic flows and lahar deposits in drainages 2 km down the SW flank and about 3.2 km down the NE flank, and continued erosion of the crater rim. Small explosion craters at the end of the pyroclastic flows on the NE flank were noted for the first time, which may have resulted from gas-and-steam explosions when hot deposits interact with underlying ice.
During 4 October seismicity, including frequent small earthquakes, remained elevated, but was gradually declining. Ash plumes were produced for over eight hours until around 1400 that rose to below 3.7 km altitude. These ash plumes were primarily generated off the sides of the volcano where hot rock avalanches from the crater rim had entered drainages to the SW and NE. Two explosion craters were observed at the base of the NE deposits about 3.2 km from the crater rim. Webcam images showed the explosion craters were a source of persistent ash emissions; occasional collapse events also generated ash. Seismicity remained elevated with sulfur dioxide emissions that had a daily average of more than 1,000 tons per day, and frequent small earthquakes through the end of the month. Frequent elevated surface temperatures were identified in satellite images and gas-and-steam plumes were observed in webcam images, although weather conditions occasionally prevented clear views of the summit. Emissions were robust during 14-16 October and were likely generated by the interaction of hot material and snow and ice. During the afternoon of 21 October a strong gas-and-steam plume rose to 3-4.6 km altitude and extended 40 km WSW, based on satellite images and reports from pilots. On 31 October the ACC was lowered to Yellow and the VAL was lowered to Advisory.
Activity in November was characterized by elevated seismicity with ongoing seismic tremor and small, low-frequency earthquakes, elevated surface temperatures, and gas-and-steam emissions. There was an increase in seismic and infrasound tremor amplitudes starting at 1940 on 2 November. As a result, the ACC was again raised to Orange and the VAL was increased to Watch, although ash was not identified in satellite data. An ash cloud rose to 6.1 km altitude and drifted W according to satellite data at 2000. By 0831 on 3 November ash emissions were no longer visible in satellite images. On 6 and 9 November air pressure sensors detected signals consistent with small explosions. Small explosions were detected in infrasound data consistent with weak Strombolian activity on 19 and 21 November. Seismicity started to decrease on 21 November. On 25 November gas-and-steam emissions were emitted from the vent as well as from a scarp on the NE side of the volcano near the summit. A gas-and-steam plume extended about 50 km SSE and was observed in satellite and webcam images on 26 November. On 28 November small explosions were observed in seismic and local infrasound data and gas-and-steam emissions were visible from the summit and from the upper NE collapse scarp based on webcam images. Possible small explosions were observed in infrasound data on 30 November. Weakly elevated surface temperatures and a persistent gas-and-steam plume from the summit and collapse scarps on the upper flanks. A passing aircraft reported the gas-and-steam plume rose to 3-3.4 km altitude on 30 November, but no significant ash emissions were detected.
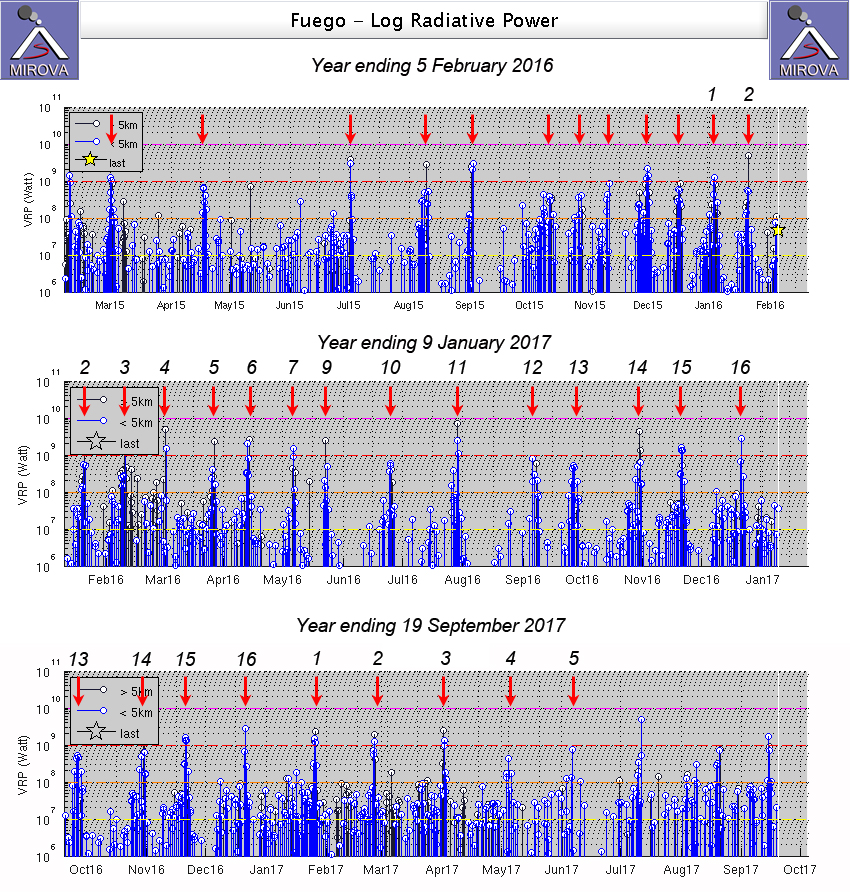
Satellite data. MODIS thermal anomaly data provided through MIROVA (Middle InfraRed Observation of Volcanic Activity) showed a strong pulse of thermal activity beginning in July 2023 that continued through November 2023 (figure 48). This strong activity was due to Strombolian explosions and lava fountaining events at the summit crater. According to data from MODVOLC thermal alerts, a total of 101 hotspots were detected near the summit crater in July (11-14, 16-19, 23-24 and 26), August (4, 25-26, and 29), September (5, 12, and 17), and October (3, 4, and 8). Infrared satellite data showed large lava flows descending primarily the northern and SE flanks during the reporting period (figure 49). Sulfur dioxide plumes often exceeded two Dobson Units (DUs) and drifted in different directions throughout the reporting period, based on satellite data from the TROPOMI instrument on the Sentinel-5P satellite (figure 50).
Geologic Background. The symmetrical glacier-covered Shishaldin in the Aleutian Islands is the westernmost of three large stratovolcanoes in the eastern half of Unimak Island. The Aleuts named the volcano Sisquk, meaning "mountain which points the way when I am lost." Constructed atop an older glacially dissected edifice, it is largely basaltic in composition. Remnants of an older edifice are exposed on the W and NE sides at 1,500-1,800 m elevation. There are over two dozen pyroclastic cones on its NW flank, which is covered by massive aa lava flows. Frequent explosive activity, primarily consisting of Strombolian ash eruptions from the small summit crater, but sometimes producing lava flows, has been recorded since the 18th century. A steam plume often rises from the summit crater.
Information Contacts: Alaska Volcano Observatory (AVO), a cooperative program of a) U.S. Geological Survey, 4200 University Drive, Anchorage, AK 99508-4667 USA (URL: https://avo.alaska.edu/), b) Geophysical Institute, University of Alaska, PO Box 757320, Fairbanks, AK 99775-7320, USA, and c) Alaska Division of Geological & Geophysical Surveys, 794 University Ave., Suite 200, Fairbanks, AK 99709, USA (URL: http://dggs.alaska.gov/); MIROVA (Middle InfraRed Observation of Volcanic Activity), a collaborative project between the Universities of Turin and Florence (Italy) supported by the Centre for Volcanic Risk of the Italian Civil Protection Department (URL: http://www.mirovaweb.it/); Hawai'i Institute of Geophysics and Planetology (HIGP) - MODVOLC Thermal Alerts System, School of Ocean and Earth Science and Technology (SOEST), Univ. of Hawai'i, 2525 Correa Road, Honolulu, HI 96822, USA (URL: http://modis.higp.hawaii.edu/); NASA Global Sulfur Dioxide Monitoring Page, Atmospheric Chemistry and Dynamics Laboratory, NASA Goddard Space Flight Center (NASA/GSFC), 8800 Greenbelt Road, Goddard, Maryland, USA (URL: https://so2.gsfc.nasa.gov/); Copernicus Browser, Copernicus Data Space Ecosystem, European Space Agency (URL: https://dataspace.copernicus.eu/browser/).
Ioto
Japan
24.751°N, 141.289°E; summit elev. 169 m
All times are local (unless otherwise noted)
New eruption with discolored water, ejecta, and floating pumice during October-December 2023
Ioto (Iwo-jima), located about 1,200 km S of Tokyo, lies within a 9-km-wide submarine caldera along the Izu-Bonin-Mariana volcanic arc. Previous eruptions date back to 1889 and have consisted of dominantly phreatic explosions, pumice deposits during 2001, and discolored water. A submarine eruption during July through December 2022 was characterized by discolored water, pumice deposits, and gas emissions (BGVN 48:01). This report covers a new eruption during October through December 2023, which consisted of explosions, black ejecta, discolored water, and floating pumice, based on information from the Japan Meteorological Association (JMA), the Japan Coast Guard (JCG), and satellite data.
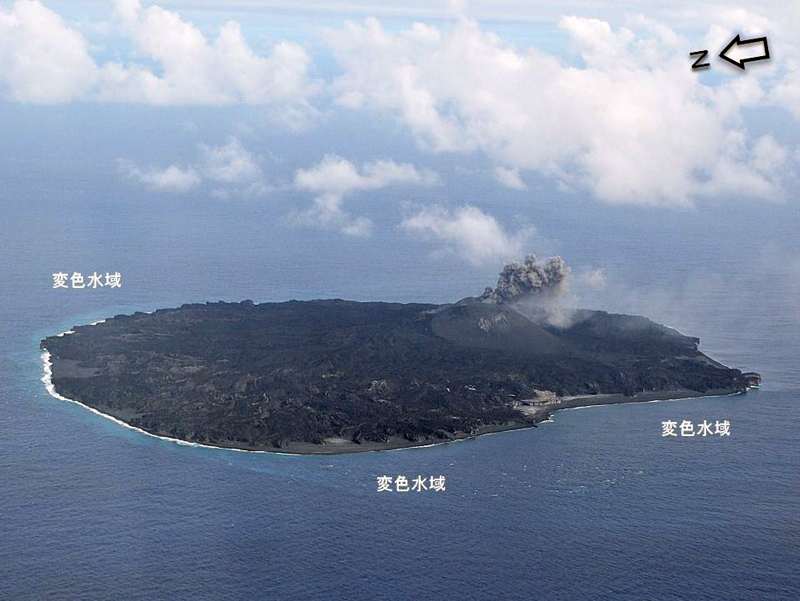
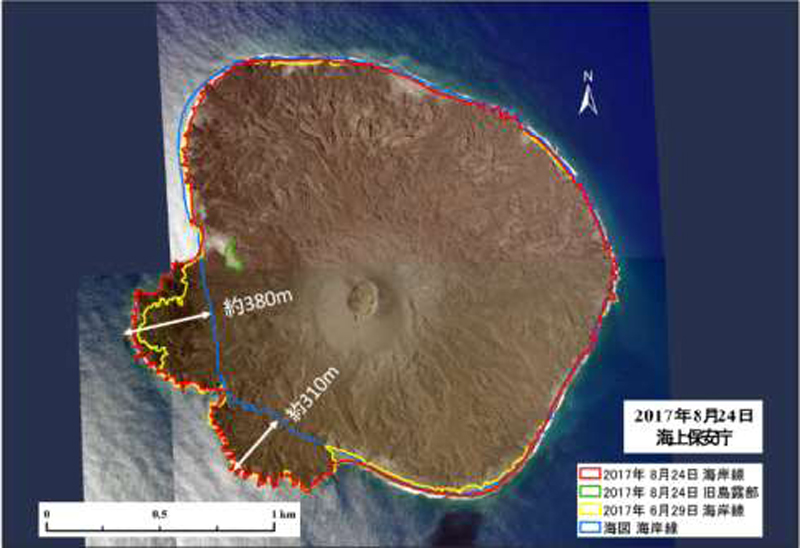
JMA reported that an eruption had been occurring offshore of Okinahama on the SE side of the island since 21 October, which was characterized by volcanic tremor, according to the Japan Maritime Self-Defense Force (JMSDF) Iwo Jima Air Base (figure 22). According to an 18 October satellite image a plume of discolored water at the site of this new eruption extended NE (figure 23). During an overflight conducted on 30 October, a vent was identified about 1 km off the coast of Okinahama. Observers recorded explosions every few minutes that ejected dark material about 20 m above the ocean and as high as 150 m. Ejecta from the vent formed a black-colored island about 100 m in diameter, according to observations conducted from the air by the Earthquake Research Institute of the University of Tokyo in cooperation with the Mainichi newspaper (figure 24). Occasionally, large boulders measuring more than several meters in size were also ejected. Observations from the Advanced Land Observing Satellite Daichi-2 and Sentinel-2 satellite images also confirmed the formation of this island (figure 23). Brown discolored water and floating pumice were present surrounding the island.
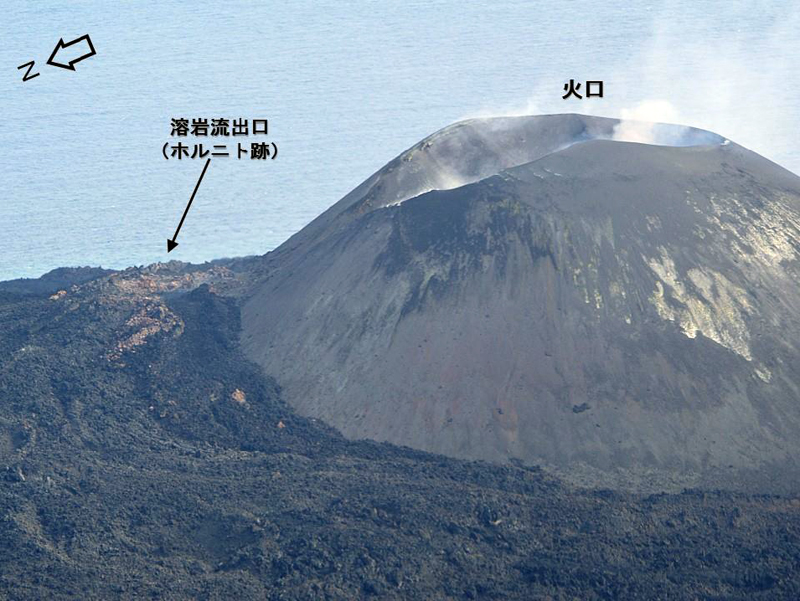
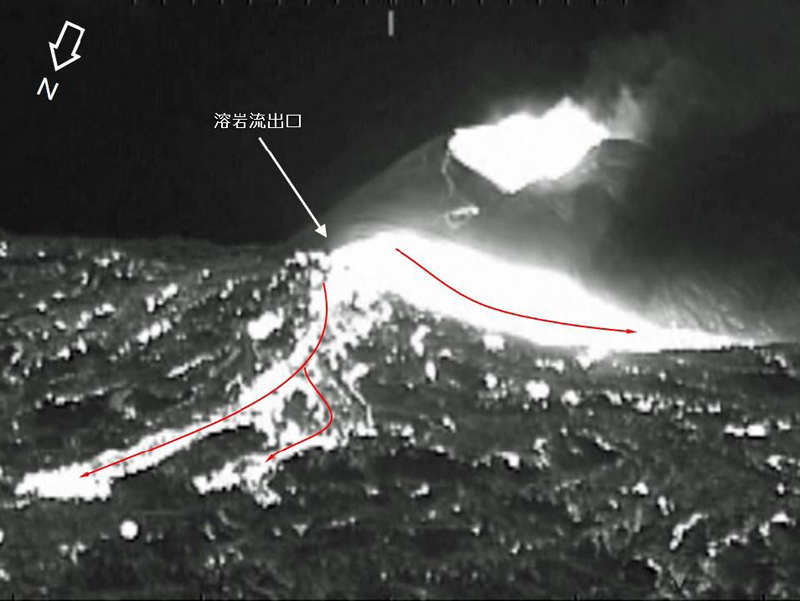
The eruption continued during November. During an overflight on 3 November observers photographed the island and noted that material was ejected 169 m high, according to a news source. Explosions gradually became shorter, and, by the 3rd, they occurred every few seconds; dark and incandescent material were ejected about 800 m above the vent. On 4 November eruptions were accompanied by explosive sounds. Floating, brown-colored pumice was present in the water surrounding the island. There was a brief increase in the number of volcanic earthquakes during 8-14 November and 24-25 November. The eruption temporarily paused during 9-11 November and by 12 November eruptions resumed to the W of the island. On 10 November dark brown-to-dark yellow-green discolored water and a small amount of black floating material was observed (figure 25). A small eruption was reported on 18 November off the NE coast of the island, accompanied by white gas-and-steam plumes (figure 23). Another pause was recorded during 17-19 November, which then resumed on 20 November and continued erupting intermittently. According to a field survey conducted by the National Institute for Disaster Prevention Science and Technology on 19 November, a 30-m diameter crater was visible on the NE coast where landslides, hot water, and gray volcanic ash containing clay have occurred and been distributed previously. Erupted blocks about 10 cm in diameter were distributed about 90-120 m from the crater. JCG made observations during an overflight on 23 November and reported a phreatomagmatic eruption. Explosions at the main vent generated dark gas-and-ash plumes that rose to 200 m altitude and ejected large blocks that landed on the island and in the ocean (figure 26). Discolored water also surrounded the island. The size of the new island had grown to 450 m N-S x 200 m E-W by 23 November, according to JCG.
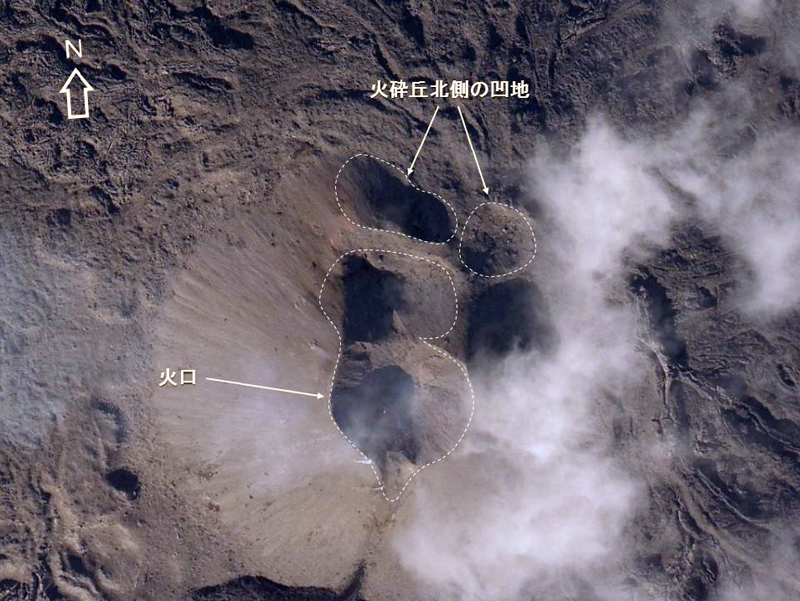
The eruption continued through 11 December, followed by a brief pause in activity, which then resumed on 31 December, according to JMA. Intermittent explosions produced 100-m-high black plumes at intervals of several minutes to 30 minutes during 1-10 December. Overflights were conducted on 4 and 15 December and reported that the water surrounding the new island was discolored to dark brown-to-dark yellow-green (figure 27). No floating material was reported during this time. In comparison to the observations made on 23 November, the new land had extended N and part of it had eroded away. In addition, analysis by the Geospatial Information Authority of Japan using SAR data from Daichi-2 also confirmed that the area of the new island continued to decrease between 4 and 15 December. Ejected material combined with wave erosion transformed the island into a “J” shape, 500-m-long and with the curved part about 200 m offshore of Ioto. The island was covered with brown ash and blocks, and the surrounding water was discolored to greenish-brown and contained an area of floating pumice. JCG reported from an overflight on 4 December that volcanic ash-like material found around the S vent on the NE part of the island was newly deposited since 10 November (figure 28). By 15 December the N part of the “J” shaped island had separated and migrated N, connecting to the Okinahama coast and the curved part of the “J” had eroded into two smaller islands (figure 27).
References. Ukawa, M., Fujita, E., Kobayashi, T., 2002, Recent volcanic activity of Iwo Jima and the 2001 eruption, Monthly Chikyu, Extra No. 39, 157-164.
Geologic Background. Ioto, in the Volcano Islands of Japan, lies within a 9-km-wide submarine caldera. The volcano is also known as Ogasawara-Iojima to distinguish it from several other "Sulfur Island" volcanoes in Japan. The triangular, low-elevation, 8-km-long island narrows toward its SW tip and has produced trachyandesitic and trachytic rocks that are more alkalic than those of other volcanoes in this arc. The island has undergone uplift for at least the past 700 years, accompanying resurgent doming of the caldera; a shoreline landed upon by Captain Cook's surveying crew in 1779 is now 40 m above sea level. The Motoyama plateau on the NE half of the island consists of submarine tuffs overlain by coral deposits and forms the island's high point. Many fumaroles are oriented along a NE-SW zone cutting through Motoyama. Numerous recorded phreatic eruptions, many from vents on the W and NW sides of the island, have accompanied the uplift.
Information Contacts: Japan Meteorological Agency (JMA), 1-3-4 Otemachi, Chiyoda-ku, Tokyo 100-8122, Japan (URL: http://www.jma.go.jp/jma/indexe.html); Japan Coast Guard (JCG) Volcano Database, Hydrographic and Oceanographic Department, 3-1-1, Kasumigaseki, Chiyoda-ku, Tokyo 100-8932, Japan (URL: https://www1.kaiho.mlit.go.jp/GIJUTSUKOKUSAI/kaiikiDB/kaiyo22-2.htm); Copernicus Browser, Copernicus Data Space Ecosystem, European Space Agency (URL: https://dataspace.copernicus.eu/browser/); Asahi, 5-3-2, Tsukiji, Chuo Ward, Tokyo, 104-8011, Japan (URL: https://www.asahi.com/ajw/articles/15048458).
Purace (Colombia) — December 2023 Cite this Report
Purace
Colombia
2.3095°N, 76.3948°W; summit elev. 4650 m
All times are local (unless otherwise noted)
Gas-and-ash emission on 16 November 2023
Puracé, located in Colombia, is a stratovolcano that contains a 500-m-wide summit crater. It is part of the Los Coconucos volcanic chain that is a NW-SE trending group of seven cones and craters. The most recent eruption occurred during March 2022 that was characterized by frequent seismicity and gas-and-steam emissions (BGVN 47:06). This report covers a brief eruption during November 2023 based on monthly reports from the Popayán Observatory, part of the Servicio Geologico Colombiano (SGC).
Activity during November 2022 through November 2023 primarily consisted of seismicity: VT-type events, LP-type events, HB-type events, and TR-type events (table 4). Maximum sulfur dioxide values were measured weekly and ranged from 259-5,854 tons per day (t/d) during November 2022 through April 2023. White gas-and-steam emissions were also occasionally reported.
SGC issued a report on 25 October that noted a significant increase in the number of earthquakes associated with rock fracturing. These earthquakes were located SE of the crater between Puracé and Piocollo at depths of 1-4 km. There were no reported variations in sulfur dioxide values, but SGC noted high carbon dioxide values, compared to those recorded in the first half of 2023.
SGC reported that at 1929 on 16 November the seismic network detected a signal that was possibly associated with a gas-and-ash emission, though it was not confirmed in webcam images due to limited visibility. On 17 November an observer confirmed ash deposits on the N flank. Webcam images showed an increase in degassing both inside the crater and from the NW flank, rising 700 m above the crater.
Table 4. Seismicity at Puracé during November 2022-November 2023. Volcano-tectonic (VT), long-period (LP), hybrid (HB), and tremor (TR) events are reported each month. Courtesy of SGC.
| Month |
Volcano-tectonic |
Long-period |
Hybrid |
Tremor |
| Nov 2022 |
429 |
2,023 |
5 |
831 |
| Dec 2022 |
423 |
1,390 |
9 |
834 |
| Jan 2023 |
719 |
1,622 |
0 |
957 |
| Feb 2023 |
598 |
1,701 |
2 |
1,124 |
| Mar 2023 |
331 |
2,408 |
147 |
607 |
| Apr 2023 |
614 |
4,427 |
33 |
148 |
| May 2023 |
620 |
3,717 |
170 |
109 |
| Jun 2023 |
467 |
3,293 |
86 |
148 |
| Jul 2023 |
1,116 |
5,809 |
183 |
542 |
| Aug 2023 |
692 |
2,927 |
94 |
321 |
| Sep 2023 |
887 |
1,505 |
82 |
848 |
| Oct 2023 |
2,373 |
2,949 |
135 |
692 |
| Nov 2023 |
1,212 |
2,302 |
69 |
293 |
Geologic Background. Puracé is an active andesitic volcano with a 600-m-diameter summit crater at the NW end of the Los Coconucos Volcanic Chain. This volcanic complex includes nine composite and five monogenetic volcanoes, extending from the Puracé crater more than 6 km SE to the summit of Pan de Azúcar stratovolcano. The dacitic massif which the complex is built on extends about 13 km NW-SE and 10 km NE-SW. Frequent small to moderate explosive eruptions reported since 1816 CE have modified the morphology of the summit crater, with the largest eruptions in 1849, 1869, and 1885.
Information Contacts: Servicio Geologico Colombiano (SGC), Diagonal 53 No. 34-53 - Bogotá D.C., Colombia (URL: https://www.sgc.gov.co/volcanes).
Etna
Italy
37.748°N, 14.999°E; summit elev. 3357 m
All times are local (unless otherwise noted)
Strombolian explosions, lava fountains, and lava flows during July-August 2023
Etna, located on the Italian island of Sicily, has had documented eruptions dating back to 1500 BCE. Activity typically originates from multiple cones at the summit, where several craters have formed and evolved. The currently active craters are Northeast Crater (NEC), Voragine (VOR), and Bocca Nuova (BN), and the Southeast Crater (SEC); VOR and BN were previously referred to as the “Central Crater”. The original Southeast crater formed in 1978, and a second eruptive site that opened on its SE flank in 2011 was named the New Southeast Crater (NSEC). Another eruptive site between the SEC and NSEC developed during early 2017 and was referred to as the "cono della sella" (saddle cone). The current eruption period began in November 2022 and has been characterized by intermittent Strombolian activity, lava flows, and ash plumes (BGVN 48:08). This report updates activity during July through October 2023, which includes primarily gas-and-steam emissions; during July and August Strombolian explosions, lava fountains, and lava flows were reported, based on weekly and special reports by the Osservatorio Etneo (OE), part of the Catania Branch of Italy's Istituo Nazionale di Geofisica e Vulcanologica (INGV) and satellite data.
Variable fumarolic degassing was reported at all summit craters (BN, VOR, NEC, and SEC) throughout the entire reporting period (table 15). The MIROVA (Middle InfraRed Observation of Volcanic Activity) volcano hotspot detection system based on the analysis of MODIS data showed frequent low-to-moderate power thermal anomalies during the reporting period (figure 399). During mid-August there was a pulse in activity that showed an increase in the power of the anomalies due to Strombolian activity, lava fountains, and lava flows. Infrared satellite imagery captured strong thermal anomalies at the central and southeast summit crater areas (figure 400). Accompanying thermal activity were occasional sulfur dioxide plumes that exceeded 2 Dobson Units (DUs) recorded by the TROPOMI instrument on the Sentinel-5P satellite (figure 401).
Table 15. Summary of activity at the four primary crater areas at the summit of Etna during July-October 2023. Information is from INGV weekly reports.
| Month |
Bocca Nuova (BN) |
Voragine (VOR) |
Northeast Crater (NEC) |
Southeast Crater (SEC) |
| Jul 2023 |
Continuous degassing. |
No observations. |
Weak gas emissions. |
Continuous degassing. Sporadic and weak-to-moderate ash emissions. Strombolian explosions. |
| Aug 2023 |
Continuous degassing. |
No observations. |
No observations. |
Continuous degassing. Occasional ash emissions. Strombolian activity, lava fountaining, and lava flows. |
| Sep 2023 |
Variable degassing. Crater incandescence. |
Weak fumarolic activity. |
Weak fumarolic activity. |
Variable degassing. |
| Oct 2023 |
Continuous degassing. |
Weak fumarolic activity. |
Weak fumarolic activity. |
Continuous degassing. |
Activity during July and August was relatively low and mainly consisted of degassing at the summit craters, particularly at SEC and BN. Cloudy weather prevented clear views of the summit during early July. During the night of 2 July some crater incandescence was visible at SEC. Explosive activity resumed at SEC during 9-10 July, which was characterized by sporadic and weak ash emissions that rapidly dispersed in the summit area (figure 402). INGV reported moderate Strombolian activity began at 2034 on 14 July and was confined to the inside of the crater and fed by a vent located in the E part of SEC. An ash emission was detected at 2037. A new vent opened on 15 July in the SE part of BN and began to produce continuous gas-and-steam emissions. During an inspection carried out on 28 July pulsating degassing, along with audible booms, were reported at two active vents in BN. Vigorous gas-and-steam emissions intermittently generated rings. On rare occasions, fine, reddish ash was emitted from BN1 and resuspended by the gas-and-steam emissions.
Around 2000 on 13 August INGV reported a sudden increase in volcanic tremor amplitude. Significant infrasonic activity coincided with the tremor increase. Incandescent flashes were visible through the cloud cover in webcam images of SEC (figure 403). Strombolian activity at SEC began to gradually intensify starting at 2040 as seismicity continued to increase. The Aviation Color Code (ACC) was raised to Yellow (the second lowest-level on a four-color scale) at 2126 and then to Orange (the second highest-level on a four-color scale) at 2129 due to above-background activity. The activity rapidly transitioned from Strombolian activity to lava fountains around 2333 that rose 300-400 m above the crater (figure 403). Activity was initially focused on the E vent of the crater, but then the vent located above the S flank of the cone also became active. A lava flow from this vent traveled SW into the drainage created on 10 February 2022, overlapping with previous flows from 10 and 21 February 2022 and 21 May 2023, moving between Monte Barbagallo and Monte Frumento Supino (figure 404). The lava flow was 350 m long, oriented NNE-SSW, and descended to an elevation of 2.8 km. Flows covered an area of 300,000 m2 and had an estimated volume of 900,000 m3. The ACC was raised to Red at 2241 based on strong explosive activity and ashfall in Rifugio Sapienza-Piano Vetore at 1.7 km elevation on the S flank. INGV reported that pyroclastic flows accompanied this activity.
Activity peaked between 0240 and 0330 on 14 August, when roughly 5-6 vents erupted lava fountains from the E to SW flank of SEC. The easternmost vents produced lava fountains that ejected material strongly to the E, which caused heavy fallout of incandescent pyroclastic material on the underlying flank, triggering small pyroclastic flows. This event was also accompanied by lightning both in the ash column and in the ash clouds that were generated by the pyroclastic flows. A fracture characterized by a series of collapse craters (pit craters) opened on the upper SW flank of SEC. An ash cloud rose a few kilometers above the crater and drifted S, causing ash and lapilli falls in Rifugio Sapienza and expanding toward Nicolosi, Mascalucia, Catania, and up to Syracuse. Ashfall resulted in operational problems at the Catania airport (50 km S), which lasted from 0238 until 2000. By 0420 the volcanic tremor amplitude values declined to background levels. After 0500 activity sharply decreased, although the ash cloud remained for several hours and drifted S. By late morning, activity had completely stopped. The ACC was lowered to Orange as volcanic ash was confined to the summit area. Sporadic, minor ash emissions continued throughout the day. At 1415 the ACC was lowered to Yellow and then to Green at 1417.
During the night of 14-15 August only occasional flashes were observed, which were more intense during avalanches of material inside the eruptive vents. Small explosions were detected at SEC at 2346 on 14 August and at 0900 on 26 August that each produced ash clouds which rapidly dispersed into the atmosphere (figure 405). According to a webcam image, an explosive event detected at 2344 at SEC generated a modest ash cloud that was rapidly dispersed by winds. The ACC was raised to Yellow at 2355 on 14 August due to increasing unrest and was lowered to Green at 0954 on 15 August.
Activity during September and October was relatively low and mainly characterized by variable degassing from BN and SEC. Intense, continuous, and pulsating degassing was accompanied by roaring sounds and flashes of incandescence at BN both from BN1 and the new pit crater that formed during late July (figure 406). The degassing from the new pit crater sometimes emitted vapor rings. Cloudy weather during 6-8 September prevented observations of the summit craters .
Geologic Background. Mount Etna, towering above Catania on the island of Sicily, has one of the world's longest documented records of volcanism, dating back to 1500 BCE. Historical lava flows of basaltic composition cover much of the surface of this massive volcano, whose edifice is the highest and most voluminous in Italy. The Mongibello stratovolcano, truncated by several small calderas, was constructed during the late Pleistocene and Holocene over an older shield volcano. The most prominent morphological feature of Etna is the Valle del Bove, a 5 x 10 km caldera open to the east. Two styles of eruptive activity typically occur, sometimes simultaneously. Persistent explosive eruptions, sometimes with minor lava emissions, take place from one or more summit craters. Flank vents, typically with higher effusion rates, are less frequently active and originate from fissures that open progressively downward from near the summit (usually accompanied by Strombolian eruptions at the upper end). Cinder cones are commonly constructed over the vents of lower-flank lava flows. Lava flows extend to the foot of the volcano on all sides and have reached the sea over a broad area on the SE flank.
Information Contacts: Sezione di Catania - Osservatorio Etneo, Istituto Nazionale di Geofisica e Vulcanologia (INGV), Sezione di Catania, Piazza Roma 2, 95123 Catania, Italy (URL: http://www.ct.ingv.it/it/); MIROVA (Middle InfraRed Observation of Volcanic Activity), a collaborative project between the Universities of Turin and Florence (Italy) supported by the Centre for Volcanic Risk of the Italian Civil Protection Department (URL: http://www.mirovaweb.it/); NASA Global Sulfur Dioxide Monitoring Page, Atmospheric Chemistry and Dynamics Laboratory, NASA Goddard Space Flight Center (NASA/GSFC), 8800 Greenbelt Road, Goddard MD 20771, USA (URL: https://so2.gsfc.nasa.gov/); Copernicus Browser, Copernicus Data Space Ecosystem, European Space Agency (URL: https://dataspace.copernicus.eu/browser/).
Suwanosejima (Japan) — December 2023 Cite this Report
Suwanosejima
Japan
29.638°N, 129.714°E; summit elev. 796 m
All times are local (unless otherwise noted)
Eruption plumes, crater incandescence, and occasional explosions during July-October 2023
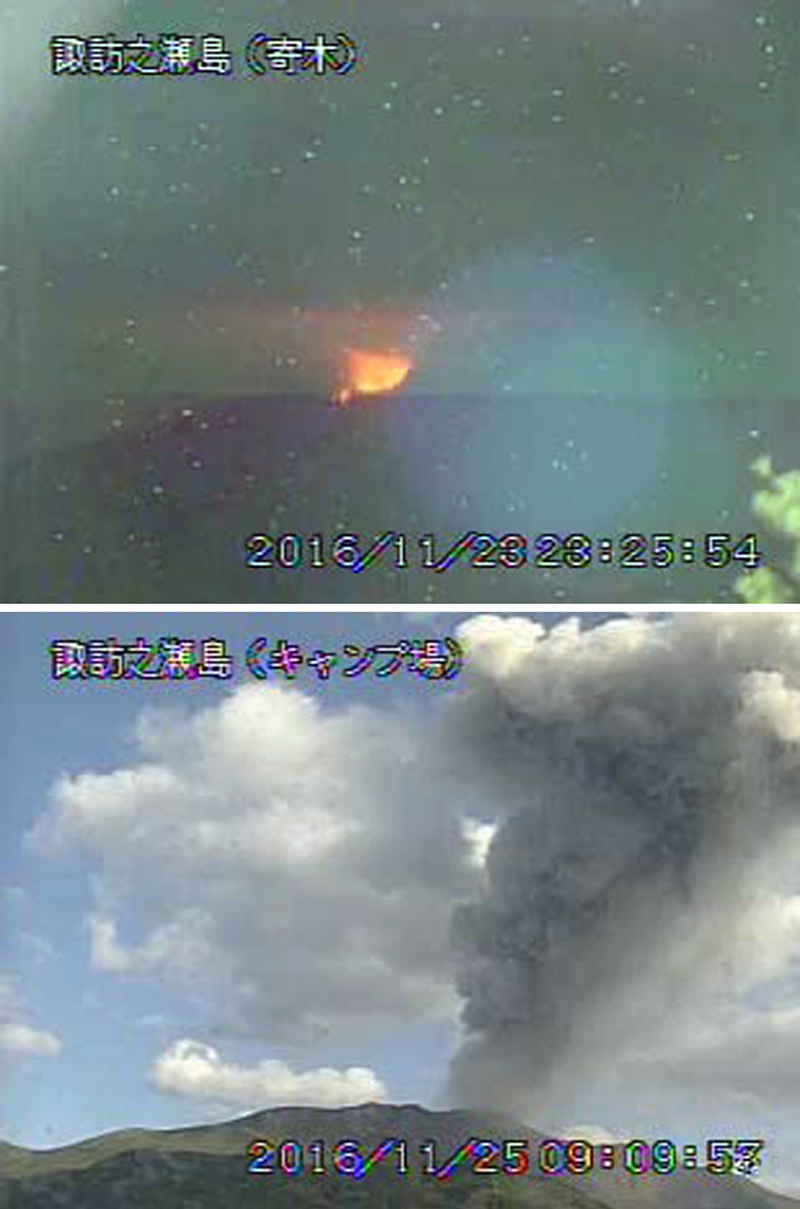
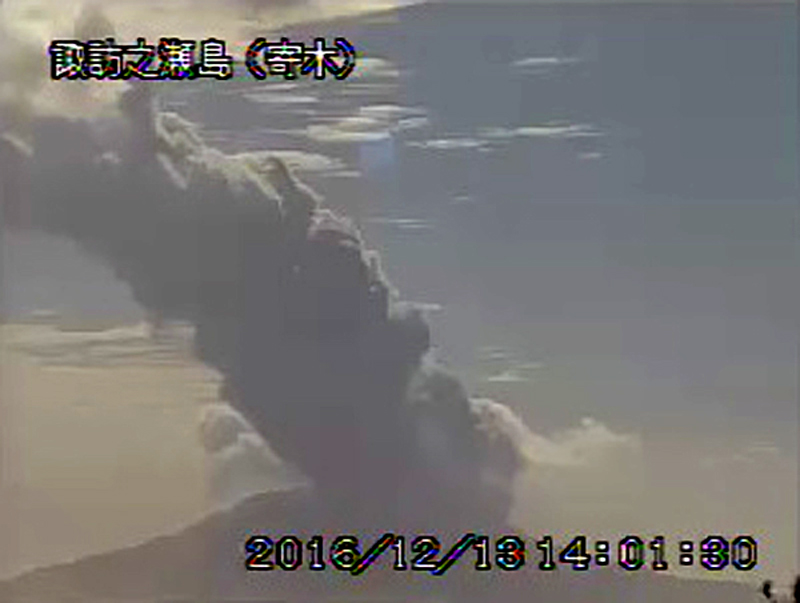
Suwanosejima is an 8-km-long island that consists of a stratovolcano and two active summit craters, located in the northern Ryukyu Islands, Japan. Volcanism over the past century has been characterized by Strombolian explosions, ash plumes, and ashfall. The current eruption began in October 2004 and has more recently consisted of frequent eruption plumes, explosions, and incandescent ejecta (BGVN 48:07). This report covers similar activity of ash plumes, explosions, and crater incandescence during July through October 2023 using monthly reports from the Japan Meteorological Agency (JMA) and satellite data.
Thermal activity during the reporting period was relatively low; only one low-power thermal anomaly was detected during mid-July and one during early August, based on a MIROVA (Middle InfraRed Observation of Volcanic Activity) Log Radiative Power graph of the MODIS thermal anomaly data. On two clear weather days, a thermal anomaly was visible in infrared satellite images (figure 81).
Low-level activity was reported at the Otake crater during July and no explosions were detected. Eruption plumes rose as high as 1.8 km above the crater. On 13 July an ash plume rose 1.7 km above the crater rim, based on a webcam image. During the night of the 28th crater incandescence was visible in a webcam image. An eruptive event reported on 31 July produced an eruption plume that rose 2.1 km above the crater. Seismicity consisted of 11 volcanic earthquakes on the W flank, the number of which had decreased compared to June (28) and 68 volcanic earthquakes near the Otake crater, which had decreased from 722 in the previous month. According to observations conducted by the University of Tokyo Graduate School of Science, Kyoto University Disaster Prevention Research Institute, Toshima Village, and JMA, the amount of sulfur dioxide emissions released during the month was 400-800 tons per day (t/d).
Eruptive activity in the Otake crater continued during August and no explosions were reported. An eruptive event produced a plume that rose 1 km above the crater at 1447 on 12 August. Subsequent eruptive events were recorded at 0911 on 16 August, at 1303 on 20 August, and at 0317 on 21 August, which produced ash plumes that rose 1-1.1 km above the crater and drifted SE, SW, and W. On 22 August an ash plume was captured in a webcam image rising 1.4 km above the crater (figure 82). Multiple eruptive events were detected on 25 August at 0544, 0742, 0824, 1424, and 1704, which generated ash plumes that rose 1.1-1.2 km above the crater and drifted NE, W, and SW. On 28 August a small amount of ashfall was observed as far as 1.5 km from the crater. There were 17 volcanic earthquakes recorded on the W flank of the volcano and 79 recorded at the Otake crater during the month. The amount of sulfur dioxide emissions released during the month was 400-800 t/d.
Activity continued at the Otake crater during September. Occasionally, nighttime crater incandescence was observed in webcam images and ashfall was reported. An eruptive event at 1949 on 4 September produced an ash plume that rose 1 km above the crater and drifted SW. On 9 September several eruption events were detected at 0221, 0301, and 0333, which produced ash plumes that rose 1.1-1.4 km above the crater rim and drifted W; continuous ash emissions during 0404-0740 rose to a maximum height of 2 km above the crater rim (figure 83). More eruptive events were reported at 1437 on 10 September, at 0319 on 11 September, and at 0511 and 1228 on 15 September, which generated ash plumes that rose 1-1.8 km above the crater. During 25, 27, and 30 September, ash plumes rose as high as 1.3 km above the crater rim. JMA reported that large blocks were ejected as far as 300 m from the center of the crater. There were 18 volcanic earthquakes detected beneath the W flank and 82 volcanic earthquakes detected near the Otake crater. The amount of sulfur dioxide released during the month ranged from 600 to 1,600 t/d.
Activity during early-to-mid-October consisted of occasional explosions, a total number of 13, and ash plumes that rose as high as 1.9 km above the Otake crater rim on 29 October (figure 84). These explosions are the first to have occurred since June 2023. Continuous ash emissions were reported during 0510-0555 on 1 October. Explosions were recorded at 0304, 2141, and 2359 on 2 October, at 0112 on 3 October, and at 1326 on 6 October, which produced ash plumes that rose as high as 1 km above the crater rim and drifted SW and W. An explosion was noted at 0428 on 3 October, but emission details were unknown. A total of eight explosions were recorded by the seismic network at 1522 on 14 October, at 0337, 0433, 0555, 1008, and 1539 on 15 October, and at 0454 and 0517 on 16 October. Ash plumes from these explosions rose as high as 900 m above the crater and drifted SE. Eruptive events during 25-27 and 29-30 October generated plumes that rose as high as 1.9 km above the crater and drifted SE, S, and SW. Ash was deposited in Toshima village (3.5 km SSW). Eruptive activity occasionally ejected large volcanic blocks as far as 600 m from the crater. Nighttime crater incandescence was visible in webcams. Intermittent ashfall was reported as far as 1.5 km from the crater. There were 43 volcanic earthquakes detected on the W flank during the month, and 184 volcanic earthquakes detected near the Otake crater. The amount of sulfur dioxide emitted ranged between 400 and 900 t/d.
Geologic Background. The 8-km-long island of Suwanosejima in the northern Ryukyu Islands consists of an andesitic stratovolcano with two active summit craters. The summit is truncated by a large breached crater extending to the sea on the E flank that was formed by edifice collapse. One of Japan's most frequently active volcanoes, it was in a state of intermittent Strombolian activity from Otake, the NE summit crater, between 1949 and 1996, after which periods of inactivity lengthened. The largest recorded eruption took place in 1813-14, when thick scoria deposits covered residential areas, and the SW crater produced two lava flows that reached the western coast. At the end of the eruption the summit of Otake collapsed, forming a large debris avalanche and creating an open collapse scarp extending to the eastern coast. The island remained uninhabited for about 70 years after the 1813-1814 eruption. Lava flows reached the eastern coast of the island in 1884. Only about 50 people live on the island.
Information Contacts: Japan Meteorological Agency (JMA), 1-3-4 Otemachi, Chiyoda-ku, Tokyo 100-8122, Japan (URL: http://www.jma.go.jp/jma/indexe.html); MIROVA (Middle InfraRed Observation of Volcanic Activity), a collaborative project between the Universities of Turin and Florence (Italy) supported by the Centre for Volcanic Risk of the Italian Civil Protection Department (URL: http://www.mirovaweb.it/); Hawai'i Institute of Geophysics and Planetology (HIGP) - MODVOLC Thermal Alerts System, School of Ocean and Earth Science and Technology (SOEST), Univ. of Hawai'i, 2525 Correa Road, Honolulu, HI 96822, USA (URL: http://modis.higp.hawaii.edu/); Copernicus Browser, Copernicus Data Space Ecosystem, European Space Agency (URL: https://dataspace.copernicus.eu/browser/).
Aira
Japan
31.5772°N, 130.6589°E; summit elev. 1117 m
All times are local (unless otherwise noted)
Explosions, ash plumes, ash fall, and crater incandescence during July-October 2023
Aira caldera, located in the northern half of Kagoshima Bay, Japan, contains the post-caldera Sakurajima volcano. Eruptions typically originate from the Minamidake crater, and since the 8th century, ash deposits have been recorded in the city of Kagoshima (10 km W), one of Kyushu’s largest cities. The Minamidake summit cone and crater has had persistent activity since 1955; the Showa crater on the E flank has also been intermittently active since 2006. The current eruption period began during March 2017 and has recently been characterized by intermittent explosions, eruption plumes, and ashfall (BGVN 48:07). This report updates activity during July through October 2023 and describes explosive events, ash plumes, nighttime crater incandescence, and ashfall, according to monthly activity reports from the Japan Meteorological Agency (JMA) and satellite data.
Thermal activity remained at low levels during this reporting period, according to the MIROVA (Middle InfraRed Observation of Volcanic Activity) system (figure 149). There was a slight increase in the number of anomalies during September through October. Occasional thermal anomalies were visible in infrared satellite images mainly at the Minamidake crater (Vent A is located to the left and Vent B is located to the right) (figure 150).
Table 30. Number of monthly explosive events, days of ashfall, area of ash covered, and sulfur dioxide emissions from Sakurajima’s Minamidake crater at Aira during July-October 2023. Note that smaller ash events are not listed. Ashfall days were measured at Kagoshima Local Meteorological Observatory and ashfall amounts represent material covering all the Kagoshima Prefecture. Data courtesy of JMA monthly reports.
| Month |
Explosive events |
Days of ashfall |
Ashfall amount (g/m2) |
SO2 emissions (tons/day) |
| Jul 2023 |
3 |
0 |
0 |
1,600-3,200 |
| Aug 2023 |
3 |
10 |
7 |
1,800-3,300 |
| Sep 2023 |
3 |
7 |
3 |
1,600-2,300 |
| Oct 2023 |
33 |
8 |
61 |
2,200-4,200 |
JMA reported that during July, there were eight eruptions, three of which were explosion events in the Showa crater. Large blocks were ejected as far as 600 m from the Showa crater. Very small eruptions were occasionally reported at the Minamidake crater. Nighttime incandescence was observed in both the Showa and Minamidake crater. Explosions were reported on 16 July at 2314 and on 17 July at 1224 and at 1232 (figure 151). Resulting eruption plumes rose 700-2,500 m above the crater and drifted N. On 23 July the number of volcanic earthquakes on the SW flank of the volcano increased. A strong Mw 3.1 volcanic earthquake was detected at 1054 on 26 July. The number of earthquakes recorded throughout the month was 545, which markedly increased from 73 in June. No ashfall was observed at the Kagoshima Regional Meteorological Observatory during July. According to a field survey conducted during the month, the daily amount of sulfur dioxide emissions was 1,600-3,200 tons per day (t/d).
There were three eruptions reported at the Minamidake crater during August, each of which were explosive. The explosions occurred on 9 August at 0345, on 13 August at 2205, and on 31 August at 0640, which generated ash plumes that rose 800-2,000 m above the crater and drifted W. There were two eruptions detected at Showa crater; on 4 August at 2150 ejecta traveled 800 m from the Showa crater and associated eruption plumes rose 2.3 km above the crater. The explosion at 2205 on 13 August generated an ash plume that rose 2 km above the crater and was accompanied by large blocks that were ejected 600 m from the Minamidake crater (figure 152). Nighttime crater incandescence was visible in a high-sensitivity surveillance camera at both craters. Seismicity consisted of 163 volcanic earthquakes, 84 of which were detected on the SW flank. According to the Kagoshima Regional Meteorological Observatory there was a total of 7 g/m2 of ashfall over the course of 10 days during the month. According to a field survey, the daily amount of sulfur dioxide emitted was 1,800-3,300 t/d.
During September, four eruptions were reported, three of which were explosion events. These events occurred at 1512 on 9 September, at 0018 on 11 September, and at 2211 on 13 September. Resulting ash plumes generally rose 800-1,100 m above the crater. An explosion produced an ash plume at 2211 on 13 September that rose as high as 1.7 km above the crater. Large volcanic blocks were ejected 600 m from the Minamidake crater. Smaller eruptions were occasionally observed at the Showa crater. Nighttime crater incandescence was visible at the Minamidake crater. Seismicity was characterized by 68 volcanic earthquakes, 28 of which were detected beneath the SW flank. According to the Kagoshima Regional Meteorological Observatory there was a total of 3 g/m2 of ashfall over the course of seven days during the month. A field survey reported that the daily amount of sulfur dioxide emitted was 1,600-2,300 t/d.
Eruptive activity during October consisted of 69 eruptions, 33 of which were described as explosive. These explosions occurred during 4 and 11-21 October and generated ash plumes that rose 500-3,600 m above the crater and drifted S, E, SE, and N. On 19 October at 1648 an explosion generated an ash plume that rose 3.6 km above the crater (figure 153). No eruptions were reported in the Showa crater; white gas-and-steam emissions rose 100 m above the crater from a vent on the N flank. Nighttime incandescence was observed at the Minamidake crater. On 24 October an eruption was reported from 0346 through 0430, which included an ash plume that rose 3.4 km above the crater. Ejected blocks traveled 1.2 km from the Minamidake crater. Following this eruption, small amounts of ashfall were observed from Arimura (4.5 km SE) and a varying amount in Kurokami (4 km E) (figure 154). The number of recorded volcanic earthquakes during the month was 190, of which 14 were located beneath the SW flank. Approximately 61 g/m2 of ashfall was reported over eight days of the month. According to a field survey, the daily amount of sulfur dioxide emitted was 2,200-4,200 t/d.
Geologic Background. The Aira caldera in the northern half of Kagoshima Bay contains the post-caldera Sakurajima volcano, one of Japan's most active. Eruption of the voluminous Ito pyroclastic flow accompanied formation of the 17 x 23 km caldera about 22,000 years ago. The smaller Wakamiko caldera was formed during the early Holocene in the NE corner of the caldera, along with several post-caldera cones. The construction of Sakurajima began about 13,000 years ago on the southern rim and built an island that was joined to the Osumi Peninsula during the major explosive and effusive eruption of 1914. Activity at the Kitadake summit cone ended about 4,850 years ago, after which eruptions took place at Minamidake. Frequent eruptions since the 8th century have deposited ash on the city of Kagoshima, located across Kagoshima Bay only 8 km from the summit. The largest recorded eruption took place during 1471-76.
Information Contacts: Japan Meteorological Agency (JMA), 1-3-4 Otemachi, Chiyoda-ku, Tokyo 100-8122, Japan (URL: http://www.jma.go.jp/jma/indexe.html); MIROVA (Middle InfraRed Observation of Volcanic Activity), a collaborative project between the Universities of Turin and Florence (Italy) supported by the Centre for Volcanic Risk of the Italian Civil Protection Department (URL: http://www.mirovaweb.it/); Copernicus Browser, Copernicus Data Space Ecosystem, European Space Agency (URL: https://dataspace.copernicus.eu/browser/).
Nishinoshima (Japan) — November 2023 Cite this Report
Nishinoshima
Japan
27.247°N, 140.874°E; summit elev. 100 m
All times are local (unless otherwise noted)
Gray emissions during October 2023
Nishinoshima is a small island in the Ogasawara Arc, about 1,000 km S of Tokyo, Japan. It contains prominent submarine peaks to the S, W, and NE. Recorded eruptions date back to 1973, with the current eruption period beginning in October 2022. Eruption plumes and fumarolic activity characterize recent activity (BGVN 48:10). This report covers the end of the eruption for September through October 2023, based on information from monthly reports of the Japan Meteorological Agency (JMA) monthly reports, and satellite data.
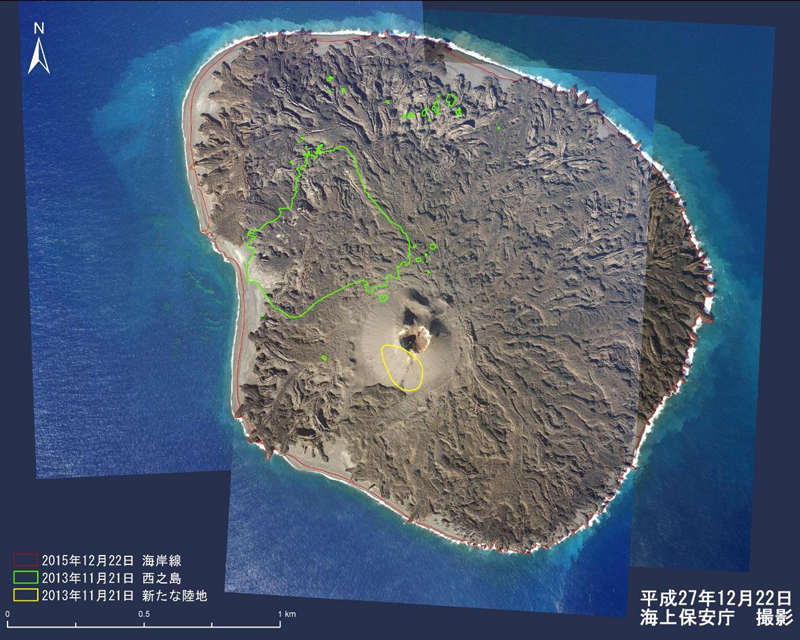
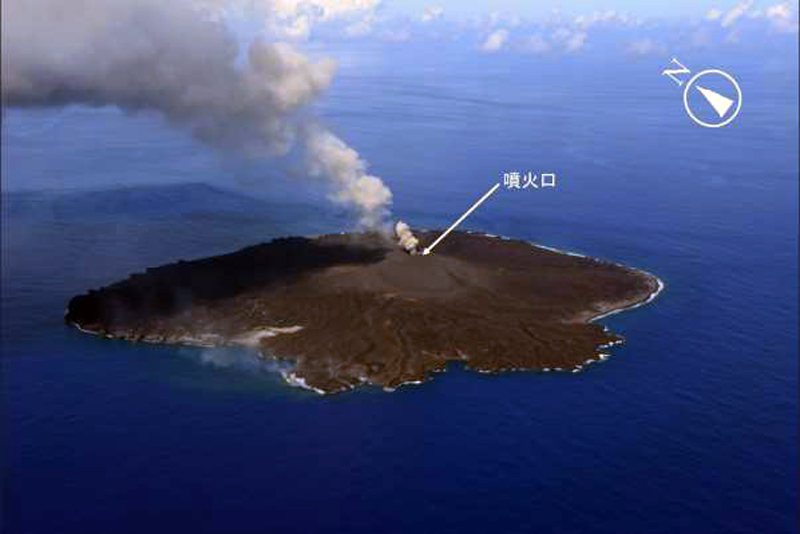
No eruptive activity was reported during September 2023, although JMA noted that the surface temperature was slightly elevated compared to the surrounding area since early March 2023. The Japan Coast Guard (JCG) conducted an overflight on 20 September and reported white gas-and-steam plumes rising 3 km above the central crater of the pyroclastic cone, as well as multiple white gas-and-steam emissions emanating from the N, E, and S flanks of the crater to the coastline. In addition, dark reddish brown-to-green discolored water was distributed around almost the entire circumference of the island.
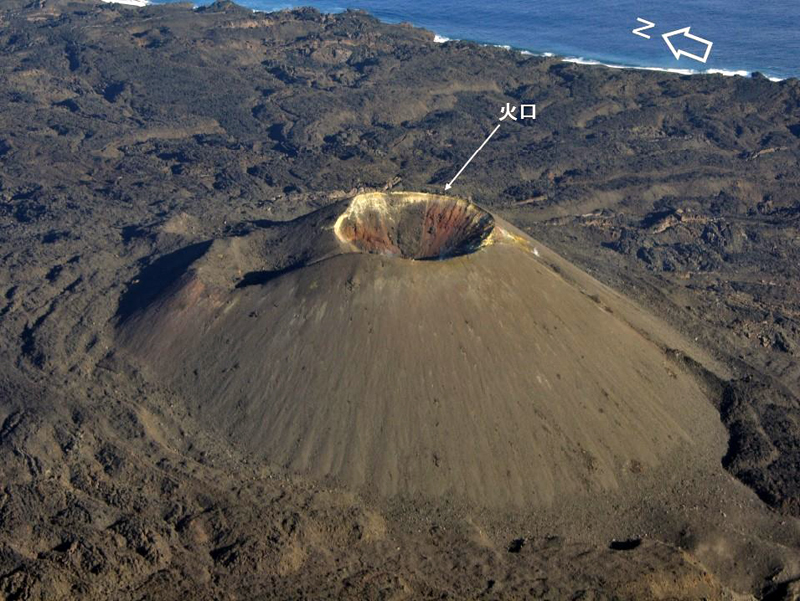
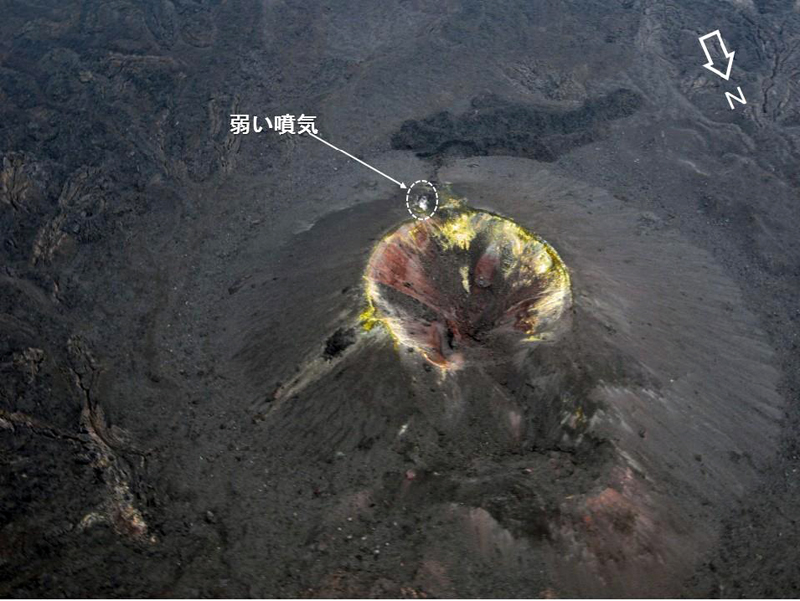
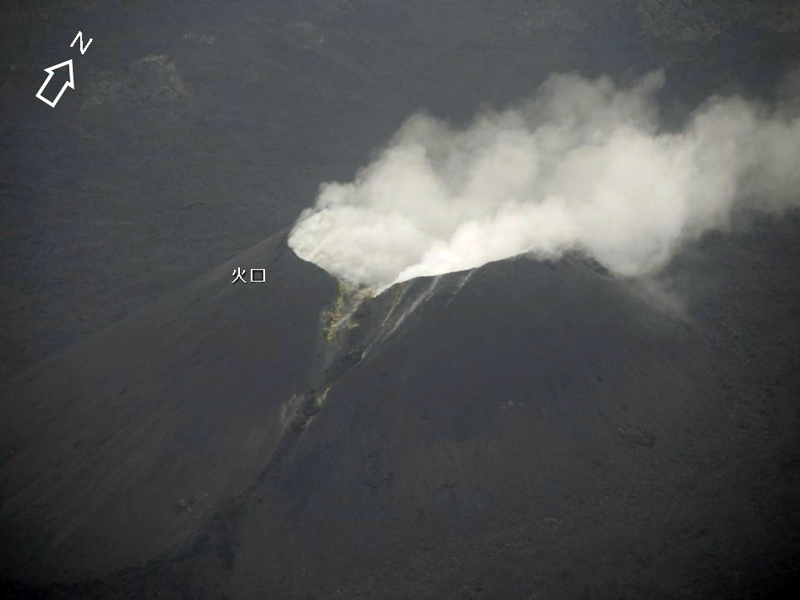
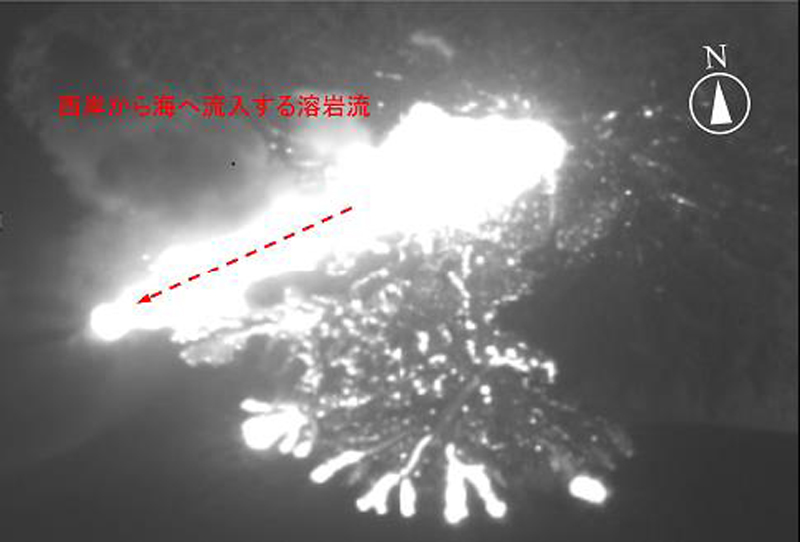
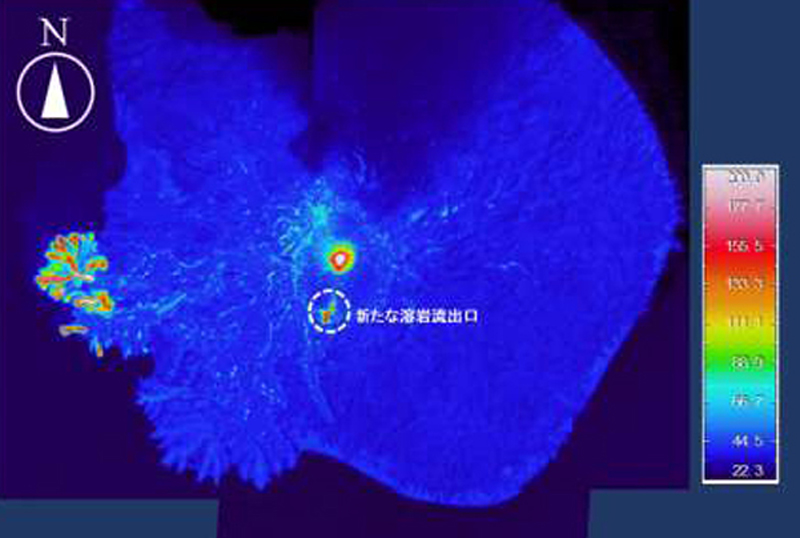
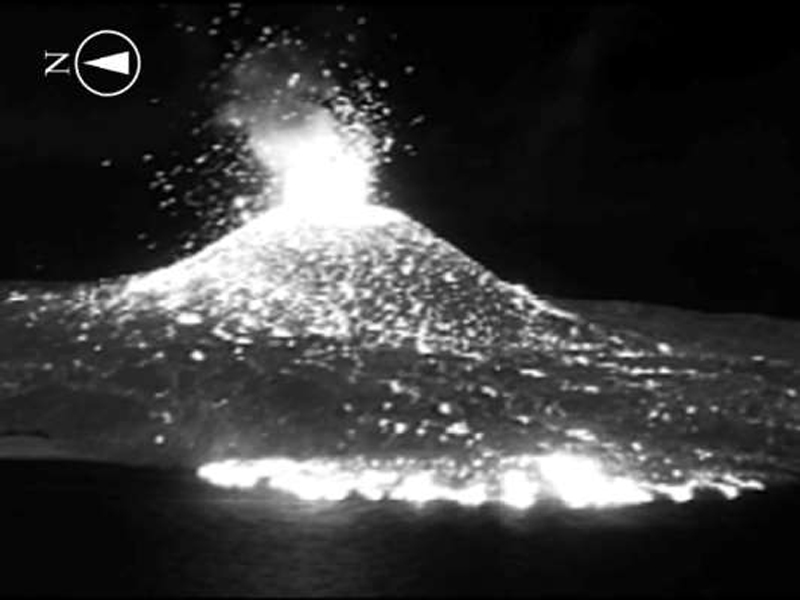
Similar low-level activity was reported during October. Multiple white gas-and-steam emissions rose from the N, E, and S flanks of the central crater of the pyroclastic cone and along the coastline; these emissions were more intense compared to the previous overflight observations. Dark reddish brown-to-green discolored water remained visible around the circumference of the island. On 4 October aerial observations by JCG showed a small eruption consisting of continuous gas-and-steam emissions emanating from the central crater, with gray emissions rising to 1.5 km altitude (figure 129). According to observations from the marine weather observation vessel Keifu Maru on 26 October, white gas-and-steam emissions persisted from the center of the pyroclastic cone, as well as from the NW, SW, and SE coasts of the island for about five minutes. Slightly discolored water was visible up to about 1 km.
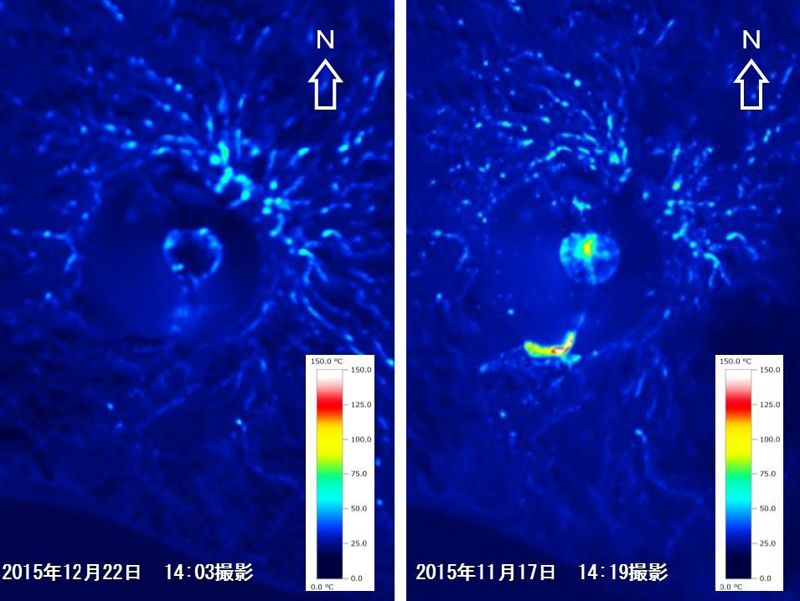
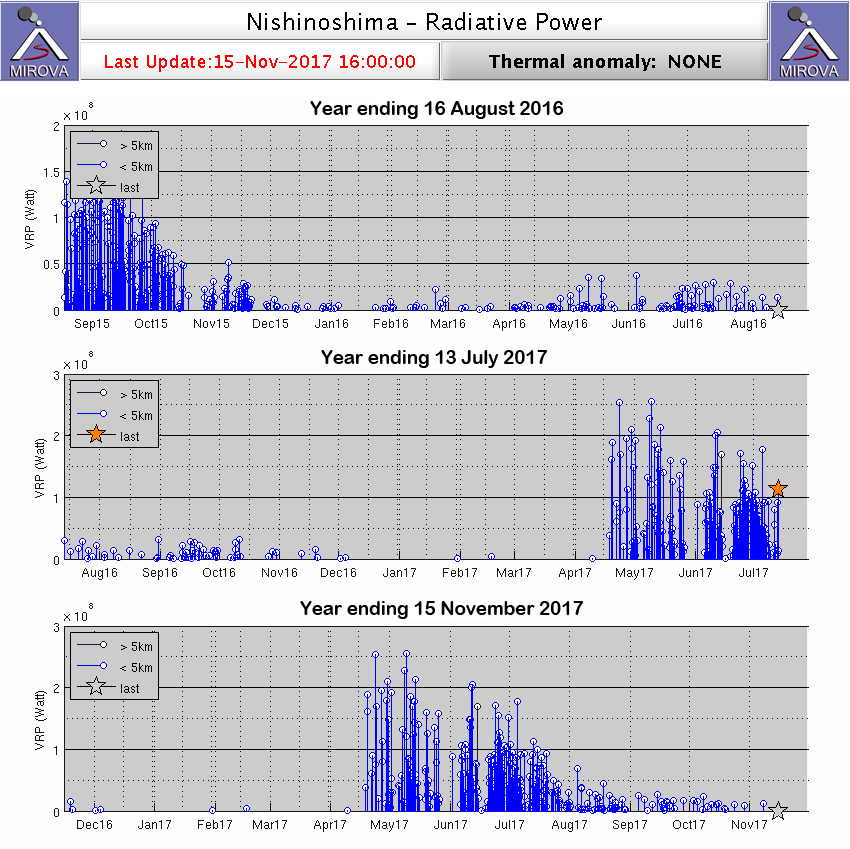
Frequent low-to-moderate power thermal anomalies were recorded in the MIROVA graph (Middle InfraRed Observation of Volcanic Activity) during September (figure 130). Occasional anomalies were detected during October, and fewer during November through December. A thermal anomaly was visible in the crater using infrared satellite imagery on 6, 8, 11, 16, 18, 21, and 23 September and 8, 13, 21, 26, and 28 October (figure 131).
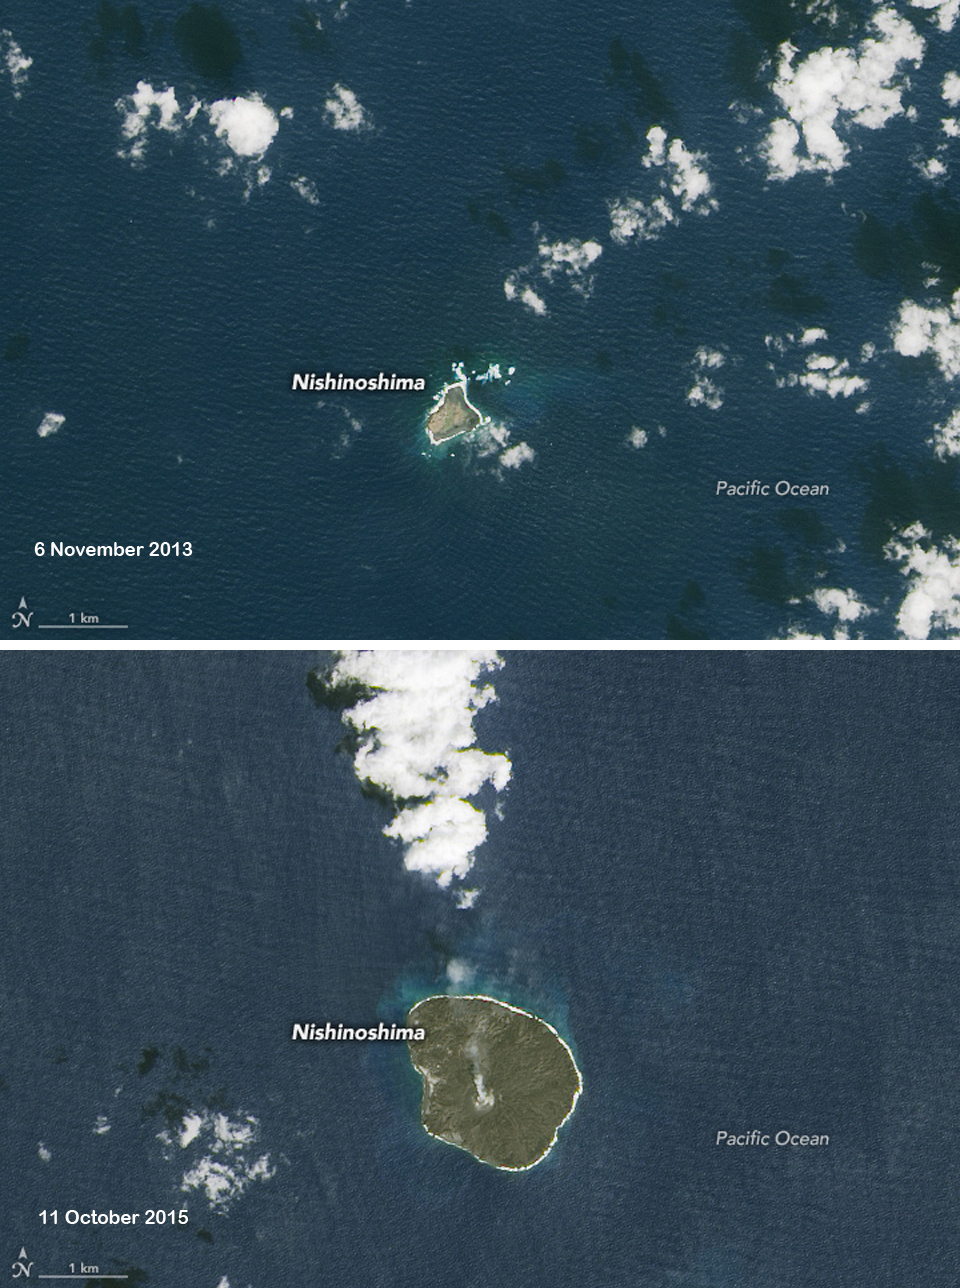
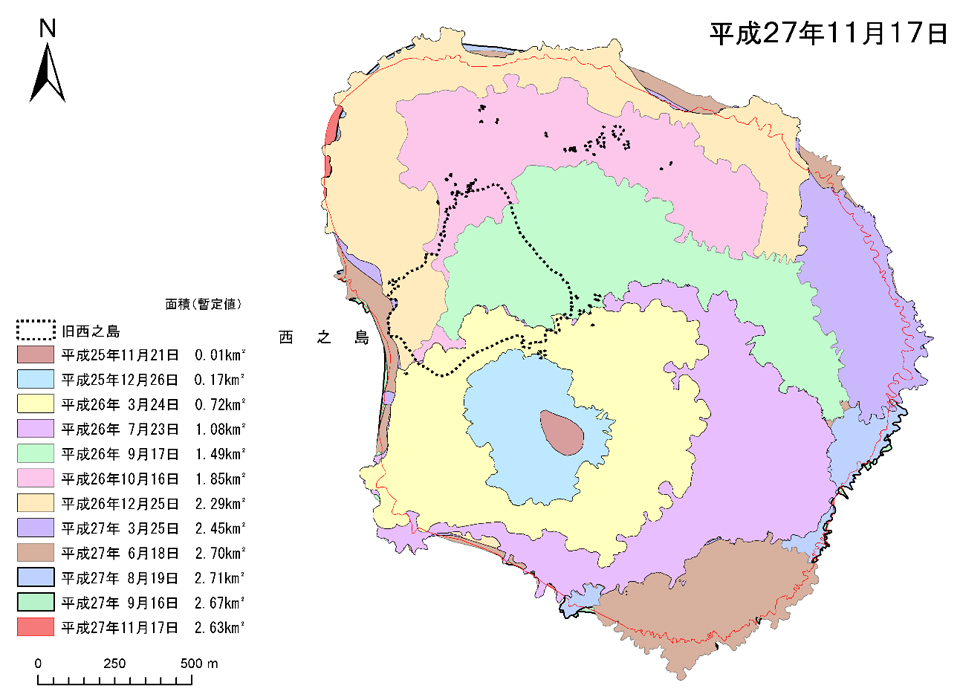
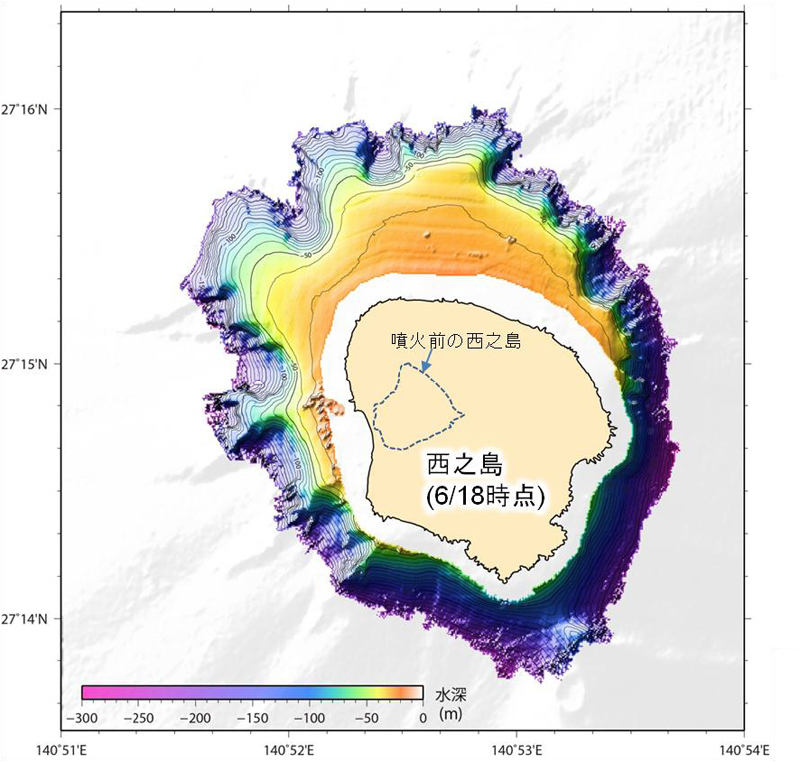
Geologic Background. The small island of Nishinoshima was enlarged when several new islands coalesced during an eruption in 1973-74. Multiple eruptions that began in 2013 completely covered the previous exposed surface and continued to enlarge the island. The island is the summit of a massive submarine volcano that has prominent peaks to the S, W, and NE. The summit of the southern cone rises to within 214 m of the ocean surface 9 km SSE.
Information Contacts: Japan Meteorological Agency (JMA), 1-3-4 Otemachi, Chiyoda-ku, Tokyo 100-8122, Japan (URL: http://www.jma.go.jp/jma/indexe.html); MIROVA (Middle InfraRed Observation of Volcanic Activity), a collaborative project between the Universities of Turin and Florence (Italy) supported by the Centre for Volcanic Risk of the Italian Civil Protection Department (URL: http://www.mirovaweb.it/); Copernicus Browser, Copernicus Data Space Ecosystem, European Space Agency (URL: https://dataspace.copernicus.eu/browser/).
Kilauea (United States) — October 2023 Cite this Report
Kilauea
United States
19.421°N, 155.287°W; summit elev. 1222 m
All times are local (unless otherwise noted)
Strong lava fountains, lava flows, and spatter at Halema’uma’u during January-September 2023
Kīlauea is on the island of Hawai’i and overlaps the E flank of the Mauna Loa volcano. Its East Rift Zone (ERZ) has been intermittently active for at least 2,000 years. An extended eruption period began in January 1983 and was characterized by open lava lakes and lava flows from the summit caldera and the East Rift Zone. During May 2018 magma migrated into the Lower East Rift Zone (LERZ) and opened 24 fissures along a 6-km-long NE-trending fracture zone that produced lava flows traveling in multiple directions. As lava emerged from the fissures, the lava lake at Halema'uma'u drained and explosions sent ash plumes to several kilometers altitude (BGVN 43:10).
The current eruption period started during September 2021 and has been characterized by low-level lava effusions in the active Halema’uma’u lava lake (BGVN 48:01). This report covers three notable eruption periods during February, June, and September 2023 consisting of lava fountaining, lava flows, and spatter during January through September 2023 using information from daily reports, volcanic activity notices, and abundant photo, map, and video data from the US Geological Survey's (USGS) Hawaiian Volcano Observatory (HVO).
Activity during January 2023. Small earthquake swarms were recorded on 2 January 2023; increased seismicity and changes in the pattern of deformation were noted on the morning of 5 January. At around 1500 both the rate of deformation and seismicity drastically increased, which suggested magma movement toward the surface. HVO raised the Volcano Alert Level (VAL) to Watch (the second highest level on a four-level scale) and the Aviation Color Code (ACC) to Orange (the second highest color on a four-color scale) at 1520.
Multiple lava fountains and lava effusions from vents in the central eastern portion of the Halema’uma’u crater began on 5 January around 0434; activity was confined to the eastern half of the crater and within the basin of the western half of the crater, which was the focus of the eruption in 2021-2022 (figure 525). Incandescence was visible in webcam images at 1634 on 5 January, prompting HVO to raise the VAL to Warning (the highest level on a four-level scale) and the ACC to Red (the highest color on a four-color scale). Lava fountains initially rose as high as 50 m above the vent at the onset of the eruption (figure 526) but then declined to a more consistent 5-6 m height in the proceeding days. By 1930 that same day, lava had covered most of the crater floor (an area of about 1,200,000 m2) and the lava lake had a depth of 10 m. A higher-elevation island that formed during the initial phase of the December 2020 eruption remained exposed, appearing darker in images, along with a ring of older lava around the lava lake that was active prior to December 2022. Overnight during 5-6 January the lava fountains continued to rise 5 m high, and the lava effusion rate had slowed.
On 6 January at 0815 HVO lowered the VAL to Watch and the ACC to Orange due to the declining effusion rates. Sulfur dioxide emission rates ranged from 3,000-12,500 tonnes per day (t/d), the highest value of which was recorded on 6 January. Lava continued to erupt from the vents during 6-8 January, although the footprint of the active area had shrunk; a similar progression has been commonly observed during the early stages of recent eruptions at Halema’uma’u. On 9 January HVO reported one dominant lava fountain rising 6-7 m high in the E half of the crater. Lava flows built up the margins of the lake, causing the lake to be perched. On 10 January the eastern lava lake had an area of approximately 120,000 m2 that increased to 250,000 m2 by 17 January. During 13-31 January several small overflows occurred along the margins of the E lake. A smaller area of lava was active within the basin in the W half of the crater that had been the focus of activity during 2021-2022. On 19 January just after 0200 a small ooze-out was observed on the crater’s W edge.
Activity during February 2023. Activity continued in the E part of Halema’uma’u crater, as well as in a smaller basin in the W part of the 2021-2022 lava lake (figure 527). The E lava lake contained a single lava fountain and frequent overflows. HVO reported that during the morning of 1 February the large E lava lake began to cool and crust over in the center of the lake; two smaller areas of lava were observed on the N and S sides by the afternoon. The dominant lava fountain located in the S part of the lava lake paused for roughly 45 minutes at 2315 and resumed by midnight, rising 1-2 m. At 0100 on 2 February lava from the S part was effusing across the entire E lava lake area, covering the crusted over portion in the center of the lake and continuing across the majority of the previously measured 250,000 m2 by 0400. A small lava pond near the E lake produced an overflow around 0716 on 2 February. On 3 February some lava crust began to form against the N and E levees, which defined the 250,000 m2 eastern lava lake. The small S lava fountain remained active, rising 1-6 m high during 3-9 February; around 0400 on 5 February occasional bursts doubled the height of the lava fountain.
A large breakout occurred overnight during 2100 on 4 February to 0900 on 5 February on the N part of the crater floor, equal to or slightly larger in size than the E lava lake. A second, smaller lava fountain appeared in the same area of the E lava lake between 0300 and 0700 on 5 February and was temporarily active. This large breakout continued until 7 February. A small, brief breakout was reported in the S of the E lava lake around midnight on 7 February. In the W lake, as well as the smaller lava pond in the central portion of the crater floor, contained several overflows during 7-10 February and intermittent fountaining. Activity at the S small lava pond and the small S lava fountain within the E lake declined during 9-10 February. The lava pond in the central portion of the crater floor had nearly continuous, expansive flows during 10-13 February; channels from the small central lava pond seemed to flow into the larger E lake. During 13-18 February a small lava fountain was observed in the small lava pond in the central portion of the crater floor. Continuous overflows persisted during this time.
Activity in the eastern and central lakes began to decline in the late afternoon of 17 February. By 18 February HVO reported that the lava effusions had significantly declined, and that the eastern and central lakes were no longer erupting. The W lake in the basin remained active but at a greatly reduced level that continued to decline. HVO reported that this decrease in activity is attributed to notable deflationary tilt that began early on the morning of 17 February and lasted until early 19 February. By 19 February the W lake was mostly crusted over although some weak lava flows remained, which continued through 28 February. The sulfur dioxide emission rates ranged 250-2,800 t/d, the highest value of which was recorded on 6 February.
Activity during March 2023. The summit eruption at Halema’uma’u crater continued at greatly reduced levels compared to the previous two months. The E and central vents stopped effusing lava, and the W lava lake remained active with weak lava flows; the lake was mostly crusted over, although slowly circulating lava intermittently overturned the crust. By 6 March the lava lake in the W basin had stopped because the entire surface was crusted over. The only apparent surface eruptive activity during 5-6 March was minor ooze-outs of lava onto the crater floor, which had stopped by 7 March. Several hornitos on the crater floor still glowed through 12 March according to overnight webcam images, but they did not erupt any lava. A small ooze-out of lava was observed just after 1830 in the W lava lake on 8 March, which diminished overnight. The sulfur dioxide emission rate ranged from 155-321 t/d on 21 March. The VAL was lowered to Advisory, and the ACC was lowered to Yellow (the second lowest on a four-color scale) on 23 March due to a pause in the eruption since 7 March.
Activity during April-May 2023. The eruption at Halema’uma’u crater was paused; no lava effusions were visible on the crater floor. Sulfur dioxide emission rates ranged from 75-185 t/d, the highest of which was measured on 22 April. During May and June summit seismicity was elevated compared to seismicity that preceded the activity during January.
Activity during June 2023. Earthquake activity and changes in the patterns of ground deformation beneath the summit began during the evening of 6 June. The data indicated magma movement toward the surface, prompting HVO to raise the VAL to Watch and the ACC to Orange. At about 0444 on 7 June incandescence in Halema’uma’u crater was visible in webcam images, indicating that a new eruption had begun. HVO raised the VAL to Warning and the ACC to Red (the highest color on a four-color scale). Lava flowed from fissures that had opened on the crater floor. Multiple minor lava fountains were active in the central E portion of the Halema’uma’u crater, and one vent opened on the W wall of the caldera (figure 528). The eruptive vent on the SW wall of the crater continued to effuse into the lava lake in the far SW part of the crater (figure 529). The largest lava fountain consistently rose 15 m high; during the early phase of the eruption, fountain bursts rose as high as 60 m. Lava flows inundated much of the crater floor and added about 6 m depth of new lava within a few hours, covering approximately 10,000 m2. By 0800 on 7 June lava filled the crater floor to a depth of about 10 m. During 0800-0900 the sulfur dioxide emission rate was about 65,000 t/d. Residents of Pahala (30 km downwind of the summit) reported minor deposits of fine, gritty ash and Pele’s hair. A small spatter cone had formed at the vent on the SW wall by midday, and lava from the cone was flowing into the active lava lake. Fountain heights had decreased from the onset of the eruption and were 4-9 m high by 1600, with occasional higher bursts. Inflation switched to deflation and summit earthquake activity greatly diminished shortly after the eruption onset.
At 0837 on 8 June HVO lowered the VAL to Watch and the ACC to Orange because the initial high effusion rates had declined, and no infrastructure was threatened. The surface of the lava lake had dropped by about 2 m, likely due to gas loss by the morning of 8 June. The drop left a wall of cooled lava around the margins of the crater floor. Lava fountain heights decreased during 8-9 June but continued to rise to 10 m high. Active lava and vents covered much of the W half of Halema’uma’u crater in a broad, horseshoe-shape around a central, uplifted area (figure 530). The preliminary average effusion rate for the first 24 hours of the eruption was about 150 cubic meters per second, though the estimate did not account for vesiculated lava and variations in crater floor topography. The effusion rate during the very earliest phases of the eruption appeared significantly higher than the previous three summit eruptions based on the rapid coverage of the entire crater floor. An active lava lake, also referred to as the “western lava lake” was centered within the uplifted area and was fed by a vent in the NE corner. Two small active lava lakes were located just SE from the W lava lake and in the E portion of the crater floor.
During 8-9 June the lava in the central lava lake had a thickness of approximately 1.5 m, based on measurements from a laser rangefinder. During 9-12 June the height of the lava fountains decreased to 9 m high. HVO reported that the previously active lava lake in the E part of the crater appeared stagnant during 10-11 June. The surface of the W lake rose approximately 1 m overnight during 11-12 June, likely due to the construction of a levee around it. Only a few small fountains were active during 12-13 June; the extent of the active lava had retreated so that all activity was concentrated in the SW and central parts of Halema’uma’u crater. Intermittent spattering from the vent on the SW wall was visible in overnight webcam images during 13-18 June. On the morning of 14 June a weak lava effusion originated from near the western eruptive vent, but by 15 June there were no signs of continued activity. HVO reported that other eruptive vents in the SW lava lake had stopped during this time, following several days of waning activity; lava filled the lake by about 0.5 m. Lava circulation continued in the central lake and no active lava was reported in the northern or eastern parts of the crater. Around 0800 on 15 June the top of the SW wall spatter cone collapsed, which was followed by renewed and constant spattering from the top vent and a change in activity from the base vent; several new lava flows effused from the top of the cone, as well as from the pre-existing tube-fed flow from its base. Accumulation of lava on the floor resulted in a drop of the central basin relative to the crater floor, allowing several overflows from the SW lava lake to cascade into the basin during the night of 15 June into the morning of 16 June.
Renewed lava fountaining was reported at the eruptive vent on the SW side of the crater during 16-19 June, which effused lava into the far SW part of the crater. This activity was described as vigorous during midday on 16 June; a group of observatory geologists estimated that the lava was consistently ejected at least 10 m high, with some spatter ejected even higher and farther. Deposits from the fountain further heightened and widened the spatter cone built around the original eruptive vent in the lower section of the crater wall. Multiple lava flows from the base of the cone were fed into the SW lava lake and onto the southwestern-most block from the 2018 collapse within Halema’uma’u on 17 June (figure 531); by 18 June they focused into a single flow feeding into the SW lava lake. On the morning of 19 June a second lava flow from the base of the eruptive cone advanced into the SW lava lake.
Around 1600 on 19 June there was a rapid decline in lava fountaining and effusion at the eruptive vent on the SW side of the crater; vent activity had been vigorous up to that point (figure 532). Circulation in the lava lake also slowed, and the lava lake surface dropped by several meters. Overnight webcam images showed some previously eruptive lava still flowing onto the crater floor, which continued until those flows began to cool. By 21 June no lava was erupting in Halema’uma’u crater. Overnight webcam images during 29-30 June showed some incandescence from previously erupted lava flows as they continued to cool. Seismicity in the crater declined to low levels. Sulfur dioxide emission rates ranged 160-21,000 t/d throughout the month, the highest measurement of which was recorded on 8 June. On 30 June the VAL was lowered to Advisory (the second level on a four-level scale) and the ACC was lowered to Yellow. Gradual inflation was detected at summit tiltmeters during 19-30 June.
Activity during July-August 2023. During July, the eruption paused; no lava was erupting in Halema’uma’u crater. Nighttime webcam images showed some incandescence from previously erupted lava as it continued to cool on the crater floor. During the week of 14 August HVO reported that the rate in seismicity increased, with 467 earthquakes of Mw 3.2 and smaller occurring. Sulfur dioxide emission rates remained low, ranging from 75-86 t/d, the highest of which was recorded on 10 and 15 August. On 15 August beginning at 0730 and lasting for several hours, a swarm of approximately 50 earthquakes were detected at a depth of 2-3 km below the surface and about 2 km long directly S of Halema’uma’u crater. HVO reported that this was likely due to magma movement in the S caldera region. During 0130-0500 and 1700-2100 on 21 August two small earthquake swarms of approximately 20 and 25 earthquakes, respectively, occurred at the same location and at similar depths. Another swarm of 50 earthquakes were recorded during 0430-0830 on 23 August. Elevated seismicity continued in the S area through the end of the month.
Activity during September 2023. Elevated seismicity persisted in the S summit with occasional small, brief seismic swarms. Sulfur dioxide measurements were relatively low and were 70 t/d on 8 September. About 150 earthquakes occurred during 9-10 September, and tiltmeter and Global Positioning System (GPS) data showed inflation in the S portion of the crater.
At 0252 on 10 September HVO raised the VAL to Watch and the ACC to Orange due to increased earthquake activity and changes in ground deformation that indicated magma moving toward the surface. At 1515 the summit eruption resumed in the E part of the caldera based on field reports and webcam images. Fissures opened on the crater floor and produced multiple minor lava fountains and flows (figure 533). The VAL and ACC were raised to Warning and Red, respectively. Gas-and-steam plumes rose from the fissures and drifted downwind. A line of eruptive vents stretched approximately 1.4 km from the E part of the crater into the E wall of the down dropped block by 1900. The lava fountains at the onset of the eruption had an estimated 50 m height, which later rose 20-25 m high. Lava erupted from fissures on the down dropped block and expanded W toward Halema’uma’u crater. Data from a laser rangefinder recorded about 2.5 m thick of new lava added to the W part of the crater. Sulfur dioxide emissions were elevated in the eruptive area during 1600-1500 on 10 September, measuring at least 100,000 t/d.
At 0810 on 11 September HVO lowered the VAL and ACC back to Watch and Orange due to the style of eruption and the fissure location had stabilized. The initial extremely high effusion rates had declined (but remained at high levels) and no infrastructure was threatened. An eruption plume, mainly comprised of sulfur dioxide and particulates, rose as high as 3 km altitude. Several lava fountains were active on the W side of the down dropped block during 11-15 September, while the easternmost vents on the down dropped block and the westernmost vents in the crater became inactive on 11 September (figure 534). The remaining vents spanned approximately 750 m and trended roughly E-W. The fed channelized lava effusions flowed N and W into Halema’uma’u. The E rim of the crater was buried by new lava flows; pahoehoe lava flows covered most of the crater floor except areas of higher elevation in the SW part of the crater. The W part of the crater filled about 5 m since the start of the eruption, according to data from a laser rangefinder during 11-12 September. Lava fountaining continued, rising as high as 15 m by the morning of 12 September. During the morning of 13 September active lava flows were moving on the N and E parts of the crater. The area N of the eruptive vents that had active lava on its surface became perched and was about 3 m higher than the surrounding ground surface. By the morning of 14 September active lava was flowing on the W part of the down dropped block and the NE parts of the crater. The distances of the active flows progressively decreased. Spatter had accumulated on the S (downwind) side of the vents, forming ramparts about 20 m high.
Vigorous spattering was restricted to the westernmost large spatter cone with fountains rising 10-15 m high. Minor spattering occurred within the cone to the E of the main cone, but HVO noted that the fountains remained mostly below the rim of the cone. Lava continued to effuse from these cones and likely from several others as well, traveled N and W, confined to the W part of the down-dropped block and the NE parts of Halema’uma’u. Numerous ooze-outs of lava were visible over other parts of the crater floor at night. Laser range-finder measurements taken of the W part of the crater during 14-15 September showed that lava filled the crater by 10 m since the start of the eruption. Sulfur dioxide emissions remained elevated after the onset of the eruption, ranging 20,000-190,000 t/d during the eruption activity, the highest of which occurred on 10 September.
Field crews observed the eruptive activity on 15 September; they reported a notable decrease or stop in activity at several vents. Webcam images showed little to no fountaining since 0700 on 16 September, though intermittent spattering continued from the westernmost large cone throughout the night of 15-16 September. Thermal images showed that lava continued to flow onto the crater floor. On 16 September HVO reported that the eruption stopped around 1200 and that there was no observable activity anywhere overnight or on the morning of 17 September. HVO field crews reported that active lava was no longer flowing onto Halema’uma’u crater floor and was restricted to a ponded area N of the vents on the down dropped block. They reported that spattering stopped around 1115 on 16 September. Nighttime webcam images showed some incandescence on the crater floor as lava continued to cool. Field observations supported by geophysical data showed that eruptive tremor in the summit region decreased over 15-16 September and returned to pre-eruption levels by 1700 on 16 September. Sulfur dioxide emissions were measured at a rate of 800 t/d on 16 September while the eruption was waning, and 200 t/d on 17 September, which were markedly lower compared to measurements taken the previous week of 20,000-190,000 t/d.
Geologic Background. Kilauea overlaps the E flank of the massive Mauna Loa shield volcano in the island of Hawaii. Eruptions are prominent in Polynesian legends; written documentation since 1820 records frequent summit and flank lava flow eruptions interspersed with periods of long-term lava lake activity at Halemaumau crater in the summit caldera until 1924. The 3 x 5 km caldera was formed in several stages about 1,500 years ago and during the 18th century; eruptions have also originated from the lengthy East and Southwest rift zones, which extend to the ocean in both directions. About 90% of the surface of the basaltic shield volcano is formed of lava flows less than about 1,100 years old; 70% of the surface is younger than 600 years. The long-term eruption from the East rift zone between 1983 and 2018 produced lava flows covering more than 100 km2, destroyed hundreds of houses, and added new coastline.
Information Contacts: Hawaiian Volcano Observatory (HVO), U.S. Geological Survey, PO Box 51, Hawai'i National Park, HI 96718, USA (URL: http://hvo.wr.usgs.gov/).
Tinakula (Solomon Islands) — December 2023 Cite this Report
Tinakula
Solomon Islands
10.386°S, 165.804°E; summit elev. 796 m
All times are local (unless otherwise noted)
Continued lava flows and thermal activity during June through November 2023
Tinakula is a remote 3.5 km-wide island in the Solomon Islands, located 640 km ESE of the capital, Honiara. The current eruption period began in December 2018 and has more recently been characterized by intermittent lava flows and thermal activity (BGVN 48:06). This report covers similar activity during June through November 2023 using satellite data.
During clear weather days (20 July, 23 September, 23 October, and 12 November), infrared satellite imagery showed lava flows that mainly affected the W side of the island and were sometimes accompanied by gas-and-steam emissions (figure 54). The flow appeared more intense during July and September compared to October and November. According to the MODVOLC thermal alerts, there were a total of eight anomalies detected on 19 and 21 July, 28 and 30 October, and 16 November. Infrared MODIS satellite data processed by MIROVA (Middle InfraRed Observation of Volcanic Activity) detected a small cluster of thermal activity occurring during late July, followed by two anomalies during August, two during September, five during October, and five during November (figure 55).
Geologic Background. The small 3.5-km-wide island of Tinakula is the exposed summit of a massive stratovolcano at the NW end of the Santa Cruz islands. It has a breached summit crater that extends from the summit to below sea level. Landslides enlarged this scarp in 1965, creating an embayment on the NW coast. The Mendana cone is located on the SE side. The dominantly andesitic volcano has frequently been observed in eruption since the era of Spanish exploration began in 1595. In about 1840, an explosive eruption apparently produced pyroclastic flows that swept all sides of the island, killing its inhabitants. Recorded eruptions have frequently originated from a cone constructed within the large breached crater. These have left the upper flanks and the steep apron of lava flows and volcaniclastic debris within the breach unvegetated.
Information Contacts: MIROVA (Middle InfraRed Observation of Volcanic Activity), a collaborative project between the Universities of Turin and Florence (Italy) supported by the Centre for Volcanic Risk of the Italian Civil Protection Department (URL: http://www.mirovaweb.it/); Hawai'i Institute of Geophysics and Planetology (HIGP) - MODVOLC Thermal Alerts System, School of Ocean and Earth Science and Technology (SOEST), Univ. of Hawai'i, 2525 Correa Road, Honolulu, HI 96822, USA (URL: http://modis.higp.hawaii.edu/); Copernicus Browser, Copernicus Data Space Ecosystem, European Space Agency (URL: https://dataspace.copernicus.eu/browser/).
Fuego (Guatemala) — December 2023 Cite this Report
Fuego
Guatemala
14.4748°N, 90.8806°W; summit elev. 3799 m
All times are local (unless otherwise noted)
Daily explosions, gas-and-ash plumes, and block avalanches during August-November 2023
Fuego is one of three large stratovolcanoes overlooking the city of Antigua, Guatemala. It has been erupting since January 2002, with observed eruptions dating back to 1531 CE. Typical activity is characterized by ashfall, pyroclastic flows, lava flows, and lahars. Frequent explosions with ash emissions, block avalanches, and lava flows have been reported since 2018. More recently, activity has been characterized by multiple explosions and ash plumes each day, ashfall, block avalanches, and pyroclastic flows (BGVN 48:09). This report describes similar activity of explosions, gas-and-ash plumes, and block avalanches during August through November 2023 based on daily reports from the Instituto Nacional de Sismologia, Vulcanología, Meteorología e Hidrologia (INSIVUMEH) and various satellite data.
Multiple explosions each day were reported during August through November 2023 that produced ash plumes that rose to 4.9 km altitude and drifted as far as 30 km in different directions. The explosions also caused rumbling sounds of varying intensities, with shock waves that vibrated the roofs and windows of homes near the volcano. Incandescent pulses of material rose as high as 350 m above the crater, accompanied by block avalanches that descended multiple drainages. Light ashfall was often reported in nearby communities (table 29). MIROVA (Middle InfraRed Observation of Volcanic Activity) analysis of MODIS satellite data showed intermittent low-to-moderate power thermal activity during the reporting period (figure 175). A total of seven MODVOLC thermal alerts were issued on 11 August, 1, 13, and 23 September, and 10, 17, and 18 November. On clear weather days thermal anomalies were also visible in infrared satellite imagery in the summit crater (figure 176).
Table 29. Activity at Fuego during August through November 2023 included multiple explosions every hour. Ash emissions rose as high as 4.9 km altitude and drifted in multiple directions as far as 30 km, causing ashfall in many communities around the volcano. Data from daily INSIVUMEH reports.
| Month |
Explosions per hour |
Maximum ash plume altitude (km) |
Ash plume direction and distance (km) |
Drainages affected by block avalanches |
Communities reporting ashfall |
| Aug 2023 |
1-11 |
4.8 |
W, NW, SW, N, NE, and E 8-30 km |
Ceniza, Santa Teresa, Seca, Taniluyá, Las Lajas, El Jute, Trinidad, and Honda |
Panimaché, Morelia, Santa Sofía, Yepocapa, Finca Palo Verde, Sangre de Cristo, Acatenango, Aldeas, El Porvenir, La Reunión, San Miguel Dueñas, Cuidad Vieja, Antigua, Quisaché, and El Sendero |
| Sep 2023 |
3-11 |
4.8 |
SW, W, NW, S, and SE 10-30 km |
Seca, Taniluyá, Ceniza, Las Lajas, Honda, Santa Teresa, Trinidad, and El Jute |
Panimaché I and II, Morelia, Palo Verde, Sangre de Cristo, Yepocapa, El Porvenir, Aldeas, Santa Sofía, Montellano, El Socorro, La Rochela, La Asunción, San Andrés Osuna, Guadalupe, and La Trinidad |
| Oct 2023 |
2-10 |
4.9 |
W, SW, S, NW, N, NE, and SE 10-30 km |
Ceniza, Santa Teresa, Taniluyá, Trinidad, Seca, El Jute, Las Lajas, and Honda |
Aldeas, Panimaché I and II, Morelia, Santa Sofía, El Porvenir, Sangre de Cristo, Yepocapa, Yucales, Palo Verde, Acatenango, Patzicía, San Miguel Dueñas, Alotenango, La Soledad, El Campamento, La Rochela, Las Palmas, and Quisaché |
| Nov 2023 |
1-10 |
4.8 |
W, SW, S, E, SE, NW, and N 10-30 km |
Seca, Taniluyá, Ceniza, Las Lajas, EL Jute, Honda, Santa Teresa, and Trinidad |
Panimaché I and II, Morelia, Yepocapa, Santa Sofía, Aldeas, Sangre de Cristo, Palo Verde, El Porvenir, Yucales, La Rochela, San Andrés Osuna, Ceilán, Quisaché, Acatenango, and La Soledad |
Activity during August consisted of 1-11 explosions each day, which generated ash plumes that rose to 4-4.8 km altitude and drifted 8-30 km W, NW, SW, N, NE, and E. Fine ashfall was reported in Panimaché I and II (8 km SW), Morelia (9 km SW), Santa Sofía (12 km SW), Yepocapa (8 km NW), Finca Palo Verde (10 km WSW), Sangre de Cristo (8 km WSW), Acatenango (8 km E), Aldeas, El Porvenir (11 km SW), La Reunión (7 km SE), San Miguel Dueñas (10 km NE), Ciudad Vieja (13.5 km NE), Antigua (18 km NE), Quisaché (8 km NW), and El Sendero. The explosions sometimes ejected incandescent material 50-250 m above the crater and generated weak-to-moderate block avalanches that descended the Santa Teresa (W), Seca (W), Taniluyá (SW), Ceniza (SSW), Las Lajas (SE), El Jute (ESE), Trinidad (S), and Honda (E) drainages. Lahars were reported in the Ceniza drainage on 8-9, 16, 26-27, and 29 August, carrying fine and hot volcanic material, branches, tree trunks, and blocks measured 30 cm up to 1.5 m in diameter. Similar lahars affected the Las Lajas, El Jute, Seca, and El Mineral (W) drainages on 27 August.
Daily explosions ranged from 3-11 during September, which produced ash plumes that rose to 4-4.8 km altitude and drifted 10-30 km SW, W, NW, S, and SE. The explosions were accompanied by block avalanches that affected the Seca, Taniluyá, Ceniza, Las Lajas, Honda, Santa Teresa, Trinidad, and El Jute drainages and occasional incandescent ejecta rose 50-300 m above the crater. Fine ashfall was reported in Panimaché I and II, Morelia, Palo Verde, Sangre de Cristo, Yepocapa, El Porvenir, Aldeas, Santa Sofía, Montellano, El Socorro, La Rochela (8 km SSW), La Asunción (12 km SW), San Andrés Osuna (11 km SSW), Guadalupe, La Trinidad (S). Lahars triggered by rainfall were detected in the Ceniza drainage on 3-4, 8, 13-14, 17, 20-21, 24, 26, 29-30 September, which carried fine and hot volcanic material, branches, tree trunks, and blocks measuring 30 cm to 3 m in diameter. Similar lahars were also detected in the Seca, El Mineral, Las Lajas, and El Jute drainages on 27 September.
There were 2-10 explosions recorded each day during October, which produced ash plumes that rose to 4-4.9 km altitude and drifted 10-30 km W, SW, S, NW, N, NE, and SE. Incandescent pulses of material rose 50-350 m above the crater. Many of the explosions generated avalanches that descended the Ceniza, Santa Teresa, Taniluyá, Trinidad, Seca, El Jute, Las Lajas, and Honda drainages. Ashfall was reported in Aldeas, Panimaché I and II, Morelia, Santa Sofía, El Porvenir, Sangre de Cristo, Yepocapa, Yucales, Palo Verde, Acatenango, Patzicía, Alotenango, La Soledad (11 km N), El Campamento, La Rochela, Las Palmas, and Quisaché. Lahars continued to be observed on 2-5, 7, 9, 11, and 21-22 October, carrying fine and hot volcanic material, branches, tree trunks, and blocks measuring 30 cm to 3 m in diameter. Similar lahars were also reported in the Seca and Las Lajas drainage on 2 October and in the Las Lajas drainage on 4 October. On 4 October lahars overflowed the Ceniza drainage toward the Zarco and Mazate drainages, which flow from Las Palmas toward the center of Siquinalá, resulting from intense rainfall and the large volume of pyroclastic material in the upper part of the drainage. On 9 October a lahar was reported in the Seca and Las Lajas drainages, and lahars in the Las Lajas and El Jute drainages were reported on 11 October. A lahar on 22 October was observed in the Seca drainage, which interrupted transportation between San Pedro Yepocapa and the communities in Santa Sofía, Morelia, and Panimaché.
During November, 1-10 daily explosions were recorded, sometimes accompanied by avalanches, rumbling sounds, and shock waves. Gas-and-ash plumes rose 4.5-4.8 km altitude and extended 10-30 km W, SW, S, E, SE, NW, and N. Incandescent pulses of material rose 50-200 m above the crater. Fine ashfall was reported in Panimaché I and II, Morelia, Yepocapa, El Porvenir, Palo Verde, Santa Sofía, Aldeas, Sangre de Cristo, Yucales, La Rochela, San Andrés Osuna, Ceilán (9 km S), Quisaché, Acatenango, La Soledad. Avalanches of material descended the Seca, Taniluyá, Ceniza, Las Lajas, El Jute, Honda, Santa Teresa, and Trinidad drainages.
Geologic Background. Volcán Fuego, one of Central America's most active volcanoes, is also one of three large stratovolcanoes overlooking Guatemala's former capital, Antigua. The scarp of an older edifice, Meseta, lies between Fuego and Acatenango to the north. Construction of Meseta dates back to about 230,000 years and continued until the late Pleistocene or early Holocene. Collapse of Meseta may have produced the massive Escuintla debris-avalanche deposit, which extends about 50 km onto the Pacific coastal plain. Growth of the modern Fuego volcano followed, continuing the southward migration of volcanism that began at the mostly andesitic Acatenango. Eruptions at Fuego have become more mafic with time, and most historical activity has produced basaltic rocks. Frequent vigorous eruptions have been recorded since the onset of the Spanish era in 1524, and have produced major ashfalls, along with occasional pyroclastic flows and lava flows.
Information Contacts: Instituto Nacional de Sismologia, Vulcanologia, Meteorologia e Hydrologia (INSIVUMEH), Unit of Volcanology, Geologic Department of Investigation and Services, 7a Av. 14-57, Zona 13, Guatemala City, Guatemala (URL: http://www.insivumeh.gob.gt/ ); MIROVA (Middle InfraRed Observation of Volcanic Activity), a collaborative project between the Universities of Turin and Florence (Italy) supported by the Centre for Volcanic Risk of the Italian Civil Protection Department (URL: http://www.mirovaweb.it/); Hawai'i Institute of Geophysics and Planetology (HIGP) - MODVOLC Thermal Alerts System, School of Ocean and Earth Science and Technology (SOEST), Univ. of Hawai'i, 2525 Correa Road, Honolulu, HI 96822, USA (URL: http://modis.higp.hawaii.edu/); Copernicus Browser, Copernicus Data Space Ecosystem, European Space Agency (URL: https://dataspace.copernicus.eu/browser/).
Santa Maria (Guatemala) — December 2023 Cite this Report
Santa Maria
Guatemala
14.757°N, 91.552°W; summit elev. 3745 m
All times are local (unless otherwise noted)
Continuing lava effusion, explosions, ash plumes, and pyroclastic flows during August-November 2023
The Santiaguito lava dome complex of Guatemala’s Santa María volcano has been actively erupting since 1922. The lava dome complex lies within a large crater on the SW flank of Santa María that was formed during the 1902 eruption. Ash explosions, pyroclastic flows, and lava flows have emerged from Caliente, the youngest of the four vents in the complex for more than 40 years. A lava dome that appeared within Caliente’s summit crater in October 2016 has continued to grow, producing frequent block avalanches down the flanks. More recently, activity has been characterized by frequent explosions, lava flows, ash plumes, and pyroclastic flows (BGVN 48:09). This report covers activity during August through November 2023 based on information from Guatemala's INSIVUMEH (Instituto Nacional de Sismologia, Vulcanologia, Meterologia e Hidrologia) and various satellite data.
Activity during August consisted of weak-to-moderate explosions, avalanches of material, gas-and-ash plumes, and incandescence observed at night and in the early morning. Weak degassing plumes rose 300-600 m above the crater. Frequent explosions were detected at a rate of 1-2 per hour, which produced gas-and-ash plumes that rose 200-1,000 m above the crater and drifted W, NW, SW, S, E, and NE. Two active lava flows continued mainly in the Zanjón Seco (SW) and San Isidro (W) drainages. Incandescent block avalanches and occasional block-and-ash flows were reported on the W, S, E, SE, and SW flanks, as well as on the lava flows. On 26 and 29 August, fine ash plumes rose to 3.5 km altitude and drifted E and NE, causing ashfall in Belén (10 km S) and Calaguache (9 km S), as well as Santa María de Jesús (5 km SE) on 29 August.
Daily degassing, weak-to-moderate explosions, gas-and-ash plumes, and nighttime and early morning incandescence in the upper part of the dome continued during September. Explosions occurred at a rate of 1-2 per hour. Gas-and-ash plumes rose 200-1,000 m above the crater and drifted SW, W, SE, and NW. Block avalanches descended the SW, S, SE, and E flanks, often reaching the base of the Caliente dome. These avalanches were sometimes accompanied by short pyroclastic flows, resulting in fires in some vegetated areas. Block-and-ash flows descended all flanks of the Caliente dome on 16 and 24 September following the eruption of gas-and-ash plumes that rose 700-1,000 m above the crater. Gray ash was primarily deposited in the drainages.
Continuous gas-and-steam emissions occurred in October, along with weak-to-moderate explosions, block avalanches, crater incandescence, and an active lava flow on the WSW flank. Explosions occurred at a rate of 1-4 per hour, that generated gas-and-ash plumes rose 200-1,000 m above the crater and drifted in different directions. Block avalanches traveled down the SW, S, SE, and E flanks, sometimes accompanied by small pyroclastic flows. On 21 and 25 October as many as 50 explosions occurred over the course of 24 hours.
Similar activity persisted during November, with frequent explosions, crater incandescence, and block avalanches. The active lava flow persisted on the WSW flank. Weak-to-moderate explosions occurred at a rate of 1-4 per hour. Incandescence was observed at night and in the early morning. Gas-and-ash emissions rose 700-900 m above the crater and drifted W, SW, S, and NW. Block avalanches were reported on the SW, W, S, SE, and E flanks, which deposited gray ash material in the drainages, sometimes reaching the base of the Caliente dome. Those avalanches were sometimes accompanied by small pyroclastic flows that reached the base of the dome on the W, SW, and S flanks. Ashfall was reported in Las Marías (10 km S), El Viejo Palmar (12 km SSW), El Patrocinio, and San Marcos (8 km SW) on 18 and 22 November. On 26 and 30 November ashfall was reported in San Marcos and Loma Linda Palajunoj (7 km SW).
The MIROVA (Middle InfraRed Observation of Volcanic Activity) graph showed frequent moderate-power thermal anomalies during the reporting period (figure 140). A total of 26 MODVOLC thermal alerts were issued on 6, 7, 7, 15, 16, and 21 August, 15 and 23 September, 19, 26, 27, and 29 October, and 2, 7, 11, 27, 28, and 29 November. Clouds covered the summit of the volcano on most days, so thermal anomalies could not be identified in most Sentinel infrared satellite images.
Geologic Background. Symmetrical, forest-covered Santa María volcano is part of a chain of large stratovolcanoes that rise above the Pacific coastal plain of Guatemala. The sharp-topped, conical profile is cut on the SW flank by a 1.5-km-wide crater. The oval-shaped crater extends from just below the summit to the lower flank, and was formed during a catastrophic eruption in 1902. The renowned Plinian eruption of 1902 that devastated much of SW Guatemala followed a long repose period after construction of the large basaltic andesite stratovolcano. The massive dacitic Santiaguito lava-dome complex has been growing at the base of the 1902 crater since 1922. Compound dome growth at Santiaguito has occurred episodically from four vents, with activity progressing E towards the most recent, Caliente. Dome growth has been accompanied by almost continuous minor explosions, with periodic lava extrusion, larger explosions, pyroclastic flows, and lahars.
Information Contacts: Instituto Nacional de Sismologia, Vulcanologia, Meteorologia e Hydrologia (INSIVUMEH), Unit of Volcanology, Geologic Department of Investigation and Services, 7a Av. 14-57, Zona 13, Guatemala City, Guatemala (URL: http://www.insivumeh.gob.gt/); MIROVA (Middle InfraRed Observation of Volcanic Activity), a collaborative project between the Universities of Turin and Florence (Italy) supported by the Centre for Volcanic Risk of the Italian Civil Protection Department (URL: http://www.mirovaweb.it/); Hawai'i Institute of Geophysics and Planetology (HIGP) - MODVOLC Thermal Alerts System, School of Ocean and Earth Science and Technology (SOEST), Univ. of Hawai'i, 2525 Correa Road, Honolulu, HI 96822, USA (URL: http://modis.higp.hawaii.edu/); Copernicus Browser, Copernicus Data Space Ecosystem, European Space Agency (URL: https://dataspace.copernicus.eu/browser/).
Karangetang (Indonesia) — November 2023 Cite this Report
Karangetang
Indonesia
2.781°N, 125.407°E; summit elev. 1797 m
All times are local (unless otherwise noted)
Incandescent avalanches, pyroclastic flows, and ash plumes during July-September 2023
Karangetang (also known as Api Siau), at the northern end of the island of Siau, Indonesia, contains five summit craters along a N-S line. More than 40 eruptions have been recorded since 1675; recent eruptions have included frequent explosive activity, sometimes accompanied by pyroclastic flows and lahars. Lava dome growth has occurred in the summit craters and collapses of lava flow fronts have also produced pyroclastic flows. The two active summit craters are Kawah Dua (the N crater) and Kawah Utama (the S crater, also referred to as the “Main Crater”). The most recent eruption began in early February 2023 and was characterized by lava flows, incandescent avalanches, and ash plumes (BGVN 48:07). This report covers similar activity through the end of the eruption during July through September 2023 using reports from Pusat Vulkanologi dan Mitigasi Bencana Geologi (PVMBG, also known as CVGHM, or the Center of Volcanology and Geological Hazard Mitigation), MAGMA Indonesia, the Darwin VAAC (Volcano Ash Advisory Center), and satellite data.
Webcam images occasionally showed crater incandescence and lava flows on the flanks of Main Crater during July. Near daily white gas-and-steam plumes rose 50-400 m above the crater and drifted in multiple directions. A webcam image taken at 1732 on 1 July suggested that a pyroclastic flow descended the SE flank, as evident from a linear plume of gas-and-ash rising along its path (figure 66). Incandescent material extended about 1 km down the S flank and about 600 m down the SSW and SW flank, based on a Sentinel satellite image taken on 2 July (figure 67). During the evening of 3 July a lava avalanche descended the Kahetang drainage (SE), extending 1-1.8 km, and the Timbelang and Beha drainages, extending 700-1,000 m. There were 53 earthquakes also detected that day. According to a news article from 6 July the lava avalanche from 2 July continued down the SW flank of Main Crater toward the Batang, Timbelang, and Beha Barat drainages for 1.5 km. An avalanche was also visible on the S flank, affecting the Batuawang and Kahetang drainages, and extending 1.8 km. Incandescent avalanches were reported during 8-9 July, traveling 1.8 km toward the Kahetang, Batuawang (S), and Timbelang drainages (figure 68). PVMBG issued two VONAs (Volcano Observatory Notices for Aviation) at 0759 and 0850 on 10 July, which reported two pyroclastic flows that traveled about 2 km toward the Kahetang drainage (figure 69). There were also 55 earthquakes detected on 10 July. As a result, 17 residents from Bolo Hamlet, Tarorane Village, East Siau District, Sitaro Islands Regency, North Sulawesi were evacuated.
An incandescent avalanche of material descended 1-1.8 km down the Kahetang drainage and 1 km down the Batang drainage on 14 July. During 18-29 July lava avalanches continued to move 1-1.8 km toward the Kahetang drainage, 700-1,000 m toward the Batuawang and Batang drainages, 700-1,000 m toward the Timbelang and Beha Barat drainage, and 1.5 km toward the West Beha drainage. Gray-and-white plumes accompanied the lava avalanches. During 20 July crater incandescence was visible in the gas-and-steam column 10-25 m above the crater. The Darwin VAAC reported that ash plumes rose to 2.4 km altitude at 1710 on 21 July, at 1530 on 22 July, and at 0850 on 23 July, which drifted NE and E. According to a news article, there were 1,189 earthquakes associated with lava avalanches recorded during 24-31 July.
Incandescent avalanches originating from Main Crater and extending SW, S, and SE persisted during August. Frequent white gas-and-steam plumes rose 25-350 m above the crater and drifted in different directions during August. Incandescent avalanches of material traveled S as far as 1.5 km down the Batuawang drainage, 1.8-1.9 km down the Kahetang drainage, and 2-2.1 km down the Keting drainage and SW 800-1,500 m down the Batang, Timbelang, and Beha Barat drainages. Occasional gray plumes accompanied this activity. According to a news article, 1,899 earthquakes associated with lava avalanches were recorded during 1-7 August. Incandescent ejecta from Main Crater was visible up to 10-25 m above the crater. Nighttime crater incandescence was visible in the N summit crater. There were 104 people evacuated from Tatahadeng and Tarorane during the first week of August, based on information from a news article that was published on 9 August. According to a news article published on 14 August the frequency of both earthquakes and lava avalanches decreased compared to the previous week; there were 731 earthquakes associated with avalanches detected during 8-15 August, and 215 during 24-31 August . Lava avalanches descending the Batang and Timbelang drainages continued through 24 August and the Batuawang, Kahetang, and Keting through 30 August. A news article published on 17 August reported pyroclastic flows due to collapsing accumulated material from lava flows.
Near-daily white gas-and-steam plumes rose 25-300 m above the crater and drifted in multiple directions during September. According to news articles, lava avalanches from Main Crater continued toward the Batuawang, Kahetang, and Keting drainages, reaching distances of 1-1.8 km. Lava avalanches also descended the Batang, Timbelang, and Beha Barat drainages as far as 1 km from Main Crater. Main Crater and N Crater incandescence were visible as high as 10 m above the crater. During 1-7 September the number of earthquakes associated with avalanches declined, although effusive activity continued. During 8-15 September lava effusion at Main Crater was not visible, although sounds of avalanches were sometimes intense, and rumbling was also occasionally heard. According to a news article published on 26 September, avalanches were no longer observed.
On 29 November PVMG lowered the Volcano Alert Level (VAL) to 2 (the second lowest level on a scale of 1-4) due to declining activity. Seismic data and visual observations indicated that effusion had decreased or stopped, and lava avalanches were no longer observed.
MIROVA (Middle InfraRed Observation of Volcanic Activity) analysis of MODIS satellite data showed strong thermal activity during July through August 2023, which was mainly characterized by incandescent avalanches of material and lava flows (figure 70). During August, the frequency and intensity of the thermal anomalies declined and remained relatively low through December. There was a brief gap in activity in late September. According to data recorded by the MODVOLC thermal algorithm, there were a total of 22 during July and 19 during August. Infrared satellite images showed summit crater incandescence at both the N and S craters and occasional incandescent avalanches of material affecting mainly the S flank (figure 67).
Geologic Background. Karangetang (Api Siau) volcano lies at the northern end of the island of Siau, about 125 km NNE of the NE-most point of Sulawesi. The stratovolcano contains five summit craters along a N-S line. It is one of Indonesia's most active volcanoes, with more than 40 eruptions recorded since 1675 and many additional small eruptions that were not documented (Neumann van Padang, 1951). Twentieth-century eruptions have included frequent explosive activity sometimes accompanied by pyroclastic flows and lahars. Lava dome growth has occurred in the summit craters; collapse of lava flow fronts have produced pyroclastic flows.
Information Contacts: Pusat Vulkanologi dan Mitigasi Bencana Geologi (PVMBG, also known as Indonesian Center for Volcanology and Geological Hazard Mitigation, CVGHM), Jalan Diponegoro 57, Bandung 40122, Indonesia (URL: http://www.vsi.esdm.go.id/); MAGMA Indonesia, Kementerian Energi dan Sumber Daya Mineral (URL: https://magma.esdm.go.id/v1); Badan Nasional Penanggulangan Bencana (BNPB), National Disaster Management Agency, Graha BNPB - Jl. Scout Kav.38, East Jakarta 13120, Indonesia (URL: http://www.bnpb.go.id/); Darwin Volcanic Ash Advisory Centre (VAAC), Bureau of Meteorology, Northern Territory Regional Office, PO Box 40050, Casuarina, NT 0811, Australia (URL: http://www.bom.gov.au/info/vaac/); MIROVA (Middle InfraRed Observation of Volcanic Activity), a collaborative project between the Universities of Turin and Florence (Italy) supported by the Centre for Volcanic Risk of the Italian Civil Protection Department (URL: http://www.mirovaweb.it/); Hawai'i Institute of Geophysics and Planetology (HIGP) - MODVOLC Thermal Alerts System, School of Ocean and Earth Science and Technology (SOEST), Univ. of Hawai'i, 2525 Correa Road, Honolulu, HI 96822, USA (URL: http://modis.higp.hawaii.edu/); Copernicus Browser, Copernicus Data Space Ecosystem, European Space Agency (URL: https://dataspace.copernicus.eu/browser/); Antara News, Jalan Antara Kav. 53-61 Pasar Baru, Jakarta Pusat 10710, Indonesia (URL: antaranews.com).
Search Bulletin Archive by Publication Date
Select a month and year from the drop-downs and click "Show Issue" to have that issue displayed in this tab.
The default month and year is the latest issue available.
Bulletin of the Global Volcanism Network - Volume 42, Number 11 (November 2017)
Fuego (Guatemala)
Five eruptive episodes and destructive lahars, January-June 2017
Karymsky (Russia)
Moderate ash explosions continue into September 2017
Kick 'em Jenny (Grenada)
Short eruption on 29 April 2017
Kilauea (United States)
Episode 61g lava flow continues with many breakouts; firehose enters the sea at Kamokuna ocean entry
Klyuchevskoy (Russia)
Eruption appears to have subsided after March 2017; ash plumes persist into October
Nishinoshima (Japan)
April-July 2017 episode creates additional landmass from two lava flows
Nyamulagira (DR Congo)
Thermal activity decreases and ends in May 2017
Nyiragongo (DR Congo)
Lava lake persists through October 2017
Reventador (Ecuador)
Ongoing ash emissions, block avalanches, and pyroclastic flows through December 2016
Suwanosejima (Japan)
Persistent ash plumes, explosions, and Strombolian activity during September 2015-December 2016
Fuego (Guatemala) — November 2017 Cite this Report
Fuego
Guatemala
14.4748°N, 90.8806°W; summit elev. 3799 m
All times are local (unless otherwise noted)
Five eruptive episodes and destructive lahars, January-June 2017
Guatemala's Volcán de Fuego was continuously active throughout 2016, and has been erupting since 2002. Historical observations of eruptions date back to 1531, and radiocarbon dates are confirmed back to 1580 BCE. These eruptions have resulted in major ashfalls, pyroclastic flows, lava flows, and damaging lahars. Daily explosions that generated ash plumes to within 1 km above the summit (less than 5 km altitude) were typical. In addition, there were 16 eruptive episodes that included Strombolian activity, lava flows, pyroclastic flows, and ash plumes rising above 5 km altitude (BGVN 42:10). Lahars flowed down several drainages during January-June, August, and September. Similar activity continued during January-June 2017 and included five eruptive episodes and numerous lahars. In addition to regular reports from the Instituto Nacional de Sismologia, Vulcanología, Meteorología e Hidrologia (INSIVUMEH), the Washington Volcanic Ash Advisory Center (VAAC) provides aviation alerts. Locations of many towns and drainages are listed in table 12 (BGVN 42:05).
Explosions with ash emissions continued daily at Fuego during January-June 2017; five episodes of increased activity generated higher ash plumes, lava flows, and pyroclastic flows (table 14). The first eruptive episode of the year occurred on 25-26 January, consisting of two lava flows and an 8.6-km-long pyroclastic flow. The next eruptive episode, during 24-25 February, also generated two lava flows and a 7-km-long pyroclastic flow. Numerous ash plumes during March rose to within 1 km of the summit, and incandescent blocks traveled more than 200 m from the crater, but no lava or pyroclastic flows were reported. Eruptive episode 3 began on 1 April and included three lava flows up to 2 km long, and an ash plume reported at 9.1 km altitude. Significant lahars affected four ravines near the end of the month. Pyroclastic flows affected five ravines during eruptive episode 4 during 4-5 May, along with two lava flows, 1.5 and 1.2 km long. The Washington VAAC reported an ash plume from this event at 12.2 km altitude. Major lahars occurred eight times during May, transporting blocks up to a meter in diameter down the major drainages. There were seven periods of increased activity during June. The period of activity during 5-6 June, designated Episode 5, generated two lava flows (2 and 3 km long) and a pyroclastic flow.
Table 14. Eruptive episodes at Fuego during January-June 2017. Data courtesy of INSIVUMEH and the Washington VAAC.
| Dates |
Episode |
Max Ash Plume altitude |
Ash Plume drift |
Ash Plume max distance |
Ashfall report location |
Lava Flow drainages |
Lava Flow lengths |
Incandescence above crater |
Pyroclastic Flow Drainages |
| 25-26 Jan 2017 |
1 |
5.5 km |
W, SW |
30 km |
30 km W, SW |
Ceniza, Trinidad |
1,000 m |
300 m |
Ceniza, 8.6 km |
| 24-25 Feb 2017 |
2 |
7.6 km |
W, SW, NW, N, NE, E |
25 km |
20 km NE, E |
Santa Teresa, Las Lajas |
-- |
300 m |
Trinidad, 7 km |
| 1-2 Apr 2017 |
3 |
9.1 km |
NW, W, SW |
30 km |
Sangre de Cristo, San Pedro Yepocapa, Santiago Atitlán, Chicacao, Mazatenango, and Retalhuleu. |
Las Lajas, Santa Teresa, Trinidad |
2 km |
300 m |
-- |
| 4-5 May 2017 |
4 |
6.0 km |
S, SW, W, NW |
15 km |
More than 25 km |
Seca, Las Lahas |
1.5 km, 1.2 km |
200 m |
Seca, Ceniza, Trinidad, El Jute, and Las Lajas |
| 5-6 Jun 2017 |
5 |
6 km |
W, SE, NW |
More than 20 km |
San Pedro Yepocapa, Morelia, Santa Sofia, Panimaché, El Porvenir and Sangre de Cristo |
Santa Teresa, Ceniza |
3 km, 2 km |
200 m |
Santa Teresa |
Activity during January 2017. The last eruptive episode (16) of 2016, during 20-21 December, included Strombolian activity that produced three lava flows, a large pyroclastic flow, and ashfall in villages 10-12 km SW (BGVN 42:10). VAAC reports indicated ash emissions visible as far as 230 km SW during the episode. Intermittent ash emissions and thermal alerts were reported during the rest of December as well. Activity increased during January 2017, with ash falling mostly on the S and SW flanks. INSIVUMEH reported Vulcanian explosions on 3 and 4 January which contained abundant ash and sent plumes to 5 km above sea level that drifted NW, W, SW, and S (figure 60). Ashfall was reported in Sangre de Cristo, San Pedro Yepocapa, Santa Sofia, Morelia, Palo Verde Farm, Panimache I and II, La Rochelle, San Andrés Osuna, Siquinalá and Escuintla. Sounds and shockwaves were heard and felt 8 km from the volcano.
The Washington VAAC reported ash emissions at 4.3 km altitude (500 m above the summit) on 1 January extending about 35 km W of the summit early in the day. A second plume rose to 5.5 km and drifted a similar distance SE. A third ash plume a few hours later was spotted at 4.6 km altitude drifting W. By late in the day on 3 January, a broken plume of gas and ash was visible in satellite imagery 300 km SW. A well-defined plume on 4 January extended 90 km SW at 4.9 km altitude. Emissions rose to 5.8 km altitude on 5 January. Daily ash plumes during 2-8 January rose to 4.3-5.8 km and generally drifted W or SW up to 50 km. They also reported intermittent ash emissions in satellite imagery on 11 January, and visible in the webcam on 22 January.
The first eruptive episode of the year began on 25 January 2017 with constant explosions generating an ash plume that rose to 4.5 km altitude and drifted W and SW. Incandescence was visible 200 m above the crater, a lava flow traveled 1,000 m down the Ceniza canyon, and block avalanches descended the Ceniza and Trinidad ravines. Ash emissions later reached 5.5 km altitude and drifted W and SW more than 30 km. Strombolian activity ejected material 300 m above the crater and sent bombs more than 300 m from the crater. A second lava flow traveled down the Trinidad ravine later in the day. The Washington VAAC reported ash emissions during 25-28 January 2017 that rose to 4.6-5.5 km altitude extending over 200 km W. During the early morning of 26 January, a pyroclastic flow descended 8.6 km down the Ceniza canyon. INSIVUMEH estimated the volume of the flow to be over 11,000,000 m3 (figure 61). Extensive new pyroclastic flow deposits were observed filling parts of the ravine. A light layer of ash covered the vegetation in La Rochela as a result of the pyroclastic flow. INSIVUMEH reported ashfall in San Pedro on 26 January.
Activity during February 2017. An increase in activity on 2 February resulted in weak and moderate explosions that lasted 5-10 minutes and generated ash plumes that rose to 4.5 km altitude. The plumes drifted 15 km W and ashfall was reported in San Pedro Yepocapa and Sangre de Cristo. During 31 January-4 February the Washington VAAC noted several ash emissions (figure 62). They rose to altitudes ranging from 3.7-4.9 km and drifted S and W. Ash was visible 180 km SW on 2 February.
On the morning of 24 February, eruptive episode 2 began with explosions and ash plumes rising to 4.6 km altitude and drifting W and SW. Explosions were heard by nearby residents every few minutes, and by the evening two lava flows were observed in the Santa Teresa and Las Lajas ravines. Incandescence reached 300 m above the crater and fell more than 300 m from the crater on the flanks, generating block avalanches. By the next morning ash plumes were observed at 5 km altitude drifting more than 25 km NW, N, NE and E. A pyroclastic flow descended the Trinidad ravine on the morning of 25 February, and traveled about 7 km. Ash on the SE flank was reported in El Rodeo, El Zapote, La Réunion, Alotenango, and San Vicente Pacaya (figure 63). On 25 February, the Washington VAAC reported large areas of dissipating ash moving in multiple directions. Ash emissions at 5-5.2 km altitude were drifting 65 km NE, at 5.8 km altitude they were drifting 130 km NE and also SE, at 6.4 km they were moving S, and another simultaneous plume was observed at 7.6 km drifting 30 km SW.
Activity during March 2017. Daily weak and moderate explosions characterized activity during March 2017. Incandescence rose to 250 m above the crater and generated bombs and block avalanches that traveled more than 200 m from the crater (figure 64), but no new lava or pyroclastic flows were reported. INSIVUMEH reported an average of 17 explosions per day during the month, which generated ash plumes that rose to 4.4-4.9 km. Block avalanches were observed in the lower part of the Las Lajas ravine. Ashfall was reported in San Pedro Yepocapa, Sangre de Cristo, Palo Verde, Santa Sofía, Morelia, and Panimaché I and II. Three to six explosions per hour were recorded on 9, 10, 27, 29, and 31 March. The Washington VAAC reported ash emissions during 8-10, and 13 March. Plumes were observed rising to 4.6 km and moving W, 4.9 km moving S and SE, and 5.8 km drifting 80 km SE during these days. Lahars were reported on 17 and 21 March in the Las Lajas, Santa Teresa, and Ceniza ravines. The road to the village of La Rochela was cut off for a few days by the lahar in the Ceniza ravine.
Activity during April 2017. Persistent degassing during April sent steam emissions to 4.1-4.5 km altitude that dispersed in almost every direction, due to numerous changes in wind direction throughout the month. Weak to moderate Strombolian explosions created ash plumes that rose to 4.2-5.0 km and drifted primarily W and SW. Incandescence from the explosions was visible primarily at night and in the early morning around 100-300 m above the crater. The explosions also generated block avalanches that traveled more than 300 km from the summit. There were two spikes in explosive activity during April. The first, on 1 April, led to eruptive episode 3. The second, on 21 April, was less intense. These periods averaged 5-7 explosions per hour with ash plumes rising to 4.6-4.9 km and drifting in various directions.
Eruptive episode 3 began around midday on 1 April 2017, with Strombolian explosions that produced ash plumes up to 5 km that drifted more than 30 km NW, W, and SW; it lasted for about 16 hours. Ash fell in Sangre de Cristo, San Pedro Yepocapa, Santiago Atitlán, Chicacao, Mazatenango, and Retalhuleu. Lava flows traveled down the Las Lajas, Santa Teresa and Trinidad ravines as far as 2 km. The eruption was categorized by INSIVUMEH as a VEI 2 event with moderate to strong Strombolian explosions. The Washington VAAC reported an ash plume on 1 April that rose to 6.4 km altitude. The densest part of the plume was moving NW with some material fanning out to the NNE. They later revised their report with information that a new emission had risen to 9.1 km altitude and drifted NE. Ash emissions continued the next day with plumes moving NNW at 5.5 km and NNE at 8.2 km; bright incandescence appeared at the summit along with elevated seismicity. By the end of 2 April, the higher plume was diffuse as it dissipated over the far western Caribbean of the coast of Belize and Yucatan.
The Washington VAAC reported an ash emission to 4.5 km altitude on 21 April that extended 30 km NE of the summit. Occasional puffs of ash continued throughout the day and rose to 4.9 km altitude later in the day. By the next day, a plume was visible at 4.6 km extending 80 km E; it was later reported at 4.9 km altitude. By 23 April a faint plume extended 90 km S before dissipating. INSIVUMEH also reported ashfall in Palo Verde Farm, Santa Sofía, Morelia, and Panimaché I and II other times during the month.
Significant lahars affected several ravines on 20, 23, and 24 April 2017. Rain, hail and snowfall caused a lahar in Ceniza Canyon on 20 April (figure 65). On 23 April, lahars flowed down the Santa Teresa, Trinidad, Ceniza and Las Lajas ravines after 160 mm of rainfall in three days. These ravines are tributaries of the larger Pantaleón, Achíguate, and Guacalate rivers. Another lahar on 24 April in Ceniza Canyon was audible more than 1 km from the ravine.
Activity during May 2017. Eruptive episode 4 began on 4 May 2017. A lava flow on the NE flank descended the Seca ravine for 1,500 m (figure 66). Explosions increased to 5-7 per hour, and were visible 200 m above the summit. Another lava flow descended 1.2 km down the Las Lajas ravine. Pyroclastic flows descended Barranca Seca, filling the channel and overflowing to the SE into Rio Mineral. They also affected Ceniza, Trinidad, El Jute, and Las Lajas canyons (figure 67) raising the imminent threat of lahars in these drainages. INSIVUMEH estimated that 14 million cubic meters of material was emplaced from the pyroclastic flows.
INSIVUMEH reported ash emissions during this episode as high as 6 km altitude. The ash dispersed S, SW, W and NW, and ashfall was reported in communities more than 25 km from the crater (figure 68). Energy levels decreased after about 24 hours. INSIVUMEH characterized the event as a VEI 3 eruption. The Washington VAAC was unable to observe the activity in satellite imagery due to cloud cover until the morning of 5 May, when they reported ash plumes moving SW at about 4.6 km altitude and also ENE at 5.5 km altitude. They reported a new, much higher ash plume midday on 5 May at 12.2 km altitude that was drifting E at about 50 km per hour, in addition to the lower level emissions around 4.6 km that drifted SW which generated ashfall in the immediate vicinity of the volcano. The Washington VAAC reported another ash emission on 7 May that rose to 4.9 km altitude and drifted SW about 10 km from the summit. Another plume appeared in satellite imagery the next day moving SW at 4.6 km about 15 km from the summit. The Washington VAAC reported no additional plumes until 31 May when satellite imagery showed a plume with possible ash extending about 25 km NE from the summit at 4.9 km altitude. Ashfall was reported during the month in Morelia, La Rochela, Santa Sofia, Sangre de Cristo, Palo Verde farm, Panimache I and II, San Pedro Yepocapa and Escuintla.
Moderate and strong lahars were recorded on six days in May (figure 69). Five took place in Seca barranca (13, 14, 19, 23, and 27 May), one in the Ceniza ravine (14 May), and two in Las Lajas canyon (both on 29 May). They transported very fine-grained material that had the consistency of wet concrete, and included blocks up to one meter in diameter.
Activity during June 2017. Weak and moderate daily explosions continued at Fuego during June 2017. They generated ash plumes that drifted more than 12 km, incandescence and block avalanches, and ashfall more than 30 km NW, W, and SW. Numerous lahars were also reported. The 20-25 daily explosions generally sent ash plumes to 4.2-4.5 km altitude that drifted mostly W and SW. The incandescence from Strombolian explosions generally extended 150-200 m above the crater (figure 70). Ashfall from these events was reported in in Morelia, Santa Sofia, Sangre de Cristo, La Rochela, and Panimache I and II.
There were seven periods of increased explosive activity during June 2017 (table 15), including eruptive episode 5. Many of the increases in energy levels were observed in the seismic record (figure 71) and reported by OVFGO (the Fuego Volcano Observatory). They noted an average of 5-8 explosions per hour during these events, and ash emissions rising to 4.6-4.9 km altitude, drifting W, SW, and S. None of the ash plumes reported by INSIVUMEH were observed by the Washington VAAC in satellite imagery due to weather clouds. The Washington VAAC did observe bright hotspots in shortwave imagery on 6 June.
Table 15. Periods of increased eruptive activity at Fuego during June 2017. Courtesy of INSIVUMEH (INFORME MENSUAL DE LA ACTIVIDAD DEL VOLCÁN DE FUEGO, Junio 2017).
| Date |
Activity |
| 1 Jun 2017 |
Ashfall in San Pedro Yepocapa; avalanche blocks descend more than 150 meters. |
| 5 Jun 2017 |
Eruptive episode 5. Ashfall in San Pedro Yepocapa, Morelia, Santa Sofia, Panimaché, El Porvenir and Sangre de Cristo; lava flows 500 m down Barranca Santa Teresa. |
| 12 Jun 2017 |
Ashfall in San Miguel Dueñas, Antigua Guatemala, and San Lucas Sacatepéquez. |
| 13 Jun 2017 |
Ash dispersed NW and N more than 35 km. |
| 13 Jun 2017 |
Ash dispersed NE and N more than 20 km. |
| 14 Jun 2017 |
Ash dispersed more than 25 km NW and N. |
| 16 Jun 2017 |
Ashfall in the villages of Panimache, Morelia, Santa Sofia and Santa Lucia Cotzumalguapa. |
Eruptive episode 5 for 2017 began during the late afternoon of 5 June. Moderate and strong Strombolian explosions generated an ash plume that rose to 6 km altitude and drifted more than 20 km W, SE, and NW from the crater. Sounds as loud as a freight train were reported nearby, and vibrations were felt in communities around the volcano. Lava flowed 3 km down the Santa Teresa ravine and 2 km down Ceniza canyon. Volcanic bombs rose 200 m high, and fell more than 300 m from the summit crater. Pyroclastic flows descended the Santa Teresa canyon on the W flank.
Thirteen lahars were reported during June (table 16). They descended the Santa Teresa, Mineral, Trinidad, Ceniza, Las Lajas, and El Jute ravines, tributaries of the Pantaleón, Achíguate and Guacalate rivers. Overflows from the drainages damaged several roads and river crossings in the region.
Table 16. Lahars at Fuego during June 2017. Courtesy of INSIVUMEH (INFORME MENSUAL DE LA ACTIVIDAD DEL VOLCÁN DE FUEGO, Junio 2017).
| Date |
Barranca (ravine) |
| 1 Jun 2017 |
Santa Teresa |
| 2 Jun 2017 |
Santa Teresa (twice) |
| 4 Jun 2017 |
Santa Teresa |
| 5 Jun 2017 |
Santa Teresa |
| 7 Jun 2017 |
Santa Teresa, Mineral |
| 9 Jun 2017 |
Las Lajas, El Jute |
| 9 Jun 2017 |
Las Lajas, El Jute, Ceniza |
| 10 Jun 2017 |
Ceniza |
| 12 Jun 2017 |
Santa Teresa, Mineral, Ceniza |
| 12 Jun 2017 |
Ceniza, Pantaleon |
| 13 Jun 2017 |
Ceniza, Santa Teresa, Mineral |
| 18 Jun 2017 |
El Jute, Trinidad |
Satellite thermal data. The eruptive episodes reported by INSIVUMEH at Fuego during 2016 and the first half of 2017 are readily apparent in the MIROVA Log Radiative Power thermal data, and are also present going back at least to mid-2015 (figure 72). INSIVUMEH reported new lava flows and Strombolian activity each time (except for 2016 episode 8), which were the likely sources of the pulses of thermal activity. Details of the eruptive episodes for 2016 are discussed in BGVN 42:10 and 42:06.
Geologic Background. Volcán Fuego, one of Central America's most active volcanoes, is also one of three large stratovolcanoes overlooking Guatemala's former capital, Antigua. The scarp of an older edifice, Meseta, lies between Fuego and Acatenango to the north. Construction of Meseta dates back to about 230,000 years and continued until the late Pleistocene or early Holocene. Collapse of Meseta may have produced the massive Escuintla debris-avalanche deposit, which extends about 50 km onto the Pacific coastal plain. Growth of the modern Fuego volcano followed, continuing the southward migration of volcanism that began at the mostly andesitic Acatenango. Eruptions at Fuego have become more mafic with time, and most historical activity has produced basaltic rocks. Frequent vigorous eruptions have been recorded since the onset of the Spanish era in 1524, and have produced major ashfalls, along with occasional pyroclastic flows and lava flows.
Information Contacts: Instituto Nacional de Sismologia, Vulcanologia, Meteorologia e Hydrologia (INSIVUMEH), Unit of Volcanology, Geologic Department of Investigation and Services, 7a Av. 14-57, Zona 13, Guatemala City, Guatemala (URL: http://www.insivumeh.gob.gt/ ); Washington Volcanic Ash Advisory Center (VAAC), Satellite Analysis Branch (SAB), NOAA/NESDIS OSPO, NOAA Science Center Room 401, 5200 Auth Rd, Camp Springs, MD 20746, USA (URL: www.ospo.noaa.gov/Products/atmosphere/vaac, archive at: http://www.ssd.noaa.gov/VAAC/archive.html); MIROVA (Middle InfraRed Observation of Volcanic Activity), a collaborative project between the Universities of Turin and Florence (Italy) supported by the Centre for Volcanic Risk of the Italian Civil Protection Department (URL: http://www.mirovaweb.it/).
Karymsky (Russia) — November 2017 Cite this Report
Karymsky
Russia
54.049°N, 159.443°E; summit elev. 1513 m
All times are local (unless otherwise noted)
Moderate ash explosions continue into September 2017
Recent activity at Karymsky has consisted of ash explosions and thermal anomalies, often separated by several months of quiet (BGVN 40:09 and 42:08). No ash explosions occurred between the middle of October 2016 and the end of May 2017 (BGVN 42:08). This report covers activity from June through November 2017 using information compiled from the Kamchatka Volcanic Eruptions Response Team (KVERT), the Tokyo Volcanic Ash Advisory Center (VAAC), and several sources of satellite data.
After months of quiet, KVERT reported that, based on Tokyo VAAC data, an ash explosion began at 0040 (local time) on 4 June 2017 (table 10). The Aviation Color Code (ACC) was raised from Green (lowest level on a four-color scale) to Orange (the second highest level). Subsequent ash explosions occurred on 8 June, 26 June and 18 July (figure 1).
Table 10. Summary by month of ash plumes and thermal anomalies reported for Karymsky during 2016. Details include UTC dates of thermal anomalies and ash plumes; and maximum plume altitude, and maximum distance of ash plume drift. Sources are KVERT and Tokyo VAAC for ash plume data, and KVERT for thermal data.
| Month |
Thermal Anomalies (KVERT) |
Date of Ash Plumes |
Max Plume Altitude (km) |
Max Plume Distance (km) |
| Jun 2017 |
3-8, 10-12, 14-17, 23-24, 27-28 |
3-4, 8, 24, 26 |
6 |
165 |
| Jul 2017 |
1-3. 7, 11-12, 18-20 |
10-11, 18, 20 |
1.7 |
170 |
| Aug 2017 |
1,3,4,6-11 |
3-4, 7-9, 12-13 |
-- |
400 |
| Sep 2017 |
1,6, 8, 15-16, 23-25 |
19, 20, 23 |
7 |
100 |
| Oct 2017 |
-- |
3, 11-12, 14 |
-- |
320 |
| Nov 2017 |
-- |
-- |
-- |
-- |
Toward the end of August, KVERT noted only gas-and-steam emissions, and the ACC was lowered to Yellow (the second lowest level on a four-color scale) on 30 August. This diminished activity continued until 20 September, when ash explosions at 0420 (local) prompted KVERT to raise the ACC back to Orange.
After 20 September, the volcano was either obscured by clouds or relatively quiet. After 11 October the moderate activity was associated with gas-steam emissions. On 19 October, the ACC was lowered to Yellow and then to Green (lowest level) on 26 October. Gas-and-steam activity continued through the end of November.
Thermal anomalies. Thermal anomalies, based on MODIS satellite instruments analyzed using the MODVOLC algorithm, were not observed at Karymsky during the reporting period, except for a possible hotspot on 8 June 2017 that was slightly E of the craters. The MIROVA system detected at least nine days with low to moderate power hotspots in June, two in July, and one in August, all of which were within 3 km of the volcano. No hotspots were recorded September through November 2017.
Geologic Background. Karymsky, the most active volcano of Kamchatka's eastern volcanic zone, is a symmetrical stratovolcano constructed within a 5-km-wide caldera that formed during the early Holocene. The caldera cuts the south side of the Pleistocene Dvor volcano and is located outside the north margin of the large mid-Pleistocene Polovinka caldera, which contains the smaller Akademia Nauk and Odnoboky calderas. Most seismicity preceding Karymsky eruptions originated beneath Akademia Nauk caldera, located immediately south. The caldera enclosing Karymsky formed about 7600-7700 radiocarbon years ago; construction of the stratovolcano began about 2000 years later. The latest eruptive period began about 500 years ago, following a 2300-year quiescence. Much of the cone is mantled by lava flows less than 200 years old. Historical eruptions have been vulcanian or vulcanian-strombolian with moderate explosive activity and occasional lava flows from the summit crater.
Information Contacts: Kamchatka Volcanic Eruptions Response Team (KVERT), Far Eastern Branch, Russian Academy of Sciences, 9 Piip Blvd., Petropavlovsk-Kamchatsky, 683006, Russia (URL: http://www.kscnet.ru/ivs/kvert/); Institute of Volcanology and Seismology, Far Eastern Branch, Russian Academy of Sciences (IVS FEB RAS), 9 Piip Blvd., Petropavlovsk-Kamchatsky 683006, Russia (URL: http://www.kscnet.ru/ivs/eng/); Tokyo Volcanic Ash Advisory Center (VAAC), 1-3-4 Otemachi, Chiyoda-ku, Tokyo, Japan (URL: http://ds.data.jma.go.jp/svd/vaac/data/); Hawai'i Institute of Geophysics and Planetology (HIGP) - MODVOLC Thermal Alerts System, School of Ocean and Earth Science and Technology (SOEST), Univ. of Hawai'i, 2525 Correa Road, Honolulu, HI 96822, USA (URL: http://modis.higp.hawaii.edu/); MIROVA (Middle InfraRed Observation of Volcanic Activity), a collaborative project between the Universities of Turin and Florence (Italy) supported by the Centre for Volcanic Risk of the Italian Civil Protection Department (URL: http://www.mirovaweb.it/).
Kick 'em Jenny (Grenada) — November 2017 Cite this Report
Kick 'em Jenny
Grenada
12.3°N, 61.64°W; summit elev. -185 m
All times are local (unless otherwise noted)
Short eruption on 29 April 2017
A submarine volcano located about 8 km off the N coast of Grenada, Kick 'em Jenny most recently had erupted during 23-24 July 2015 (BVGN 40:08), when two submarine explosions had been detected. This report covers a short-lived eruption on 29 April 2017 as reported by the Seismic Research Centre (SRC) at the University of the West Indies (UWI).
An advisory notice issued on 29 April 2017 by the Grenada National Disaster Management Agency (NaDMA) in collaboration with UWI-SRC reported increased seismicity associated with the volcano, including a high-amplitude signal lasting 25 seconds. The notice advised marine operators to strictly observe a 5-km maritime exclusion zone (figure 10). Another NaDMA notice on 3 May set the alert level at Yellow, indicating that all vessels should observe the 1.5 km exclusion zone, though as a precaution remaining outside the 5-km zone was recommended.
As described by Latchman et al. (2017) in an SRC Open File report on 11 July 2017, subsequent eruptive activity on 29 April 2017 consisted of one event which lasted 14 minutes, followed by about an hour of tremor. The period of unrest began on 8 April with one earthquake. On the days following that first event, and prior to the eruption, there were 0-2 daily volcano-tectonic earthquakes, with 16 in all leading up to the eruption. The eruption was felt in northern Grenada and Martinique as an extended period of shaking, and very high-amplitude T-phases were recorded in Montserrat. There was no surface activity observed. After the eruption there was a sharp increase in the number of hybrid seismic events, with an additional 84 events up to 2 May, after which the activity ceased (figure 11).
According to UWI-SRC, the 2017 precursory seismicity was low level, the eruption occurred without intensification of the seismicity, and the post-eruption seismicity was relatively abundant, but short-lived. This volcanic episode came just 21 months after an episode consisting of two weeks of precursory seismicity, two hour-long eruptions on 23 and 24 July, and rapid decay of post-eruption seismicity.
Reference: Latchman J, Robertson R, Lynch L, Dondin F, Ramsingh C, Stewart R, Smith P, Stinton A, Edwards S, Ash C, Juman A, Joseph E, Nath N, Juman I, Ramsingh H, Madoo F, 2017, 2017/04/29 Eruption of Kick-'em Jenny Submarine Volcano: SRC Open File Report Kick-'em-Jenny, Grenada 201706_VOLC1, Seismic Research Centre, The University of the West Indies, St. Augustine, Trinidad, West Indies.
Geologic Background. Kick 'em Jenny, an active submarine volcano 8 km off the N shore of Grenada, rises 1,300 m from the sea floor. Recent bathymetric surveys have shown evidence for a major arcuate collapse structure, which was the source of a submarine debris avalanche that traveled more than 15 km W. Bathymetry also revealed another submarine cone to the SE, Kick 'em Jack, and submarine lava domes to its S. These and subaerial tuff rings and lava flows at Ile de Caille and other nearby islands may represent a single large volcanic complex. Numerous eruptions have occurred since 1939, mostly documented by acoustic signals. Prior to the 1939 eruption, when an eruption cloud rose 275 m above the ocean and was witnessed by a large number of people in northern Grenada, there had been no written mention of the volcano. Eruptions have involved both explosive activity and the quiet extrusion of lava flows and lava domes in the summit crater; deep rumbling noises have sometimes been heard onshore. Recent eruptions have modified the morphology of the summit crater.
Information Contacts: Seismic Research Centre (SRC), The University of the West Indies (UWI), St. Augustine, Trinidad and Tobago, West Indies (URL: http://www.uwiseismic.com/); National Disaster Management Agency (NaDMA), Fort Frederick, Richmond Hill, St. George's, Grenada, West Indies (URL: http://nadma.gd/).
Kilauea (United States) — November 2017 Cite this Report
Kilauea
United States
19.421°N, 155.287°W; summit elev. 1222 m
All times are local (unless otherwise noted)
Episode 61g lava flow continues with many breakouts; firehose enters the sea at Kamokuna ocean entry
Hawaii's Kīlauea volcano continues the long-term eruptive activity that began in 1983 with lava flows from the East Rift Zone (ERZ) and a convecting lava lake inside Halema'uma'u crater. The US Geological Survey's (USGS) Hawaiian Volcano Observatory (HVO) has been monitoring and researching the volcano for over a century, since 1912. HVO quarterly reports of activity for January-June 2017, by HVO scientists Lil DeSmither, Tim Orr, and Matt Patrick, form the basis of this report. MODVOLC, MIROVA, and NASA Goddard Space Flight Center (GSFC) provided additional satellite information of thermal anomalies and SO2 plumes.
The lava lake level inside Halema'uma'u crater continued to rise and fall periodically during January-June 2017. The lava continued to circulate, and periodic rockfalls and veneer collapses caused small explosions within the lake. A few pieces of lapilli and minor ash landed at the Jagger Overlook. There were no major changes at the Pu'u 'O'o crater during the period; only minor fluctuations occurred in the lava pond lake level, and periodic rockfalls briefly disturbed the pond surface. There were, however, many surface breakouts along almost the entire length of the episode 61g lava flow from near the base of Pu'u 'O'o all the way to the Kamokuna ocean entry, about 12 km S. After the collapse of a large part of the delta at the Kamokuna ocean entry on 31 December 2016, lava continued to pour into the sea, and a new submarine delta began to grow. Instability of the sea cliff led to fractures and additional collapses during January and February. By the end of March, a small new delta was again visible above sea-level. It collapsed into the sea on 3 May, but another new delta quickly began to grow and reappeared by the end of the month. The "firehose" solidified and formed a ramp to the delta; surface flows caused thickening of the delta through the end of June.
Activity at Halema'uma'u. The lava lake inside 1-km-wide Halema'uma'u crater at Kīlauea's summit was relatively quiet during the first half of 2017. It is located within the 200-m-wide "Overlook crater" at the SE edge of Halema'uma'u. The lava lake level rose and fell in reaction to typical summit pressure changes, as reflected in numerous deflation-inflation (DI) events. The rise and fall of the lake level generally took place over the course of several hours to days. At its highest level, the lake was 9 m below the floor of Halema?uma?u crater on 4 January 2017. Two weeks later, the lake dropped to its lowest level measured, 52.5 m, on 17 January. It was at a very similar height again, 52 m below the rim, on 23 June. There were two unusually large, fast drops in the lava lake level during June. The first, from 13 to 14 June, was a drop of 24 m in 24 hours. The second was a drop of 30 m over two days (21 to 23 June), which was the greatest single drop in lava level since mid-January.
The circulation pattern of the lava lake surface remained consistent, upwelling from the north end of the lake and migrating to the southern edge (and the southeast sink) where the crust descended. Short-lived spatter sources around the lake, generally caused by a disruption of the lake surface (e.g., rock falls), would temporarily (and sometimes only locally) redirect the lake surface towards the spatter source. Seismic tremor levels fluctuated along with spattering intensity. During much of the second quarter of 2017, spattering in the southeast sink was located inside of a large grotto with stalactites hanging from the roof.
The rockfalls and veneer collapses from January through June were not large enough to trigger any significant explosions, but there were several smaller events. The first, observed on 9 January at approximately 1320, occurred during Kona winds (stormy, rain-bearing winds that blow over the islands from the SW or SSW, in the opposite direction of the normal trade winds). It did not produce an explosive deposit or excessive amounts of tephra in the collection buckets near the Halema?uma?u Overlook and parking lot (500 m S of active lava lake), but did send ash and at least one 2-3 mm lapillus to the Jaggar Overlook and parking lot (about 1.8 km NW of the lava lake), and generated a composite seismic event. Composite events were also triggered on 14 January (2250) when a large piece of veneer collapsed off the northern crater wall, and on 16 January (1524) after a small rockfall from the southern inner edge of the Overlook crater (the smaller crater inside Halema?uma?u that contains the lava lake). On 23 March at 0036, a slice of the Overlook crater's southern ledge collapsed into the lake, triggering brief spattering and another composite event. On 26 May at 1114 HST, a piece of the northern Overlook crater wall collapsed into the lake (figure 281). This triggered a composite seismic event, lake surface agitation and spattering, and produced a dusting of ash on the cars in the HVO parking lot (at the Jaggar Overlook). Other veneer, grotto, and ledge failures often triggered brief spattering, localized subsidence of the crust, and composite seismic events.
Activity at Pu'u 'O'o. There were no major changes in Pu'u 'O'o crater during the first half of 2017, and there was still an active lava pond in the West pit at the end of June (see figure 258, BGVN 41:08 for detailed crater map). The pond level appeared to be relatively steady, ranging from 19 to 21 m below the pit rim (849-851 m elevation), and the pond diameter ranged from 43 m in March to 47 m at the end of May. A time-lapse camera looking into the West pit lava pond, which was installed on 16 March, revealed a few rockfalls and collapses. The pond surface was completely disturbed on 18 April at 0809 HST and again on 20 May at 2304; overnight on 4-5 May a talus deposit appeared on the pit floor, suggesting rockfalls. On 31 May a ledge just above the West pit lava pond surface, representing the pond level from a few months prior, had a pile of rubble from a portion of the east wall collapsing.
Summary of episode 61g breakouts. Throughout the first half of 2017, there were many active surface breakouts along almost the entire length of the episode 61g flow field (figure 282). Near the 61g vent, a new breakout started on 22 January, which traveled along the southern margin of the flow field before it stopped on the morning of 9 February. The breakout that had started on 21 November 2016, also ended on 9 February, possibly because the system was starved of supply after a week and a half of deflation. A new breakout began on the upper part of Pulama Pali on 10 February that lasted through early April. Two breakouts appeared in the Royal Gardens subdivision on 15 February and 1 March, each lasting a few weeks. During the day of 5 March, a breakout began approximately 1.3 km downslope of the vent that remained weakly active on the upper flow field through the end of June. Two new breakouts started in mid-June that were also active through the end of the month.
Details of episode 61g breakouts. On 10 February 2017 around 0710 a new breakout was reported on the steep part of Pulama Pali on the western flow field; by the next day pahoehoe surface flows were advancing across the coastal plain. Incandescence from the surface breakouts on the pali was only visible for the first few days, but the breakout continued to feed the surface flows on the coastal plain. By 14 February the flows had advanced approximately 2.3 km from the base of the pali (about 1.2 km from the coast), and by 25 February the flow was approximately 660 m from the ocean. These sluggish pahoehoe flows were largely outside the National Park boundary as they widened the eastern edge of the 61g flow margin. The flow advanced to within approximately 300 m of the road (500 m from the ocean) by 2 March. Breakouts then opened on the upper half of the coastal plain around 7 March, remaining weakly active through the end of March. On 8 April, tiny remnant surface flows from the breakout were found on the coastal plain. The spiny pahoehoe was 500 m out from the base of the pali and 2.8 km from the ocean, but the breakout was confirmed by thermal images to have ended by 10 April.
There were two breakouts that began near the top of Royal Gardens subdivision, on 15 February and 1 March 2017. The first started during the day, with glow visible in the R3cam at sundown. By 18 February the breakout was visible from the HPcam on the steep part of Pulama Pali, and remained active on the pali until the evening of 12 March. The 1 March breakout began higher upslope, with incandescence visible at sundown. This breakout slowly advanced and after a few days could not be seen from the webcam. Thermal images from 16 March indicated that the flow was no longer active.
During the day of 5 March 2017, a breakout began approximately 1.3 km downslope of the episode 61g vent (visible in the R3cam). By the middle of March, this was the most active breakout on the flow field, with surface activity expanding both sides of the flow field, and ranging between approximately 2 and 3.5 km from the vent. It was visible from the FEMA emergency road on 28 April on the upper pali. There was very little advancement over the next few weeks, until it reached the top of the steep part of the pali on 17 May. By 23 May, the sluggish pahoehoe flow front was approximately 400 m out from the base of the pali, and there were many small pahoehoe and aa channels on the steep pali face. Four days later (27 May), there were still breakouts on the pali, and the flow front had advanced another 100 m along the western margin of the 61g flow field. Satellite imagery from 2 June showed the breakout was still active, but by 13 June no activity was found on the coastal plain, and thermal imagery showed no active breakouts on 21 June. The 5 March breakout remained weakly active on the upper flow field (above the pali) through the end of June.
Two new breakouts started in June 2017, and remained active through the end of the month. The first started around 0600 HST on 13 June (figure 283), approximately 1.1 km from the episode 61g vent, located just upslope of the 5 March breakout point. These surface flows quickly became the most active along the 61g flow field. The second breakout originated from the upper pali (near the top of Royal Gardens subdivision) during the day of 26 June, and advanced down the pali east of the main flow field, reaching the base during the night of 4 July.
Activity at Kamokuna ocean entry. After the ten hectare (25 acre) delta and sea cliff collapse on 31 December 2016, the ocean entry consisted of a single vigorous lava stream (informally called "the firehose") entering directly into the ocean from the episode 61g lava tube; it was located 21 m above the water (figure 284). Interactions between the lava and sea water produced a single robust plume and sporadic littoral explosions that threw spatter up to roughly 30 m above the top of the sea cliff. Spatter from these explosions fell on the cliff adjacent to the ocean entry, and began to build a littoral cone that was first noticed on 28 January on the cliff's edge. The sea cliff in the immediate area and downwind of the ocean entry was blanketed in a layer of Pele's hair and Limu o Pele (Pele's seaweed) which fell from the plume and added to the ground cover as the firehose continued.
A discolored water plume was visible at the ocean entry flanking an area of darker water directly out from the entry point, on either side. Thermal images taken in mid-March 2017 indicated that the discolored area was also heated, with the anomalous area extending out about one kilometer (figure 285).
Many large ground cracks were noticed in the sea cliff inland from the entry after the 31 December 2016 Kamokuna delta collapse, including a set of en echelon cracks at the edge of the old sea cliff where over 1.6 hectares (about 4 acres) had collapsed. On a 25 January 2017 overflight, thermal images revealed a hot crack parallel to the sea cliff and a corresponding collapse pit on the trace of the lava tube, suggesting major instability. A few days later (28 January) the crack was measured at 30 cm wide, up to 220°C, was visibly very deep, and the seaward side of the crack was sloping slightly towards the ocean (figure 286). HVO scientists could also occasionally feel slow ground shaking at an observation point 240 m east of the ocean entry. When measured again (in the same spot) on 1 February, the crack was 75 cm wide. Upon further examination, grinding noises were coming from the crack and the seaward side of the crack was visibly swaying about 1 cm.
On the morning of 1 February around 0735, a small collapse of the sea cliff was reported near the firehose. The next day, the firehose was no longer visible from the observation point (possibly due to erosion of the sea cliff), but sporadic littoral explosions were still occurring. HVO personnel returned to the crack (which had begun steaming) for observations and to record video of the cliff oscillating. At 1255, about 30 seconds after the camera began to record, the seaward slab of the crack began to fall away. After the collapse only a small piece of the slab remained, and the crack measured 100 cm in width, 25 cm more than the previous day, most of which occurred during the collapse and in the few minutes following (figure 286). By 8 February, the remaining slab of cliff was gone, one piece collapsed at 1507 on 2 February, and the rest collapsed sometime between 6 and 8 February. The littoral cone that had been building on the edge of the cliff fell in with the collapse, but by 8 February, another had formed on the new sea cliff edge above the ocean entry.
During January, the firehose exited the tube as a thin broad sheet, but by the end of the month had changed into a cylindrical stream (figure 284). The output amount slowly began to wane, and on 8 March the ocean entry plume shut off for about 30 minutes between 1616 and 1646 with only a little puff of steam visible in between. The plume shut off briefly again several times on 18, 19, and 20 March for periods up to about 90 minutes in length.
From January through March 2017, the firehose continued with no sign of a delta forming, which suggested steep bathymetry below the ocean entry. By 22 March, the firehose was no longer visible from the public viewing area but incandescence was visible near the water surface, suggesting that the firehose was becoming encased in lava and a small delta was finally beginning to form. On 24 March, there were few, if any, littoral explosions, and the thick plume at the ocean entry made it impossible to see any signs of a delta, but time-lapse images verified the formation of one. There were many floating, steaming blocks in the water offshore of the entry. An overflight on 30 March showed a thick haze that was obscuring the small delta at the base of the cliff, where only brief tiny spots of incandescence could be seen near the water's surface. Images from a thermal camera indicated hot material from the delta extending approximately 60 m east along the cliffs base at the ocean entry.
By the end of March 2017, the firehose flow activity was no longer visible and a tiny new delta began to form. On 8 April, the delta was estimated to be extending roughly 25 m out from the base of the sea cliff (using cliff height for scale). A sparse field of dense angular blocks were deposited on 25 March between 0803 and 0808 HST on the sea cliff near the ocean entry, which covered an area of approximately 70 x 70 m (the largest block observed was 50 cm across).
During the first half of April the small delta was mostly obscured by the ocean entry plume. By the end of the month, the delta size was estimated to be 1.2 hectares (roughly 3 acres, using time-lapse images). On 3 May, nearly the entire delta collapsed between 0955 and 1000 HST, following a large steam plume and weak spattering from one of the cracks on the delta, along with delta subsidence in the preceding 20 minutes before the collapse. Many small pieces of the remnant delta fell off over the next few hours.
The delta quickly began to rebuild after the collapse, and on 23 May coast-parallel cracks were apparent on the new delta. The tubed-over firehose created a ramp-like feature near the cliff face where the 61g tube exited the older sea cliff (figure 287). This ramp was narrow at the point where the tube exits the cliff, and flared out as it reached the surface of the delta, insulating the 61g lava on its way to the delta. Near the top of the ramp there was an area of concentrated degassing, and evident cracks in the ramp revealed incandescence. On 16 June, surface flows on the delta covered a large portion of the surface, including the coast-parallel cracks so they were no longer visible.
Time-lapse images from 25 June revealed that firehose activity returned briefly between 1139 and 1149 HST, and produced channelized surface flows that continued into the following day (when a skylight was visible on the delta). The delta had grown to approximately 2.4 hectares (6 acres) by 29 June (figure 288), and had also thickened significantly from the recent surface flows on the delta. Much of the delta surface was covered by the repeated surface flows, but there was still a coast-parallel crack visible on the western side.
Satellite thermal anomaly and SO2 data. Satellite thermal anomaly data for Kīlauea can be closely correlated with ground-based observations by HVO scientists, thus providing validation of remote-sensing data. The MODVOLC thermal alert system captured distinct anomalies during January-June 2017 from Halema?uma?u Crater, Pu'u 'O'o Cone, the episode 61g flow, and the Kamokuna ocean entry (figure 289). The changes from month to month in the locations of the hotspots, especially the locations of the breakouts of episode 61g flow, are readily apparent in the MODVOLC images, and match the descriptions of these events provided by HVO scientists.
The MIROVA thermal anomaly information, which plots Middle InfraRed Radiation from the MODIS data, also shows the locations and movements of the sources of heat at Kīlauea over time (figure 290), and this information correlates closely with ground observations by HVO staff. Note that the MIROVA center point for relative distances described here is about 10.5 km (0.1°) E of the summit on the western Halema'uma'u crater rim. The anomaly locations at about 10 km distance correspond to both the lava pond at Pu'u 'O'o crater and the Halema'uma'u crater lava lake. Those about 20 km away correspond to the Kamokuna ocean entry. Anomalies that migrate over time between 10 and 20 km distance trace the movement of the episode 61g flow breakouts between Pu'u 'O'o and the Kamokuna ocean entry.
Plumes of SO2 emissions visible in satellite data are common at Kīlauea (figure 291). The normal trade winds send most emissions to the SW, but occasional "Kona" winds blow in the opposite direction and disperse SO2 to the NE from the summit. Large lava breakouts and activity at the summit crater can produce substantial SO2 plumes.
Geologic Background. Kilauea overlaps the E flank of the massive Mauna Loa shield volcano in the island of Hawaii. Eruptions are prominent in Polynesian legends; written documentation since 1820 records frequent summit and flank lava flow eruptions interspersed with periods of long-term lava lake activity at Halemaumau crater in the summit caldera until 1924. The 3 x 5 km caldera was formed in several stages about 1,500 years ago and during the 18th century; eruptions have also originated from the lengthy East and Southwest rift zones, which extend to the ocean in both directions. About 90% of the surface of the basaltic shield volcano is formed of lava flows less than about 1,100 years old; 70% of the surface is younger than 600 years. The long-term eruption from the East rift zone between 1983 and 2018 produced lava flows covering more than 100 km2, destroyed hundreds of houses, and added new coastline.
Information Contacts: Hawaiian Volcano Observatory (HVO), U.S. Geological Survey, PO Box 51, Hawai'i National Park, HI 96718, USA (URL: https://volcanoes.usgs.gov/observatories/hvo/); Hawai'i Institute of Geophysics and Planetology (HIGP) - MODVOLC Thermal Alerts System, School of Ocean and Earth Science and Technology (SOEST), Univ. of Hawai'i, 2525 Correa Road, Honolulu, HI 96822, USA (URL: http://modis.higp.hawaii.edu/); MIROVA (Middle InfraRed Observation of Volcanic Activity), a collaborative project between the Universities of Turin and Florence (Italy) supported by the Centre for Volcanic Risk of the Italian Civil Protection Department (URL: http://www.mirovaweb.it/); NASA Goddard Space Flight Center (NASA/GSFC), Global Sulfur Dioxide Monitoring Page, Atmospheric Chemistry and Dynamics Laboratory, 8800 Greenbelt Road, Goddard, Maryland, USA (URL: http://so2.gsfc.nasa.gov/index.html).
Klyuchevskoy (Russia) — November 2017 Cite this Report
Klyuchevskoy
Russia
56.056°N, 160.642°E; summit elev. 4754 m
All times are local (unless otherwise noted)
Eruption appears to have subsided after March 2017; ash plumes persist into October
The eruption of Klyuchevskoy that began in late August 2015 continued with fluctuating activity through March 2017 (BGVN 42:04) (figure 20). Although lava effusion ended in early November 2016, explosive activity was observed through March 2017 (BGVN 42:04). Similar eruptive activity continued through October 2017 as reported here, exhibiting moderate to strong ash explosions. The Kamchatkan Volcanic Eruption Response Team (KVERT) is responsible for monitoring this volcano, and is the primary source of information. Times are in UTC (local time is UTC + 12 hours).
KVERT reported that weak to moderate ash explosions and thermal anomalies occurred throughout March-October 2017 (table 17). The last time ash was reported during the period of this report was on 7 September 2017. The volcano is often obscured by clouds that prevent plumes from being detected in satellite imagery. However, excellent clear views from space were obtained on 10 June (figure 21) and 17 August 2017 (figures 22 and 23) that showed typical ash plumes. Ground-based observers also noted erupting ash plumes, some not identified in satellite imagery, including one on 8 October 2017 (figure 24).
Table 17. Summary of ash plumes and Aviation Color Codes at Klyuchevskoi from March through mid-October 2017. Data courtesy of KVERT.
| Dates |
Ash plume altitude |
Ash plume drift |
Aviation Color Code (ACC) |
| 02 Mar 2017 |
8-9 km |
110 km NW and NE |
Raised to Orange |
| 08 Mar 2017 |
5.5 km |
20 km NW |
Orange |
| 16 Mar 2017 |
-- |
-- |
Lowered to Yellow |
| 24 Mar 2017 |
-- |
-- |
Lowered to Green |
| 28 Mar 2017 |
5-6 km |
108 km ENE |
Raised to Yellow |
| 29 Mar 2017 |
7.5 km |
75 km SW |
Raised to Orange |
| 01-04 Apr 2017 |
5-6 km |
400 km various directions |
Lowered to Yellow |
| 21-28 Apr 2017 |
-- |
125 km SW |
Orange |
| 5-6, 10-11 May 2017 |
-- |
270 km SE and NW |
Orange |
| 17 May 2017 |
6 km |
180 km N and NE |
Orange |
| 01-02 Jun 2017 |
6 km |
400 km SSE |
Orange |
| 02-09 Jun 2017 |
5 km |
325 km NE, SE, and SW |
Orange |
| 09-16 Jun 2017 |
6-7 km |
580 km SW and SE |
Orange |
| 16-17, 22 Jun 2017 |
6-7 km |
300 km E and W |
Orange |
| 24, 26 Jun 2017 |
5-6 km |
112 km S and SE |
Orange |
| 01-03, 05-06 Jul 2017 |
5 km |
160 km SE, E, and SW |
Orange |
| 08, 12-13 Jul 2017 |
5 km |
50 km SE |
Orange |
| 19-20 Jul 2017 |
-- |
300 km SW, SE, E, and NE |
Orange |
| 22-27 Jul 2017 |
-- |
120 km E and NE |
Orange |
| 02-03 Aug 2017 |
-- |
65 km SW and 250 km ESE |
Orange |
| 11-12, 15-17 Aug 2017 |
-- |
315 km E and NW |
Orange |
| 19 Aug 2017 |
6 km |
140 km NW, 270 km SE, 90 km NE |
Orange |
| 20 Aug 2017 |
-- |
200 km NW |
Orange |
| 21 Aug 2017 |
-- |
480 km NW |
Orange |
| 22 Aug 2017 |
-- |
110 km NW, W, and SW |
Orange |
| 23 Aug 2017 |
-- |
220 km NW |
Orange |
| 24-25, 30 Aug 2017 |
6 km |
550 km various directions |
Lowered to Yellow |
| 07 Sep 2017 |
6 km |
50 km NE |
Orange |
Thermal alerts in the MODVOLC system ended on 2 November 2016, corresponding to the end of lava effusion reported by KVERT (BGVN 42:04). The number of MIROVA thermal anomalies decreased significantly in early November 2016 as well (figure 25), then gradually declined further over the next few months.
Geologic Background. Klyuchevskoy is the highest and most active volcano on the Kamchatka Peninsula. Since its origin about 6,000 years ago, this symmetrical, basaltic stratovolcano has produced frequent moderate-volume explosive and effusive eruptions without major periods of inactivity. It rises above a saddle NE of Kamen volcano and lies SE of the broad Ushkovsky massif. More than 100 flank eruptions have occurred during approximately the past 3,000 years, with most lateral craters and cones occurring along radial fissures between the unconfined NE-to-SE flanks of the conical volcano between 500 and 3,600 m elevation. Eruptions recorded since the late 17th century have resulted in frequent changes to the morphology of the 700-m-wide summit crater. These eruptions over the past 400 years have originated primarily from the summit crater, but have also included numerous major explosive and effusive eruptions from flank craters.
Information Contacts: Kamchatka Volcanic Eruptions Response Team (KVERT), Far Eastern Branch, Russian Academy of Sciences, 9 Piip Blvd., Petropavlovsk-Kamchatsky, 683006, Russia (URL: http://www.kscnet.ru/ivs/kvert/); Institute of Volcanology and Seismology, Far Eastern Branch, Russian Academy of Sciences (IVS FEB RAS), 9 Piip Blvd., Petropavlovsk-Kamchatsky 683006, Russia (URL: http://www.kscnet.ru/ivs/eng/); MIROVA (Middle InfraRed Observation of Volcanic Activity), a collaborative project between the Universities of Turin and Florence (Italy) supported by the Centre for Volcanic Risk of the Italian Civil Protection Department (URL: http://www.mirovaweb.it/); Hawai'i Institute of Geophysics and Planetology (HIGP) - MODVOLC Thermal Alerts System, School of Ocean and Earth Science and Technology (SOEST), Univ. of Hawai'i, 2525 Correa Road, Honolulu, HI 96822, USA (URL: http://modis.higp.hawaii.edu/); NASA Earth Observatory, EOS Project Science Office, NASA Goddard Space Flight Center, Goddard, Maryland, USA (URL: http://earthobservatory.nasa.gov/).
Nishinoshima (Japan) — November 2017 Cite this Report
Nishinoshima
Japan
27.247°N, 140.874°E; summit elev. 100 m
All times are local (unless otherwise noted)
April-July 2017 episode creates additional landmass from two lava flows
Japan's Nishinoshima volcano erupted above sea level in November 2013 for the first time in 40 years. Between then and November 2015 the island grew from 0.29 to 2.63 km2 as a result of numerous lava flows erupting from vents around a central pyroclastic cone (BGVN 41:09). Eruptive activity ended in November 2015, and no additional activity was observed during 2016. A new eruption that included ash emissions and lava flows began in April 2017, and continued until mid-August 2017. Two major lobes of lava emerged from the central crater of the pyroclastic cone and flowed SW and W, expanding the size of the island to about 2.2 km in the E-W dimension and 1.9 km in the N-S dimension, a total area of about 3 km2.
Information comes primarily from monthly reports provided by the Japan Meteorological Agency (JMA) and reports and photographs taken by the Japan Coast Guard (JCG), which monitors the volcano due to its remote location in the Pacific Ocean, approximately 940 km S of Tokyo along the Izu-Bonin arc. Satellite thermal data (MODIS) also provides valuable information about the active heat flow at the volcano.
Changes during November 2013-October 2015. Nishinoshima grew about twelve times in area between 6 November 2013 and 11 October 2015, after nearly two years of constant eruptive activity (figure 39). JCG presented a map in November 2015 showing the areas added to Nishinoshima between November 2013 and November 2015 (figure 40). The Ocean Information Division of JMA conducted a seabed topographic survey in a 4-km radius around the island between 22 June and 9 July 2015 that revealed the new submarine topography (figure 41).
Activity during October-December 2015. The JCG visited Nishinoshima on 13 October, 17 November, and 22 December 2015 (BGVN 41:09). Explosions with ash plumes (figures 42 and 43) and active lava flows from a hornito on the flank (figures 44 and 45) were observed on 13 October. On 17 November they observed crater-like depressions on the N flank of the pyroclastic cone (figure 46).
By the time of their visit on 22 December, there were no further signs of activity from the pyroclastic cone (figure 47), and a comparison of thermal imagery between 17 November and 22 December (figure 48) showed a dramatic decline in heat flow. Aerial photography of the island that day revealed the extent of the new island compared with the pre-November 2013 landmass (figure 49).
Activity during 2016. The Japan Coast Guard continued with monthly observations during 2016, with visits on 19 January, 3 February, 5 March, 14 April, 20 May, 7 June, 19 July, 18 August, 15 September, and 6 October 2016. Only weak fumarolic activity was observed during the February visit (figure 50). Thermal measurements consistently remained at or below 100°C during the year; plumes of light brown to yellowish-green discolored water generally extended 200-400 m away from the coastline, suggesting continued submarine hydrothermal activity. The discolored water extended 1,000 m off the N coast during the 5 March visit. Dense steam filled the summit crater of the pyroclastic cone on 14 April (figure 51). During their 20 May visit, JCG noted a slight increase in size of the beach areas around the shoreline; this increase continued for several months, likely a result of fresh lava flows breaking down into sand from the wave action. During May and June, small amounts of magmatic gas were visible rising a few tens of meters above the summit crater.
On 17 August, JMA cancelled the maritime volcano warning (preventing vessels from approaching within 1.5 km), as a result of the decreased activity. Professor Kenji Nogami of the Tokyo Institute of Volcanic Fluid Research Center noted an increase in the discolored water area, extending about 1,000 m on the S side of the island during the JCG overflight on 15 September. JCG conducted a new submarine survey of the area during 22 October-10 November 2016 to provide data for new maritime charts. No additional reports were issued until a new eruptive episode was observed on 20 April 2017.
While the Japan Coast Guard did not observe volcanic activity during 2016, the MIROVA data suggests that low levels of heat flow were intermittent throughout the year, with slight increases during May-June, July-August, and September-October 2016 (figure 52). The heat flow recorded by MIROVA during 2016 was about an order of magnitude less that that during the period with active lava flows in September-November 2015.
Activity during April-October 2017. The JCG observed renewed eruptive activity when they visited Nishinoshima on 20 April 2017. They confirmed the existence of a new lava flow from the summit crater of the pyroclastic cone on 21 April. They also observed a gray ash plume 500 m wide rising 1,000 m above the crater, Strombolian explosions at intervals of tens of seconds, and molten lava within the crater. A new lava flow appeared on the N side of the cone, although it had not yet reached the ocean. By the time of the next overflight on 27 April, JCG confirmed that the lava flow had reach the ocean on the W and SW coast of the island (figure 53), and a new pyroclastic cone had formed within the summit crater. Strong MODVOLC multi-pixel thermal alerts first appeared on 18 April, and persisted with no more than a few day's break until early August 2017. The Tokyo VAAC reported an ash plume on 20 April at 2.4 km altitude drifting W, but it was not identifiable in satellite data.
Strombolian explosions were observed every 40-60 seconds during an overflight on 2 May 2017. They emerged from the new pyroclastic cone at the center of the summit crater. Ash plumes rose 500 m and drifted SW. Two vents on the N side of the crater produced lava that flowed to the ocean on the SW coast of the island (figure 54). Areas of new lava extended about 170 m W and 180 m SW into the ocean. Continued ash emissions were drifting N from the island on 24 May, and lava continued flowing into the sea along the SW shore.
During the next overflight on 6 June, JCG confirmed a new lava flow emerging from the W flank of the pyroclastic cone and flowing to the sea (figure 55). In late June 2017, JMA published a new bathymetric map of Nishinoshima and surrounding waters as of October 2016. JCG noted that explosions continued at 30-second intervals during their 29 June overflight. Ash plumes rose to about 200 m above the crater rim, and lava was entering the sea on the W side of the island (figure 56). The new lava flows now extended into the sea about 330 m to the W and 310 m to the SW (figure 57).
The Tokyo VAAC reported multiple ash emissions during June. An eruption generated an ash plume on 8 June that rose to 1.2 km altitude and drifted SW. Emissions were observed in satellite imagery for the next 24 hours before dissipating. Another ash plume on 26 June was reported drifting NE at 3 km altitude. Ash seen on 30 June was reported drifting W at 2.1 km altitude for most of the day before dissipating. The Tokyo VAAC reported a possible eruption on 2 July that sent an E-drifting ash plume to 1.5 km altitude. It was later reported at 3 km altitude before dissipating. Ash and bombs were observed exploding from the central crater during the 11 July 2017 JCG overflight. Lava was also still entering the sea on the W side of the island (figure 58).
The JCG visited the island on 11 and 24 August 2017. They did not witness any eruptive activity, but diffuse steam plumes were seen rising from the crater rim. They also noted steam plumes from lava that was still entering the sea on the W side of the island on 11 August, but not during the 24 August flyover. Aerial photos taken that day showed the extent of new land formed since late April (figure 59). Additional flyovers by JCG on 15 September and 7 October confirmed a lack of active lava flows, and only minor steam plumes were reported rising from the crater rim. The last MODVOLC thermal alert appeared on 5 August. The MIROVA thermal anomaly signals that had abruptly reappeared in late April gradually tapered off throughout August, confirming a decrease in the heat flow as the lava flows cooled (figure 52).
Geologic Background. The small island of Nishinoshima was enlarged when several new islands coalesced during an eruption in 1973-74. Multiple eruptions that began in 2013 completely covered the previous exposed surface and continued to enlarge the island. The island is the summit of a massive submarine volcano that has prominent peaks to the S, W, and NE. The summit of the southern cone rises to within 214 m of the ocean surface 9 km SSE.
Information Contacts: Japan Meteorological Agency (JMA), Otemachi, 1-3-4, Chiyoda-ku Tokyo 100-8122, Japan (URL: http://www.jma.go.jp/jma/indexe.html); Japan Coast Guard (JCG), Policy Evaluation and Public Relations Office, 100-8918, 2-1-3 Kasumigaseki, Chiyoda-ku, Tokyo, Telephone, 03-3591-6361 (URL: http://www.kaiho.mlit.go.jp/info/kouhou/h29/index.html); NASA Earth Observatory, EOS Project Science Office, NASA Goddard Space Flight Center, Goddard, Maryland, USA (URL: http://earthobservatory.nasa.gov/); Hawai'i Institute of Geophysics and Planetology (HIGP) - MODVOLC Thermal Alerts System, School of Ocean and Earth Science and Technology (SOEST), Univ. of Hawai'i, 2525 Correa Road, Honolulu, HI 96822, USA (URL: http://modis.higp.hawaii.edu/); MIROVA (Middle InfraRed Observation of Volcanic Activity), a collaborative project between the Universities of Turin and Florence (Italy) supported by the Centre for Volcanic Risk of the Italian Civil Protection Department (URL: http://www.mirovaweb.it/).
Nyamulagira (DR Congo) — November 2017 Cite this Report
Nyamulagira
DR Congo
1.408°S, 29.2°E; summit elev. 3058 m
All times are local (unless otherwise noted)
Thermal activity decreases and ends in May 2017
The Virunga Volcanic Province (VVP) in the Democratic Republic of the Congo is part of the western branch of the East African Rift System. Nyamuragira (or Nyamulagira), a high-potassium basaltic shield volcano on the W edge of VVP, includes a lava field that covers over 1,100 km2 and contains more than 100 flank cones in addition to a large central crater (see figure 47, BGVN 40:01). A large lava lake that had been active for many years emptied from the central crater in 1938. Numerous flank eruptions have been observed since that time, the most recent during November 2011-March 2012 on the NE flank. This was followed by a period of degassing with SO2-rich plumes, but no observed thermal activity, from April 2012 through April 2014. Lava fountains at the central crater in July 2014 signaled the return of a lava lake, which was confirmed in November 2014. The lake lasted through April 2016 when its thermal signal abruptly disappeared (see figure 55, BGVN 42:06).
Thermal activity suggesting reappearance of the lava lake began again in early November 2016, and strengthened in both frequency and magnitude into early January 2017, continuing with a strong signal through April 2017 before tapering off during May 2017. No further activity was reported through November 2017. Ground-based observations are scarce due to the unstable political climate, but occasional information is available from the Observatoire Volcanologique de Goma (OVG), MONUSCO (the United Nations Organization working in the area), geoscientists who study Nyamuragira, and travelers who visit the site. The most consistent data comes from satellite: thermal data from the MODIS instrument processed by the MODVOLC and MIROVA systems, SO2 data from the AURA instrument on NASA's OMI satellite, and NASA Earth Observatory images from a variety of satellites.
Thermal MODIS data indicated that a renewed period of activity began in late November 2016 after a period of quiescence since mid-May 2016. The first MODVOLC alert pixels appeared on 27 November. They were intermittent during December, but increased significantly during January-April 2017, with 30-50 alert pixels each month. They stopped abruptly on 2 May 2017. The MIROVA thermal anomaly graph shows a similar pattern of increasing thermal values from January through April 2017, with both the frequency and intensity tapering off during May 2017 (figure 62). No thermal anomalies were reported within 5 km of the summit from June through November 2017.
During the period from December 2016 to April 2017 thermal anomalies were relatively high, but there were no reported SO2 anomalies from the OMI satellite instrument. This is in contrast with the period from April 2014-April 2016 when both SO2 values and thermal anomaly values were high. Very little ground-based data is available to confirm the eruptive activity of 2017. A photograph from an Instagram user of an image reported as Nyamuragira on 26 January 2017 shows the lava lake at the bottom of the summit crater (figure 63). Bubbling lava from the crater was photographed by Charley Kasereka on 11 March 2017 (see figure 59, BGVN 42:06). An image captured in May 2017 shows steam at the summit crater and lava flows around the caldera, with Nyiragongo in the background (figure 64). A photograph posted 16 September 2017 shows volcanologist Dario Tedesco on the crater rim surrounded by plumes of steam (figure 65).
Geologic Background. Africa's most active volcano, Nyamulagira (also known as Nyamuragira), is a massive high-potassium basaltic shield about 25 km N of Lake Kivu and 13 km NNW of the steep-sided Nyiragongo volcano. The summit is truncated by a small 2 x 2.3 km caldera that has walls up to about 100 m high. Documented eruptions have occurred within the summit caldera, as well as from the numerous flank fissures and cinder cones. A lava lake in the summit crater, active since at least 1921, drained in 1938, at the time of a major flank eruption. Recent lava flows extend down the flanks more than 30 km from the summit as far as Lake Kivu; extensive lava flows from this volcano have covered 1,500 km2 of the western branch of the East African Rift.
Information Contacts: MIROVA (Middle InfraRed Observation of Volcanic Activity), a collaborative project between the Universities of Turin and Florence (Italy) supported by the Centre for Volcanic Risk of the Italian Civil Protection Department (URL: http://www.mirovaweb.it/); Hawai'i Institute of Geophysics and Planetology (HIGP), MODVOLC Thermal Alerts System, School of Ocean and Earth Science and Technology (SOEST), Univ. of Hawai'i, 2525 Correa Road, Honolulu, HI 96822, USA (URL: http://modis.higp.hawaii.edu/); Observatoire Volcanologique de Goma (OVG), Goma, North Kivu, DR Congo (URL: https://www.facebook.com/Observatoire-Volcanologique-de-Goma-OVG-180016145663568/); Virunga Volcanoes, managed by a Belgian-Luxembourgian (BeLux) scientific consortium mainly coordinated by the Royal Museum for Central Africa, the European Center for Geodynamics and Seismology and the National Museum of Natural History of Luxembourg (URL: http://www.virunga-volcanoes.org/); Vincent Tremeau, Instagram user vtremeau (URL: https://www.instagram.com/p/BZMGqX5Bhwl/); Charly Kasereka, Instagram user charlykasereka (URL: https://www.instagram.com/charlykasereka/); Tropic Air Kenya, Instagram user tropicairkenya (URL: https://www.instagram.com/p/BUXbNzjlh4Q/); Tim Best Direct, Instagram user timbestdirect (URL: https://www.instagram.com/p/BPvUgL9BfaX/).
Nyiragongo (DR Congo) — November 2017 Cite this Report
Nyiragongo
DR Congo
1.52°S, 29.25°E; summit elev. 3470 m
All times are local (unless otherwise noted)
Lava lake persists through October 2017
The lava lake in Nyiragongo's main crater has been observed since 1971, and might have been present even before then. There is no regular ground monitoring of the volcano, but occasional field visits by scientific teams and tourist expeditions provide some information about its activity. Two teams of scientists that visited the volcano during March 2016 provided observations of a new vent (BGVN 42:01). This report describes activity during January-October 2017.
Volcano Discovery reported that on 6 June 2017 a team visited the summit (figure 62) and stayed for three days. They noted that the surface of the lava lake (about 220 m across was continuously in motion as exploding gas bubbles created small degassing fountains that recycled the cold black crust back into the incandescent liquid lava. Strong degassing also occurred from the edges of the lava lake, the 2016 hornito, and along the southern fracture zone.
According to a news account (Metro) that cited a statement issued by the Goma Volcanic Observatory, Nyiragongo and nearby Nyamulagira volcanoes experienced intense seismic activity in their respective craters around 17-18 October 2017, before decreasing. Consistent with the presence of the active lava lake, thermal anomalies in satellite-based MODIS data identified by the MODVOLC and MIROVA systems were recorded almost daily during the reporting period.
Geologic Background. The Nyiragongo stratovolcano contained a lava lake in its deep summit crater that was active for half a century before draining catastrophically through its outer flanks in 1977. The steep slopes contrast to the low profile of its neighboring shield volcano, Nyamuragira. Benches in the steep-walled, 1.2-km-wide summit crater mark levels of former lava lakes, which have been observed since the late-19th century. Two older stratovolcanoes, Baruta and Shaheru, are partially overlapped by Nyiragongo on the north and south. About 100 cones are located primarily along radial fissures south of Shaheru, east of the summit, and along a NE-SW zone extending as far as Lake Kivu. Many cones are buried by voluminous lava flows that extend long distances down the flanks, which is characterized by the eruption of foiditic rocks. The extremely fluid 1977 lava flows caused many fatalities, as did lava flows that inundated portions of the major city of Goma in January 2002.
Information Contacts: Tom Pfeiffer, Volcano Discovery (URL: http://www.volcanodiscovery.com/); Observatoire Volcanologique de Goma (OVG), Goma, North Kivu, DR Congo (URL: https://www.facebook.com/Observatoire-Volcanologique-de-Goma-OVG-180016145663568/); Hawai'i Institute of Geophysics and Planetology (HIGP) - MODVOLC Thermal Alerts System, School of Ocean and Earth Science and Technology (SOEST), Univ. of Hawai'i, 2525 Correa Road, Honolulu, HI 96822, USA (URL: http://modis.higp.hawaii.edu/); MIROVA (Middle InfraRed Observation of Volcanic Activity), a collaborative project between the Universities of Turin and Florence (Italy) supported by the Centre for Volcanic Risk of the Italian Civil Protection Department (URL: http://www.mirovaweb.it/); Metro, Mass Transit Media, Gallery Ravenstein 4, 1000 Brussels, Belgium (URL: https://fr.metrotime.be/).
Reventador (Ecuador) — November 2017 Cite this Report
Reventador
Ecuador
0.077°S, 77.656°W; summit elev. 3562 m
All times are local (unless otherwise noted)
Ongoing ash emissions, block avalanches, and pyroclastic flows through December 2016
The andesitic Volcán El Reventador lies well east of the main volcanic axis of the Cordillera Real in Ecuador and has historical observations of eruptions with numerous lava flows and explosive events going back to the 16th century. The largest historical eruption took place in November 2002 and generated a 17-km-high eruption cloud, pyroclastic flows that traveled 8 km, and several lava flows. Eruptive activity has been continuous since 2008. From January-April 2016, monthly eruptive activity included ash plumes, pyroclastic flows, and ejected incandescent blocks (BGVN 42:07), along with a lava flow observed in January. Similar ongoing activity during May-December 2016 is described below with information provided by the Instituto Geofisico-Escuela Politecnicia Nacional (IG-EPN) of Ecuador, and the Washington Volcanic Ash Advisory Center (VAAC).
Ash emissions and incandescent blocks traveling down all the flanks of Reventador persisted throughout May-December 2016 (table 8, figure 56). Ash emissions averaged 12 or 13 per month, although they were only observed during clear days. Emission heights were generally less than 1,000 m above the 3,210-m-high summit, but they were reported at 2 km above the summit once in May, several times in November, and once in December. Incandescent blocks were mostly reported traveling 800-1,500 m down the flanks, although larger events during September sent them as far as 2.2 km. Pyroclastic flows were much less common, reported three times in May, twice in September, and twice in December. A single lava flow was noted in November 2016.
Table 8. Number of eruptive events at Reventador during May-December 2016. Reported events include ash emissions, observations of incandescent blocks traveling down the flanks, and pyroclastic flows. The number of clear days per month during which these observations were made is shown in the right hand column. Information from IG daily reports.
| Month |
Ash Emissions |
Incandescent Blocks |
Pyroclastic Flows |
Clear Days |
| May 2016 |
10 |
12 |
3 |
22 |
| Jun 2016 |
5 |
9 |
0 |
13 |
| Jul 2016 |
14 |
7 |
0 |
22 |
| Aug 2016 |
13 |
7 |
0 |
23 |
| Sep 2016 |
11 |
19 |
2 |
25 |
| Oct 2016 |
10 |
14 |
0 |
26 |
| Nov 2016 |
18 |
11 |
0 |
27 |
| Dec 2016 |
20 |
4 |
2 |
23 |
Thermal anomalies recorded by the MIROVA system at Reventador showed that the nature of the ongoing eruptive activity during May-December 2016 included significant sources of heat (figure 57). Moderate to high heat levels of thermal anomalies were recorded numerous times every month during the period.
Incandescent blocks descended the flanks on 12 days during May 2016, typically to distances between 1-1.5 km; the NE, S, and SE flanks were most affected. IG reported ash emissions during ten days of the month, rising 300-1,500 m above the summit crater, except for a 2,000-m-high plume reported on 25 May. The prevailing winds sent the plumes to the NW or SW. The Washington VAAC observed ash emissions in satellite imagery at 4.6 km altitude (1 km above the summit) on 27 May extending 10 km WNW from the summit. On 30 May, they observed ash emissions extending both N and S at 7 km altitude. Pyroclastic flows descended the flanks three times; 1.5 km down the SE flank on 18 May, 1 km down the SE flank on 24 May, and 2 km down the SW flank on 25 May.
During fieldwork from 8 to 10 June 2016, IG staff working near the base of Reventador witnessed persistent activity, noting a 2-km-high ash plume on 9 June (figure 58) and audible sounds. They also reported evidence of recent pyroclastic flows visible primarily on the N and S flanks, and fine gray ash covering vegetation within the E and NE sides of the summit caldera (figure 59).
The weather during June 2016 prevented visual observations of activity during 17 days of the month. Even so, IG reported nine observations of incandescent blocks travelling 800-1,500 m down most of the flanks, and five observations of ash emissions, most of them rising only a few hundred meters above the summit. The Washington VAAC reported an ash emission at 6.7 km altitude (3.5 km above the summit) visible in clear satellite imagery on 5 June. It was drifting W about 75 km from the summit. They also noted a small emission of possible ash at 4.9 km altitude drifting W the next day. IG reported a plume on 10 June at 1,500 m above the summit drifting NW.
Persistent activity during July and August 2016 included 14 and 13 reports of ash emissions, respectively, and 6 and 7 reports of incandescent blocks from the summit. The ash emissions ranged from 300-800 m above the summit in July and 100-1,000 m above the summit during August. The incandescent blocks traveled down all the flanks at various times to distances up to 1,000 m from the summit. The Washington VAAC reported that satellite imagery on 16 July showed a possible ash cloud centered 30 km W of the summit at 4.6 km altitude. On 8 August they observed an ash emission in multi-spectral imagery moving WNW extending about 35 km from the summit at 6.1 km altitude. Another plume the next day was picked up in multi-spectral imagery at 5.2 km altitude the same distance from the summit.
Activity generating incandescent blocks down the flanks increased during September 2016, and was reported on 19 days. Most reports indicated blocks travelling 1,000 m down several different flanks. Larger events during 19-20 September sent blocks 2,000-2,200 m down the SW and SE flanks. Ash emissions were reported ten times by IG during the month, with plume heights ranging from 200 to 1,200 m above the summit. The Washington VAAC only reported a single ash emission rising to 4.3 km altitude and drifting SE on 8 September. Two pyroclastic flows traveled down the SE flank; on 14 September one traveled 1,800 m, and on 19 September one traveled 1,500 m.
During October 2016, there were 10 ash emission events and 14 incandescent block events; during November, there were 18 ash events and 11 incandescent block events. Ash plume heights above the crater during October were all under 1,000 m, but several rose as high as 2 km during 12-17 November. The Washington VAAC reported an ash emission at 3.9 km altitude on 20 October moving WNW about 25 km from the summit. They also observed a hotpot in satellite imagery the same day. On 31 October, they observed two diffuse ash emissions extending 30 km NW from the summit at 5.8 km altitude. A lava flow extended 300 m down the SE flank on 26 November.
Ash emissions were reported by IG on 20 days during December, the most for this reporting period. Plume heights ranged from 400 to 2,000 m above the summit crater, usually drifting W or NW. Incandescent blocks were only reported four times. Except for 13 December when they traveled 1,500 m down the SSW flank, they traveled 800 m down various flanks. The ash emission reported by the Washington VAAC on 9 December was moving SW near 6.1 km altitude. Other VAAC reports during December indicated only puffs of gas with minor volcanic ash noted in the webcam. Pyroclastic flows were reported on 9 and 26 December.
Geologic Background. Volcán El Reventador is the most frequently active of a chain of Ecuadorian volcanoes in the Cordillera Real, well east of the principal volcanic axis. The forested, dominantly andesitic stratovolcano has 4-km-wide avalanche scarp open to the E formed by edifice collapse. A young, unvegetated, cone rises from the amphitheater floor to a height comparable to the rim. It has been the source of numerous lava flows as well as explosive eruptions visible from Quito, about 90 km ESE. Frequent lahars in this region of heavy rainfall have left extensive deposits on the scarp slope. The largest recorded eruption took place in 2002, producing a 17-km-high eruption column, pyroclastic flows that traveled up to 8 km, and lava flows from summit and flank vents.
Information Contacts: Instituto Geofísico (IG), Escuela Politécnica Nacional, Casilla 17-01-2759, Quito, Ecuador (URL: http://www.igepn.edu.ec/); Washington Volcanic Ash Advisory Center (VAAC), Satellite Analysis Branch (SAB), NOAA/NESDIS OSPO, NOAA Science Center Room 401, 5200 Auth Rd, Camp Springs, MD 20746, USA (URL: www.ospo.noaa.gov/Products/atmosphere/vaac, archive at: http://www.ssd.noaa.gov/VAAC/archive.html); MIROVA (Middle InfraRed Observation of Volcanic Activity), a collaborative project between the Universities of Turin and Florence (Italy) supported by the Centre for Volcanic Risk of the Italian Civil Protection Department (URL: http://www.mirovaweb.it/); NASA Goddard Space Flight Center (NASA/GSFC), Global Sulfur Dioxide Monitoring Page, Atmospheric Chemistry and Dynamics Laboratory, 8800 Greenbelt Road, Goddard, Maryland, USA (URL: http://so2.gsfc.nasa.gov/index.html).
Suwanosejima (Japan) — November 2017 Cite this Report
Suwanosejima
Japan
29.638°N, 129.714°E; summit elev. 796 m
All times are local (unless otherwise noted)
Persistent ash plumes, explosions, and Strombolian activity during September 2015-December 2016
Suwanosejima, an andesitic stratovolcano in Japan's northern Ryukyu Islands, was intermittently active for much of the 20th century, producing ash plumes, Strombolian eruptions, and ash deposits. Continuous activity since October 2004 has consisted generally of multiple ash plumes most months rising a few hundred meters above the summit to altitudes between 1 and 2 km, and tens of reported explosions. Activity between January and September 2015 included small eruptions in July and August that produced ash plumes rising to 3-4 km altitude. Increased activity beginning in August 2015 included incandescence at the crater and increased explosive activity with incandescence in September; 89 explosions occurred that month, and ash fell in the village 4 km SSW (BGVN 42:01). Eruptive activity for the period of September 2015-December 2016 included intermittent explosions, ash plumes up to 4.3 km altitude, ashfall within a 5-km radius, and Strombolian activity. Information is provided primarily by the Japan Meteorological Agency (JMA), and the Tokyo Volcanic Ash Advisory Center (VAAC).
Activity during September-December 2015. Numerous explosions were reported by the JMA during 24-30 September. The Tokyo VAAC reported a plume at 2.1 km altitude extending SE on 24 September; subsequent reports noted there were no observations of ash emissions or plumes in satellite data during that time, and no further VAAC reports were issued after 30 September (until January 2016).
JMA reported that explosions at the Otake crater on 2, 13, and 31 October 2015 produced gray-and-white emissions and rose a maximum of 800 m above the summit (at ~800 m elevation). Explosions occurred on 1 and 20 November as well; the plume rose 1 km above the crater rim on 1 November. Ashfall was confirmed in the small village 4 km SSW after both events. There were no explosions reported during December 2015; only steam emissions rose 600 m above the summit crater, and rumbling was heard on 12 December from the nearby settlement. Incandescence was visible with a thermal camera at night during September-December 2015.
Activity during 2016. According to JMA, explosions and intermittent emissions occurred during most months of 2016 (table 12). Ashfall in the village 4 km SSW of the summit was reported during January-April, July-August, and October-November. Steam-and-ash plume heights ranged from 800 to 2,700 m above the crater rim. The number of monthly seismic events was low in January (25), increasing to a maximum of 1,195 in April. It dropped below 200 by July, and below 100 during November and December. Incandescence at night was reported often every month. An overflight on 31 May 2016 revealed a steam plume rising 400 m above Otake crater (figure 20). Strombolian activity on 15 September and 23 November 2016 ejected incandescent blocks onto the crater rim (figure 21). An ash emission on 25 November sent gray and white ash and steam 1,800 m above the crater rim (figure 22). Incandescent blocks from an explosion were also observed on 17 December.
Table 12. Activity at Suwanosejima during 2016 reported by JMA. Times are local.
| Month |
No. of explosions |
Emission events |
Max plume height (m above crater) |
Dates of ashfall in village 4 km SSW |
No. of seismic events |
Other activity detail |
| Jan 2016 |
1 |
Yes, small |
-- |
22, 23 |
25 |
Occasional incandescence at night; explosion at 2114 on 6 Jan. |
| Feb 2016 |
0 |
Occasional small |
800 m |
22 |
64 |
Occasional incandescence at night. |
| Mar 2016 |
13 |
|
1,700 m |
7, 20, 21 |
170 |
Incandescence at night; shockwaves felt 20-21 Mar. |
| Apr 2016 |
14 |
-- |
1,700 m |
11, 15, 18, 19 |
1,195 |
Incandescence at night; occasional rumbling; seismicity increased 24-26 Apr. |
| May 2016 |
5 |
Steam plumes |
1,200 m |
None |
396 |
Incandescence at night; overflight (figure 20); steam plume 400 m above crater on 31 May drifted NE. |
| Jun 2016 |
0 |
Occasional |
1,900m |
None |
606 |
Incandescence at night. |
| Jul 2016 |
0 |
Occasional |
1,900 m |
23 |
142 |
Incandescence at night. |
| Aug 2016 |
26 |
-- |
2,700 m on 12 and 28 |
1, 2 |
171 |
Incandescence at night; tephra around crater on 12 and 28 Aug; infrasound on 13, 14 Aug; rumbling on 25 Aug. |
| Sep 2016 |
1 |
3 |
Ash to 1,900 m on 17, steam to 2,400 m on 5 |
None |
106 |
Incandescence almost every day; Strombolian activity and explosion at 2305 on 15 Sep (figure 21). |
| Oct 2016 |
0 |
Occasional |
1,200 m |
6, 30 |
102 |
Incandescence almost every day. |
| Nov 2016 |
11 |
Occasional ash emissions |
1,800 m |
5, 6, 26, 29 |
56 |
Constant incandescence; Strombolian explosion at 2325 on 23 Nov sent blocks around crater (figure 22). |
| Dec 2016 |
7 |
Occasional ash emissions |
2,500 m at 1356 on 13 |
None |
33 |
Incandescence at night; large explosion at 2020 on 13 Dec; incandescent blocks on 17 Dec. |
The Tokyo VAAC also reported information about ash plumes and explosions during 2016 (table 13). Explosions were reported during every month of 2016 except February, and ranged from two in January to 19 in August. Most plume heights were lower than 2.7 km altitude. Exceptions included: an explosion on 1 August produced an ash plume that rose to 3.4 km altitude and drifted S; a plume rose to 3 km on 29 November and also drifted S; and the largest of the year, an ash plume that rose to 4.3 km altitude and drifted E, on 13 December (figure 23).
MODVOLC thermal alerts were reported on 20 April, 4 May (3), and 17 May 2016.
Table 13. Summary of activity reported at Suwanosejima during 2016 by the Tokyo VAAC. Time in UTC.
| Month |
Explosion Count |
Explosion Days |
Plume Heights |
Drift Directions |
| Jan 2016 |
2 |
4, 6 |
1.5 km |
SE |
| Feb 2016 |
0 |
-- |
-- |
-- |
| Mar 2016 |
14 |
2 (2), 4, 6, 7 (2), 10, 21, 22 (2), 23, 26 (2), 30 |
1.2-2.4 km |
SE, W, N |
| Apr 2016 |
13 |
5, 10, 14 (2), 15, 17 (2), 18, 19 (3), 20, 21 |
1-2.4 km |
E, W, SE, S, N |
| May 2016 |
5 |
3 (2), 4 (2), 18 |
1.5-2.1 km |
E, SE, W |
| Jun 2016 |
4 |
13 (3), 14 |
1.8-2.7 km |
E |
| Jul 2016 |
4 |
18 (2), 22, 31 |
1.5-2.7 km |
NE, E, N, NW, W |
| Aug 2016 |
19 |
1 (3), 10 (3), 11, 12, 14 (2), 17, 25, 26 (2), 27 (2), 28 (2), 31 |
1.0-3.4 km |
SW, SE, W, NW |
| Sep 2016 |
2 |
15, 16 |
2.7 km |
W |
| Oct 2016 |
5 |
6 (2), 25 (2), 26 |
1.5-1.8 km |
E, S, NE |
| Nov 2016 |
18 |
5, 6, 8, 10 (2), 11 (3), 12 (2), 16, 17, 19, 20, 23, 25 (2), 29 |
1.2-2.1, 3.0 km on 29 |
E, SW, SE, S, W |
| Dec 2016 |
4 |
13 (2), 16, 17 |
4.3 on 13, 1.8 km |
NE, SE, SW, W |
Geologic Background. The 8-km-long island of Suwanosejima in the northern Ryukyu Islands consists of an andesitic stratovolcano with two active summit craters. The summit is truncated by a large breached crater extending to the sea on the E flank that was formed by edifice collapse. One of Japan's most frequently active volcanoes, it was in a state of intermittent Strombolian activity from Otake, the NE summit crater, between 1949 and 1996, after which periods of inactivity lengthened. The largest recorded eruption took place in 1813-14, when thick scoria deposits covered residential areas, and the SW crater produced two lava flows that reached the western coast. At the end of the eruption the summit of Otake collapsed, forming a large debris avalanche and creating an open collapse scarp extending to the eastern coast. The island remained uninhabited for about 70 years after the 1813-1814 eruption. Lava flows reached the eastern coast of the island in 1884. Only about 50 people live on the island.
Information Contacts: Japan Meteorological Agency (JMA), Otemachi, 1-3-4, Chiyoda-ku Tokyo 100-8122, Japan (URL: http://www.jma.go.jp/jma/indexe.html); Tokyo Volcanic Ash Advisory Center (VAAC), Tokyo, Japan (URL: http://ds.data.jma.go.jp/svd/vaac/data/); Hawai'i Institute of Geophysics and Planetology (HIGP) - MODVOLC Thermal Alerts System, School of Ocean and Earth Science and Technology (SOEST), Univ. of Hawai'i, 2525 Correa Road, Honolulu, HI 96822, USA (URL: http://modis.higp.hawaii.edu/).