Recently Published Bulletin Reports
Manam (Papua New Guinea) Few ash plumes during November-December 2022
Krakatau (Indonesia) Strombolian activity and ash plumes during November 2022-April 2023
Stromboli (Italy) Strombolian explosions and lava flows continue during January-April 2023
Nishinoshima (Japan) Small ash plumes and fumarolic activity during November 2022 through April 2023
Karangetang (Indonesia) Lava flows, incandescent avalanches, and ash plumes during January-June 2023
Ahyi (United States) Intermittent hydroacoustic signals and discolored plumes during November 2022-June 2023
Kadovar (Papua New Guinea) An ash plume and weak thermal anomaly during May 2023
San Miguel (El Salvador) Small gas-and-ash explosions during March and May 2023
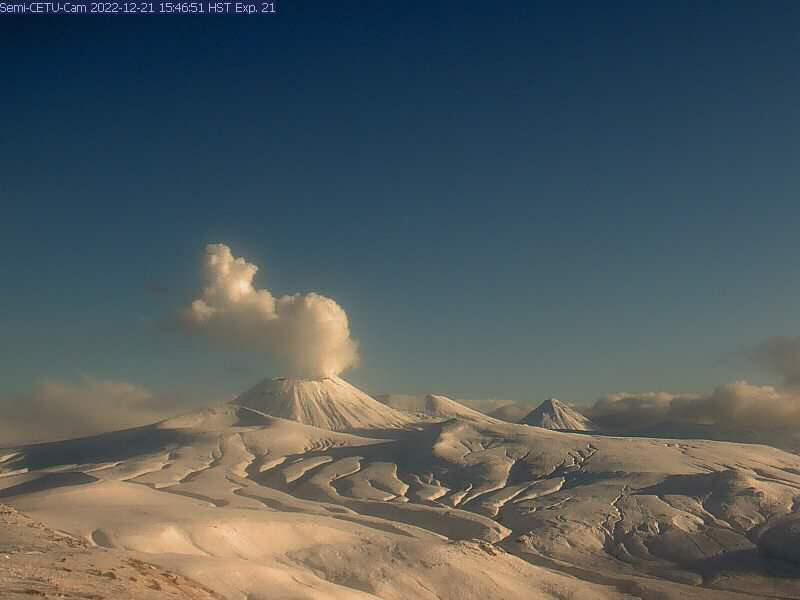
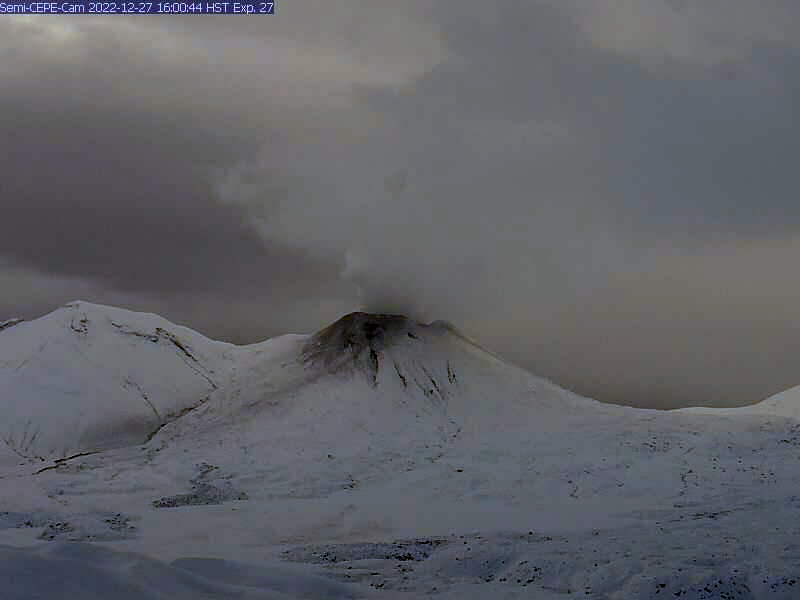
Semisopochnoi (United States) Occasional explosions, ash deposits, and gas-and-steam plumes during December 2022-May 2023
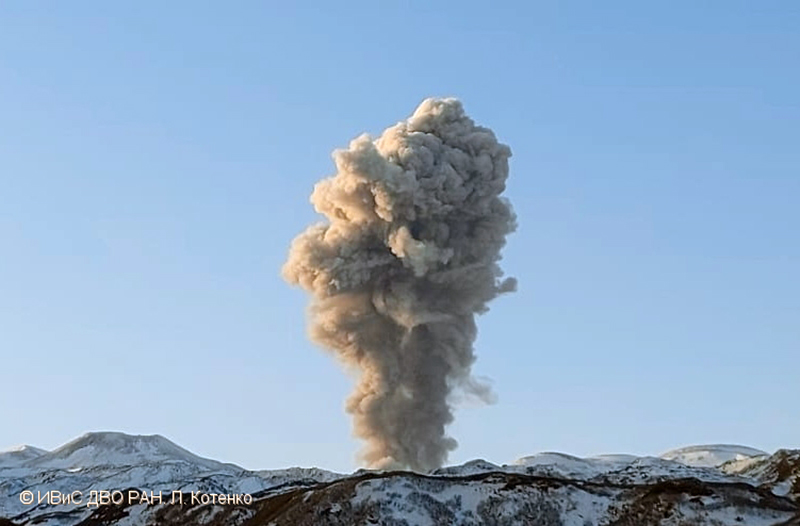
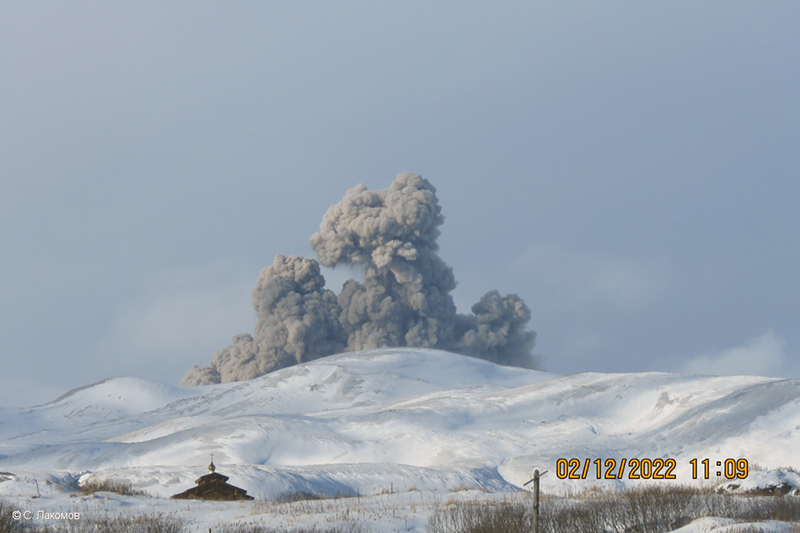
Ebeko (Russia) Continued explosions, ash plumes, and ashfall during October 2022-May 2023
Home Reef (Tonga) Discolored plumes continued during November 2022-April 2023
Ambae (Vanuatu) New lava flow, ash plumes, and sulfur dioxide plumes during February-May 2023
Manam (Papua New Guinea) — July 2023  Cite this Report
Manam
Papua New Guinea
4.08°S, 145.037°E; summit elev. 1807 m
All times are local (unless otherwise noted)
Few ash plumes during November-December 2022
Manam is a 10-km-wide island that consists of two active summit craters: the Main summit crater and the South summit crater and is located 13 km off the northern coast of mainland Papua New Guinea. Frequent mild-to-moderate eruptions have been recorded since 1616. The current eruption period began during June 2014 and has more recently been characterized by intermittent ash plumes and thermal activity (BGVN 47:11). This report updates activity that occurred from November 2022 through May 2023 based on information from the Darwin Volcanic Ash Advisory Center (VAAC) and various satellite data.
Ash plumes were reported during November and December 2022 by the Darwin VAAC. On 7 November an ash plume rose to 2.1 km altitude and drifted NE based on satellite images and weather models. On 14 November an ash plume rose to 2.1 km altitude and drifted W based on RVO webcam images. On 20 November ash plumes rose to 1.8 km altitude and drifted NW. On 26 December an ash plume rose to 3 km altitude and drifted S and SSE.
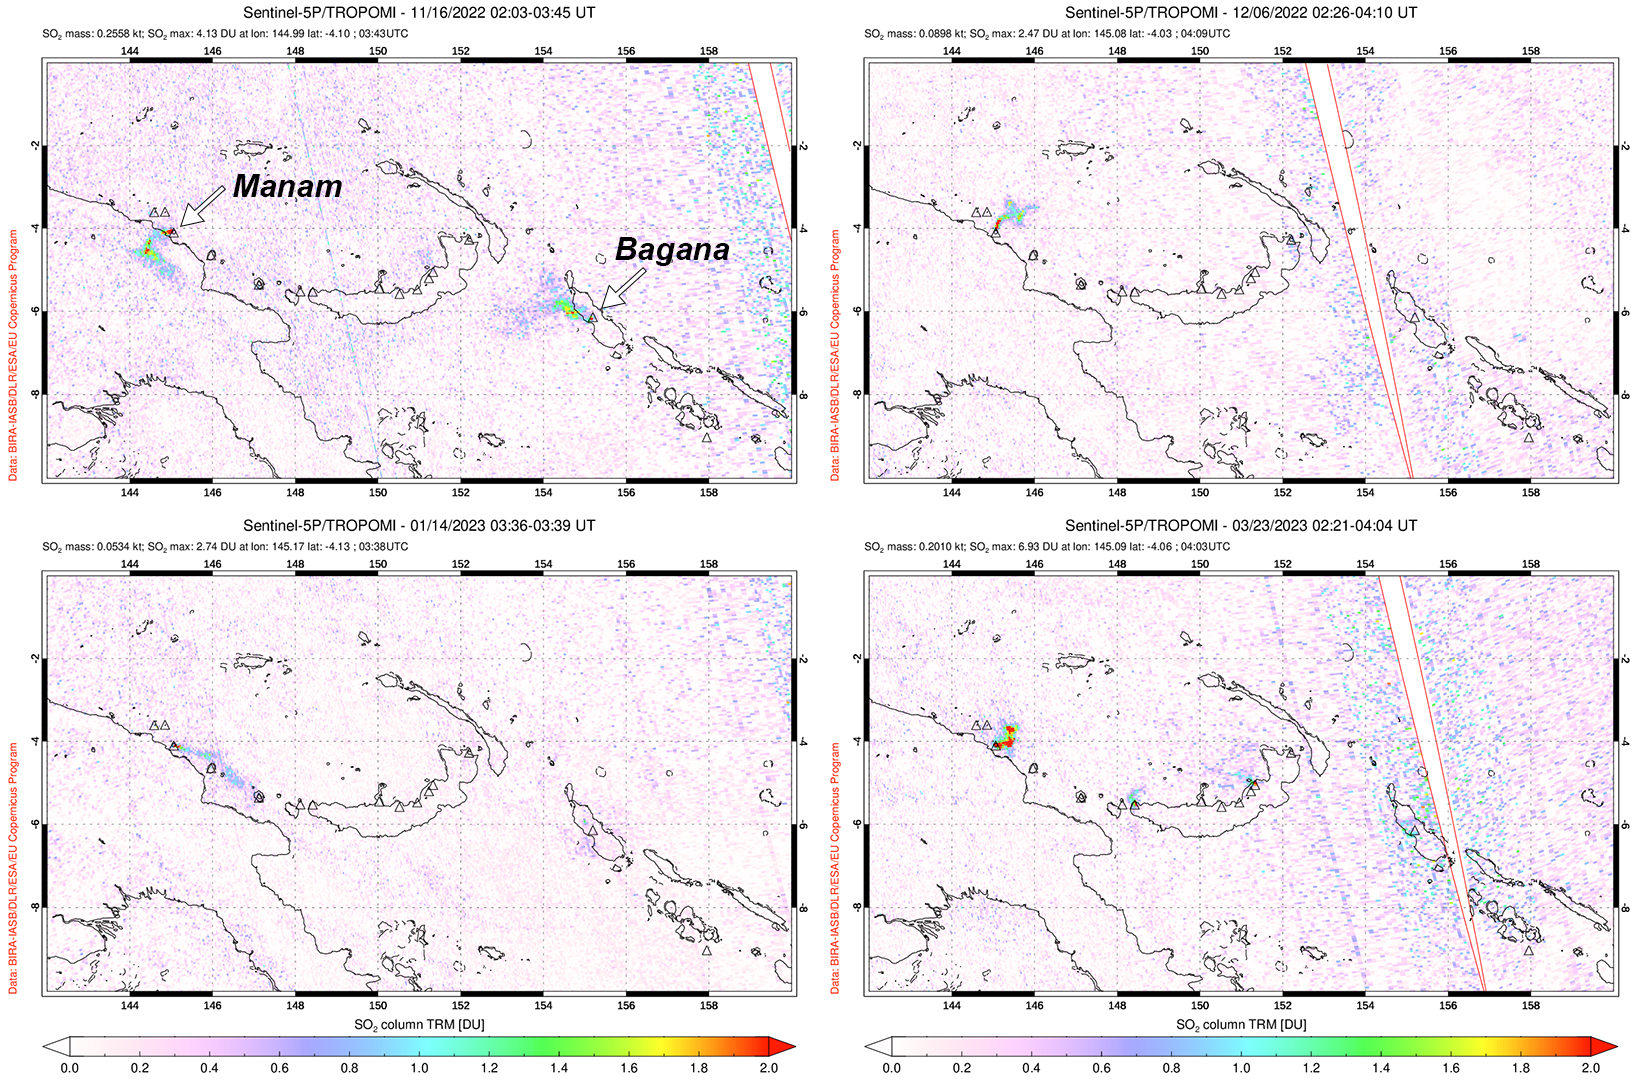
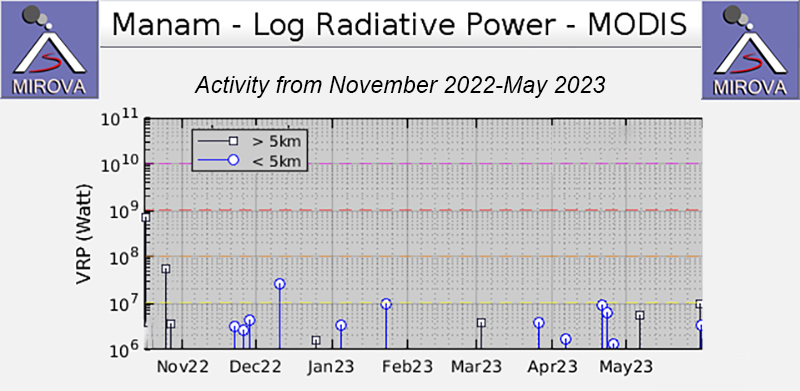
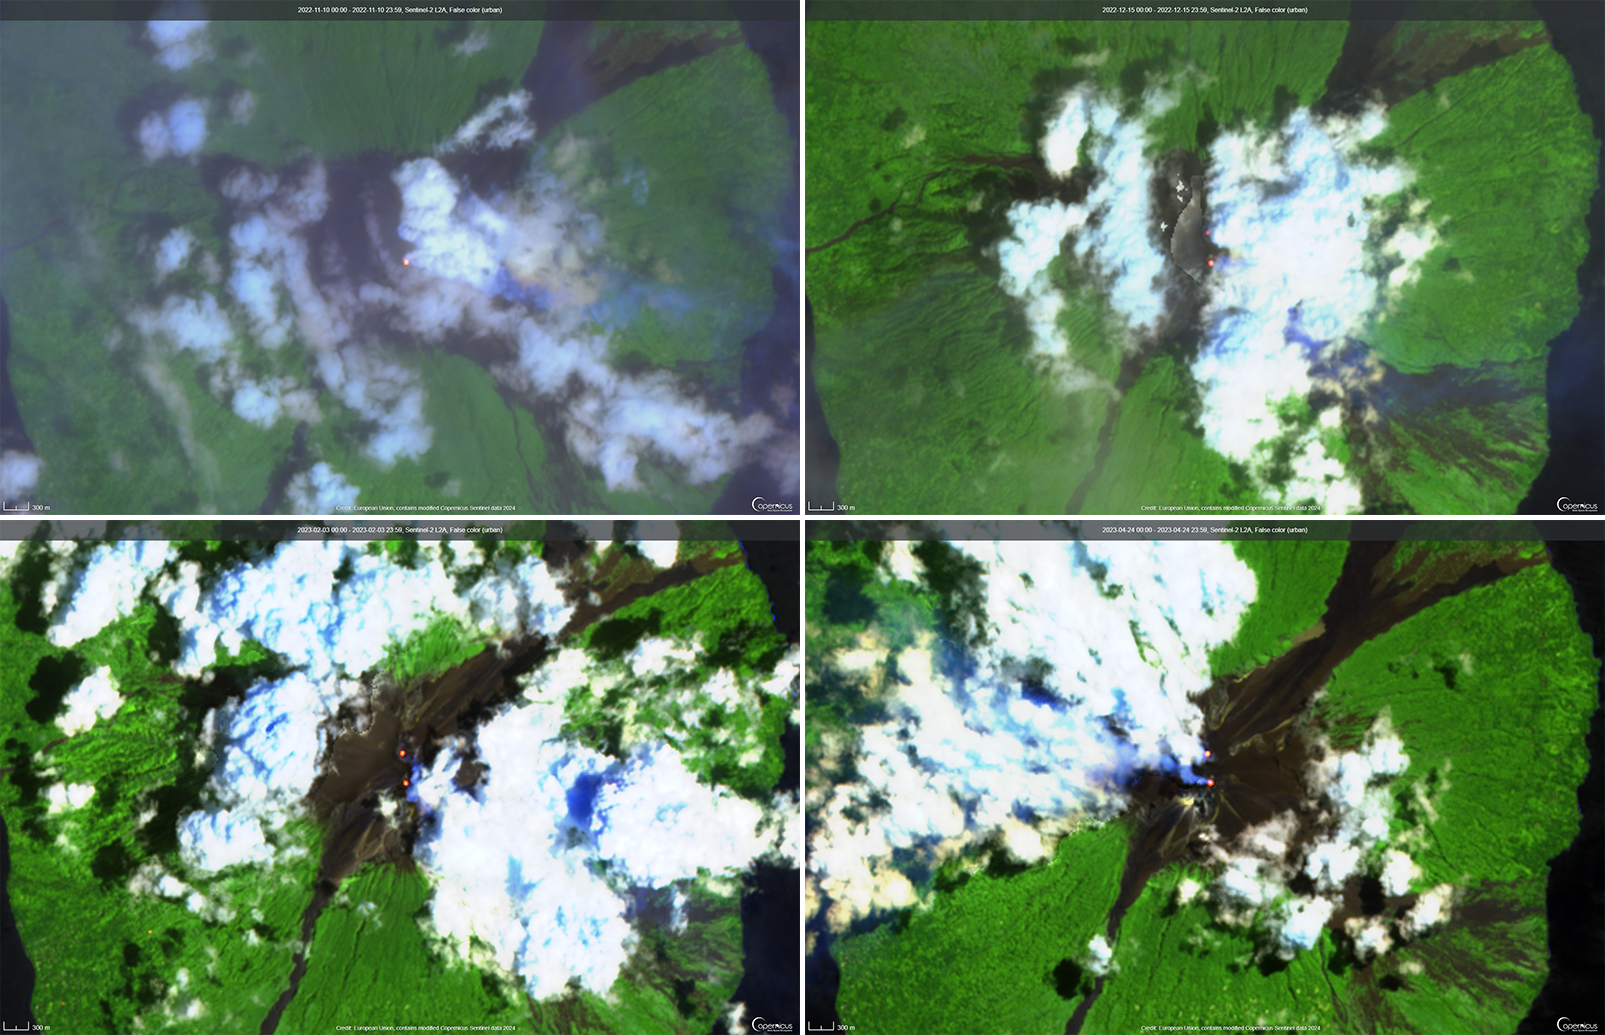
Intermittent sulfur dioxide plumes were detected using the TROPOMI instrument on the Sentinel-5P satellite, some of which exceeded at least two Dobson Units (DU) and drifted in different directions (figure 93). Occasional low-to-moderate power thermal anomalies were recorded by the MIROVA (Middle InfraRed Observation of Volcanic Activity) system; less than five anomalies were recorded each month during November 2022 through May 2023 (figure 94). Two thermal hotspots were detected by the MODVOLC thermal alerts system on 10 December 2022. On clear weather days, thermal activity was also captured in infrared satellite imagery in both the Main and South summit craters, accompanied by gas-and-steam emissions (figure 95).
Geologic Background. The 10-km-wide island of Manam, lying 13 km off the northern coast of mainland Papua New Guinea, is one of the country's most active volcanoes. Four large radial valleys extend from the unvegetated summit of the conical basaltic-andesitic stratovolcano to its lower flanks. These valleys channel lava flows and pyroclastic avalanches that have sometimes reached the coast. Five small satellitic centers are located near the island's shoreline on the northern, southern, and western sides. Two summit craters are present; both are active, although most observed eruptions have originated from the southern crater, concentrating eruptive products during much of the past century into the SE valley. Frequent eruptions, typically of mild-to-moderate scale, have been recorded since 1616. Occasional larger eruptions have produced pyroclastic flows and lava flows that reached flat-lying coastal areas and entered the sea, sometimes impacting populated areas.
Information Contacts: Rabaul Volcano Observatory (RVO), Geohazards Management Division, Department of Mineral Policy and Geohazards Management (DMPGM), PO Box 3386, Kokopo, East New Britain Province, Papua New Guinea; Darwin Volcanic Ash Advisory Centre (VAAC), Bureau of Meteorology, Northern Territory Regional Office, PO Box 40050, Casuarina, NT 0811, Australia (URL: http://www.bom.gov.au/info/vaac/); MIROVA (Middle InfraRed Observation of Volcanic Activity), a collaborative project between the Universities of Turin and Florence (Italy) supported by the Centre for Volcanic Risk of the Italian Civil Protection Department (URL: http://www.mirovaweb.it/); Hawai'i Institute of Geophysics and Planetology (HIGP) - MODVOLC Thermal Alerts System, School of Ocean and Earth Science and Technology (SOEST), Univ. of Hawai'i, 2525 Correa Road, Honolulu, HI 96822, USA (URL: http://modis.higp.hawaii.edu/); NASA Global Sulfur Dioxide Monitoring Page, Atmospheric Chemistry and Dynamics Laboratory, NASA Goddard Space Flight Center (NASA/GSFC), 8800 Greenbelt Road, Goddard, Maryland, USA (URL: https://so2.gsfc.nasa.gov/); Copernicus Browser, Copernicus Data Space Ecosystem, European Space Agency (URL: https://dataspace.copernicus.eu/browser/).
Krakatau (Indonesia) — July 2023  Cite this Report
Krakatau
Indonesia
6.1009°S, 105.4233°E; summit elev. 285 m
All times are local (unless otherwise noted)
Strombolian activity and ash plumes during November 2022-April 2023
Krakatau is located in the Sunda Strait between Java and Sumatra, Indonesia. Caldera collapse during the catastrophic 1883 eruption destroyed Danan and Perbuwatan cones and left only a remnant of Rakata. The post-collapse cone of Anak Krakatau (Child of Krakatau) was constructed within the 1883 caldera at a point between the former Danan and Perbuwatan cones; it has been the site of frequent eruptions since 1927. The current eruption period began in May 2021 and has recently consisted of explosions, ash plumes, and thermal activity (BGVN 47:11). This report covers activity during November 2022 through April 2023 based on information provided by the Indonesian Center for Volcanology and Geological Hazard Mitigation, referred to as Pusat Vulkanologi dan Mitigasi Bencana Geologi (PVMBG), MAGMA Indonesia, the Darwin Volcanic Ash Advisory Center (VAAC), and several sources of satellite data.
Activity was relatively low during November and December 2022. Daily white gas-and-steam plumes rose 25-100 m above the summit and drifted in different directions. Gray ash plumes rose 200 m above the summit and drifted NE at 1047 and at 2343 on 11 November. On 14 November at 0933 ash plumes rose 300 m above the summit and drifted E. An ash plume was reported at 0935 on 15 December that rose 100 m above the summit and drifted NE. An eruptive event at 1031 later that day generated an ash plume that rose 700 m above the summit and drifted NE. A gray ash plume at 1910 rose 100 m above the summit and drifted E. Incandescent material was ejected above the vent based on an image taken at 1936.
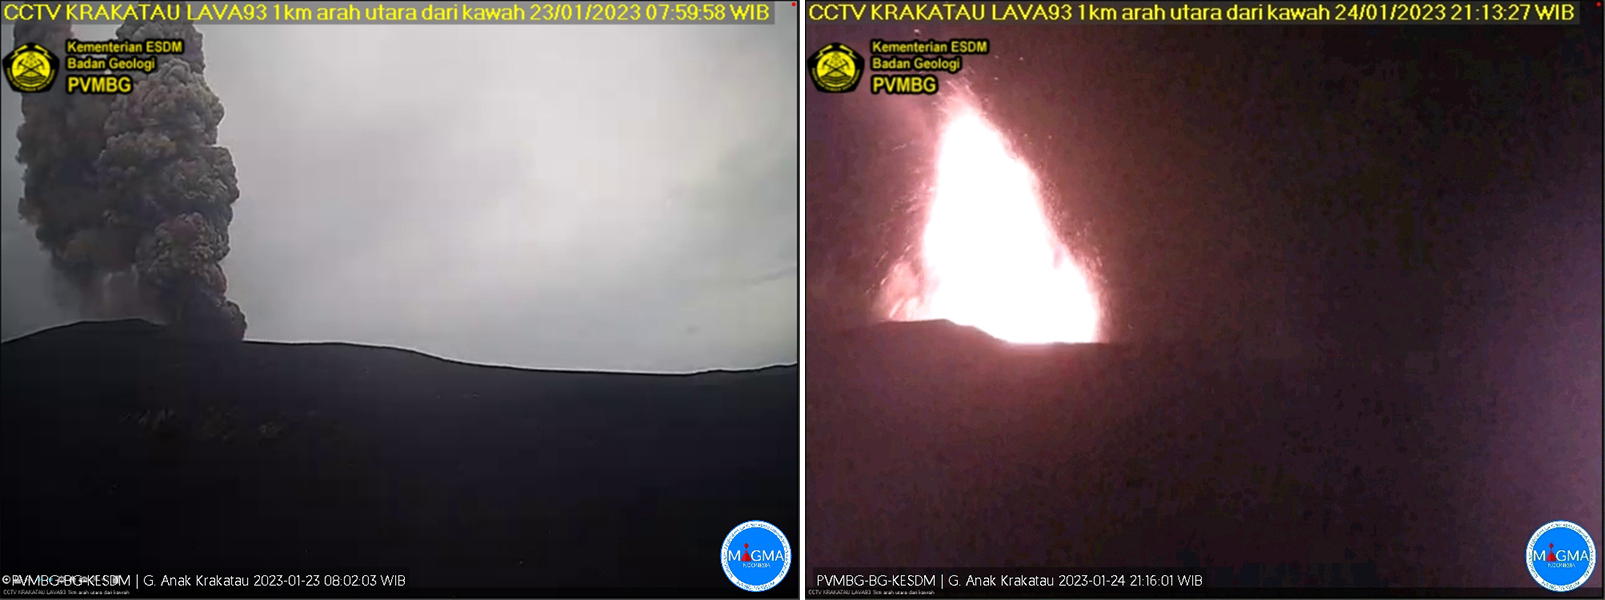
During January 2023 daily white gas-and-steam plumes rose 25-300 m above the summit and drifted in multiple directions. Gray-to-brown ash plumes were reported at 1638 on 3 January, at 1410 and 1509 on 4 January, and at 0013 on 5 January that rose 100-750 m above the summit and drifted NE and E; the gray-to-black ash plume at 1509 on 4 January rose as high as 3 km above the summit and drifted E. Gray ash plumes were recorded at 1754, 2241, and 2325 on 11 January and at 0046 on 12 January and rose 200-300 m above the summit and drifted NE. Toward the end of January, PVMBG reported that activity had intensified; Strombolian activity was visible in webcam images taken at 0041, 0043, and 0450 on 23 January. Multiple gray ash plumes throughout the day rose 200-500 m above the summit and drifted E and SE (figure 135). Webcam images showed progressively intensifying Strombolian activity at 1919, 1958, and 2113 on 24 January; a gray ash plume at 1957 rose 300 m above the summit and drifted E (figure 135). Eruptive events at 0231 and 2256 on 25 January and at 0003 on 26 January ejected incandescent material from the vent, based on webcam images. Gray ash plumes observed during 26-27 January rose 300-500 m above the summit and drifted NE, E, and SE.
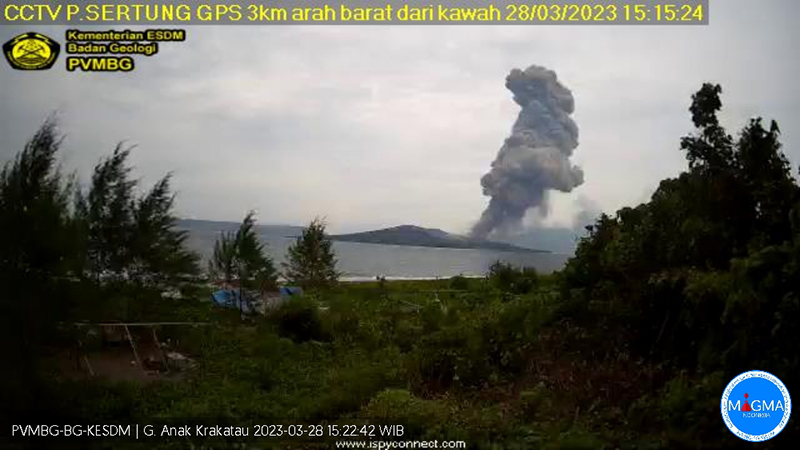
Low levels of activity were reported during February and March. Daily white gas-and-steam plumes rose 25-300 m above the summit and drifted in different directions. The Darwin VAAC reported that continuous ash emissions rose to 1.5-1.8 km altitude and drifted W and NW during 1240-1300 on 10 March, based on satellite images, weather models, and PVMBG webcams. White-and-gray ash plumes rose 500 m and 300 m above the summit and drifted SW at 1446 and 1846 on 18 March, respectively. An eruptive event was recorded at 2143, though it was not visible due to darkness. Multiple ash plumes were reported during 27-29 March that rose as high as 2.5 km above the summit and drifted NE, W, and SW (figure 136). Webcam images captured incandescent ejecta above the vent at 0415 and around the summit area at 2003 on 28 March and at 0047 above the vent on 29 March.
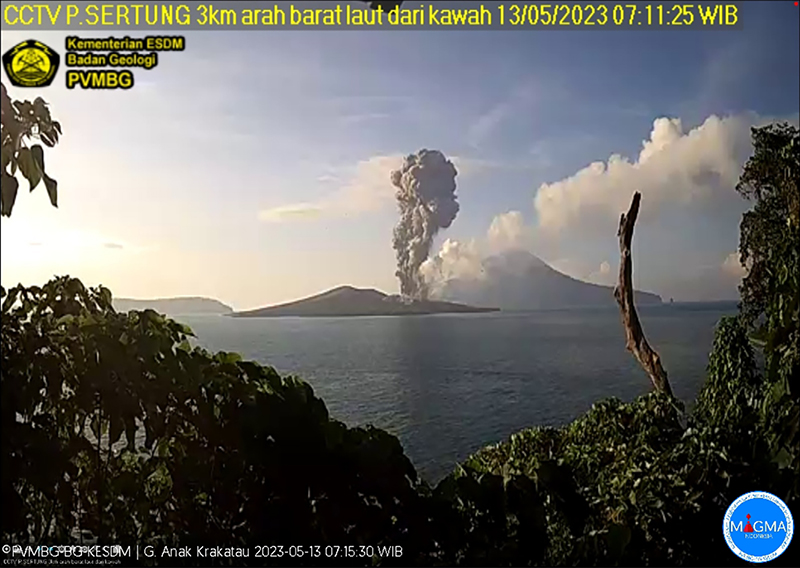
Daily white gas-and-steam plumes rose 25-300 m above the summit and drifted in multiple directions during April and May. White-and-gray and black plumes rose 50-300 m above the summit on 2 and 9 April. On 11 May at 1241 a gray ash plume rose 1-3 km above the summit and drifted SW. On 12 May at 0920 a gray ash plume rose 2.5 km above the summit and drifted SW and at 2320 an ash plume rose 1.5 km above the summit and drifted SW. An accompanying webcam image showed incandescent ejecta. On 13 May at 0710 a gray ash plume rose 2 km above the summit and drifted SW (figure 137).
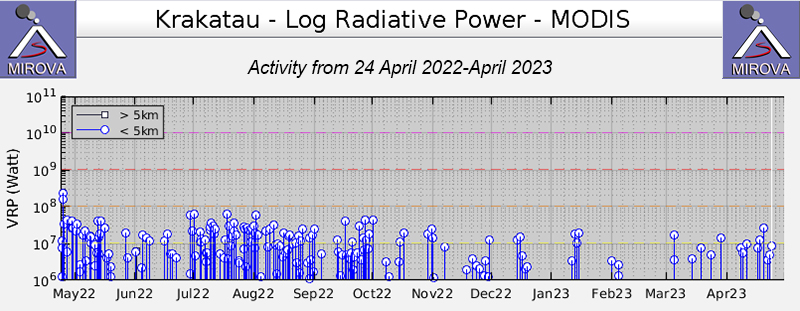
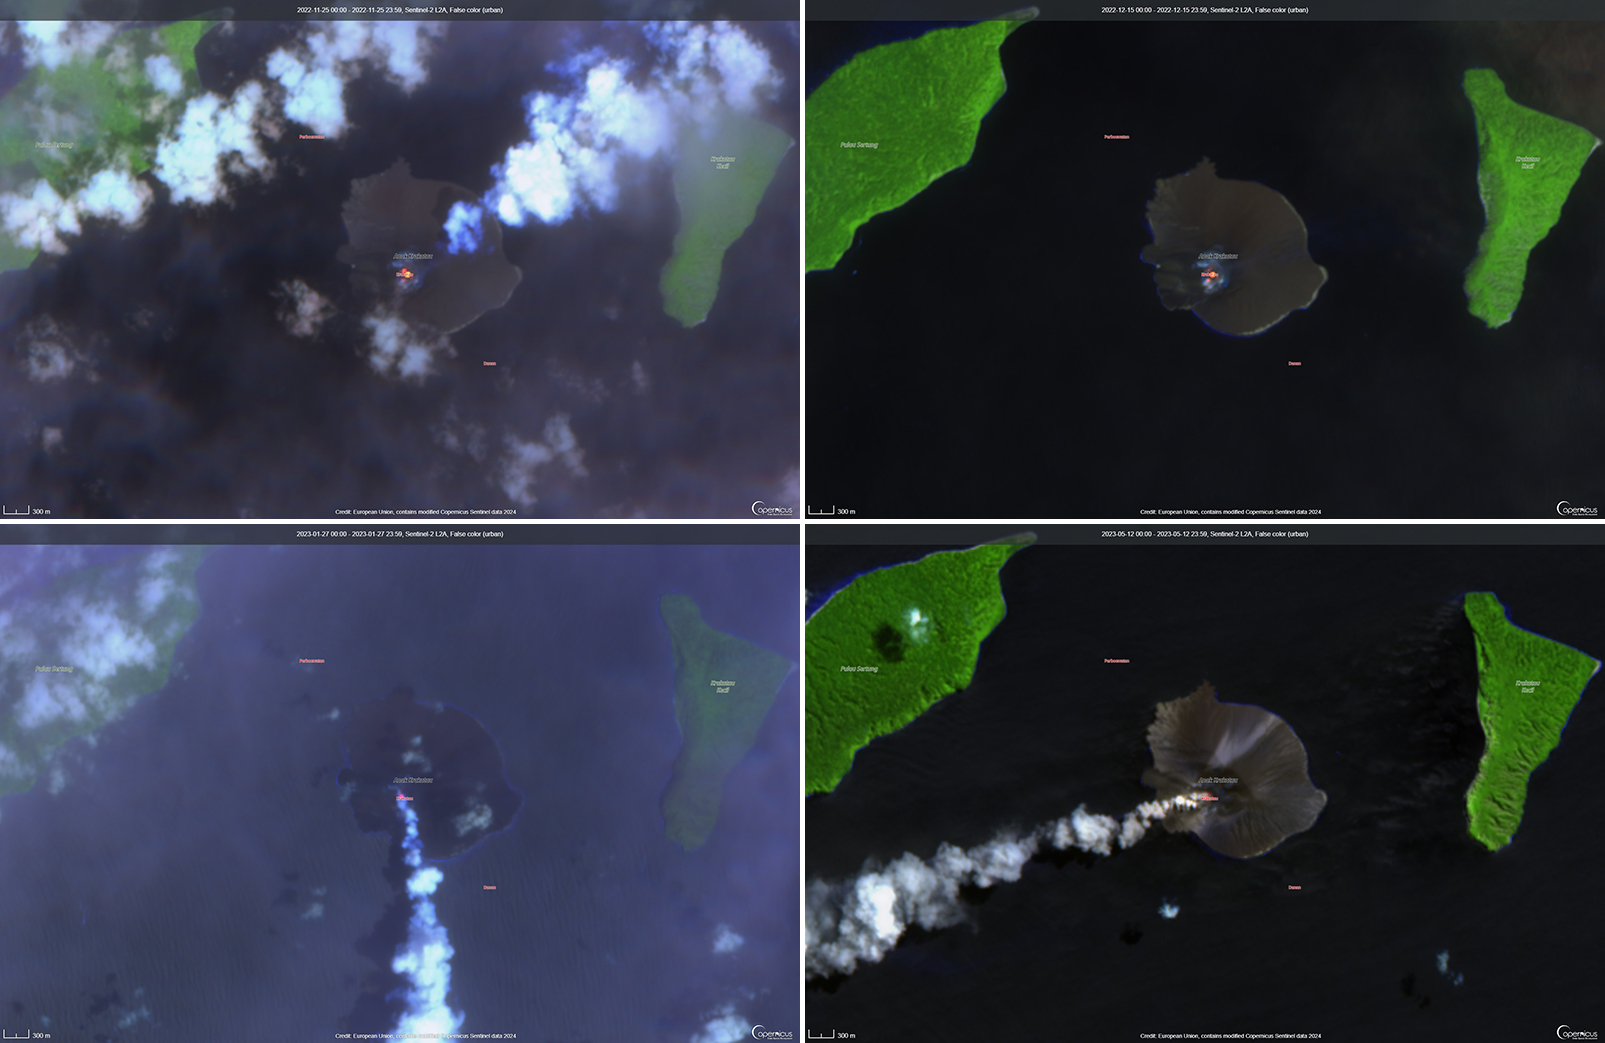
The MIROVA (Middle InfraRed Observation of Volcanic Activity) graph of MODIS thermal anomaly data showed intermittent low-to-moderate power thermal anomalies during November 2022 through April 2023 (figure 138). Some of this thermal activity was also visible in infrared satellite imagery at the crater, accompanied by gas-and-steam and ash plumes that drifted in different directions (figure 139).
Geologic Background. The renowned Krakatau (frequently mis-named as Krakatoa) volcano lies in the Sunda Strait between Java and Sumatra. Collapse of an older edifice, perhaps in 416 or 535 CE, formed a 7-km-wide caldera. Remnants of that volcano are preserved in Verlaten and Lang Islands; subsequently the Rakata, Danan, and Perbuwatan cones were formed, coalescing to create the pre-1883 Krakatau Island. Caldera collapse during the catastrophic 1883 eruption destroyed Danan and Perbuwatan, and left only a remnant of Rakata. This eruption caused more than 36,000 fatalities, most as a result of tsunamis that swept the adjacent coastlines of Sumatra and Java. Pyroclastic surges traveled 40 km across the Sunda Strait and reached the Sumatra coast. After a quiescence of less than a half century, the post-collapse cone of Anak Krakatau (Child of Krakatau) was constructed within the 1883 caldera at a point between the former Danan and Perbuwatan cones. Anak Krakatau has been the site of frequent eruptions since 1927.
Information Contacts: Pusat Vulkanologi dan Mitigasi Bencana Geologi (PVMBG, also known as Indonesian Center for Volcanology and Geological Hazard Mitigation, CVGHM), Jalan Diponegoro 57, Bandung 40122, Indonesia (URL: http://www.vsi.esdm.go.id/); MAGMA Indonesia, Kementerian Energi dan Sumber Daya Mineral (URL: https://magma.esdm.go.id/v1); Darwin Volcanic Ash Advisory Centre (VAAC), Bureau of Meteorology, Northern Territory Regional Office, PO Box 40050, Casuarina, NT 0811, Australia (URL: http://www.bom.gov.au/info/vaac/); MIROVA (Middle InfraRed Observation of Volcanic Activity), a collaborative project between the Universities of Turin and Florence (Italy) supported by the Centre for Volcanic Risk of the Italian Civil Protection Department (URL: http://www.mirovaweb.it/); Copernicus Browser, Copernicus Data Space Ecosystem, European Space Agency (URL: https://dataspace.copernicus.eu/browser/).
Stromboli
Italy
38.789°N, 15.213°E; summit elev. 924 m
All times are local (unless otherwise noted)
Strombolian explosions and lava flows continue during January-April 2023
Stromboli, located in Italy, has exhibited nearly constant lava fountains for the past 2,000 years; recorded eruptions date back to 350 BCE. Eruptive activity occurs at the summit from multiple vents, which include a north crater area (N area) and a central-southern crater (CS area) on a terrace known as the ‘terrazza craterica’ at the head of the Sciara del Fuoco, a large scarp that runs from the summit down the NW side of the volcano-island. Activity typically consists of Strombolian explosions, incandescent ejecta, lava flows, and pyroclastic flows. Thermal and visual monitoring cameras are located on the nearby Pizzo Sopra La Fossa, above the terrazza craterica, and at multiple flank locations. The current eruption period has been ongoing since 1934 and recent activity has consisted of frequent Strombolian explosions and lava flows (BGVN 48:02). This report updates activity during January through April 2023 primarily characterized by Strombolian explosions and lava flows based on reports from Italy's Istituto Nazionale di Geofisica e Vulcanologia (INGV) and various satellite data.
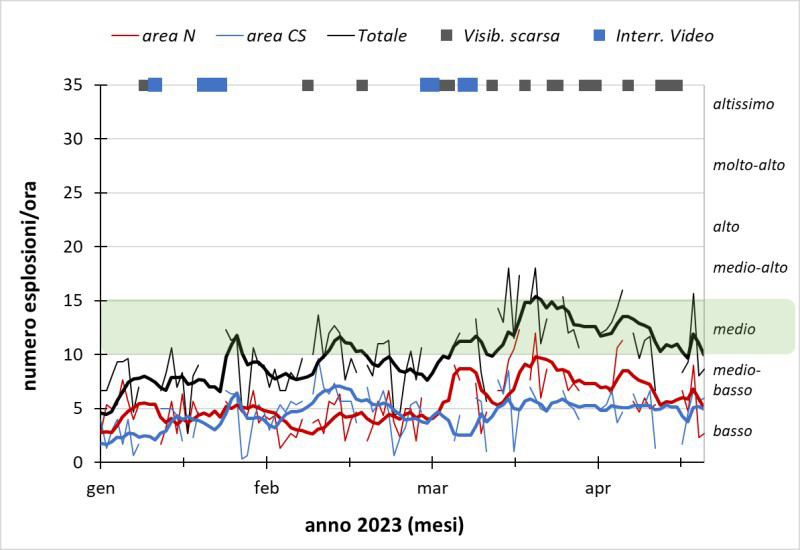
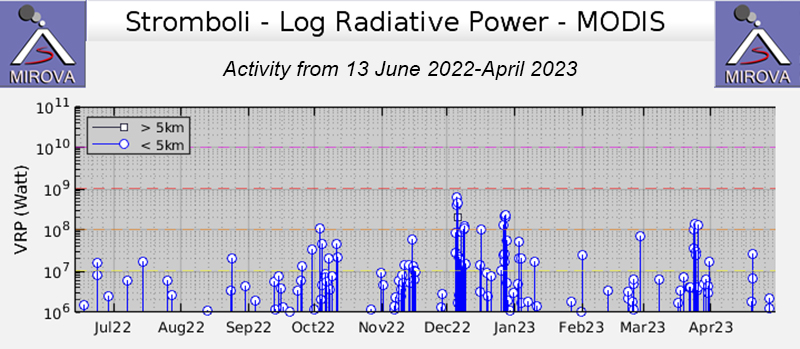
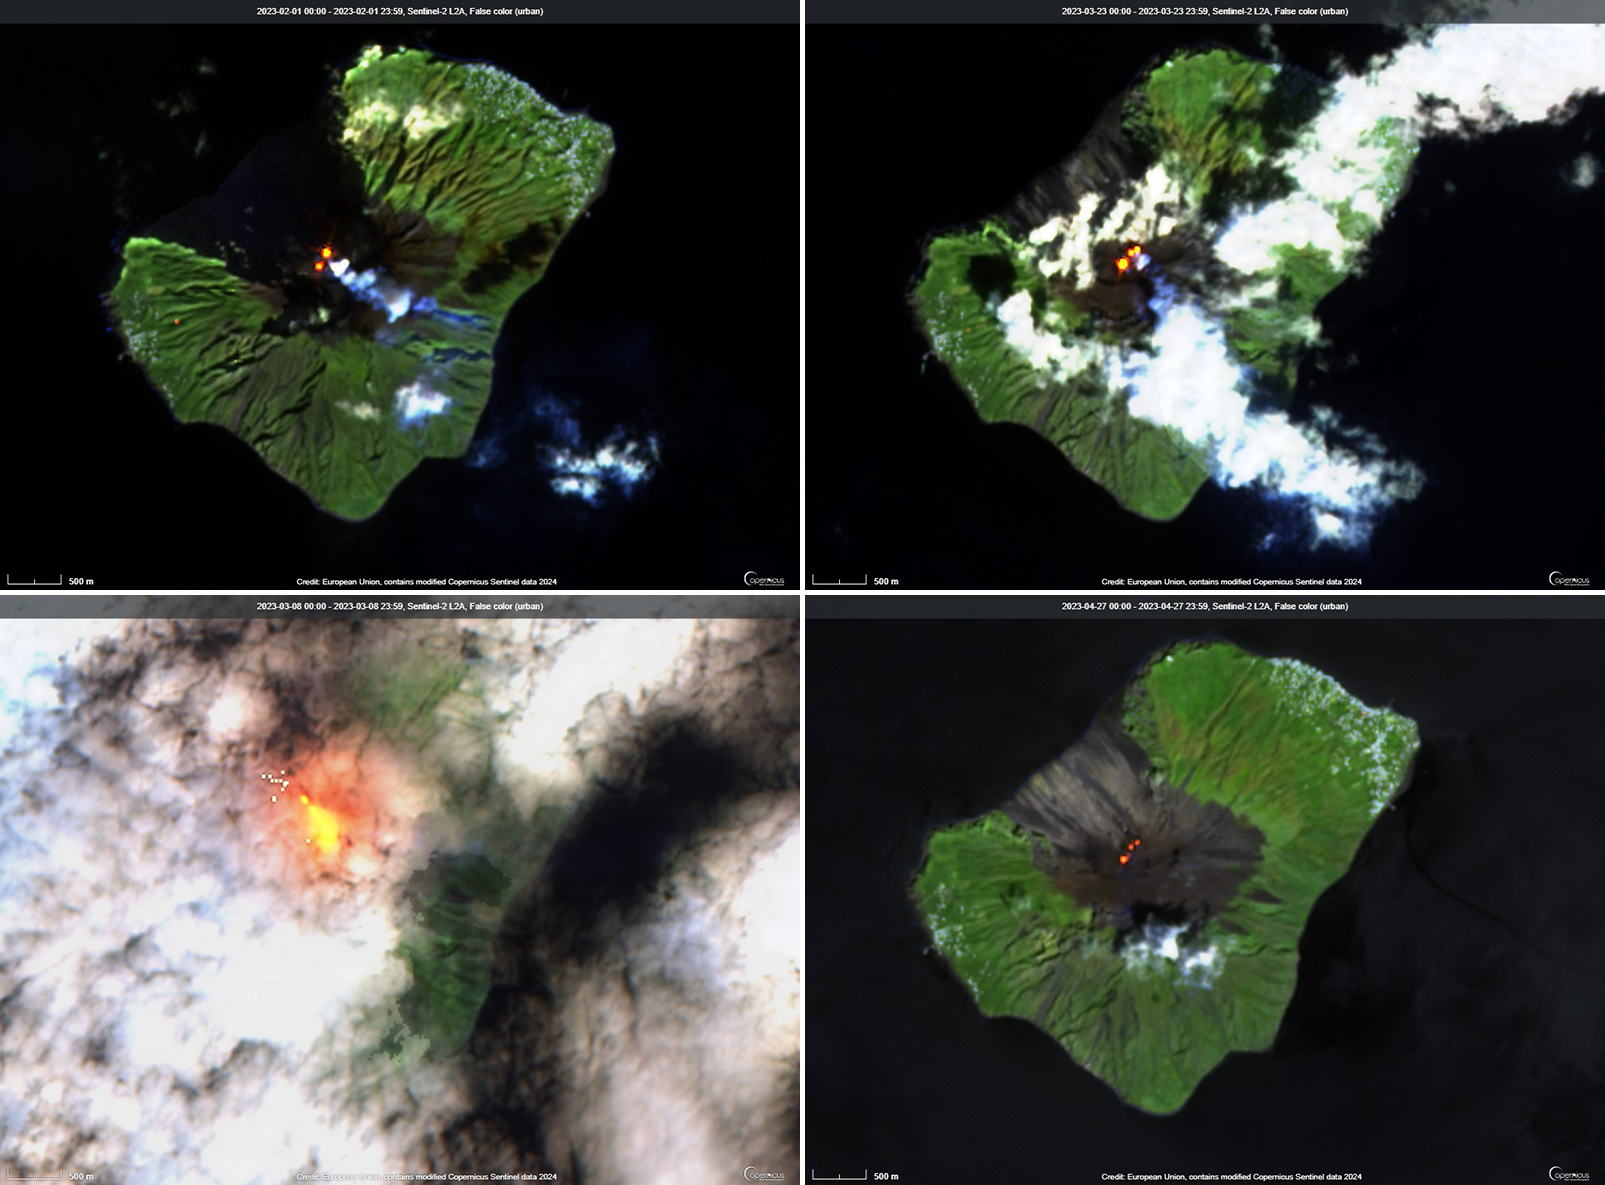
Frequent explosive activity continued throughout the reporting period, generally in the low-to-medium range, based on the number of hourly explosions in the summit crater (figure 253, table 16). Intermittent thermal activity was recorded by the MIROVA (Middle InfraRed Observation of Volcanic Activity) analysis of MODIS satellite data (figure 254). According to data collected by the MODVOLC thermal algorithm, a total of 9 thermal alerts were detected: one on 2 January 2023, one on 1 February, five on 24 March, and two on 26 March. The stronger pulses of thermal activity likely reflected lava flow events. Infrared satellite imagery captured relatively strong thermal hotspots at the two active summit craters on clear weather days, showing an especially strong event on 8 March (figure 255).
Table 16. Summary of type, frequency, and intensity of explosive activity at Stromboli by month during January-April 2023; information from webcam observations. Courtesy of INGV weekly reports.
| Month |
Explosive Activity |
| Jan 2023 |
Typical Strombolian activity with spattering and lava overflows in the N crater area. Explosions were reported from 4 vents in the N area and 1-2 vents in the CS area. The average hourly frequency of explosions was low-to-medium (1-12 events/hour). The intensity of the explosions varied from low (less than 80 m high) to medium (less than 150 m high) in the N crater area and up to high (greater than 150 m high) in the CS crater area. |
| Feb 2023 |
Typical Strombolian activity with spattering in the N crater area. Explosions were reported from 2-3 vents in the N area and 1-4 vents in the CS area. The average hourly frequency of explosions was low-to-medium (1-14 events/hour). The intensity of the explosions varied from low (less than 80 m high) to medium (less than 150 m high) in the N crater area and up to high (greater than 150 m high) in the CS crater area. |
| Mar 2023 |
Typical Strombolian activity with spattering and lava overflows in the N crater area. Explosions were reported from 2-3 vents in the N area and 2-4 vents in the CS area. The average hourly frequency of explosions was low-to-medium (1-18 events/hour). The intensity of the explosions varied from low (less than 80 m high) to medium (less than 150 m high) in the N crater area and up to high (greater than 150 m high) in the CS crater area. |
| Apr 2023 |
Typical Strombolian activity. Explosions were reported from 2 vents in the N area and 2-3 vents in the CS area. The average hourly frequency of explosions was low-to-high (1-16 events/hour). The intensity of the explosions varied from low (less than 80 m high) to medium (less than 150 m high) in both the N and CS crater areas. |
Activity during January-February 2023. Strombolian explosions were reported in the N crater area, as well as lava effusion. Explosive activity in the N crater area ejected coarse material (bombs and lapilli). Intense spattering was observed in both the N1 and N2 craters. In the CS crater area, explosions generally ejected fine material (ash), sometimes to heights greater than 250 m. The intensity of the explosions was characterized as low-to-medium in the N crater and medium-to-high in the CS crater. After intense spattering activity from the N crater area, a lava overflow began at 2136 on 2 January that flowed part way down the Sciara del Fuoco, possibly moving down the drainage that formed in October, out of view from webcams. The flow remained active for a couple of hours before stopping and beginning to cool. A second lava flow was reported at 0224 on 4 January that similarly remained active for a few hours before stopping and cooling. Intense spattering was observed on 11 and 13 January from the N1 crater. After intense spattering activity at the N2 crater at 1052 on 17 January another lava flow started to flow into the upper part of the Sciara del Fuoco (figure 256), dividing into two: one that traveled in the direction of the drainage formed in October, and the other one moving parallel to the point of emission. By the afternoon, the rate of the flow began to decrease, and at 1900 it started to cool. A lava flow was reported at 1519 on 24 January following intense spattering in the N2 area, which began to flow into the upper part of the Sciara del Fuoco. By the morning of 25 January, the lava flow had begun to cool. During 27 January the frequency of eruption in the CS crater area increased to 6-7 events/hour compared to the typical 1-7 events/hour; the following two days showed a decrease in frequency to less than 1 event/hour. Starting at 1007 on 30 January a high-energy explosive sequence was produced by vents in the CS crater area. The sequence began with an initial energetic pulse that lasted 45 seconds, ejecting predominantly coarse products 300 m above the crater that fell in an ESE direction. Subsequent and less intense explosions ejected material 100 m above the crater. The total duration of this event lasted approximately two minutes. During 31 January through 6, 13, and 24 February spattering activity was particularly intense for short periods in the N2 crater.
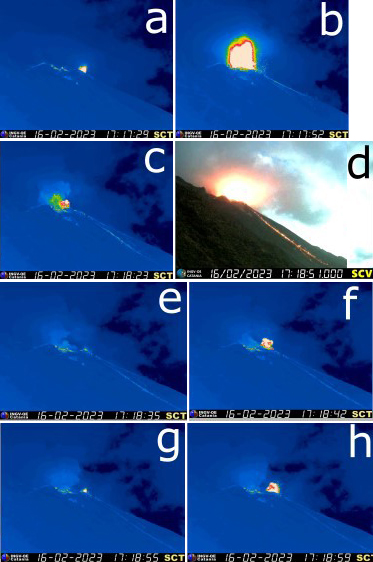
An explosive sequence was reported on 16 February that was characterized by a major explosion in the CS crater area (figure 257). The sequence began at 1817 near the S2 crater that ejected material radially. A few seconds later, lava fountains were observed in the central part of the crater. Three explosions of medium intensity (material was ejected less than 150 m high) were recorded at the S2 crater. The first part of this sequence lasted approximately one minute, according to INGV, and material rose 300 m above the crater and then was deposited along the Sciara del Fuoco. The second phase began at 1818 at the S1 crater; it lasted seven seconds and material was ejected 150 m above the crater. Another event 20 seconds later lasted 12 seconds, also ejecting material 150 m above the crater. The sequence ended with at least three explosions of mostly fine material from the S1 crater. The total duration of this sequence was about two minutes.
Short, intense spattering activity was noted above the N1 crater on 27 and 28 February. A lava overflow was first reported at 0657 from the N2 crater on 27 February that flowed into the October 2022 drainage. By 1900 the flow had stopped. A second lava overflow also in the N crater area occurred at 2149, which overlapped the first flow and then stopped by 0150 on 28 February. Material detached from both the lava overflows rolled down the Sciara del Fuoco, some of which was visible in webcam images.
Activity during March-April 2023. Strombolian activity continued with spattering activity and lava overflows in the N crater area during March. Explosive activity at the N crater area varied from low (less than 80 m high) to medium (less than 150 m high) and ejected coarse material, such as bombs and lapilli. Spattering was observed above the N1 crater, while explosive activity at the CS crater area varied from medium to high (greater than 150 m high) and ejected coarse material. Intense spattering activity was observed for short periods on 6 March above the N1 crater. At approximately 0610 a lava overflow was reported around the N2 crater on 8 March, which then flowed into the October 2022 drainage. By 1700 the flow started to cool. A second overflow began at 1712 on 9 March and overlapped the previous flow. It had stopped by 2100. Material from both flows was deposited along the Sciara del Fuoco, though much of the activity was not visible in webcam images. On 11 March a lava overflow was observed at 0215 that overlapped the two previous flows in the October 2022 drainage. By late afternoon on 12 March, it had stopped.
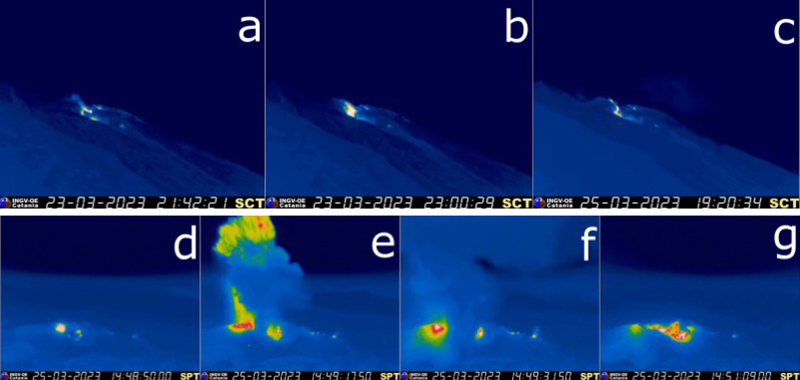
During a field excursion on 16 March, scientists noted that a vent in the central crater area was degassing. Another vent showed occasional Strombolian activity that emitted ash and lapilli. During 1200-1430 low-to-medium intense activity was reported; the N1 crater emitted ash emissions and the N2 crater emitted both ash and coarse material. Some explosions also occurred in the CS crater area that ejected coarse material. The C crater in the CS crater area occasionally showed gas jetting and low intensity explosions on 17 and 22 March; no activity was observed at the S1 crater. Intense, longer periods of spattering were reported in the N1 crater on 19, 24, and 25 March. Around 2242 on 23 March a lava overflow began from the N1 crater that, after about an hour, began moving down the October 2022 drainage and flow along the Sciara del Fuoco (figure 258). Between 0200 and 0400 on 26 March the flow rate increased, which generated avalanches of material from collapses at the advancing flow front. By early afternoon, the flow began to cool. On 25 March at 1548 an explosive sequence began from one of the vents at S2 in the CS crater area (figure 258). Fine ash mixed with coarse material was ejected 300 m above the crater rim and drifted SSE. Some modest explosions around Vent C were detected at 1549 on 25 March, which included an explosion at 1551 that ejected coarse material. The entire explosive sequence lasted approximately three minutes.
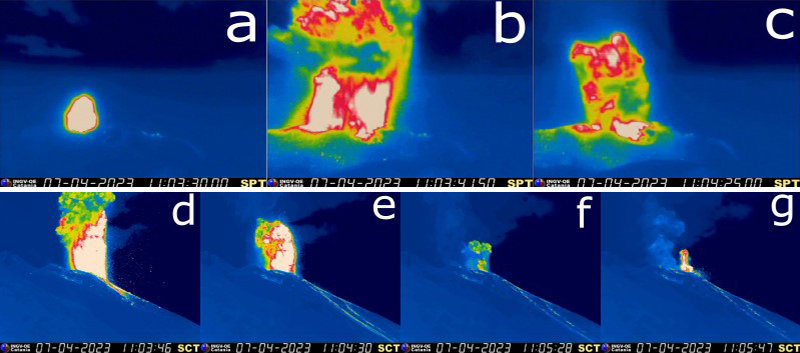
During April explosions persisted in both the N and CS crater areas. Fine material was ejected less than 80 m above the N crater rim until 6 April, followed by ejection of coarser material. Fine material was also ejected less than 80 m above the CS crater rim. The C and S2 crater did not show significant eruptive activity. On 7 April an explosive sequence was detected in the CS crater area at 1203 (figure 259). The first explosion lasted approximately 18 seconds and ejected material 400 m above the crater rim, depositing pyroclastic material in the upper part of the Sciara del Fuoco. At 1204 a second, less intense explosion lasted approximately four seconds and deposited pyroclastic products outside the crater area and near Pizzo Sopra La Fossa. A third explosion at 1205 was mainly composed of ash that rose about 150 m above the crater and lasted roughly 20 seconds. A fourth explosion occurred at 1205 about 28 seconds after the third explosion and ejected a mixture of coarse and fine material about 200 m above the crater; the explosion lasted roughly seven seconds. Overall, the entire explosive sequence lasted about two minutes and 20 seconds. After the explosive sequence on 7 April, explosions in both the N and CS crater areas ejected material as high as 150 m above the crater.
On 21 April research scientists from INGV made field observations in the summit area of Stromboli, and some lapilli samples were collected. In the N crater area near the N1 crater, a small cone was observed with at least two active vents, one of which was characterized by Strombolian explosions. The other vent produced explosions that ejected ash and chunks of cooled lava. At the N2 crater at least one vent was active and frequently emitted ash. In the CS crater area, a small cone contained 2-3 degassing vents and a smaller, possible fissure area also showed signs of degassing close to the Pizzo Sopra La Fossa. In the S part of the crater, three vents were active: a small hornito was characterized by modest and rare explosions, a vent that intermittently produced weak Strombolian explosions, and a vent at the end of the terrace that produced frequent ash emissions. Near the S1 crater there was a hornito that generally emitted weak gas-and-steam emissions, sometimes associated with “gas rings”. On 22 April another field inspection was carried out that reported two large sliding surfaces on the Sciara del Fuoco that showed where blocks frequently descended toward the sea. A thermal anomaly was detected at 0150 on 29 April.
Geologic Background. Spectacular incandescent nighttime explosions at Stromboli have long attracted visitors to the "Lighthouse of the Mediterranean" in the NE Aeolian Islands. This volcano has lent its name to the frequent mild explosive activity that has characterized its eruptions throughout much of historical time. The small island is the emergent summit of a volcano that grew in two main eruptive cycles, the last of which formed the western portion of the island. The Neostromboli eruptive period took place between about 13,000 and 5,000 years ago. The active summit vents are located at the head of the Sciara del Fuoco, a prominent scarp that formed about 5,000 years ago due to a series of slope failures which extends to below sea level. The modern volcano has been constructed within this scarp, which funnels pyroclastic ejecta and lava flows to the NW. Essentially continuous mild Strombolian explosions, sometimes accompanied by lava flows, have been recorded for more than a millennium.
Information Contacts: Istituto Nazionale di Geofisica e Vulcanologia (INGV), Sezione di Catania, Piazza Roma 2, 95123 Catania, Italy, (URL: http://www.ct.ingv.it/en/); MIROVA (Middle InfraRed Observation of Volcanic Activity), a collaborative project between the Universities of Turin and Florence (Italy) supported by the Centre for Volcanic Risk of the Italian Civil Protection Department (URL: http://www.mirovaweb.it/); Hawai'i Institute of Geophysics and Planetology (HIGP) - MODVOLC Thermal Alerts System, School of Ocean and Earth Science and Technology (SOEST), Univ. of Hawai'i, 2525 Correa Road, Honolulu, HI 96822, USA (URL: http://modis.higp.hawaii.edu/); Copernicus Browser, Copernicus Data Space Ecosystem, European Space Agency (URL: https://dataspace.copernicus.eu/browser/).
Nishinoshima (Japan) — July 2023  Cite this Report
Nishinoshima
Japan
27.247°N, 140.874°E; summit elev. 100 m
All times are local (unless otherwise noted)
Small ash plumes and fumarolic activity during November 2022 through April 2023
Nishinoshima is a small island located about 1,000 km S of Tokyo in the Ogasawara Arc in Japan. The island is the summit of a massive submarine volcano that has prominent peaks to the S, W, and NE. Eruptions date back to 1973; the most recent eruption period began in October 2022 and was characterized by ash plumes and fumarolic activity (BGVN 47:12). This report describes ash plumes and fumarolic activity during November 2022 through April 2023 based on monthly reports from the Japan Meteorological Agency (JMA) monthly reports and satellite data.
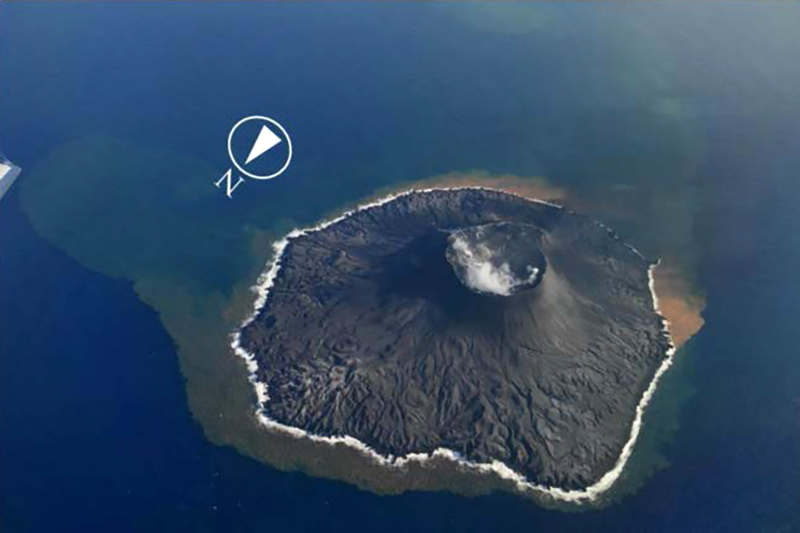
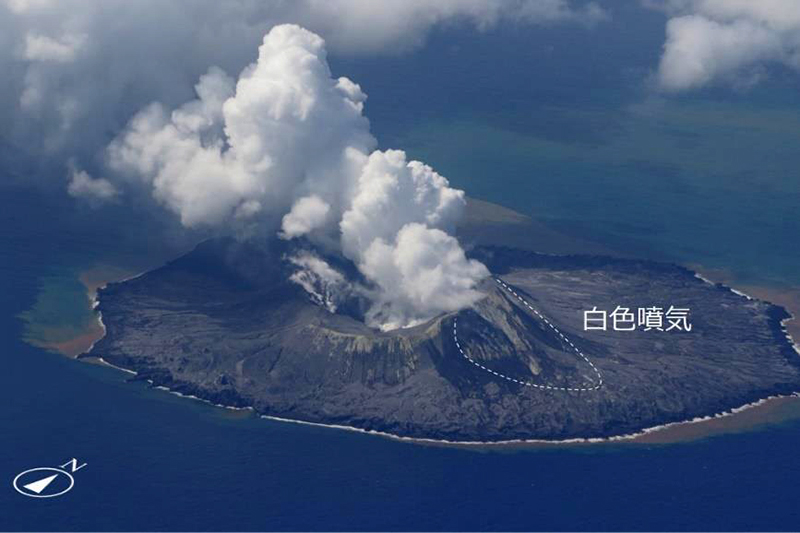
The most recent eruptive activity prior to the reporting internal occurred on 12 October 2022, when an ash plume rose 3.5 km above the crater rim. An aerial observation conducted by the Japan Coast Guard (JCG) on 25 November reported that white fumaroles rose approximately 200 m above the central crater of a pyroclastic cone (figure 119), and multiple plumes were observed on the ESE flank of the cone. Discolored water ranging from reddish-brown to brown and yellowish-green were visible around the perimeter of the island (figure 119). No significant activity was reported in December.
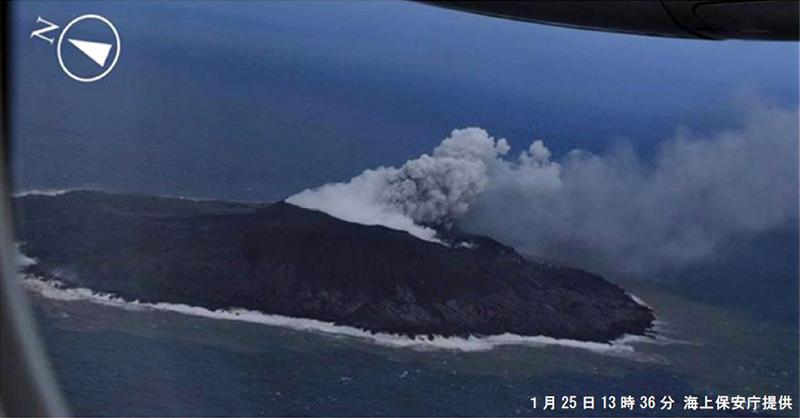
During an overflight conducted by JCG on 25 January 2023 intermittent activity and small, blackish-gray plumes rose 900 m above the central part of the crater were observed (figure 120). The fumarolic zone of the E flank and base of the cone had expanded and emissions had intensified. Dark brown discolored water was visible around the perimeter of the island.
No significant activity was reported during February through March. Ash plumes at 1050 and 1420 on 11 April rose 1.9 km above the crater rim and drifted NW and N. These were the first ash plumes observed since 12 October 2022. On 14 April JCG carried out an overflight and reported that no further eruptive activity was visible, although white gas-and-steam plumes were visible from the central crater and rose 900 m high (figure 121). Brownish and yellow-green discolored water surrounded the island.
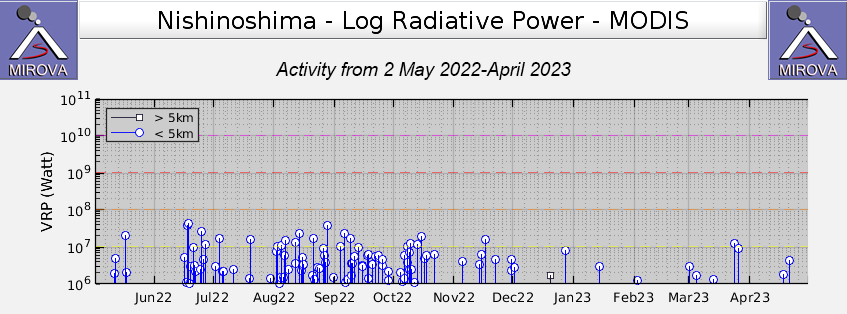
Intermittent low-to-moderate power thermal anomalies were recorded in the MIROVA graph (Middle InfraRed Observation of Volcanic Activity) during November 2022 through April 2023 (figure 123). A cluster of six to eight anomalies were detected during November while a smaller number were detected during the following months: two to three during December, one during mid-January 2023, one during February, five during March, and two during April. Thermal activity was also reflected in infrared satellite data at the summit crater, accompanied by occasional gas-and-steam plumes (figure 124).
Geologic Background. The small island of Nishinoshima was enlarged when several new islands coalesced during an eruption in 1973-74. Multiple eruptions that began in 2013 completely covered the previous exposed surface and continued to enlarge the island. The island is the summit of a massive submarine volcano that has prominent peaks to the S, W, and NE. The summit of the southern cone rises to within 214 m of the ocean surface 9 km SSE.
Information Contacts: Japan Meteorological Agency (JMA), 1-3-4 Otemachi, Chiyoda-ku, Tokyo 100-8122, Japan (URL: http://www.jma.go.jp/jma/indexe.html); MIROVA (Middle InfraRed Observation of Volcanic Activity), a collaborative project between the Universities of Turin and Florence (Italy) supported by the Centre for Volcanic Risk of the Italian Civil Protection Department (URL: http://www.mirovaweb.it/); Copernicus Browser, Copernicus Data Space Ecosystem, European Space Agency (URL: https://dataspace.copernicus.eu/browser/).
Karangetang (Indonesia) — July 2023  Cite this Report
Karangetang
Indonesia
2.781°N, 125.407°E; summit elev. 1797 m
All times are local (unless otherwise noted)
Lava flows, incandescent avalanches, and ash plumes during January-June 2023
Karangetang (also known as Api Siau), at the northern end of the island of Siau, Indonesia, contains five summit craters along a N-S line. More than 40 eruptions have been recorded since 1675; recent eruptions have included frequent explosive activity, sometimes accompanied by pyroclastic flows and lahars. Lava dome growth has occurred in the summit craters and collapses of lava flow fronts have produced pyroclastic flows. The two active summit craters are Kawah Dua (the N crater) and Kawah Utama (the S crater, also referred to as the “Main Crater”). The most recent eruption began in late November 2018 and has more recently consisted of weak thermal activity and gas-and-steam emissions (BGVN 48:01). This report updates activity characterized by lava flows, incandescent avalanches, and ash plumes during January through June 2023 using reports from Pusat Vulkanologi dan Mitigasi Bencana Geologi (PVMBG, also known as CVGHM, or the Center of Volcanology and Geological Hazard Mitigation), MAGMA Indonesia, the Darwin VAAC (Volcano Ash Advisory Center), and satellite data.
Activity during January was relatively low and mainly consisted of white gas-and-steam emissions that rose 25-150 m above Main Crater (S crater) and drifted in different directions. Incandescence was visible from the lava dome in Kawah Dua (the N crater). Weather conditions often prevented clear views of the summit. On 18 January the number of seismic signals that indicated avalanches of material began to increase. In addition, there were a total of 71 earthquakes detected during the month.
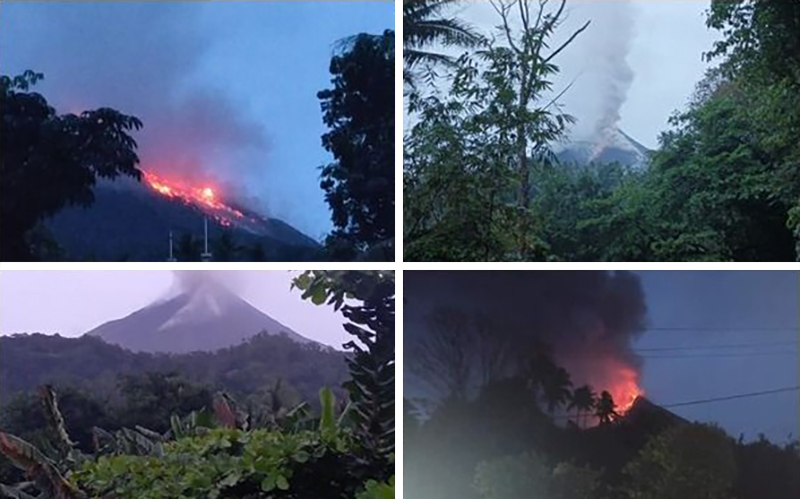
Activity continued to increase during the first week of February. Material from Main Crater traveled as far as 800 m down the Batuawang (S) and Batang (W) drainages and as far as 1 km W down the Beha (W) drainage on 4 February. On 6 February 43 earthquake events were recorded, and on 7 February, 62 events were recorded. White gas-and-steam emissions rose 25-250 m above both summit craters throughout the month. PVMBG reported an eruption began during the evening of 8 February around 1700. Photos showed incandescent material at Main Crater. Incandescent material had also descended the flank in at least two unconfirmed directions as far as 2 km from Main Crater, accompanied by ash plumes (figure 60). As a result, PVMBG increased the Volcano Alert Level (VAL) to 3 (the second highest level on a 1-4 scale).
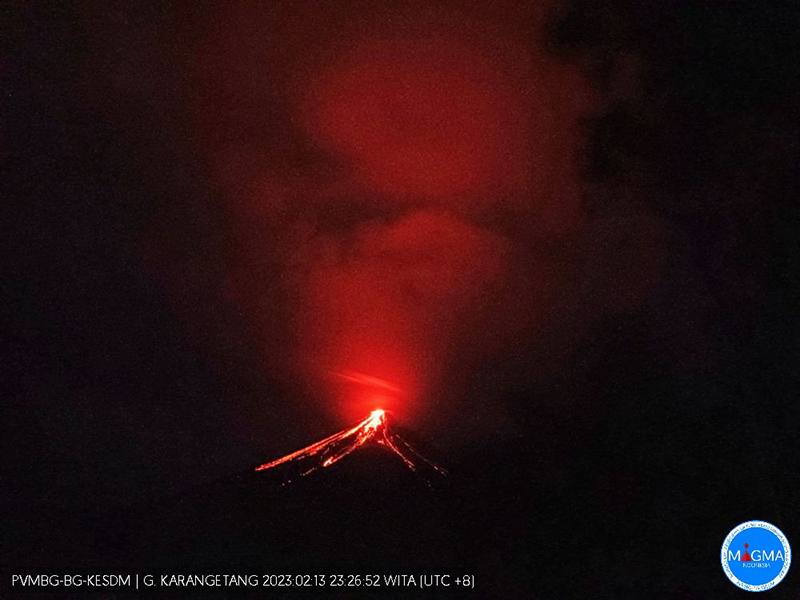
Occasional nighttime webcam images showed three main incandescent lava flows of differing lengths traveling down the S, SW, and W flanks (figure 61). Incandescent rocks were visible on the upper flanks, possibly from ejected or collapsed material from the crater, and incandescence was the most intense at the summit. Based on analyses of satellite imagery and weather models, the Darwin VAAC reported that daily ash plumes during 16-20 February rose to 2.1-3 km altitude and drifted NNE, E, and SE. BNPB reported on 16 February that as many as 77 people were evacuated and relocated to the East Siau Museum. A webcam image taken at 2156 on 17 February possibly showed incandescent material descending the SE flank. Ash plumes rose to 2.1 km altitude and drifted SE during 22-23 February, according to the Darwin VAAC.
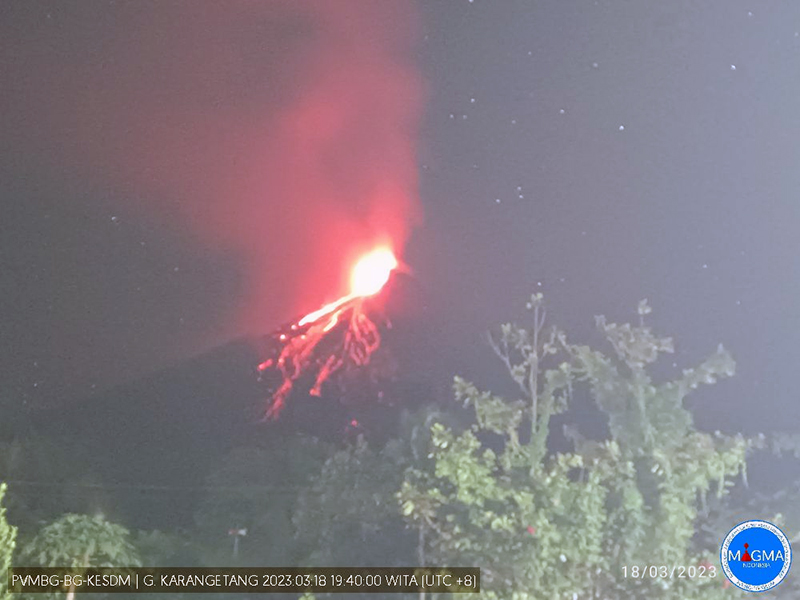
Incandescent avalanches of material and summit incandescence at Main Crater continued during March. White gas-and-steam emissions during March generally rose 25-150 m above the summit crater; on 31 March gas-and-steam emissions rose 200-400 m high. An ash plume rose to 2.4 km altitude and drifted S at 1710 on 9 March and a large thermal anomaly was visible in images taken at 0550 and 0930 on 10 March. Incandescent material was visible at the summit and on the flanks based on webcam images taken at 0007 and 2345 on 16 March, at 1828 on 17 March, at 1940 on 18 March, at 2311 on 19 March, and at 2351 on 20 March. Incandescence was most intense on 18 and 20 March and webcam images showed possible Strombolian explosions (figure 62). An ash plume rose to 2.4 km altitude and drifted SW on 18 March, accompanied by a thermal anomaly.
Summit crater incandescence at Main Crater and on the flanks persisted during April. Incandescent material at the S crater and on the flanks was reported at 0016 on 1 April. The lava flows had stopped by 1 April according to PVMBG, although incandescence was still visible up to 10 m high. Seismic signals indicating effusion decreased and by 6 April they were no longer detected. Incandescence was visible from both summit craters. On 26 April the VAL was lowered to 2 (the second lowest level on a 1-4 scale). White gas-and-steam emissions rose 25-200 m above the summit crater.
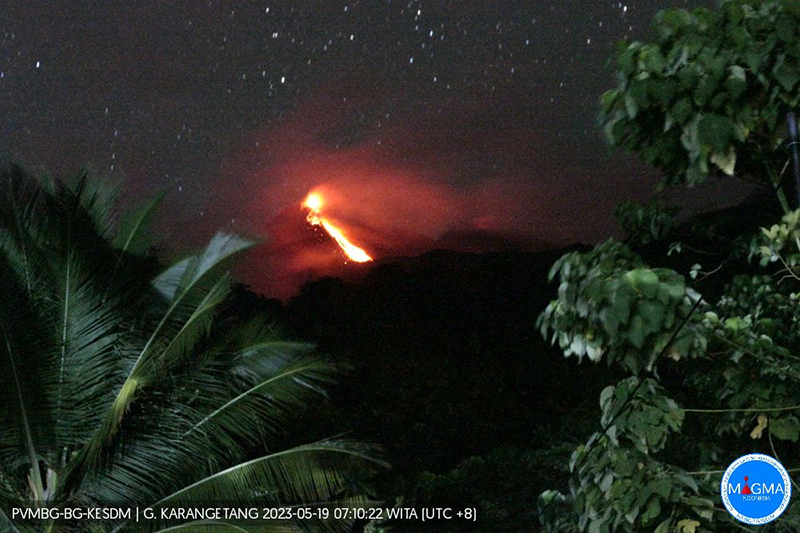
During May white gas-and-steam emissions generally rose 50-250 m above the summit, though it was often cloudy, which prevented clear views; on 21 May gas-and-steam emissions rose 50-400 m high. Nighttime N summit crater incandescence rose 10-25 m above the lava dome, and less intense incandescence was noted above Main Crater, which reached about 10 m above the dome. Sounds of falling rocks at Main Crater were heard on 15 May and the seismic network recorded 32 rockfall events in the crater on 17 May. Avalanches traveled as far as 1.5 km down the SW and S flanks, accompanied by rumbling sounds on 18 May. Incandescent material descending the flanks was captured in a webcam image at 2025 on 19 May (figure 63) and on 29 May; summit crater incandescence was observed in webcam images at 2332 on 26 May and at 2304 on 29 May. On 19 May the VAL was again raised to 3.
Occasional Main Crater incandescence was reported during June, as well as incandescent material on the flanks. White gas-and-steam emissions rose 10-200 m above the summit crater. Ash plumes rose to 2.1 km altitude and drifted SE and E during 2-4 June, according to the Darwin VAAC. Material on the flanks of Main Crater were observed at 2225 on 7 June, at 2051 on 9 June, at 0007 on 17 June, and at 0440 on 18 June. Webcam images taken on 21, 25, and 27 June showed incandescence at Main Crater and from material on the flanks.
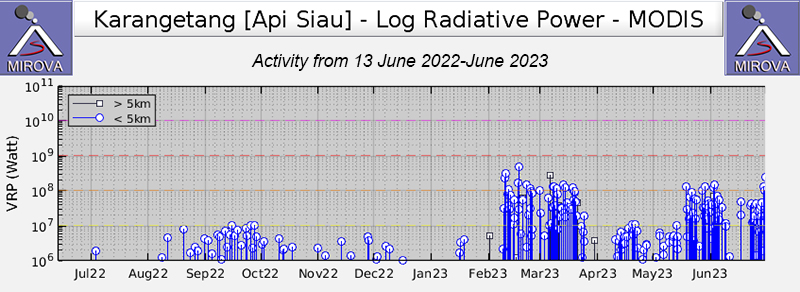
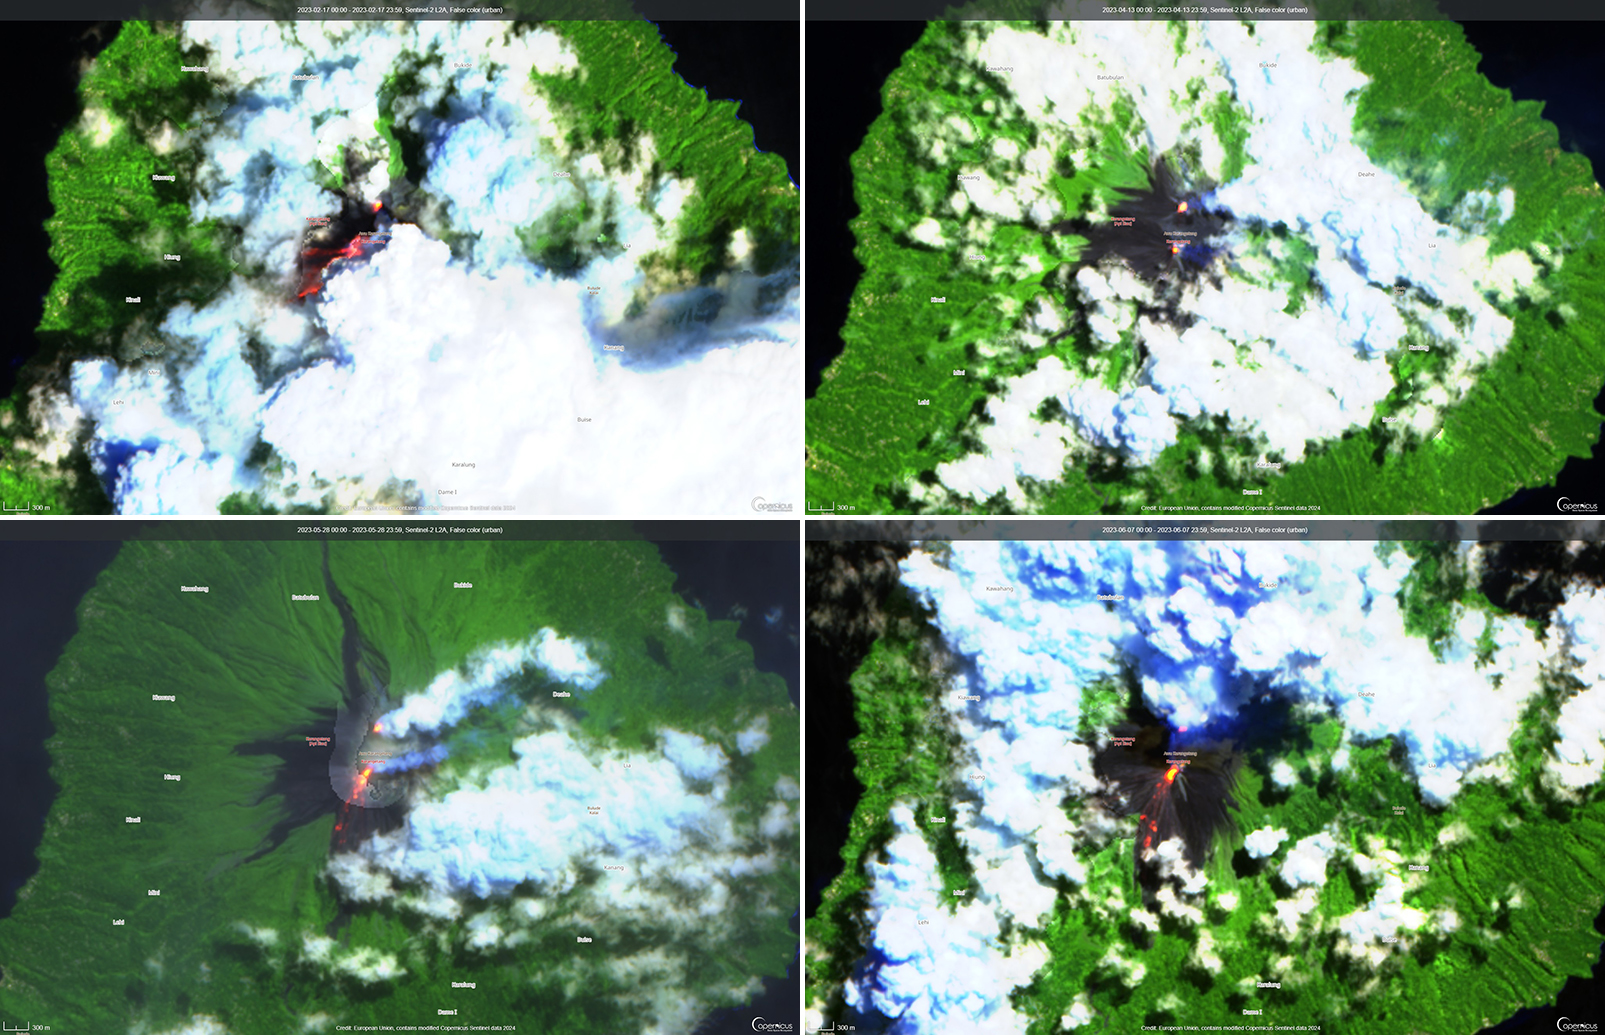
MIROVA (Middle InfraRed Observation of Volcanic Activity) analysis of MODIS satellite data showed strong thermal activity during mid-February through March and mid-May through June, which represented incandescent avalanches and lava flows (figure 64). During April through mid-May the power of the anomalies decreased but frequent anomalies were still detected. Brief gaps in activity occurred during late March through early April and during mid-June. Infrared satellite images showed strong lava flows mainly affecting the SW and S flanks, accompanied by gas-and-steam emissions (figure 65). According to data recorded by the MODVOLC thermal algorithm, there were a total of 79 thermal hotspots detected: 28 during February, 24 during March, one during April, five during May, and 21 during June.
Geologic Background. Karangetang (Api Siau) volcano lies at the northern end of the island of Siau, about 125 km NNE of the NE-most point of Sulawesi. The stratovolcano contains five summit craters along a N-S line. It is one of Indonesia's most active volcanoes, with more than 40 eruptions recorded since 1675 and many additional small eruptions that were not documented (Neumann van Padang, 1951). Twentieth-century eruptions have included frequent explosive activity sometimes accompanied by pyroclastic flows and lahars. Lava dome growth has occurred in the summit craters; collapse of lava flow fronts have produced pyroclastic flows.
Information Contacts: Pusat Vulkanologi dan Mitigasi Bencana Geologi (PVMBG, also known as Indonesian Center for Volcanology and Geological Hazard Mitigation, CVGHM), Jalan Diponegoro 57, Bandung 40122, Indonesia (URL: http://www.vsi.esdm.go.id/); MAGMA Indonesia, Kementerian Energi dan Sumber Daya Mineral (URL: https://magma.esdm.go.id/v1); Badan Nasional Penanggulangan Bencana (BNPB), National Disaster Management Agency, Graha BNPB - Jl. Scout Kav.38, East Jakarta 13120, Indonesia (URL: http://www.bnpb.go.id/); Darwin Volcanic Ash Advisory Centre (VAAC), Bureau of Meteorology, Northern Territory Regional Office, PO Box 40050, Casuarina, NT 0811, Australia (URL: http://www.bom.gov.au/info/vaac/); MIROVA (Middle InfraRed Observation of Volcanic Activity), a collaborative project between the Universities of Turin and Florence (Italy) supported by the Centre for Volcanic Risk of the Italian Civil Protection Department (URL: http://www.mirovaweb.it/); Hawai'i Institute of Geophysics and Planetology (HIGP) - MODVOLC Thermal Alerts System, School of Ocean and Earth Science and Technology (SOEST), Univ. of Hawai'i, 2525 Correa Road, Honolulu, HI 96822, USA (URL: http://modis.higp.hawaii.edu/); Copernicus Browser, Copernicus Data Space Ecosystem, European Space Agency (URL: https://dataspace.copernicus.eu/browser/); IDN Times, Jl. Jend. Gatot Subroto Kav. 27 3rd Floor Kuningan, Jakarta, Indonesia 12950, Status of Karangetang Volcano in Sitaro Islands Increases (URL: https://sulsel.idntimes.com/news/indonesia/savi/status-gunung-api-karangetang-di-kepulauan-sitaro-meningkat?page=all).
Ahyi (United States) — July 2023  Cite this Report
Ahyi
United States
20.42°N, 145.03°E; summit elev. -75 m
All times are local (unless otherwise noted)
Intermittent hydroacoustic signals and discolored plumes during November 2022-June 2023
Ahyi seamount is a large, conical submarine volcano that rises to within 75 m of the ocean surface about 18 km SE of the island of Farallon de Pajaros in the Northern Marianas. The remote location of the seamount has made eruptions difficult to document, but seismic stations installed in the region confirmed an eruption in the vicinity in 2001. No new activity was detected until April-May 2014 when an eruption was detected by NOAA (National Oceanic and Atmospheric Administration) divers, hydroacoustic sensors, and seismic stations (BGVN 42:04). New activity was first detected on 15 November by hydroacoustic sensors that were consistent with submarine volcanic activity. This report covers activity during November 2022 through June 2023 based on daily and weekly reports from the US Geological Survey.
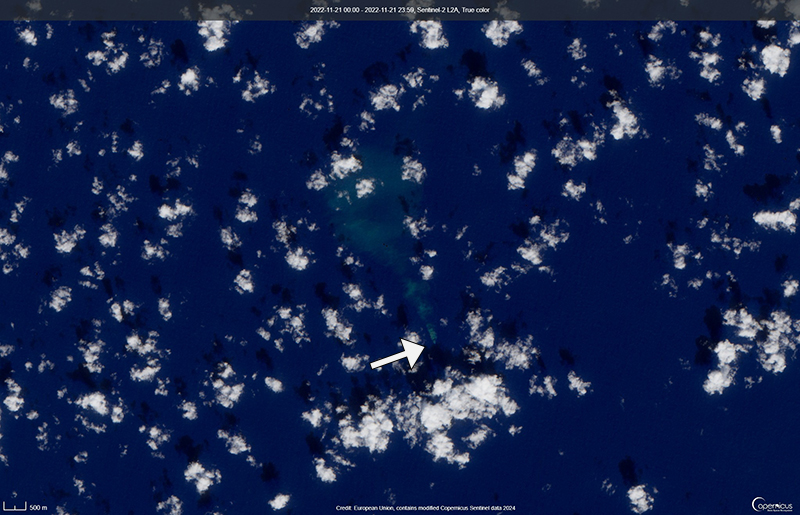
Starting in mid-October, hydroacoustic sensors at Wake Island (2.2 km E) recorded signals consistent with submarine volcanic activity, according to a report from the USGS issued on 15 November 2022. A combined analysis of the hydroacoustic signals and seismic stations located at Guam and Chichijima Island, Japan, suggested that the source of this activity was at or near the Ahyi seamount. After a re-analysis of a satellite image of the area that was captured on 6 November, USGS confirmed that there was no evidence of discoloration at the ocean surface. Few hydroacoustic and seismic signals continued through November, including on 18 November, which USGS suggested signified a decline or pause in unrest. A VONA (Volcano Observatory Notice for Aviation) reported that a discolored water plume was persistently visible in satellite data starting on 18 November (figure 6). Though clouds often obscured clear views of the volcano, another discolored water plume was captured in a satellite image on 26 November. The Aviation Color Code (ACC) was raised to Yellow (the second lowest level on a four-color scale) and the Volcano Alert Level (VAL) was raised to Advisory (the second lowest level on a four-level scale) on 29 November.
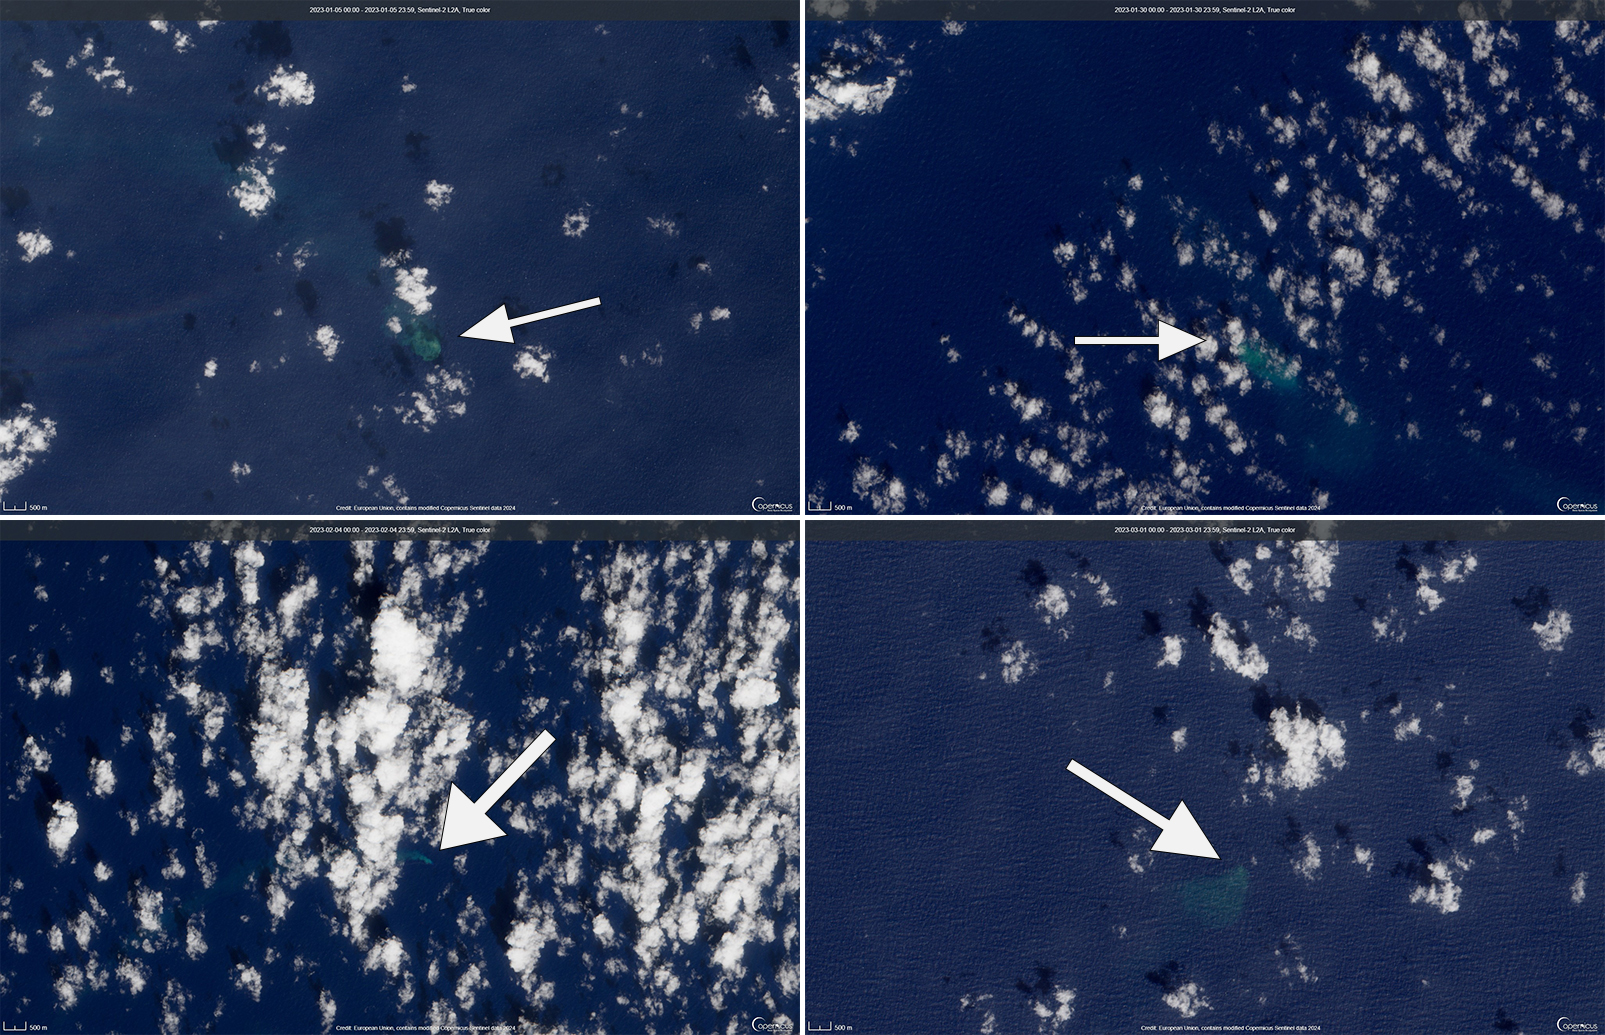
During December, occasional detections were recorded on the Wake Island hydrophone sensors and discolored water over the seamount remained visible. During 2-7, 10-12, and 16-31 December possible explosion signals were detected. A small area of discolored water was observed in high-resolution Sentinel-2 satellite images during 1-6 December (figure 7). High-resolution satellite images recorded discolored water plumes on 13 December that originated from the summit region; no observations indicated that activity breached the ocean surface. A possible underwater plume was visible in satellite images on 18 December, and during 19-20 December a definite but diffuse underwater plume located SSE from the main vent was reported. An underwater plume was visible in a satellite image taken on 26 December (figure 7).
Hydrophone sensors continued to detect signals consistent with possible explosions during 1-8 January 2023. USGS reported that the number of detections decreased during 4-5 January. The hydrophone sensors experienced a data outage that started at 0118 on 8 January and continued through 10 January, though according to USGS, possible explosions were recorded prior to the data outage and likely continued during the outage. A discolored water plume originating from the summit region was detected in a partly cloudy satellite image on 8 January. On 11-12 and 15-17 January possible explosion signals were recorded again. One small signal was detected during 22-23 January and several signals were recorded on 25 and 31 January. During 27-31 January a plume of discolored water was observed above the seamount in satellite imagery (figure 8).
Low levels of activity continued during February and March, based on data from pressure sensors on Wake Island. During 1 and 4-6 February activity was reported, and a submarine plume was observed on 4 February (figure 8). Possible explosion signals were detected during 7-8, 10, 13-14, and 24 February. During 1-2 and 3-5 March a plume of discolored water was observed in satellite imagery (figure 8). Almost continuous hydroacoustic signals were detected in remote pressure sensor data on Wake Island 2,270 km E from the volcano during 7-13 March. During 12-13 March water discoloration around the seamount was observed in satellite imagery, despite cloudy weather. By 14 March discolored water extended about 35 km, but no direction was noted. USGS reported that the continuous hydroacoustic signals detected during 13-14 March stopped abruptly on 14 March and no new detections were observed. Three 30 second hydroacoustic detections were reported during 17-19 March, but no activity was visible due to cloudy weather. A data outage was reported during 21-22 March, making pressure sensor data unavailable; a discolored water plume was, however, visible in satellite data. A possible underwater explosion signal was detected by pressure sensors at Wake Island on 26, 29, and 31 March, though the cause and origin of these events were unclear.
Similar low activity continued during April, May, and June. Several signals were detected during 1-3 April in pressure sensors at Wake Island. USGS suggested that these may be related to underwater explosions or earthquakes at the volcano, but no underwater plumes were visible in clear satellite images. The pressure sensors had data outages during 12-13 April and no data were recorded; no underwater plumes were visible in satellite images, although cloudy weather obscured most clear views. Eruptive activity was reported starting at 2210 on 21 May. On 22 May a discolored water plume that extended 4 km was visible in satellite images, though no direction was recorded. During 23-24 May some signals were detected by the underwater pressure sensors. Possible hydroacoustic signals were detected during 2-3 and 6-8 June. Multiple hydroacoustic signals were detected during 9-11 and 16-17 June, although no activity was visible in satellite images. One hydroacoustic signal was detected during 23-24 June, but there was some uncertainty about its association with volcanic activity. A single possible hydroacoustic signal was detected during 30 June to 1 July.
Geologic Background. Ahyi seamount is a large conical submarine volcano that rises to within 75 m of the ocean surface ~18 km SE of the island of Farallon de Pajaros in the northern Marianas. Water discoloration has been observed there, and in 1979 the crew of a fishing boat felt shocks over the summit area, followed by upwelling of sulfur-bearing water. On 24-25 April 2001 an explosive eruption was detected seismically by a station on Rangiroa Atoll, Tuamotu Archipelago. The event was well constrained (+/- 15 km) at a location near the southern base of Ahyi. An eruption in April-May 2014 was detected by NOAA divers, hydroacoustic sensors, and seismic stations.
Information Contacts: US Geological Survey, Volcano Hazards Program (USGS-VHP), 12201 Sunrise Valley Drive, Reston, VA, USA, https://volcanoes.usgs.gov/index.html; Copernicus Browser, Copernicus Data Space Ecosystem, European Space Agency (URL: https://dataspace.copernicus.eu/browser/).
Kadovar (Papua New Guinea) — June 2023  Cite this Report
Kadovar
Papua New Guinea
3.608°S, 144.588°E; summit elev. 365 m
All times are local (unless otherwise noted)
An ash plume and weak thermal anomaly during May 2023
Kadovar is a 2-km-wide island that is the emergent summit of a Bismarck Sea stratovolcano. It lies off the coast of New Guinea, about 25 km N of the mouth of the Sepik River. Prior to an eruption that began in 2018, a lava dome formed the high point of the volcano, filling an arcuate landslide scarp open to the S. Submarine debris-avalanche deposits occur to the S of the island. The current eruption began in January 2018 and has comprised lava effusion from vents at the summit and at the E coast; more recent activity has consisted of ash plumes, weak thermal activity, and gas-and-steam plumes (BGVN 48:02). This report covers activity during February through May 2023 using information from the Darwin Volcanic Ash Advisory Center (VAAC) and satellite data.
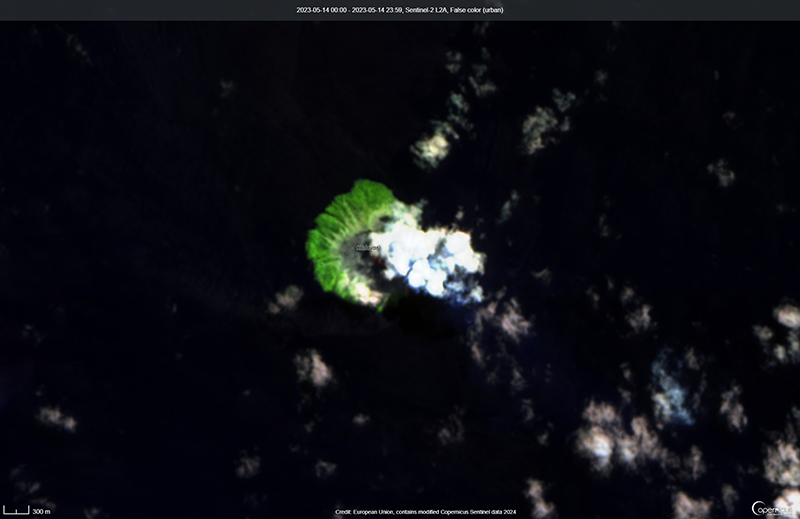
Activity during the reporting period was relatively low and mainly consisted of white gas-and-steam plumes that were visible in natural color satellite images on clear weather days (figure 67). According to a Darwin VAAC report, at 2040 on 6 May an ash plume rose to 4.6 km altitude and drifted W; by 2300 the plume had dissipated. MODIS satellite instruments using the MODVOLC thermal algorithm detected a single thermal hotspot on the SE side of the island on 7 May. Weak thermal activity was also detected in a satellite image on the E side of the island on 14 May, accompanied by a white gas-and-steam plume that drifted SE (figure 68).
Geologic Background. The 2-km-wide island of Kadovar is the emergent summit of a Bismarck Sea stratovolcano of Holocene age. It is part of the Schouten Islands, and lies off the coast of New Guinea, about 25 km N of the mouth of the Sepik River. Prior to an eruption that began in 2018, a lava dome formed the high point of the andesitic volcano, filling an arcuate landslide scarp open to the south; submarine debris-avalanche deposits occur in that direction. Thick lava flows with columnar jointing forms low cliffs along the coast. The youthful island lacks fringing or offshore reefs. A period of heightened thermal phenomena took place in 1976. An eruption began in January 2018 that included lava effusion from vents at the summit and at the E coast.
Information Contacts: Darwin Volcanic Ash Advisory Centre (VAAC), Bureau of Meteorology, Northern Territory Regional Office, PO Box 40050, Casuarina, NT 0811, Australia (URL: http://www.bom.gov.au/info/vaac/); Hawai'i Institute of Geophysics and Planetology (HIGP) - MODVOLC Thermal Alerts System, School of Ocean and Earth Science and Technology (SOEST), Univ. of Hawai'i, 2525 Correa Road, Honolulu, HI 96822, USA (URL: http://modis.higp.hawaii.edu/); Copernicus Browser, Copernicus Data Space Ecosystem, European Space Agency (URL: https://dataspace.copernicus.eu/browser/).
San Miguel (El Salvador) — June 2023  Cite this Report
San Miguel
El Salvador
13.434°N, 88.269°W; summit elev. 2130 m
All times are local (unless otherwise noted)
Small gas-and-ash explosions during March and May 2023
San Miguel in El Salvador is a broad, deep crater complex that has been frequently modified by eruptions recorded since the early 16th century and consists of the summit known locally as Chaparrastique. Flank eruptions have produced lava flows that extended to the N, NE, and SE during the 17-19th centuries. The most recent activity has consisted of minor ash eruptions from the summit crater. The current eruption period began in November 2022 and has been characterized by frequent phreatic explosions, gas-and-ash emissions, and sulfur dioxide plumes (BGVN 47:12). This report describes small gas-and-ash explosions during December 2022 through May 2023 based on special reports from the Ministero de Medio Ambiente y Recursos Naturales (MARN).
Activity has been relatively low since the last recorded explosions on 29 November 2022. Seismicity recorded by the San Miguel Volcano Station (VSM) located on the N flank at 1.7 km elevation had decreased by 7 December. Sulfur dioxide gas measurements taken with DOAS (Differential Optical Absorption Spectroscopy) mobile equipment were below typical previously recorded values: 300 tons per day (t/d). During December, small explosions were recorded by the seismic network and manifested as gas-and-steam emissions.
Gas-and-ash explosions in the crater occurred during January 2023, which were recorded by the seismic network. Sulfur dioxide values remained low, between 300-400 t/d through 10 March. At 0817 on 14 January a gas-and-ash emission was visible in webcam images, rising just above the crater rim. Some mornings during February, small gas-and-steam plumes were visible in the crater. On 7 March at 2252 MARN noted an increase in degassing from the central crater; gas emissions were constantly observed through the early morning hours on 8 March. During the early morning of 8 March through the afternoon on 9 March, 12 emissions were registered, some accompanied by ash. The last gas-and-ash emission was recorded at 1210 on 9 March; very fine ashfall was reported in El Tránsito (10 km S), La Morita (6 km W), and La Piedrita (3 km W). The smell of sulfur was reported in Piedra Azul (5 km SW). On 16 March MARN reported that gas-and-steam emissions decreased.
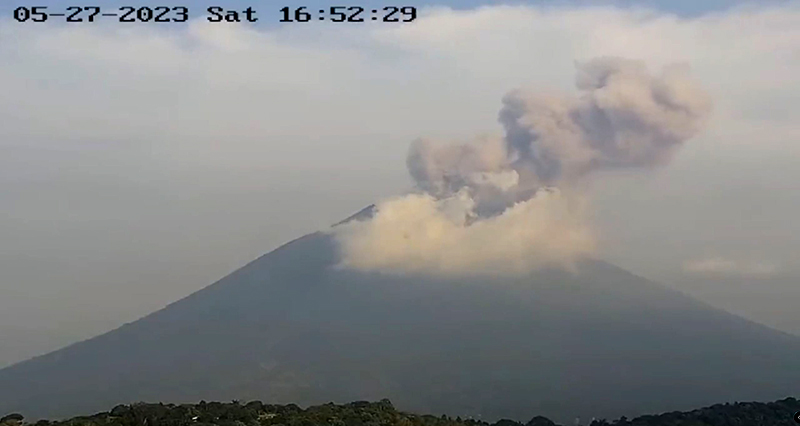
Low degassing and very low seismicity were reported during April; no explosions have been detected between 9 March and 27 May. The sulfur dioxide emissions remained between 350-400 t/d; during 13-20 April sulfur dioxide values fluctuated between 30-300 t/d. Activity remained low through most of May; on 23 May seismicity increased. An explosion was detected at 1647 on 27 May generated a gas-and-ash plume that rose 700 m high (figure 32); a decrease in seismicity and gas emissions followed. The DOAS station installed on the W flank recorded sulfur dioxide values that reached 400 t/d on 27 May; subsequent measurements showed a decrease to 268 t/d on 28 May and 100 t/d on 29 May.
Geologic Background. The symmetrical cone of San Miguel, one of the most active volcanoes in El Salvador, rises from near sea level to form one of the country's most prominent landmarks. A broad, deep, crater complex that has been frequently modified by eruptions recorded since the early 16th century caps the truncated unvegetated summit, also known locally as Chaparrastique. Flanks eruptions of the basaltic-andesitic volcano have produced many lava flows, including several during the 17th-19th centuries that extended to the N, NE, and SE. The SE-flank flows are the largest and form broad, sparsely vegetated lava fields crossed by highways and a railroad skirting the base of the volcano. Flank vent locations have migrated higher on the edifice during historical time, and the most recent activity has consisted of minor ash eruptions from the summit crater.
Information Contacts: Ministero de Medio Ambiente y Recursos Naturales (MARN), Km. 5½ Carretera a Nueva San Salvador, Avenida las Mercedes, San Salvador, El Salvador (URL: http://www.snet.gob.sv/ver/vulcanologia).
Semisopochnoi (United States) — June 2023  Cite this Report
Semisopochnoi
United States
51.93°N, 179.58°E; summit elev. 1221 m
All times are local (unless otherwise noted)
Occasional explosions, ash deposits, and gas-and-steam plumes during December 2022-May 2023
Semisopochnoi is located in the western Aleutians, is 20-km-wide at sea level, and contains an 8-km-wide caldera. The three-peaked Mount Young (formerly Cerberus) was constructed within the caldera during the Holocene. Each of these peaks contains a summit crater; the lava flows on the N flank appear younger than those on the S side. The current eruption period began in early February 2021 and has more recently consisted of intermittent explosions and ash emissions (BGVN 47:12). This report updates activity during December 2022 through May 2023 using daily, weekly, and special reports from the Alaska Volcano Observatory (AVO). AVO monitors the volcano using local seismic and infrasound sensors, satellite data, web cameras, and remote infrasound and lightning networks.
Activity during most of December 2022 was relatively quiet; according to AVO no eruptive or explosive activity was observed since 7 November 2022. Intermittent tremor and occasional small earthquakes were observed in geophysical data. Continuous gas-and-steam emissions were observed from the N crater of Mount Young in webcam images on clear weather days (figure 25). On 24 December, there was a slight increase in earthquake activity and several small possible explosion signals were detected in infrasound data. Eruptive activity resumed on 27 December at the N crater of Mount Young; AVO issued a Volcano Activity Notice (VAN) that reported minor ash deposits on the flanks of Mount Young that extended as far as 1 km from the vent, according to webcam images taken during 27-28 December (figure 26). No ash plumes were observed in webcam or satellite imagery, but a persistent gas-and-steam plume that might have contained some ash rose to 1.5 km altitude. As a result, AVO raised the Aviation Color Code (ACC) to Orange (the second highest level on a four-color scale) and the Volcano Alert Level (VAL) to Watch (the second highest level on a four-level scale). Possible explosions were detected during 21 December 2022 through 1 January 2023 and seismic tremor was recorded during 30-31 December.
During January 2023 eruptive activity continued at the active N crater of Mount Young. Minor ash deposits were observed on the flanks, extending about 2 km SSW, based on webcam images from 1 and 3 January. A possible explosion occurred during 1-2 January based on elevated seismicity recorded on local seismometers and an infrasound signal recorded minutes later by an array at Adak. Though no ash plumes were observed in webcam or satellite imagery, a persistent gas-and-steam plume rose to 1.5 km altitude that might have carried minor traces of ash. Ash deposits were accompanied by periods of elevated seismicity and infrasound signals from the local geophysical network, which AVO reported were likely due to weak explosive activity. Low-level explosive activity was also detected during 2-3 January, with minor gas-and-steam emissions and a new ash deposit that was visible in webcam images. Low-level explosive activity was detected in geophysical data during 4-5 January, with elevated seismicity and infrasound signals observed on local stations. Volcanic tremor was detected during 7-9 January and very weak explosive activity was detected in seismic and infrasound data on 9 January. Weak seismic and infrasound signals were recorded on 17 January, which indicated minor explosive activity, but no ash emissions were observed in clear webcam images; a gas-and-steam plume continued to rise to 1.5 km altitude. During 29-30 January, ash deposits near the summit were observed on fresh snow, according to webcam images.
The active N cone at Mount Young continued to produce a gas-and-steam plume during February, but no ash emissions or explosive events were detected. Seismicity remained elevated with faint tremor during early February. Gas-and-steam emissions from the N crater were observed in clear webcam images on 11-13 and 16 February; no explosive activity was detected in seismic, infrasound, or satellite data. Seismicity has also decreased, with no significant seismic tremor observed since 25 January. Therefore, the ACC was lowered to Yellow (the second lowest level on a four-color scale) and the VAL was lowered to Advisory (the second lowest level on a four-color scale) on 22 February.
Gas-and-steam emissions persisted during March from the N cone of Mount Young, based on clear webcam images. A few brief episodes of weak tremor were detected in seismic data, although seismicity decreased over the month. A gas-and-steam plume detected in satellite data extended 150 km on 18 March. Low-level ash emissions from the N cone at Mount Young were observed in several webcam images during 18-19 March, in addition to small explosions and volcanic tremor. The ACC was raised to Orange and the VAL increased to Watch on 19 March. A small explosion was detected in seismic and infrasound data on 21 March.
Low-level unrest continued during April, although cloudy weather often obscured views of the summit; periods of seismic tremor and local earthquakes were recorded. During 3-4 April a gas-and-steam plume was visible traveling more than 200 km overnight; no ash was evident in the plume, according to AVO. A gas-and-steam plume was observed during 4-6 April that extended 400 km but did not seem to contain ash. Small explosions were detected in seismic and infrasound data on 5 April. Occasional clear webcam images showed continuing gas-and-steam emissions rose from Mount Young, but no ash deposits were observed on the snow. On 19 April small explosions and tremor were detected in seismic and infrasound data. A period of seismic tremor was detected during 22-25 April, with possible weak explosions on 25 April. Ash deposits were visible near the crater rim, but it was unclear if these deposits were recent or due to older deposits.
Occasional small earthquakes were recorded during May, but there were no signs of explosive activity seen in geophysical data. Gas-and-steam emissions continued from the N crater of Mount Young, based on webcam images, and seismicity remained slightly elevated. A new, light ash deposit was visible during the morning of 5 May on fresh snow on the NW flank of Mount Young. During 10 May periods of volcanic tremor were observed. The ACC was lowered to Yellow and the VAL to Advisory on 17 May due to no additional evidence of activity.
Geologic Background. Semisopochnoi, the largest subaerial volcano of the western Aleutians, is 20 km wide at sea level and contains an 8-km-wide caldera. It formed as a result of collapse of a low-angle, dominantly basaltic volcano following the eruption of a large volume of dacitic pumice. The high point of the island is Anvil Peak, a double-peaked late-Pleistocene cone that forms much of the island's northern part. The three-peaked Mount Cerberus (renamed Mount Young in 2023) was constructed within the caldera during the Holocene. Each of the peaks contains a summit crater; lava flows on the N flank appear younger than those on the south side. Other post-caldera volcanoes include the symmetrical Sugarloaf Peak SSE of the caldera and Lakeshore Cone, a small cinder cone at the edge of Fenner Lake in the NE part of the caldera. Most documented eruptions have originated from Young, although Coats (1950) considered that both Sugarloaf and Lakeshore Cone could have been recently active.
Information Contacts: Alaska Volcano Observatory (AVO), a cooperative program of a) U.S. Geological Survey, 4200 University Drive, Anchorage, AK 99508-4667 USA (URL: https://avo.alaska.edu/), b) Geophysical Institute, University of Alaska, PO Box 757320, Fairbanks, AK 99775-7320, USA, and c) Alaska Division of Geological & Geophysical Surveys, 794 University Ave., Suite 200, Fairbanks, AK 99709, USA (URL: http://dggs.alaska.gov/).
Ebeko
Russia
50.686°N, 156.014°E; summit elev. 1103 m
All times are local (unless otherwise noted)
Continued explosions, ash plumes, and ashfall during October 2022-May 2023
Ebeko, located on the N end of Paramushir Island in the Kuril Islands, consists of three summit craters along a SSW-NNE line at the northern end of a complex of five volcanic cones. Eruptions date back to the late 18th century and have been characterized as small-to-moderate explosions from the summit crater, accompanied by intense fumarolic activity. The current eruption period began in June 2022 and has recently consisted of frequent explosions, ash plumes, and thermal activity (BGVN 47:10). This report covers similar activity during October 2022 through May 2023, based on information from the Kamchatka Volcanic Eruptions Response Team (KVERT) and satellite data.
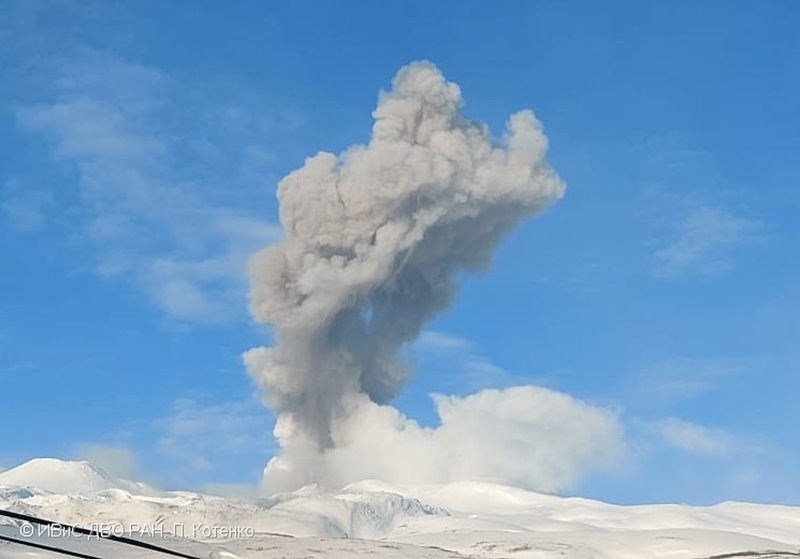
Activity during October consisted of explosive activity, ash plumes, and occasional thermal anomalies. Visual data by volcanologists from Severo-Kurilsk showed explosions producing ash clouds up to 2.1-3 km altitude which drifted E, N, NE, and SE during 1-8, 10, 16, and 18 October. KVERT issued several Volcano Observatory Notices for Aviation (VONA) on 7, 13-15, and 27 October 2022, stating that explosions generated ash plumes that rose to 2.3-4 km altitude and drifted 5 km E, NE, and SE. Ashfall was reported in Severo-Kurilsk (Paramushir Island, about 7 km E) on 7 and 13 October. Satellite data showed a thermal anomaly over the volcano on 15-16 October. Visual data showed ash plumes rising to 2.5-3.6 km altitude on 22, 25-29, and 31 October and moving NE due to constant explosions.
Similar activity continued during November, with explosions, ash plumes, and ashfall occurring. KVERT issued VONAs on 1-2, 4, 6-7, 9, 13, and 16 November that reported explosions and resulting ash plumes that rose to 1.7-3.6 km altitude and drifted 3-5 km SE, ESE, E, and NE. On 1 November ash plumes extended as far as 110 km SE. On 5, 8, 12, and 24-25 November explosions and ash plumes rose to 2-3.1 km altitude and drifted N and E. Ashfall was observed in Severo-Kurilsk on 7 and 16 November. A thermal anomaly was visible during 1-4, 16, and 20 November. Explosions during 26 November rose as high as 2.7 km altitude and drifted NE (figure 45).
Explosions and ash plumes continued to occur in December. During 1-2 and 4 December volcanologists from Severo-Kurilsk observed explosions that sent ash to 1.9-2.5 km altitude and drifted NE and SE (figure 46). VONAs were issued on 5, 9, and 16 December reporting that explosions generated ash plumes rising to 1.9 km, 2.6 km, and 2.4 km altitude and drifted 5 km SE, E, and NE, respectively. A thermal anomaly was visible in satellite imagery on 16 December. On 18 and 27-28 December explosions produced ash plumes that rose to 2.5 km altitude and drifted NE and SE. On 31 December an ash plume rose to 2 km altitude and drifted NE.
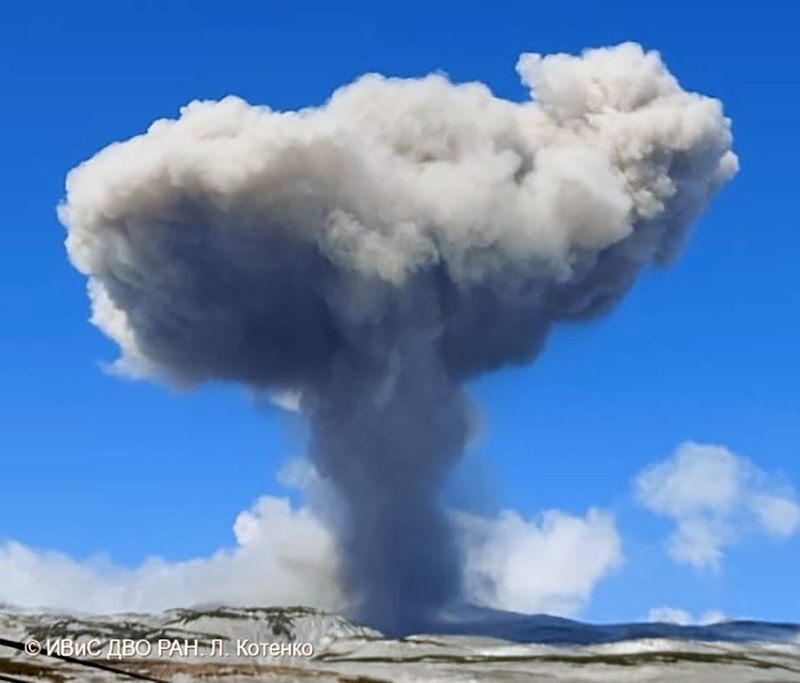
Explosions continued during January 2023, based on visual observations by volcanologists from Severo-Kurilsk. During 1-7 January explosions generated ash plumes that rose to 4 km altitude and drifted NE, E, W, and SE. According to VONAs issued by KVERT on 2, 4, 10, and 23 January, explosions produced ash plumes that rose to 2-4 km altitude and drifted 5 km N, NE, E, and ENE; the ash plume that rose to 4 km altitude occurred on 10 January (figure 47). Satellite data showed a thermal anomaly during 3-4, 10, 13, 16, 21, 22, and 31 January. KVERT reported that an ash cloud on 4 January moved 12 km NE. On 6 and 9-11 January explosions sent ash plumes to 4.5 km altitude and drifted W and ESE. On 13 January an ash plume rose to 3 km altitude and drifted SE. During 20-24 January ash plumes from explosions rose to 3.7 km altitude and drifted SE, N, and NE. On 21 January the ash plume drifted as far as 40 km NE. During 28-29 and 31 January and 1 February ash plumes rose to 4 km altitude and drifted NE.
During February, explosions, ash plumes, and ashfall were reported. During 1, 4-5 and 7-8 February explosions generated ash plumes that rose to 4.5 km altitude and drifted E and NE; ashfall was observed on 5 and 8 February. On 6 February an explosion produced an ash plume that rose to 3 km altitude and drifted 7 km E, causing ashfall in Severo-Kurilsk. A thermal anomaly was visible in satellite data on 8, 9, 13, and 21 February. Explosions on 9 and 12-13 February produced ash plumes that rose to 4 km altitude and drifted E and NE; the ash cloud on 12 February extended as far as 45 km E. On 22 February explosions sent ash to 3 km altitude that drifted E. During 24 and 26-27 February ash plumes rose to 4 km altitude and drifted E. On 28 February an explosion sent ash to 2.5-3 km altitude and drifted 5 km E; ashfall was observed in Severo-Kurilsk.
Activity continued during March; visual observations showed that explosions generated ash plumes that rose to 3.6 km altitude on 3, 5-7, and 9-12 March and drifted E, NE, and NW. Thermal anomalies were visible on 10, 13, and 29-30 March in satellite imagery. On 18, 21-23, 26, and 29-30 March explosions produced ash plumes that rose to 2.8 km altitude and drifted NE and E; the ash plumes during 22-23 March extended up to 76 km E. A VONA issued on 21 March reported an explosion that produced an ash plume that rose to 2.8 km altitude and drifted 5 km E. Another VONA issued on 23 March reported that satellite data showed an ash plume rising to 3 km altitude and drifted 14 km E.
Explosions during April continued to generate ash plumes. On 1 and 4 April an ash plume rose to 2.8-3.5 km altitude and drifted SE and NE. A thermal anomaly was visible in satellite imagery during 1-6 April. Satellite data showed ash plumes and clouds rising to 2-3 km altitude and drifting up to 12 km SW and E on 3 and 6 April (figure 48). KVERT issued VONAs on 3, 5, 14, 16 April describing explosions that produced ash plumes rising to 3 km, 3.5 km, 3.5 km, and 3 km altitude and drifting 5 km S, 5 km NE and SE, 72 km NNE, and 5 km NE, respectively. According to satellite data, the resulting ash cloud from the explosion on 14 April was 25 x 7 km in size and drifted 72-104 km NNE during 14-15 April. According to visual data by volcanologists from Severo-Kurilsk explosions sent ash up to 3.5 km altitude that drifted NE and E during 15-16, 22, 25-26, and 29 April.
The explosive eruption continued during May. Explosions during 3-4, 6-7, and 9-10 May generated ash plumes that rose to 4 km altitude and drifted SW and E. Satellite data showed a thermal anomaly on 3, 9, 13-14, and 24 May. During 12-16, 23-25, and 27-28 May ash plumes rose to 3.5 km altitude and drifted in different directions due to explosions. Two VONA notices were issued on 16 and 25 May, describing explosions that generated ash plumes rising to 3 km and 3.5 km altitude, respectively and extending 5 km E. The ash cloud on 25 May drifted 75 km SE.
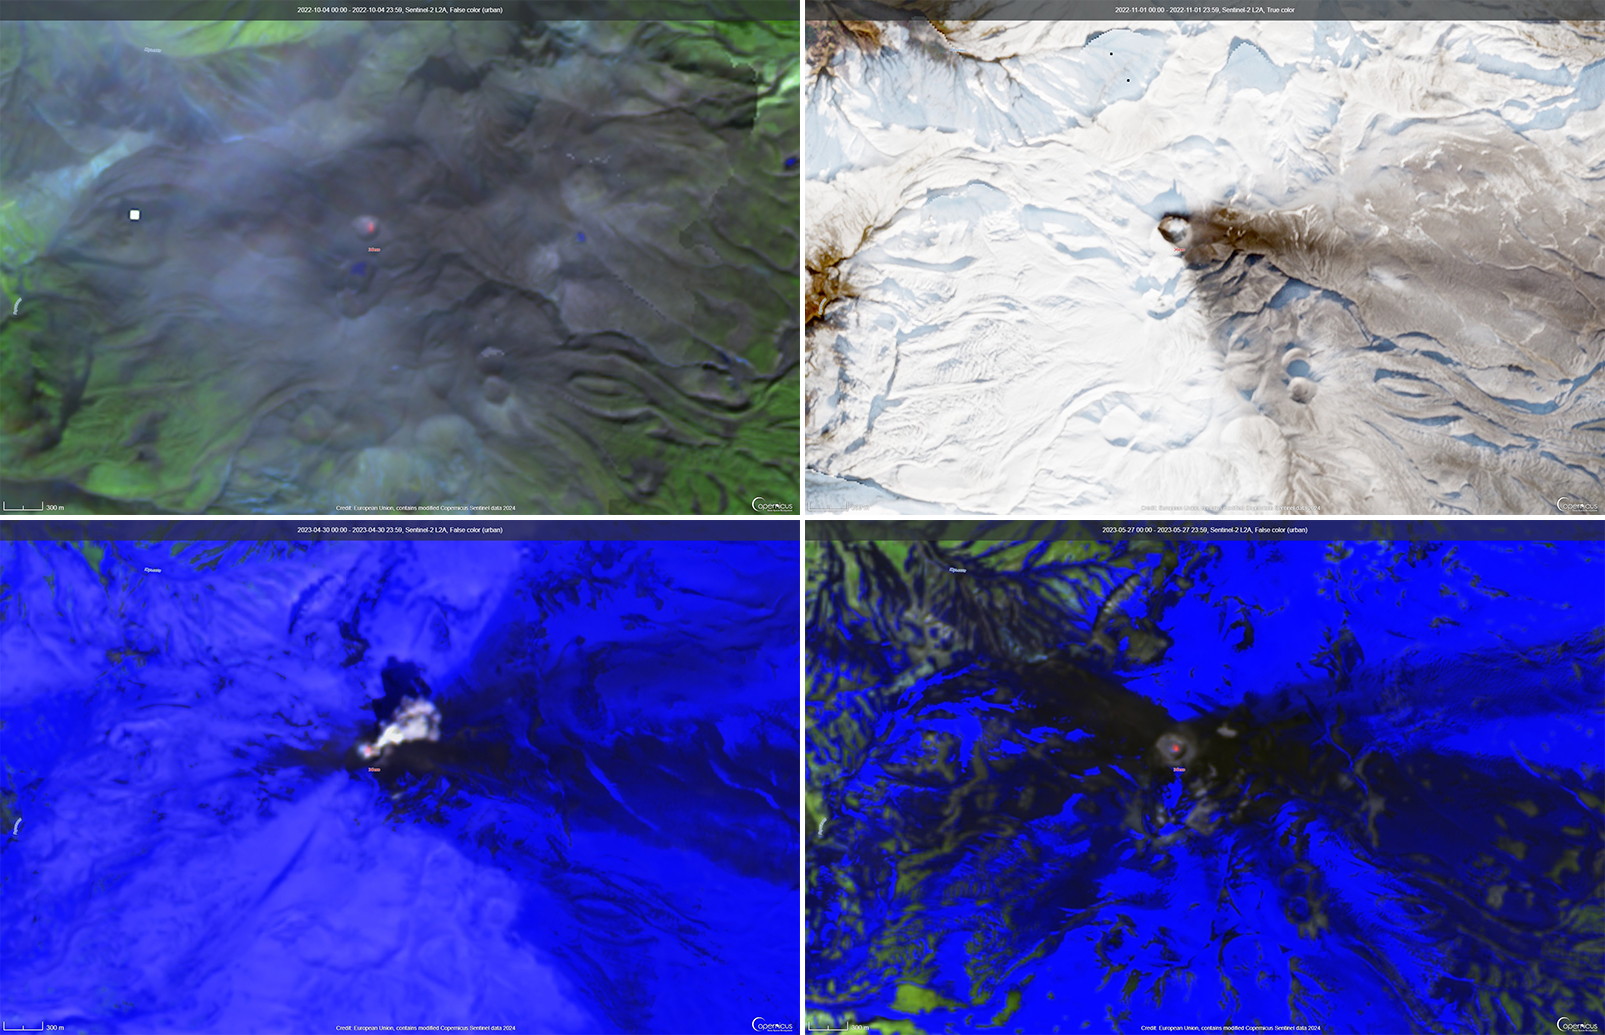
Thermal activity in the summit crater, occasionally accompanied by ash plumes and ash deposits on the SE and E flanks due to frequent explosions, were visible in infrared and true color satellite images (figure 49).
Geologic Background. The flat-topped summit of the central cone of Ebeko volcano, one of the most active in the Kuril Islands, occupies the northern end of Paramushir Island. Three summit craters located along a SSW-NNE line form Ebeko volcano proper, at the northern end of a complex of five volcanic cones. Blocky lava flows extend west from Ebeko and SE from the neighboring Nezametnyi cone. The eastern part of the southern crater contains strong solfataras and a large boiling spring. The central crater is filled by a lake about 20 m deep whose shores are lined with steaming solfataras; the northern crater lies across a narrow, low barrier from the central crater and contains a small, cold crescentic lake. Historical activity, recorded since the late-18th century, has been restricted to small-to-moderate explosive eruptions from the summit craters. Intense fumarolic activity occurs in the summit craters, on the outer flanks of the cone, and in lateral explosion craters.
Information Contacts: Kamchatka Volcanic Eruptions Response Team (KVERT), Far Eastern Branch, Russian Academy of Sciences, 9 Piip Blvd., Petropavlovsk-Kamchatsky, 683006, Russia (URL: http://www.kscnet.ru/ivs/kvert/); MIROVA (Middle InfraRed Observation of Volcanic Activity), a collaborative project between the Universities of Turin and Florence (Italy) supported by the Centre for Volcanic Risk of the Italian Civil Protection Department (URL: http://www.mirovaweb.it/); Copernicus Browser, Copernicus Data Space Ecosystem, European Space Agency (URL: https://dataspace.copernicus.eu/browser/).
Home Reef
Tonga
18.992°S, 174.775°W; summit elev. -10 m
All times are local (unless otherwise noted)
Discolored plumes continued during November 2022-April 2023
Home Reef is a submarine volcano located in the central Tonga islands between Lateiki (Metis Shoal) and Late Island. The first recorded eruption occurred in the mid-19th century, when an ephemeral island formed. An eruption in 1984 produced a 12-km-high eruption plume, a large volume of floating pumice, and an ephemeral island 500 x 1,500 m wide, with cliffs 30-50 m high that enclosed a water-filled crater. Another island-forming eruption in 2006 produced widespread pumice rafts that drifted as far as Australia; by 2008 the island had eroded below sea level. The previous eruption occurred during October 2022 and was characterized by a new island-forming eruption, lava effusion, ash plumes, discolored water, and gas-and-steam plumes (BGVN 47:11). This report covers discolored water plumes during November 2022 through April 2023 using satellite data.
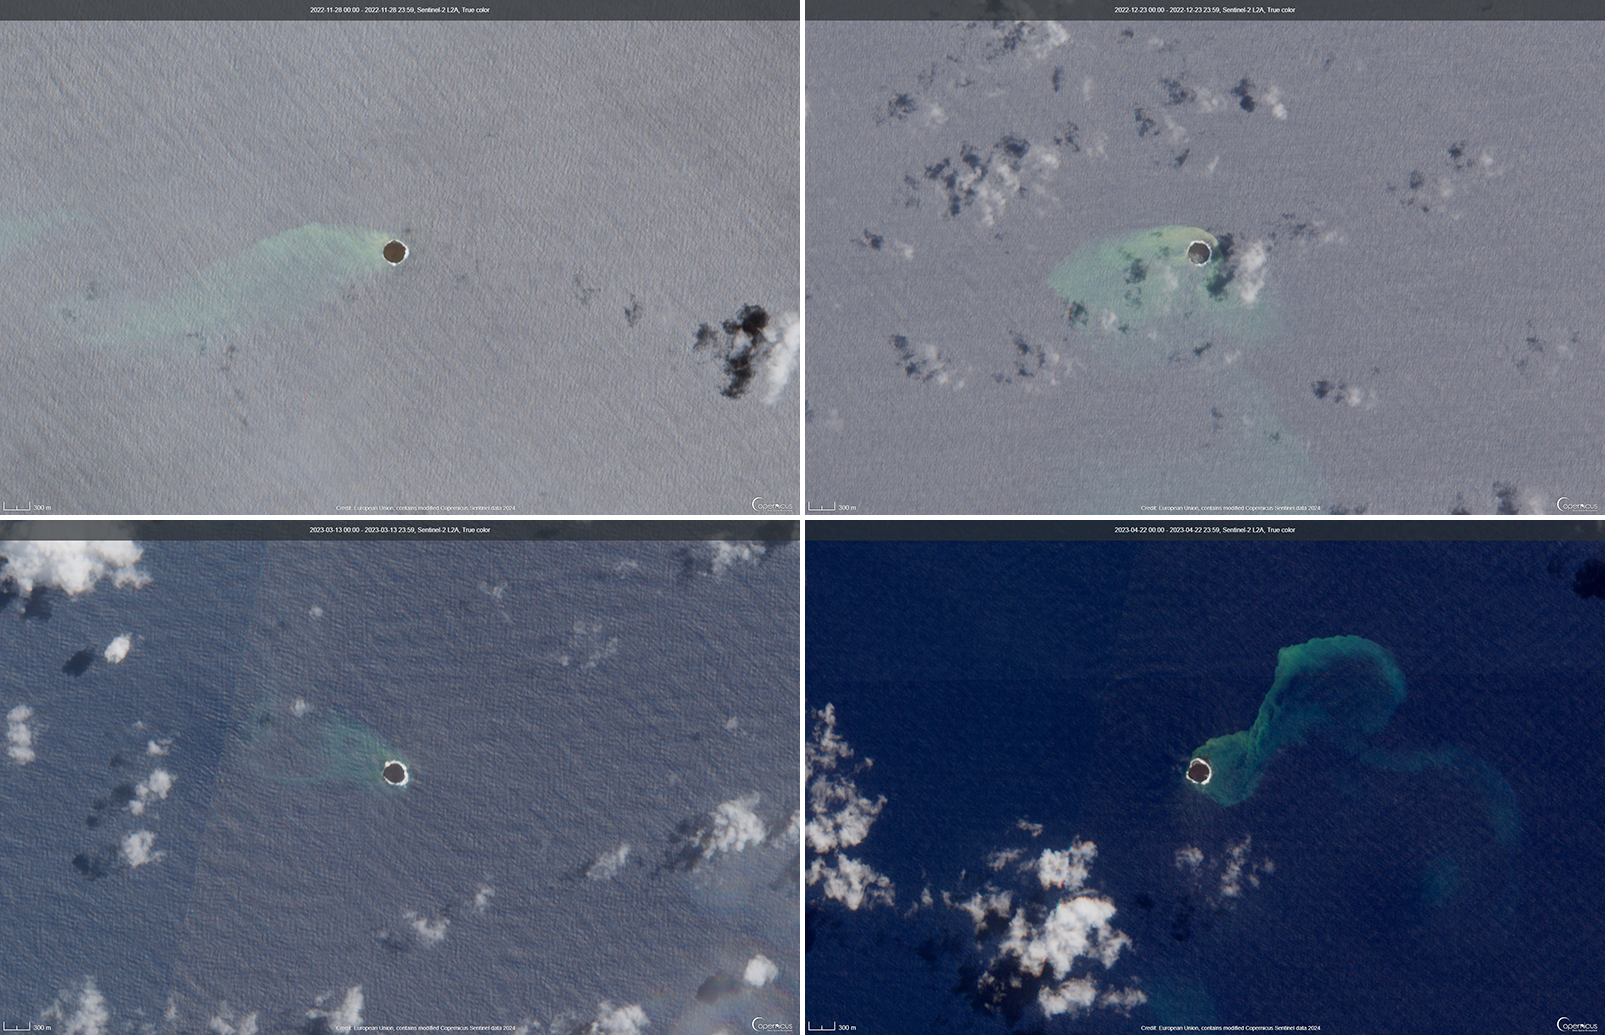
Discolored plumes continued during the reporting period and were observed in true color satellite images on clear weather days. Satellite images show light green-yellow discolored water extending W on 8 and 28 November 2022 (figure 31), and SW on 18 November. Light green-yellow plumes extended W on 3 December, S on 13 December, SW on 18 December, and W and S on 23 December (figure 31). On 12 January 2023 discolored green-yellow plumes extended to the NE, E, SE, and N. The plume moved SE on 17 January and NW on 22 January. Faint discolored water in February was visible moving NE on 1 February. A discolored plume extended NW on 8 and 28 March and NW on 13 March (figure 31). During April, clear weather showed green-blue discolored plumes moving S on 2 April, W on 7 April, and NE and S on 12 April. A strong green-yellow discolored plume extended E and NE on 22 April for several kilometers (figure 31).
Geologic Background. Home Reef, a submarine volcano midway between Metis Shoal and Late Island in the central Tonga islands, was first reported active in the mid-19th century, when an ephemeral island formed. An eruption in 1984 produced a 12-km-high eruption plume, large amounts of floating pumice, and an ephemeral 500 x 1,500 m island, with cliffs 30-50 m high that enclosed a water-filled crater. In 2006 an island-forming eruption produced widespread dacitic pumice rafts that drifted as far as Australia. Another island was built during a September-October 2022 eruption.
Information Contacts: Copernicus Browser, Copernicus Data Space Ecosystem, European Space Agency (URL: https://dataspace.copernicus.eu/browser/).
Ambae
Vanuatu
15.389°S, 167.835°E; summit elev. 1496 m
All times are local (unless otherwise noted)
New lava flow, ash plumes, and sulfur dioxide plumes during February-May 2023
Ambae, also known as Aoba, is a large basaltic shield volcano in Vanuatu. A broad pyroclastic cone containing three crater lakes (Manaro Ngoru, Voui, and Manaro Lakua) is located at the summit within the youngest of at least two nested calderas. Periodic phreatic and pyroclastic explosions have been reported since the 16th century. A large eruption more than 400 years ago resulted in a volcanic cone within the summit crater that is now filled by Lake Voui; the similarly sized Lake Manaro fills the western third of the caldera. The previous eruption ended in August 2022 that was characterized by gas-and-steam and ash emissions and explosions of wet tephra (BGVN 47:10). This report covers a new eruption during February through May 2023 that consisted of a new lava flow, ash plumes, and sulfur dioxide emissions, using information from the Vanuatu Meteorology and Geo-Hazards Department (VMGD) and satellite data.
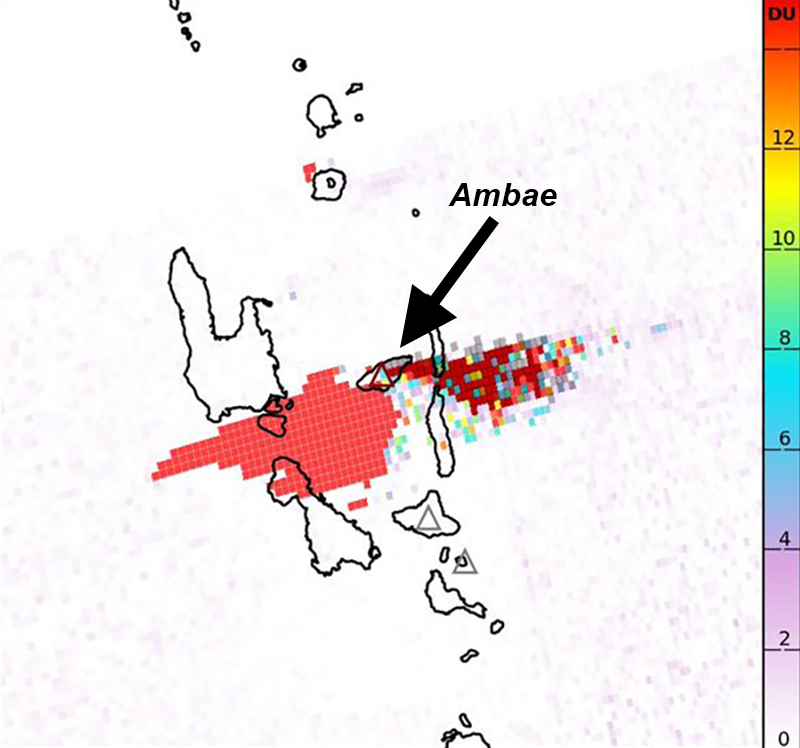
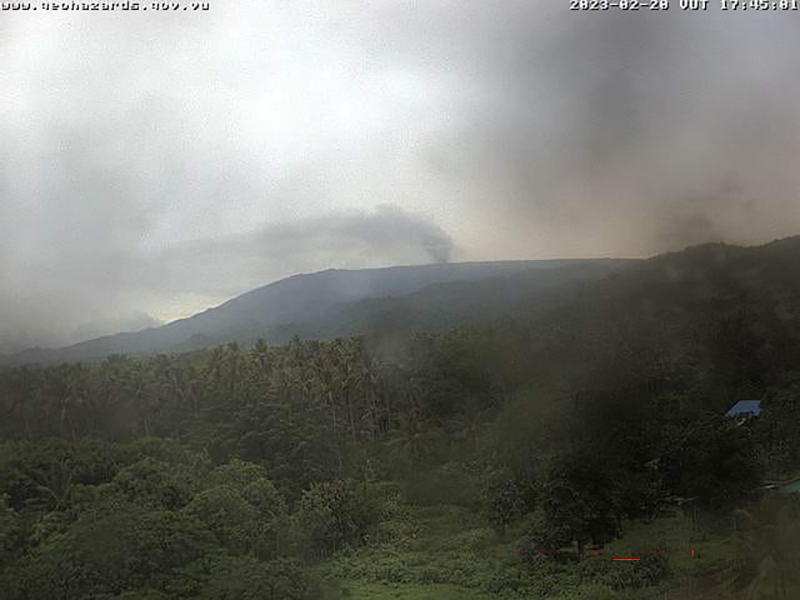
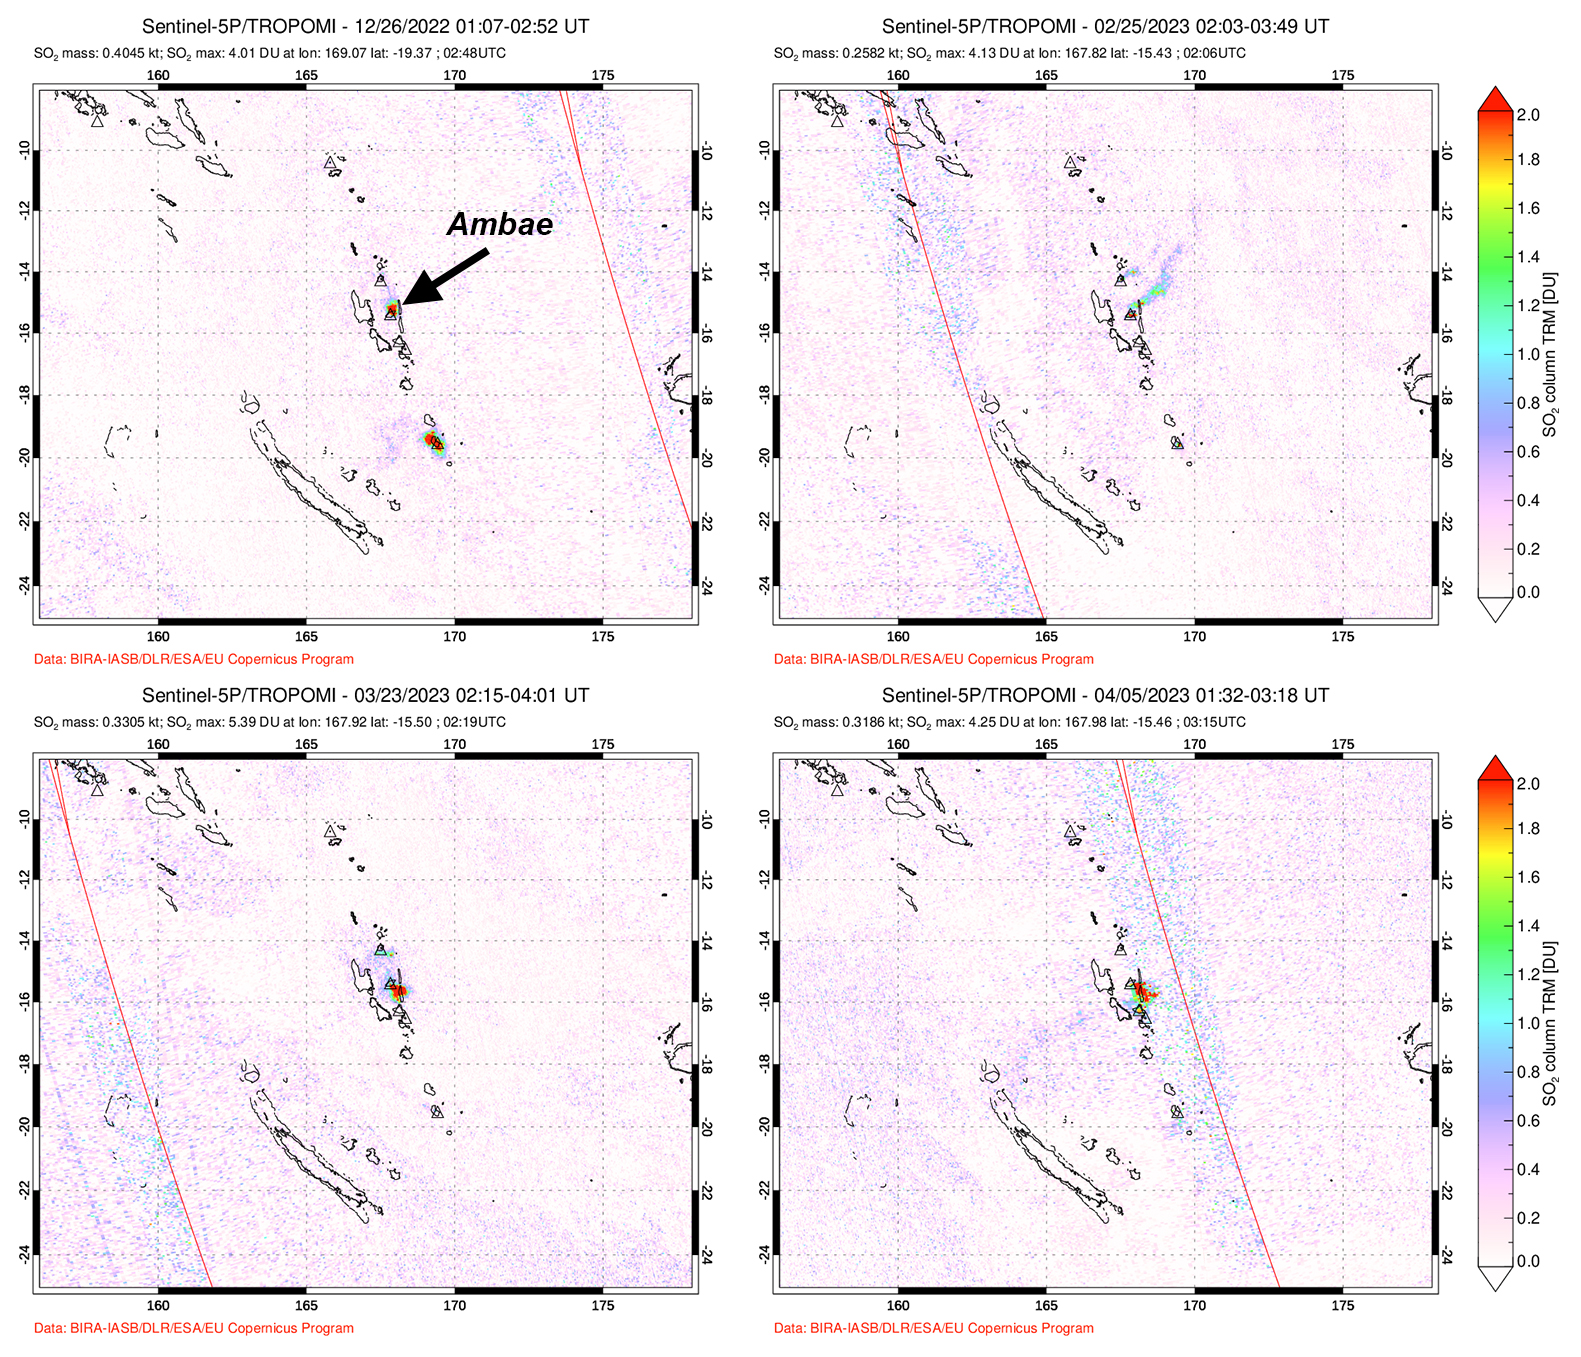
During the reporting period, the Alert Level remained at a 2 (on a scale of 0-5), which has been in place since December 2021. Activity during October 2022 through March 2023 remained relatively low and mostly consisted of gas-and-steam emissions in Lake Voui. VMGD reported that at 1300 on 15 November a satellite image captured a strong amount of sulfur dioxide rising above the volcano (figure 99), and that seismicity slightly increased. The southern and northern part of the island reported a strong sulfur dioxide smell and heard explosions. On 20 February 2023 a gas-and-ash plume rose 1.3 km above the summit and drifted SSW, according to a webcam image (figure 100). Gas-and-steam and possibly ash emissions continued on 23 February and volcanic earthquakes were recorded by the seismic network.
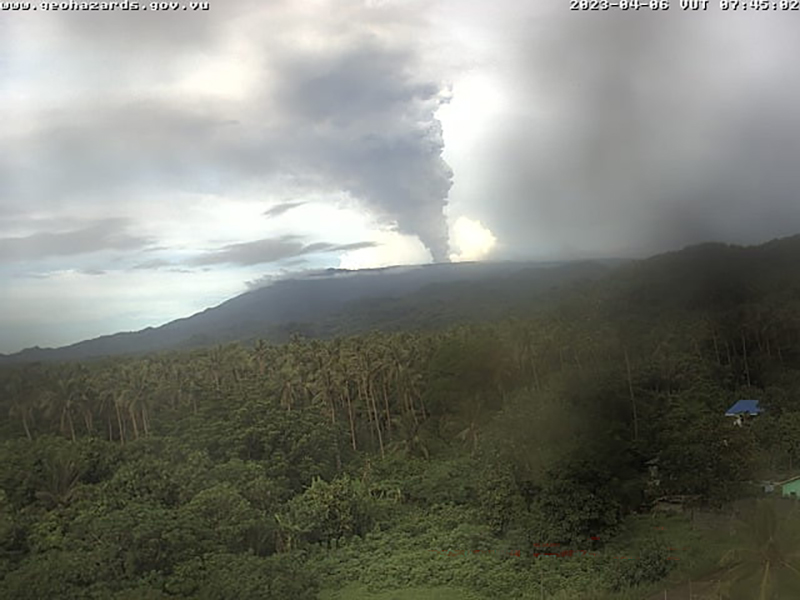
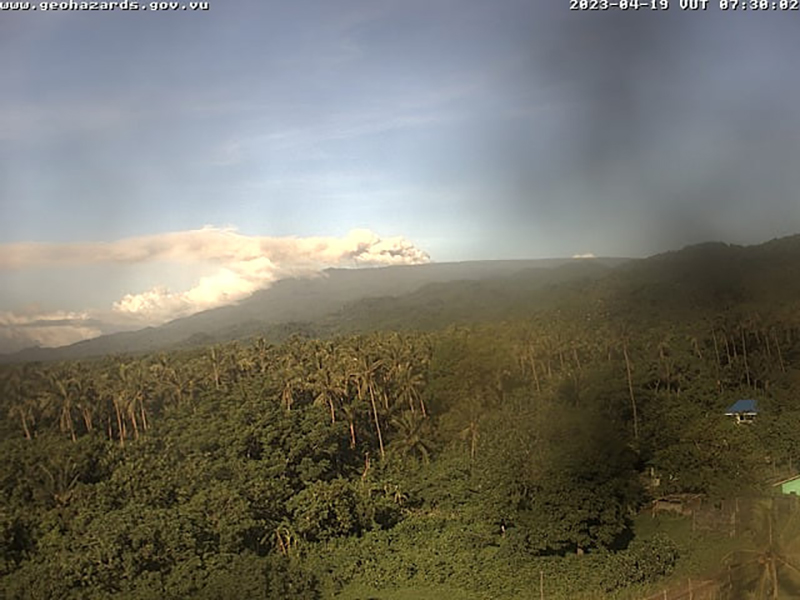
During April, volcanic earthquakes and gas-and-steam and ash emissions were reported from the cone in Lake Voui. VMGD reported that activity increased during 5-7 April; high gas-and-steam and ash plumes were visible, accompanied by nighttime incandescence. According to a Wellington VAAC report, a low-level ash plume rose as high as 2.5 km above the summit and drifted W and SW on 5 April, based on satellite imagery. Reports in Saratamata stated that a dark ash plume drifted to the WSW, but no loud explosion was heard. Webcam images from 2100 showed incandescence above the crater and reflected in the clouds. According to an aerial survey, field observations, and satellite data, water was no longer present in the lake. A lava flow was reported effusing from the vent and traveling N into the dry Lake Voui, which lasted three days. The next morning at 0745 on 6 April a gas-and-steam and ash plume rose 5.4 km above the summit and drifted ESE, based on information from VMGD (figure 101). The Wellington VAAC also reported that light ashfall was observed on the island. Intermittent gas-and-steam and ash emissions were visible on 7 April, some of which rose to an estimated 3 km above the summit and drifted E. Webcam images during 0107-0730 on 7 April showed continuing ash emissions. A gas-and-steam and ash plume rose 695 m above the summit crater at 0730 on 19 April and drifted ESE, based on a webcam image (figure 102).
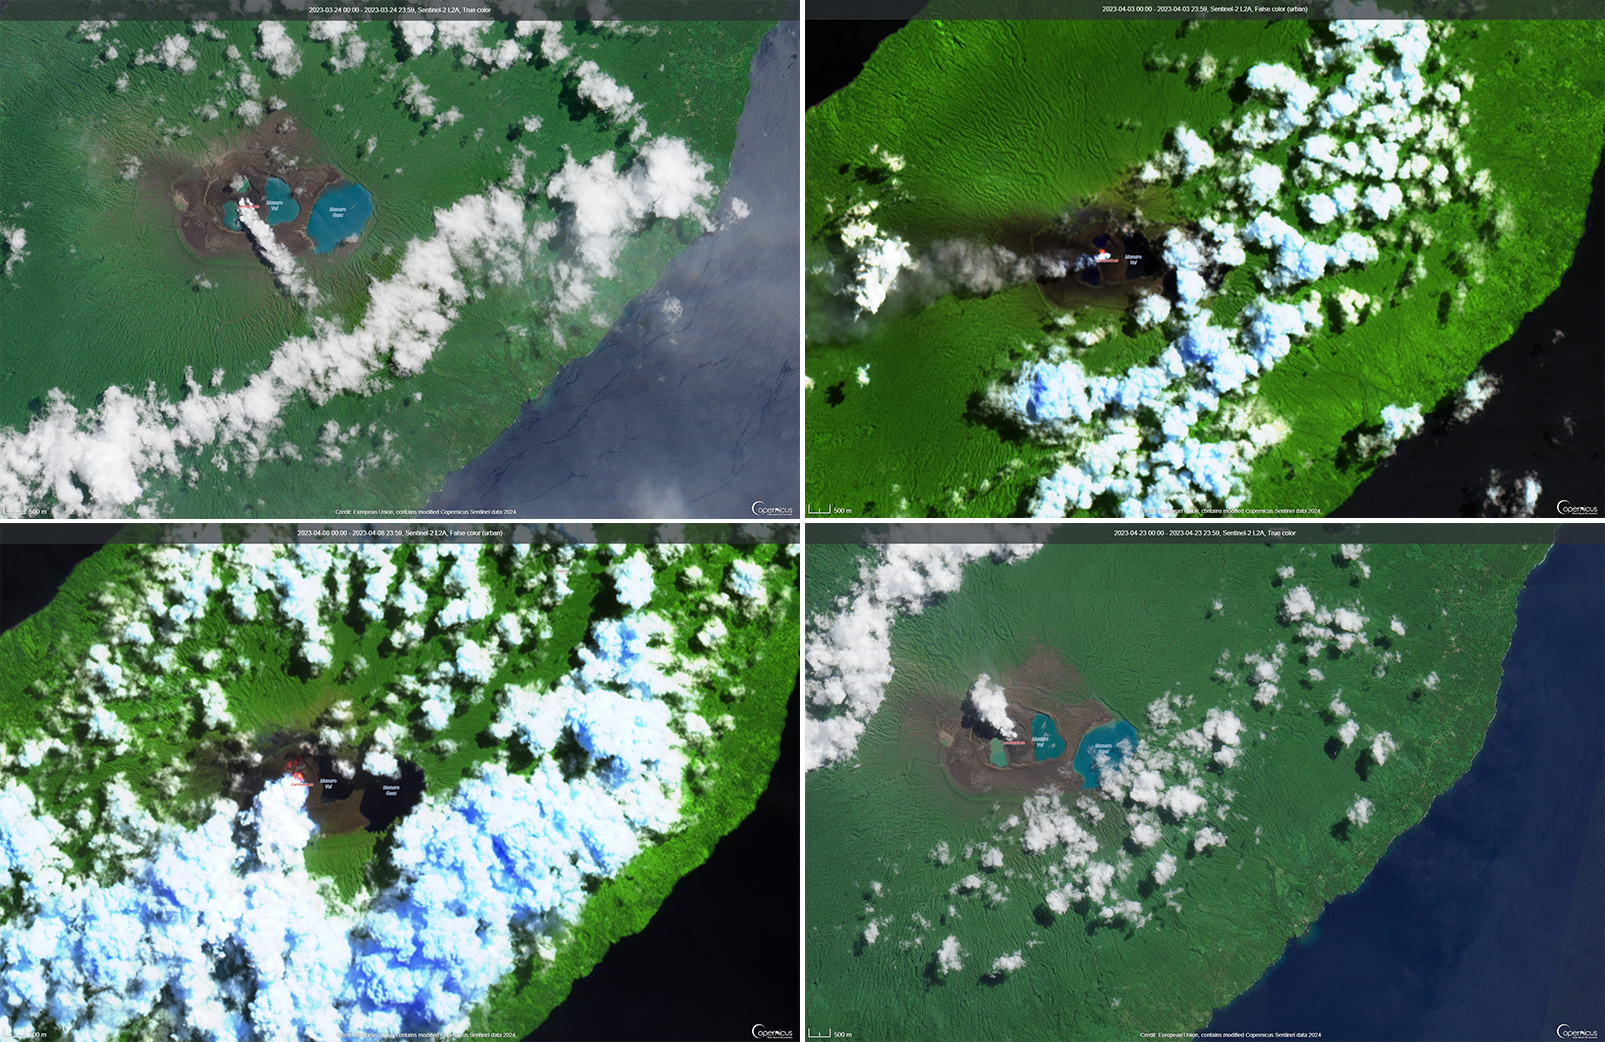
According to visual and infrared satellite data, water was visible in Lake Voui as late as 24 March 2023 (figure 103). The vent in the caldera showed a gas-and-steam plume drifted SE. On 3 April thermal activity was first detected, accompanied by a gas-and-ash plume that drifted W (figure 103). The lava flow moved N within the dry lake and was shown cooling by 8 April. By 23 April much of the water in the lake had returned. Occasional sulfur dioxide plumes were detected by the TROPOMI instrument on the Sentinel-5P satellite that exceeded 2 Dobson Units (DU) and drifted in different directions (figure 104).
Geologic Background. The island of Ambae, also known as Aoba, is a massive 2,500 km3 basaltic shield that is the most voluminous volcano of the New Hebrides archipelago. A pronounced NE-SW-trending rift zone with numerous scoria cones gives the 16 x 38 km island an elongated form. A broad pyroclastic cone containing three crater lakes (Manaro Ngoru, Voui, and Manaro Lakua) is located at the summit within the youngest of at least two nested calderas, the largest of which is 6 km in diameter. That large central edifice is also called Manaro Voui or Lombenben volcano. Post-caldera explosive eruptions formed the summit craters about 360 years ago. A tuff cone was constructed within Lake Voui (or Vui) about 60 years later. The latest known flank eruption, about 300 years ago, destroyed the population of the Nduindui area near the western coast.
Information Contacts: Geo-Hazards Division, Vanuatu Meteorology and Geo-Hazards Department (VMGD), Ministry of Climate Change Adaptation, Meteorology, Geo-Hazards, Energy, Environment and Disaster Management, Private Mail Bag 9054, Lini Highway, Port Vila, Vanuatu (URL: http://www.vmgd.gov.vu/, https://www.facebook.com/VanuatuGeohazardsObservatory/); Wellington Volcanic Ash Advisory Centre (VAAC), Meteorological Service of New Zealand Ltd (MetService), PO Box 722, Wellington, New Zealand (URL: http://www.metservice.com/vaac/, http://www.ssd.noaa.gov/VAAC/OTH/NZ/messages.html); MIROVA (Middle InfraRed Observation of Volcanic Activity), a collaborative project between the Universities of Turin and Florence (Italy) supported by the Centre for Volcanic Risk of the Italian Civil Protection Department (URL: http://www.mirovaweb.it/); Global Sulfur Dioxide Monitoring Page, Atmospheric Chemistry and Dynamics Laboratory, NASA Goddard Space Flight Center (NASA/GSFC), 8800 Greenbelt Road, Goddard, Maryland, USA (URL: https://so2.gsfc.nasa.gov/); Copernicus Browser, Copernicus Data Space Ecosystem, European Space Agency (URL: https://dataspace.copernicus.eu/browser/).
Search Bulletin Archive by Publication Date
Select a month and year from the drop-downs and click "Show Issue" to have that issue displayed in this tab.
The default month and year is the latest issue available.
Bulletin of the Global Volcanism Network - Volume 27, Number 03 (March 2002)
Managing Editor: Richard Wunderman
Etna (Italy)
Overview of Etna's much-photographed July-August 2001 flank eruption
Fuego (Guatemala)
Costly 1999 aircraft-ash encounters due to ash plumes
Karymsky (Russia)
Elevated seismicity; possible explosions and avalanches in March 2002
Kilauea (United States)
Lava stops entering sea during January, tilting in late March-April 2002
Manam (Papua New Guinea)
Mild eruptions during January-February 2002
Miyakejima (Japan)
Eruptive activity decreases; high SO2 flux through April 2002
Nyiragongo (DR Congo)
Report of field work; MODIS imagery from January 2002 eruption
Pacaya (Guatemala)
Costly 1999 aircraft-ash encounters due to ash plumes
Rabaul (Papua New Guinea)
M 5.6 earthquakes during March 2002 not related to volcanism
Sheveluch (Russia)
Growing dome, greater seismicity, and plumes to 10 km in early 2002
Ulawun (Papua New Guinea)
Isolated tremor episodes and slow deflation through March 2002
Etna
Italy
37.748°N, 14.999°E; summit elev. 3357 m
All times are local (unless otherwise noted)
Overview of Etna's much-photographed July-August 2001 flank eruption
The last flank eruption at Etna occurred in 1993, but eruptive activity has been nearly continuous in the summit area since late July 1995. Unusually vigorous eruptions in early June 2001 (BGVN 26:08) were followed by still more energetic behavior. An earthquake swarm took place in mid-July, and large SSE-flank eruptions vented lavas in late July and early August on a scale not seen since 1983 (BGVN 26:09). Though this activity has been reported in previous Bulletin reports, what follows is a more detailed description of the summer 2001 activity.
Precursory phases. During the first half of 2001 most activity occurred at the Southeast Crater (SEC), starting with very slow lava extrusion from a vent on the NNE flank of its cone in late January. During the next three months the lava emission rate progressively increased and, in late April, weak ejections of lava fragments began to build small spatter cones (also known as hornitos) in the vent area. Strombolian activity resumed at the SEC's summit vent on 7 May, followed by an episode of vigorous Strombolian activity and lava fountaining two days later.
The activity then returned to lower levels, but for the next two months the SEC was the site of very picturesque continuous and persistent activity, with mild, discontinuous Strombolian explosions from the summit vent and vigorous lava emission (at times accompanied by lava spattering) from vent(s) on the NNE flank. At this spot, a large, steep-sided cone consisting of overlapping lava flows and spatter began to grow, and it was informally named "Levantino." From Levantino (figure 93, upper part), lava flowed NE (toward the Valle del Leone), E, and SE (toward the Valle del Bove), forming a composite lava field with numerous overlapping flow lobes. The longest flows extended up to 2 km from the vent(s). From late May to early June the continuous and relatively harmless activity attracted many visitors.
The prelude to the main eruption began in early June, with the first strong phase on 7 June, which was mostly confined to lava fountaining at the Levantino, whereas only mild Strombolian activity occurred at the SEC summit vent. During the following six weeks the vigor of the eruptive episodes gradually increased and at times culminated in true lava fountaining from the summit vent. Fourteen such episodes occurred between 7 June and 13 July (7, 9, 11, 13, 15, 17, 19, 22, 24, 27-28 and 30 June; 4, 7 and 13 July), ending with the most violent outburst of the series. Immediately after its cessation, vigorous seismicity began, including shocks that were felt as far as the cities of Acireale and Catania (figure 93 index map).
Between the early mornings of 13 and 17 July, about 2,600 tremors, mostly unfelt, were recorded instrumentally. During this same time interval, severe ground cracking and faulting occurred in various places on the W rim of the Valle del Bove and near the "Cisternazza" pit crater on the Piano del Lago ("PDL," figure 3), a flat area at ~2,500 m elevation to the N of the Montagnola. Press sources cited local volcanologists saying that magma was rising through a dike and stagnating about 1 km below the surface. Steaming was observed at some of the new fractures, but as of the late evening of 16 July no magma had reached the surface. Seismicity continued at a slightly decreased rate.
Shortly after midnight on 17 July, yet another paroxysmal episode occurred at the SEC. This was similar to its 13 July predecessor, with vigorous lava fountaining from the summit vent and the Levantino. It was the last event that could be considered part of the prelude to the main eruption. Figure 93 shows a sketch map of the lava flows that ultimately resulted from the July-August 2001 eruption. The inset at upper left shows the 2001 lavas and locations of various towns on Etna's S, SE, and E flanks.
Eruption of 17 July-9 August 2001. As defined here, the main eruption lasted nearly 24 days, from early 17 July to late 9 August 2001. It began a few hours after the last paroxysmal eruptive episode at the SEC.
An eruptive fissure opened at about 0700 on 17 July at the SSE base of the SEC at ~ 2,950 m elevation (point 1 on figure 93). Vigorous lava spattering occurred at a number of vents, while lava flows advanced toward SE, in the direction of the Valle del Bove rim. Several hours later, at 2200, another fissure opened at an elevation of ~ 2,700 m (point 2 on figure 93), a bit to the W of a panoramic point on the W rim of the Valle del Bove known as "Belvedere," and lava began to extend S from there, across the Piano del Lago, and in the direction of the cable car and ski lifts (shown by the vertical dotted line just beneath PDL on figure 93).
At 0120 on 18 July, a third eruptive fissure became active on the S flank of the Montagnola at ~ 2,100 m elevation, slightly uphill of the Monti Calcarazzi (point 3 on figure 93). Activity at this fissure was initially weak, and a sluggish lava flow began to move from the lower end of the fissure toward the Monte Silvestri superiore, a large complex cinder cone formed in 1892. During the day, the activity gradually increased; lava flowed around the W side of the Monte Silvestri, crossed the road (which connected the Rifugio Sapienza-cable car area with the town of Zafferana) and passed close to buildings. By late evening on 18 July the flow front was at 1,800 m elevation. On 19 July, the lava flow fed by the vents at 2,100 m elevation continued to pass between numerous older cinder cones along the E margin of the 1983 lava flow-field. At the same time eruptive activity continued unabated at all eruptive fissures.
On the evening of 19 July at about 1900, a new vent opened on the Piano del Lago at ~2,570 m elevation, ~ 500 m N of the Montagnola (point 4 on figure 93; "Montagnola 2", "Monte del Lago" or "Cono del Laghetto", unfortunately, all three names are in common usage). The activity was characterized by violent phreatomagmatic explosions that produced a black, ash-laden column and ejected large blocks of older volcanic rocks. This phreatomagmatic activity might have been the result of magma-water interactions with shallow ground water. (The name, Piano del Lago, the "plain of the lake," derives from the fact that frequently during the spring snow-melt a small meltwater lake had formed in that area.) To observers familiar with footage of the 1963 Surtsey (Iceland) eruption, the steam-and-ash columns rising from the new vent appeared strikingly similar. After nightfall spectacular lightning flashed through the plume and ash fell over inhabited areas including the NE, E, SE, and S flanks. Close observation of the vent at 2,570 m elevation revealed a simple, though constantly eroding, pit. Rumors spread that the pit would eventually "make the Montagnola cave in;" however, it remained intact.
The front of the lava flow emitted at 2,100 m elevation (point 3 on figure 93) was at 1,350 m late on the evening of 19 July. It still advanced vigorously, though at reduced speed (~45 m/hour). Soon after, authorities declared a state of emergency.
By the evening of 20 July the front of the lava flow had reached 1,220 m elevation, but it had slowed in a gently sloping area. Nonetheless, the threat to Nicolosi had become international news. The main risk now came from forest and bush fires. Helicopters began to drop large quantities of water onto the burning forest (not onto the lava flow, as was widely reported). Fortunately, no fires broke out. By late 21 July the lava flow's front had reached 1,050 m elevation.
During the night of 19-20 July, the SEC reactivated, and lava began to issue from the NNE side of the Levantino, forming a small flow that advanced in the direction of the Valle del Bove.
At about 1100 on 21 July, yet another eruptive fissure formed (point 5 on figure 93). It emerged on the NE flank, far away from the earlier fissures (below the Pizzi Deneri on the floor of the Valle del Leone). Figure 93 portrays the impressive arcuate fracture system that developed. The lava first issued from the fissure's uppermost portion at ~ 2,700 m elevation, then from its eastern extension ~50 m further downslope. A fracture system formed between this northeasternmost fissure and the E side of the summit crater area, and fissures up to 1 m wide opened on the slope between the Bocca Nuova and the SEC, and began emitting dense vapor plumes.
The large pit crater on the Piano del Lago at 2,570 m elevation continued to produce dense, ash-laden plumes. In late July ash fell over the area between Zafferana and Acireale (inset, figure 93).
On 21 July, the eruption continued with unabated vigor at all eruptive fissures. Late that day, the lava from the vents at 2,700 m had not further advanced on the steep slope above the tourist complex of the Rifugio Sapienza area (shown as Rif. Sapienza, figure 93).
The next day, 22 July, a shift in the wind direction drove the dense ash plume produced by the phreatomagmatic vent at 2,570 m elevation directly over the Catania area, paralyzing the city's Fontanarossa International Airport, and dropping large amounts of fine, black, sand-sized tephra over streets and buildings. Eruptive activity continued without significant variations at all fissures, although the main lava flow directed toward Nicolosi had slowed significantly and advanced only a few meters per hour, still 4 km from the outskirts of the town. That evening, minor, though fast-moving lava tongues fed by the vents at 2,700 m elevation spilled down the steep slope above the tourist complex, destroying part of the ski lifts and threatening to overwhelm some of the poles of the cable car. However, none of these flows made it further than about halfway down that slope. Vigorous Strombolian activity continued at the fissure at 2,100 m elevation, and a cone about 20-30 m high had formed around the largest of its vents, while minor lava spattering from four vents in the lower part of the fissure was building a low-spatter rampart. The lava flow from this fissure moved as a single, broad unit (point 6 on figure 93). Throughout 23 July the activity showed little variation.
On 24 July it became clear that something was changing at the Piano del Lago crater, which until then had displayed only phreatomagmatic activity. Loud detonations came from the Piano del Lago vent on the morning of 25 July, as the activity there had now become purely magmatic.
A new cone was growing on the former Piano del Lago on 26 July produced near-continuous explosions accompanied by loud detonations that could be heard ten's of kilometers away. The cone received bombs ejected from at least three vents within it. Lava began flowing from vents on its S and N sides, spilling around the N and NW sides of the Montagnola and down the steep slope on the W side of that cone toward the Rifugio Sapienza. The new lava flow passed E of the lower cable car station, covered another portion of the road and advanced a few hundred meters further. Vigorous eruptive activity continued on 26 July at the eruptive fissure at 2,950 m elevation, while the fissure at 2,700 m elevation continued to emit lava but pyroclastic activity there had ended. Weak activity continued at the Valle del Leone fissure, with lava flowing toward Monte Simone (in the N part of the Valle del Bove), and the fissure at 2,100 m elevation showed no significant changes in its activity with respect to the previous days.
During 27-30 July the eruption produced some outstanding displays (figures 94 and 95) and caused the greatest impact on human structures. While the fissure in the Valle del Leone showed ever-lower levels of activity and the fissures at 2,900, 2,700, and 2,100 m elevation continued to erupt in a manner almost identical to the previous days, the Montagnola 2 cone and several nearby vents not only provided a show, but vents on its N and S flanks delivered vigorous lava flows that spilled down the steep slope to the W of the Montagnola in surges, presenting a continuous threat to the Rifugio Sapienza area.
A lava flow from the southern base of the Piana del Lago cone on 27 July remained active for about 2 days (point 7 of figure 93). This cone produced three distinct lava flow units from three different vents on its SW, S, and NW sides; those from the SW vent were the most damaging. On the evening of 30 July, the eruption claimed the upper cable car station, which burst into flames as a tongue of lava invaded its interior. Behind it, the rapidly growing cone of the Piano del Lago sent its lava fountains hundreds of meters into the sky, producing ground-shaking detonations.
During late July, the rate of lava emission in the direction of the Rifugio Sapienza area diminished as a new vent opened on the S side of the Piano del Lago cone, from which a lava flow spilled over the crest of the Valle del Bove and flowed to the bottom of the Valle, covering a portion of lava erupted in 1991-1993. The Valle del Leone fissure ceased emitting lava. The Montagnola 2 had become a large cone. It again shifted from magmatic to phreatomagmatic activity. Although the level of activity at this cone was decreasing, ash columns developed, and the wind carried the ash again in the direction of Catania, again closing the Fontanarossa airport. Vigorous eruptive activity continued during the first days of August at the fissure at 2,100 m elevation, but the lava effusion rate had dropped, and only the central portion of the original flow remained active, feeding a flow that advanced on top of the larger earlier flow from the same fissure. Strong phreatomagmatic explosions occurred from time to time at the upper vents on this fissure. Lava also continued to pour from the fissure at 2,700 m elevation, and numerous active flow lobes extended SE toward Monte Nero.
Beginning on 3 August the activity at the fissure at 2,100 m elevation showed a marked decrease. During the last week of the eruption (4-10 August) lava continued to flow from that fissure at a rapidly diminishing rate, explosive activity ended, and the fissures at 2,950 and 2,700 m elevation ceased erupting. Ash emission from the Piano del Lago cone ended around 6 August. Lava was last seen flowing from the fissure at 2,100 m elevation on late 9 or early 10 August. The eruption ended after almost 24 days, much earlier than its vigorous onset had suggested.
Products of the eruption and morphological changes. The July-August 2001 eruption emitted at least eight distinct lava flows which mostly affected the S and SSW flanks of Etna. The most damaging flows came from vents near the Piano del Lago cone at 2,570 m elevation. This cone produced most of the pyroclastic material, of which the most fine-grained portion (ash) caused widespread distress.
Petrographically, the lavas fall into two main groups, one of which is essentially similar to the historical products of Etna (porphyric hawaiites with phenocrysts of plagioclase, clinopyroxene and olivine), while the other shows characteristics not seen in any Etnean lavas during the past millennia (alkalic basalts).
Several major pyroclastic edifices grew during the eruption. The largest, the Piano del Lago cone at ~2,570 m elevation, is a nearly symmetrical cone, ~80 m high, which grew mostly between 25 and 31 July. It is crowned by a large crater ~150 m across and 50-60 m deep with near-vertical walls. During a visit on 30 August a few fumaroles located on the SEC walls emitted vapor and gas without forming a visible plume. A spectacular dike was exposed at the base of the E crater wall, and a less conspicuous dike was visible at the base of the WNW crater wall. Several faults or groups of faults were visible in the E and NE crater walls; a narrow graben developed on top of the E crater wall dike. The second-largest pyroclastic edifice lies in the upper part of the fissure at 2,100 m elevation.
Extensive (non-eruptive) fracture systems formed between the various eruptive fissures. Some of them began to form before the eruption, others developed during its first week. Many of these fractures are arranged in an en echelon pattern, which is especially notable in the Valle del Leone, between the northeastern (2,600 m) vents and the SEC. Other spectacular fractures opened between the Piano del Lago cone and the eruptive fissure at 2,100 m elevation. However, the most impressive fractures developed on the E side of the former Central Crater (now occupied by the Voragine and the Bocca Nuova), where they attained widths of more than 1 m. These fractures were vigorously steaming when visited in late-August and mid-September 2001. Fracturing also affected the southern face of the SEC cone.
About 5.5 km2 of Etna's upper and middle slopes were covered with new lava (compared to 7.6 km2 in the 1991-1993 flank eruption). The total volume of lavas and pyroclastics emitted during the eruption is ~ 30-35 x 106 m3 (25 x 106 m3 of lava and 5-10 x 106 m3 of pyroclastics, all calculated as dense rock equivalent), which makes this eruption a relatively modest-sized one for Etna (the 1991-1993 eruption had produced ~ 235 x 106 m3 of lava). Yet the fairly high proportion of pyroclastic material distinguishes this eruption from most other recent Etnean flank eruptions.
The most productive vents were those at 2,100 m elevation, which produced the longest (~ 7 km) and most voluminous (slightly less than 14 x 106 m3) single lava flow. The average combined effusion rate at all eruptive fissures throughout the eruption was ~11 m3/s, with peak rates of 14-16 m3/s. It is assumed that much of the magma that accumulated in one or more reservoirs below the base of the volcano in the years preceding the eruption was not erupted and remains available for future eruptions.
Geologic Background. Mount Etna, towering above Catania on the island of Sicily, has one of the world's longest documented records of volcanism, dating back to 1500 BCE. Historical lava flows of basaltic composition cover much of the surface of this massive volcano, whose edifice is the highest and most voluminous in Italy. The Mongibello stratovolcano, truncated by several small calderas, was constructed during the late Pleistocene and Holocene over an older shield volcano. The most prominent morphological feature of Etna is the Valle del Bove, a 5 x 10 km caldera open to the east. Two styles of eruptive activity typically occur, sometimes simultaneously. Persistent explosive eruptions, sometimes with minor lava emissions, take place from one or more summit craters. Flank vents, typically with higher effusion rates, are less frequently active and originate from fissures that open progressively downward from near the summit (usually accompanied by Strombolian eruptions at the upper end). Cinder cones are commonly constructed over the vents of lower-flank lava flows. Lava flows extend to the foot of the volcano on all sides and have reached the sea over a broad area on the SE flank.
Information Contacts: Boris Behncke, Dipartimento di Scienze Geologiche (Sezione di Geologia e Geofisica), Palazzo delle Scienze, Corso Italia 55, 95129 Catania, Italy.
Fuego
Guatemala
14.473°N, 90.88°W; summit elev. 3763 m
All times are local (unless otherwise noted)
Costly 1999 aircraft-ash encounters due to ash plumes
At least two commercial aircraft flew through airborne ash near the Guatemala City airport on 21 May 1999. An eruption from Fuego that day was the first at that volcano since 1987 (BGVN 24:04). Although the aviator's reports attributed the ash from this encounter to Fuego, their aircraft intersected multiple ash plumes in widely different locations, and thus they may also have crossed plumes from Pacaya. The most likely plume near the southern approach to the airport (La Aurora, ~23 km N of Pacaya; ~40 km NE of Fuego) is from the almost constantly active Pacaya. In contrast, Fuego lies 32 km W of Pacaya and was the likely source of a plume intersected later during the flight, at higher altitude, and for much longer duration.
During the encounters the ~100 or more people on board the two aircraft, and many more on the ground, were at risk. Both encounters seriously damaged the aircraft but ended in safe landings without reported injuries. Volcanic ash can cause jet-engine failure, which creates a hazard not only to passengers, but to people on the ground as well. The risk in this situation was amplified by the airport's proximity to urban Guatemala City (population, >1.1 million).
This example leads to two conclusions discussed further below. First, ash avoidance methodology needs further refinement. Second, there exists an apparent bias towards under-reporting of aircraft-ash encounters, which could short-change their cost to air carriers, their perceived risk, and their funding allocation.
The original report of an aircraft-ash encounter was brought to our attention by Captain Edward Miller of the Air Line Pilots Association and provided on the condition that the air carrier remain anonymous. Bulletin editors also wish to acknowledge conversations with several additional anonymous contacts (commercial pilots). This case occurred in Guatemala; however, analogous situations exist at many airports adjacent to volcanoes. Modest eruptions from nearby volcanoes may be uncertain or difficult to see; they may be hard to detect or characterize; yet they still may yield mobile ash plumes carried by complex local winds to confront air traffic (Salinas, 2001; Hefter, 1998; Casadevall, 1994).
Although in most Bulletin reports we favor the use of local time to emphasize the reference frame of people on the scene, most of the source material (satellite and aviation) for this report refer to UTC (Coordinated Universal Time). UTC is the time on the Greenwich meridian (longitude zero), formerly GMT, a term which has fallen out of use. Accordingly, there are cases in this report that lack conversion to local time. Local time in Guatemala is 6 hours behind UTC.
Activity at Fuego and Pacaya. Fuego erupted on 21 May 1999 sending ash to the S, SE, and SW and ultimately dropping up to 40 cm of ash on local settlements (BGVN 24:04). The eruption occurred at 1800 local time (in terms of UTC, at 0000 the next day). Three hours later the eruption decreased and the Aeronautica Civil recommended that planes go no closer to Fuego than 40 km. One hour after that (at 2200 local, 0400 UTC), the atmospheric ash had settled, and Aeronautica Civil recommended flying no closer to Fuego than 15 km.
Bulletin reports for Pacaya in mid-1999 suggested relative calm, in harmony with the observation that it had chiefly been fuming. However, Pacaya is well-known for Strombolian outbursts. It lies directly in-line and only 23 km S of the N10°E-oriented airstrip. As is common for commercial aircraft there, the approaches described below passed very close to Pacaya. Pacaya typically has lower and smaller eruptions than Fuego, but because it lies so close to the southern approach to the airport, Pacaya's ash plumes easily enter the path of landing aircraft. The situation was particularly complex during this eruption because Fuego's ash was reported on cities that lie below the flight path as well as on the Pacaya's flanks.
Pilot's report of aircraft-ash encounter. What follows was taken from one flight crew's description of events and from later reports and dialog on the topic. In order to preserve the confidentiality of the airlines, the precise times of events on 21 May 1999 have been omitted. Pilots reported clear visibility and light wind, with both the capital and the airport in sight. They maneuvered the aircraft for a final approach from the S. Pilots were advised by air traffic control about erupted particulate ("volcanic sand") about 24 km (15 miles) SE of the airport, well away from their projected path to Runway 01. In addition, based on winds they detected as they neared the airport, the pilots concluded that the erupted particulate to the SE was downwind from their projected flight path to the airport. (In retrospect, this conclusion appears tenuous considering the possibility of either a fresh injection of ash from Fuego, or lingering ash in the trailing portion of the plume that lay to the SE.)
At ~32 km (20 miles) distance from the runway, the pilots maneuvered the plane through ~3,000 m (9,700 feet) altitude on a final approach to the airport with the plane's flaps partially extended (at ~15°, which slowed their aircraft to ~260 km/hour (160 mph), its auxiliary power unit (a small jet engine) on, and its landing gear down. Around this point in their descent, pilots saw bright yellow sparks through the windshield lasting a few seconds, a display unlike static electricity, but rather like that from a grinding wheel. This occurred again at 2,500 m (8,200 feet) altitude, but was more intense yet intermittent.
At this time, air-traffic control announced to the pilots that the aircraft landing in front of them had encountered volcanic particulate; they instructed the pilots to abort their landing and climb to 3,350 m (11,000 feet) altitude. Discussions of options and ash avoidance ensued between pilots and air-traffic control; ash had by this time accumulated on the runway, further complicating landing, even for approaches in the opposite direction. The pilots retracted the landing gear, accelerated to ~410 km/hour (~250 mph), began to climb, and after some discussion with air-traffic control, held on a course NE of the airport. They were subsequently cleared to climb to 6,700 m (22,000 feet) altitude and advised to proceed to an alternate airfield.
During the climb, at ~5,800 m (19,000 feet) altitude en-route to the alternate airport, the aircraft encountered volcanic particulate for 10 minutes. Within that interval the plane spent 2 minutes during ascent engulfed in denser and heavier particulate. During that period, window arcing was constant and the beam of their landing lights revealed a conspicuous cloud of reflecting particles. During ash ingestion the engines's speed lacked noticeable fluctuations. The aircraft exited the plume at about 6,100 m (20,000 feet) altitude and landed without encountering additional ash.
Upon landing, the pilots noticed reduced visibility through abraded windshields. Post-flight examination of the airplane revealed heavy damage, requiring the replacement of the engines (US $2 million each) and auxiliary-power-unit engine. (Note, however, that no deterioration in engine power or performance was noticed during the flight.) Other replaced parts included windshields, a heat exchanger, and coalescer bags. Minor damage was seen on the horizontal stabilizer and wing leading-edges.
Volcanic Ash Advisory Statements. The U.S. National Oceanic and Atmospheric Administration (NOAA), Satellite Services Division website contains two archived statements issued by the Volcanic Ash Advisory Center (VAAC) at Washington, D.C. for Fuego on 21-22 May 1999. The statements, issued to the aviation cummunity to warn of volcanic hazards, are intended for an audience accustomed to special terminology (figures 2 and 3). In the interest of advancing understanding of how volcanological and atmospheric data get transmitted to aviators, we offer brief explanations for many of the terms used (figure 2).
The Washington VAAC received first notification of the Fuego eruption from a routine surface weather observation from Guatemala City at 2000 local time (0200 UTC) on 22 May. They issued the first Volcanic Ash Advisory Statement a half-hour later (figure 2). Six hours later they issued the second Advisory Statement (figure 3). The Advisories were composed by staff of the Satellite Analysis Branch, one of the two NOAA components forming the Washington VAAC (Streett, 1999; Washington VAAC).
The section "Details of ash cloud" first says that the "surface observation from Guatemala City indicate that the Fuego volcano is in eruption" and that no additional information is available and then briefly describes in words observations that came from satellite imagery. The first sentence, "No eruption . . ." is self-explanatory, but highlights a limitation of the method in use that needs to be emphasized to aviators: an eruption may have occurred but its status is not revealed on the imagery. The sentence, "No eruption could be detected due to thunderstorm cloudiness covering the area around the volcano" is self-explanatory. Less clear is the term convective debris. It does not refer to ash; rather, it refers to remnants of thunderstorms. The gist of these latter two sentences is simply that the thunderstorms that covered the area made it challenging or impossible to see the ash on satellite imagery. Central American thunderstorm clouds typically can reach altitudes of more than 12,000 m (40,000 feet), and can mask or obscure airborne ash residing below that level.
Members of the Washington VAAC commented that this eruption demonstrates key problems that can arise when cloudy conditions prevent satellite detection of ash, foiling a primary mode of analysis. In such cases, they rely on ground observers (including observatories and weather observers), pilot reports, and reports from airlines. Thus, their ability to issue useful information in cloudy conditions depends on the quality of communications with local observers, the Meteorological Watch Office, volcanologists, geophysical observatories, and the aviation community.
The Advisory Statement listed México City weather balloon data acquired 1,050 km NW of Guatemala City. In retrospect, the Washington VAAC noted that they generally avoid using such distant sounding data. If a closer sounding cannot be found, they prefer to use upper-level wind forecasts taken from a numerical weather model. In any case, the scarcity of local sounding data presents a challenge to the realistic analysis of airborne ash.
The outlook section says to "see SIGMETS." SIGMETS are the true warnings to aircraft for SIGnificant METeorological events. They are issued by regional Meteorological Watch Offices (MWOs), in this case the MWO (for Guatemala) is in Tegucigalpa, Honduras. SIGMETS were lacking for this eruption; although the Washington VAAC tried to contact the MWO without response. Another complexity confronted at the VAAC is a lack of a single scale for communicating a volcano's hazard status.
Reporting of aviation ash encounters. In personal communications with Bulletin editors, airline personnel stated that many more encounters have occurred than have yet been tallied in publically accessible literature. In accord with those assertions, the 21 May 1999 encounters are absent from reports compiled by the International Civil Aviation Organization (ICAO, 2001). In that document (Appendix I, table 3A, p. I-12) Fuego fails to appear as a source vent for any aircraft-ash encounter. Pacaya is listed for two encounters, in January 1987 and in May 1998 (BGVN 23:05).
Even though the number of encounters was probably under-represented and thus reflects a minimum, ICAO (2001) notes that the international costs to aviation since 1982 summed to well in excess of $250 million. They noted, "In addition to its potential to cause a major aircraft accident, the economic cost of volcanic ash to international civil aviation is staggering. This involves numerous complete engine changes, engine overhauls, airframe refurbishing... aircraft downtime... [and] volcanic ash clearance from airports and the damage caused to equipment and buildings on the ground."
The incidents here suggest that there has been a strong bias toward under-reporting aircraft-ash encounters. If this tentative conclusion is correct, it implies consistent understatements of the hazard's magnitude. This, in turn, may have thwarted meaningful analysis of how and whether to proceed with designing more robust hazard-reduction systems. Accordingly, resources that could have been devoted to the problem have not yet been committed (see Gimmestad and others, 2001 for a discussion of a prototype on-board ash-detection instrument).
Communication challenges. While much of the aviation community needs to learn about volcanism rapidly, dependably, and with the aid of the Internet, some observers charged with reporting volcanic-ash hazards in Central and South America lack access to basic communication devices like reliable telephones and fax machines. To reduce the risks, the aviation, meteorological, remote sensing, and volcanological communities need to improve their ability to pass critical information to each other rapidly and precisely. The operational systems related to volcanic ash and aviation must transcend numerous boundaries (eg., languages, infrastructure, funding, governments, agencies, air carriers, pilots, aircraft manufactures, etc.). The systems need to portray complex, dynamic processes such as the rapid rise of an explosive plume, or large-scale ash-cloud movement.
Although the infrastructure for ash avoidance is greater than ever, members of the Washington VAAC have told Bulletin editors that they still depend heavily on people on the scene of the eruption to notify them promptly when eruptions occur. They said that thus far in parts of Central and South America a problem has been the expense of communication (eg., by phone, fax, and Internet). They also said that for the same regions the U.S. meteorological database regularly lacks pilot reports. Though serious, these problems have at least been identified and their solutions would appear to lack great technical or economic barriers.
The pilots involved in the May 1999 encounter recommended that far more emphasis be placed on forecasting and avoiding ash plumes. Other pilots cited the need for fast and accurate communications between those who observe eruptive activity and air traffic control personnel.
Issues like these continue to be an important subject at gatherings on the topic of ash hazards in aviation (Casadevall, 1994; Streett, D., 1999; Washington VAAC, 1999). The Airline Dispatcher's Federation (ADF) will participate in a 7-9 May 2002 conference and workshop: "Operational Implications of Airborne Volcanic Ash: Detection, Avoidance, and Mitigation." The gathering will provide the pilot and dispatcher with insights into volcanic ash, including its characteristics, affects on aircraft, detection/tracking, effective warning systems, and mitigation. A "hands-on" exercise will make this the first gathering of its kind to provide lab-style instruction on interpretation of satellite and wind data, and on models of ash trajectory and dispersion. Representatives from the Boeing company, and a host of US government agencies and non-governmental organizations will attend. The workshop will include lectures, demonstrations, laboratory exercises, and a simulated-eruption exercise involving volcanologists, forecasters, controllers, dispatchers, and pilots.
A second international symposium on ash and aviation safety is being planned by the U.S. Geological Survey, organized by Marianne Guffanti. It will be held in Washington, D.C. in September 2003.
References. Casadevall, T.J. (ed.), 1994, Proceedings of the First International Symposium on Volcanic Ash and Aviation Safety: U.S. Geological Survey Bulletin 2047, 450 p.
Gimmestad, G.G., Papanicolopoulos, C.D., Richards, M.A., Sherman, D.L., and West, L.L., 2001, Feasibility study of radiometry for airborne detection of aviation hazards, NASA/CR-2001-210855; Georgia Tech Research Institute, Atlanta, Georgia, 51 p. (URL: http://techreports.larc.nasa.gov/ltrs/PDF/2001/cr/).
Hefter, J.L., 1998, Verifying a volcanic ash forecasting model, Airline Pilot, v. 67, no. 5, pp. 20-23, 54.
International Civil Aviation Organization (ICAO), 2001, Manual on volcanic ash, radioactive material, and toxic chemical clouds, doc 9691-AN/954 (first edition): 999 University St., Montreal, Quebec, Canada H3C 5H7 (purchasing information: sales_unit@icao.int).
Rose, W.I., Bluth, J.S.G., Schneider, D.L., Ernst, G.G.J., Riley, C.M., Henderson, L.J., and McGimsey, R.G., 2001, Observations of volcanic clouds in the first few days of atmospheric residence: The 1992 eruptions of Crater Peak, Mount Spurr volcano, Alaska, Jour. of Geology, v. 109, p. 677-694.
Salinas, Leonard J., 2001, Volcanic ash clouds pose a real threat to aircraft safety: United Airlines, Chicago, Illinois (URL: http://www.dispatcher.org/library/VolcanicAsh.htm).
Simkin, T., and Siebert, L., 1994, Volcanoes of the World, 2nd edition: Geoscience Press in association with the Smithsonian Institution Global Volcanism Program, Tucson AZ, 368 p.
Streett, D., 1999, Satellite-based Volcanic Ash Advisories and an Ash Trajectory Model from the Washington VAAC: Eighth Conference on Aviation, Range, and Aerospace Meteorology, 10-15 January 1999, Dallas, Texas; American Meteorological Society, p. 290-294.
Washington VAAC, 1999, Operations of the Washington Volcanic Ash Advisory Center, in Aeronautical meteorological offices and their functions, and meteorological observation networks: Third Caribbean/South American Regional Air Navigation Meeting (Car/sam/ran/3); Buenos Aires, Argentina, 5 - 15 October, 1999; International Civil Aviation Organization (http://www.ssd.noaa.gov/ VAAC/PAPERS/carsam.html).
Geologic Background. Volcán Fuego, one of Central America's most active volcanoes, is also one of three large stratovolcanoes overlooking Guatemala's former capital, Antigua. The scarp of an older edifice, Meseta, lies between Fuego and Acatenango to the north. Construction of Meseta dates back to about 230,000 years and continued until the late Pleistocene or early Holocene. Collapse of Meseta may have produced the massive Escuintla debris-avalanche deposit, which extends about 50 km onto the Pacific coastal plain. Growth of the modern Fuego volcano followed, continuing the southward migration of volcanism that began at the mostly andesitic Acatenango. Eruptions at Fuego have become more mafic with time, and most historical activity has produced basaltic rocks. Frequent vigorous historical eruptions have been recorded since the onset of the Spanish era in 1524, and have produced major ashfalls, along with occasional pyroclastic flows and lava flows.
Information Contacts: Captain Edward Miller, Air Line Pilots Association (ALPA), Air Safety & Engineering Department, 535 Herndon Parkway, PO Box 1169, Herndon, VA 22070-1169, USA; Grace Swanson and Davida Streett, Washington VAAC, Satellite Analysis Branch (NOAA/NESDIS), 4700 Silver Hill Road, Stop 9910, Washington, DC 20233-9910, USA (URL: http://www.ssd.noaa.gov/); Bill Rose, Geological Engineering and Sciences, Michigan Technological University, Houghton, MI 49931, USA.
Karymsky
Russia
54.049°N, 159.443°E; summit elev. 1513 m
All times are local (unless otherwise noted)
Elevated seismicity; possible explosions and avalanches in March 2002
Episodes of increased seismicity occurred during December 2000 through September 2001 (BGVN 26:08). Since then seismic activity at Karymsky has remained mostly above background levels. The Concern Color Code remained at Yellow ("volcano is restless") through at least late March 2002. Apparent steam plumes were seen in satellite imagery during January-March 2002.
On 4 January 2002, the Kamchatkan Volcanic Eruption Response Team (KVERT) reported above-background seismicity during the previous week, with 40 to 80 weak local earthquakes occurring per day. Several shallow seismic events suggested gas-ash explosions. Beginning at 1200 on 10 January the number of local earthquakes increased noticeably. During 11-14 January about 200 weak local shallow seismic events occurred per day.
During late January through at least March 2002, the seismic station typically recorded approximately 10 local shallow earthquakes per hour. Around 24 January, the earthquakes became slightly stronger. The character of the seismicity during mid-March suggested weak ash-gas explosions and avalanches.
The Tokyo VAAC reported that on 1 February at 1810 an eruption produced an ash cloud that reached ~7.5 km above the summit and drifted to the E; however, the cloud was not visible on satellite imagery. On 13 February at 0945 a pilot reported an ash cloud to ~3.5 km above the volcano extending to the W. Again, this cloud was not visible on satellite imagery; it may have been a single burst that dissipated rapidly.
No ash was detected in satellite images during the report period; only steam and possible airborne volcanic aerosols were visible during late February. Thermal anomalies and plumes were visible on AVHRR satellite imagery throughout the report period (table 1).
Table 1. Thermal anomalies and plumes visible on AVHRR satellite imagery at Karymsky during January through March 2002. Courtesy KVERT.
| Date |
Time (local) |
Size (pixels) |
Max. band-3 temperature |
Background temperature |
Visible plume |
| 19 Jan 2002 |
1659 |
2 |
31.6°C |
-21°C |
-- |
| 19 Jan-25 Jan 2002 |
2-4 |
-3.7 to 35.0°C |
-16 to -25°C |
-- |
| 21 Jan 2002 |
1614 |
-- |
-- |
-- |
Steam plume extending 45 km SE |
| 27 Jan 2002 |
1711 |
1 |
47.7°C |
-22°C |
-- |
| 28 Jan 2002 |
1646 |
-- |
-- |
-- |
Small steam plume extending 30 km NE |
| 03 Feb-08 Feb 2002 |
-- |
2-10 |
49.7 to -7°C |
-15 to -30°C |
-- |
| 05 Feb-06 Feb 2002 |
-- |
-- |
-- |
-- |
Steam plume extending 100-150 km E |
| 08 Feb 2002 |
0536 |
4 |
5.7°C |
-22°C |
-- |
| 13 Feb 2002 |
0538 |
4 |
0.1°C |
-23°C |
-- |
| 13 Feb 2002 |
1202 |
4 |
-1.7°C |
-22 to -28°C |
-- |
| 13 Feb 2002 |
1708 |
4 |
~49°C |
-20°C |
20-km long steam plume moving SW |
| 14 Feb 2002 |
1644 |
5 |
39°C |
-8°C |
Small plume extending N |
| 17 Feb 2002 |
0544 |
1 |
-3°C |
-22°C |
-- |
| 18 Feb 2002 |
1649 |
4 |
32°C |
-10°C |
Short plume extending NE |
| 19 Feb 2002 |
1622 |
-- |
-- |
-- |
Small steam plume extending 100 km E |
| 20 Feb 2002 |
0613 |
4 |
24.9°C |
-24°C |
-- |
| 21 Feb 2002 |
0550 |
4 |
-4.2°C |
-25°C |
-- |
| 22 Feb-01 Mar 2002 |
-- |
1-4 |
12 to 40°C |
-10 to -27°C |
-- |
| 22 Feb 2002 |
1650 |
-- |
-- |
-- |
Very diffuse cloud observed that could be related to volcanic aerosols |
| 27 Feb 2002 |
1635 |
-- |
-- |
-- |
20-km long faint steam plume extended E |
| 02 Mar-08 Mar 2002 |
-- |
1-4 |
1 to 15°C |
-17 to -24°C |
-- |
| 06 Mar 2002 |
1708 |
-- |
-- |
-- |
Bifurcated steam plume; first branch extended 10 km NE and the second branch extended 20 km SE |
| 16 Mar-22 Mar 2002 |
-- |
2-4 |
-6.8 to 35.6°C |
0 to -20°C |
-- |
| 19 Mar-20 Mar 2002 |
-- |
-- |
-- |
-- |
Small steam/aerosol plume extending SE |
| 22, 25 Mar 2002 |
-- |
1-3 |
-6.8 and 14°C |
-20°C |
-- |
General Reference. Khrenov, A.P., and others, 1982, Eruptive activity of Karymsky Volcano over the period of 10 Years (1970-1980): Volcanology and Seismology, no. 4, p. 29-48.
Tokarev, P.I., 1990, Eruptions and seismicity at Karymskii volcano in 1965-1986: Volcanology and Seismology, v. 11, p. 117-134 (in English).
Geologic Background. Karymsky, the most active volcano of Kamchatka's eastern volcanic zone, is a symmetrical stratovolcano constructed within a 5-km-wide caldera that formed during the early Holocene. The caldera cuts the south side of the Pleistocene Dvor volcano and is located outside the north margin of the large mid-Pleistocene Polovinka caldera, which contains the smaller Akademia Nauk and Odnoboky calderas. Most seismicity preceding Karymsky eruptions originated beneath Akademia Nauk caldera, located immediately south. The caldera enclosing Karymsky formed about 7600-7700 radiocarbon years ago; construction of the stratovolcano began about 2000 years later. The latest eruptive period began about 500 years ago, following a 2300-year quiescence. Much of the cone is mantled by lava flows less than 200 years old. Historical eruptions have been vulcanian or vulcanian-strombolian with moderate explosive activity and occasional lava flows from the summit crater.
Information Contacts: Olga Chubarova, Kamchatka Volcanic Eruptions Response Team (KVERT), Institute of Volcanic Geology and Geochemistry, Piip Ave. 9, Petropavlovsk-Kamchatsky, 683006, Russia; Tokyo Volcanic Ash Advisory Center (VAAC),Tokyo, Japan (URL: https://ds.data.jma.go.jp/svd/vaac/data/).
Kilauea (United States) — March 2002  Cite this Report
Kilauea
United States
19.421°N, 155.287°W; summit elev. 1222 m
All times are local (unless otherwise noted)
Lava stops entering sea during January, tilting in late March-April 2002
This report discusses activity at Kīlauea during mid-January through mid-April 2002. The flow of lava into the ocean in September (BGVN 26:12) at the Kamoamoa entry and, to a lesser extent, at the E Kupapa'u entry, terminated by the end of January. During February through mid-March lava flowed on the surface at elevations above or on the Pulama Pali slope and along the Kamoamoa lava tube system. Volcanic tremor occurred at moderate levels, and long-period (LP) earthquakes were registered below the caldera. In mid-March incandescence was visible from Pu`u `O`o crater. Incoming lava flooded the floor of Pu`u `O`o crater and excess lava flowed through lava tubes down the Pulama Pali slope to the coastal plain. Heightened activity continued and in early April a series of deflation and inflation events occurred. LP earthquakes increased and on 6 April observations of the crater lake in Pu`u `O`o crater revealed that the lava had risen to 17 m below the E rim.
Geophysical activity. Tiltmeters across the volcano showed no significant deformation until mid-March, although an M 4.1 earthquake had occurred at 0118 on 18 January. The earthquake was located 4 km SSE of the Pu`u `O`o crater at a depth of 9.1 km. During the following several days volcanic tremor remained moderate to strong at Pu`u `O`o. The swarm of long-period (LP) earthquakes at the summit continued through March. Just after 0300 on 27 March a small earthquake beneath the caldera triggered more than 30 minutes of increased tremor and small earthquakes.
Sharp deflation at Pu`u `O`o on 28 March accompanied a change in eruptive activity at the cone. On 31 March volcanic tremor was low-to-moderate at Pu`u `O`o and the continuing weak tremor below the caldera was broken occasionally by small LP earthquakes. Associated tilt across the volcano was flat or only changed slightly.
During 4-6 April, a series of deflation and inflation events occurred. In terms of tilt, at ~2100 on 4 April, Kīlauea's summit deflated (~1.7 µrad); 30 minutes later Pu`u `O`o followed (~9 µrad). This was reversed at 1600 on 5 April when rapid inflation began at the summit and ~12 minutes later at Pu`u `O`o. At 1700 inflation ended at the summit, and it abruptly deflated, as did Pu`u `O`o at 1800. Subsequently, tilt at Pu`u `O`o oscillated three times between rapid deflation and slower inflation. The tilt temporarily decreased, but at 0508 on 6 April another interval of 4.5 oscillations occurred followed by resumed tilt and slow, bumpy inflation. During this turbulent period LP earthquakes increased at the summit while tremor remained steady at Pu`u `O`o. By 7 April tilt was relatively steady, volcanic tremor at Pu`u `O`o was moderate, and tremor at the summit was low to moderate.
Lava flows. During mid-January surface lava traveled along the upper portion of the flow field above the Pulama pali slope and onto the coastal flat. Surface lava also emerged along the Kamoamoa lava tube system and traveled down the Pulama pali slope. These surface flows continued to be visible through February, although the flow reaching the coastal plain had stopped at the end of January. At times during early March several rootless shields (a pile of lava flows built over a lava tube rather than over a conduit feeding magma) were active. During 12-19 March a bright glow was widely visible over Kīlauea from Pu`u `O`o crater and from a rootless shield near 665 m elevation where the most intense surface activity occurred.
By 18 March lava had flooded the floor of Pu`u `O`o crater resulting in surface lava flows and lava flowing through tubes. Lava spread out on the lower fan and adjacent coastal flat, although the fronts of the flows remained ~2.3 km from the ocean. At the base of the lava fan and on the adjacent coastal flat the rootless shields remained active and small surface lava flows persisted through mid-April.
Eruptive activity changed on 28 March, as noted above, and overflight observations revealed new lava located W of the main crater. Observers also saw lava fountaining and forming a circulating pond. By 31 March a lava flow was visible on the floor of Pu`u `O`o crater and several vents were incandescent. During a brief visit to Pu`u `O`o on 6 April observers noticed that the crater lake had risen ~8 m since 29 March (the lake surface was 17 m below the E rim), several cones were active, and lava was flowing into the lava lake from two vents. By the following day activity had decreased and by 8 April incandescence was no longer visible at Pu`u `O`o.
General References. Decker, R.W., Wright, T.L., and Stauffer, P.H., 1987, (eds.), Volcanism in Hawaii: USGS Professional Paper 1350, 1667 p. (64 papers).
Ryan, M.P., 1988, The mechanics and three-dimensional internal structure of active magmatic systems: Kīlauea volcano, Hawaii: JGR, v. 93, p. 4213-4248.
Dzurisin, D., Koyanagi, R.Y., and English, T.T., 1984, Magma supply and storage at Kīlauea volcano, Hawaii, 1956-1983: JVGR, v. 21, no. 3/4, p. 177-207.
Heliker, C., Griggs, J.D., Takahashi, T.J., and Wright, T.L., 1986/7, Volcano monitoring at the U.S. Geological Survey's Hawaiian Volcano Observatory: Earthquakes and Volcanoes, v. 18, no. 1, p. 3-71.
Geologic Background. Kilauea overlaps the E flank of the massive Mauna Loa shield volcano in the island of Hawaii. Eruptions are prominent in Polynesian legends; written documentation since 1820 records frequent summit and flank lava flow eruptions interspersed with periods of long-term lava lake activity at Halemaumau crater in the summit caldera until 1924. The 3 x 5 km caldera was formed in several stages about 1,500 years ago and during the 18th century; eruptions have also originated from the lengthy East and Southwest rift zones, which extend to the ocean in both directions. About 90% of the surface of the basaltic shield volcano is formed of lava flows less than about 1,100 years old; 70% of the surface is younger than 600 years. The long-term eruption from the East rift zone between 1983 and 2018 produced lava flows covering more than 100 km2, destroyed hundreds of houses, and added new coastline.
Information Contacts: Hawaiian Volcano Observatory (HVO), U.S. Geological Survey, PO Box 51, Hawaii National Park, HI 96718, USA (URL: https://volcanoes.usgs.gov/observatories/hvo/).
Manam (Papua New Guinea) — March 2002  Cite this Report
Manam
Papua New Guinea
4.08°S, 145.037°E; summit elev. 1807 m
All times are local (unless otherwise noted)
Mild eruptions during January-February 2002
Activity at Manam remained relatively low following a 4 June 2000 eruption (BGVN 25:07). During August and September 2001, the Rabaul Volcanological Observatory (RVO) reported occasional emissions of weak-to-moderate volumes of white vapor. Weak emissions were also observed from South Crater.
On 13 January 2002 mild eruptive activity began from South Crater. Weak gray-brown ash clouds were emitted at 5-10 minute intervals. Fine, light ashfall was reported on the NE side of the island. Ashfall was reported again on 16, 20, 21, 22, 26, 29, 30, and 31 January, produced by activity ranging from gentle emissions to forceful projections of weak-to-moderate gray-brown and occasionally dark-gray ash clouds, during periods lasting a few hours. Most of the activity was accompanied by weak, deep, low roaring and rumbling noises. Explosion noises were heard on 20 January, and incandescence was observed on 17 and 20 January. The incandescence on 20 January fluctuated but occasionally intensified and projected glowing lava fragments.
Similar mild eruptive activity continued through much of February. Fine ashfall occurred on the SE part of the island. Weak-to-bright incandescence was observed on 13 February, after a loud explosion at 0225. The explosion was also followed by weak roaring and rumbling noises at one-minute intervals lasting for ~1 hour. During 20-24 February activity decreased and continuous weak volumes of white vapor were emitted. Main Crater released only weak-to-moderate volumes of white vapor.
People living in and near the four valleys (especially those in the NE and SE) were urged to be cautious and remain away from the valleys as much as possible.
More recently, a period of activity began in December 1956 that lasted through January 1966. Lava flows and a nuee ardente from the South Crater occurred in June and December 1974, and intermittent moderate explosive activity has continued, with peaks of activity in 1982 and 1984. The water-tube tiltmeter is located at Tabele Observatory, 4 km from the summit on the SW flank.
General References. de Saint Ours, P., 1982, Potential volcanic hazards at Manam Island: Geological Survey of Papua New Guinea Report 82/22, 19 p.
Scott, B.J., and McKee, C.O., 1986, Deformation, eruptive activity, and earth tidal influences at Manam volcano, Papua New Guinea, 1957-1982: Royal Society of New Zealand Bulletin 24, p. 155-171.
Geologic Background. The 10-km-wide island of Manam, lying 13 km off the northern coast of mainland Papua New Guinea, is one of the country's most active volcanoes. Four large radial valleys extend from the unvegetated summit of the conical basaltic-andesitic stratovolcano to its lower flanks. These valleys channel lava flows and pyroclastic avalanches that have sometimes reached the coast. Five small satellitic centers are located near the island's shoreline on the northern, southern, and western sides. Two summit craters are present; both are active, although most observed eruptions have originated from the southern crater, concentrating eruptive products during much of the past century into the SE valley. Frequent eruptions, typically of mild-to-moderate scale, have been recorded since 1616. Occasional larger eruptions have produced pyroclastic flows and lava flows that reached flat-lying coastal areas and entered the sea, sometimes impacting populated areas.
Information Contacts: Ima Itikarai, Rabaul Volcano Observatory (RVO), P.O. Box 386, Rabaul, Papua New Guinea.
Miyakejima
Japan
34.094°N, 139.526°E; summit elev. 775 m
All times are local (unless otherwise noted)
Eruptive activity decreases; high SO2 flux through April 2002
The following report covers activity at Miyake-jima after February 2001 and through April 2002, but a brief review of previous activity is included. Volcanism renewed at Miyake-jima on 27 June 2000 with a series of underwater eruptions (BGVN 25:05-25:07). Activity through October 2000 was characterized by intrusive events, collapse of the summit crater, explosive events, and degassing. SO2 emissions were high and low levels of ash were intermittently emitted (BGVN 25:09). During October 2000 through mid-February 2001 high volumes of volcanic gas emission continued (BGVN 26:02).
After a large eruption on 18 August 2000, large amounts of volcanic gas, especially SO2, started to discharge. SO2 flux monitoring by COSPEC V has been conducted since 26 August 2000. Monitoring is performed almost daily by the Japanese Meteorological Agency (JMA) and Geological Survey of Japan (GSJ). Figure 14 shows the daily average of SO2 flux during August 2000 through April 2002. The mean flux during September-December 2000 was ~40,000 metric tons per day (t/d). During 2000, the average SO2 flux was 40,000 t/d, and it decreased to 21,000 t/d during 2001. As of March 2002 the average SO2 flux was 10,000-20,000 t/d. During the 26 September 2001 explosion the amount of SO2 degassing was ~15,000 t/d.
In November 2001 the GSJ reported that the strong eruptions of July-August 2000, initially thought to be solely phreatic, had been phreatomagmatic. For instance, tephra from the 18 August 2000 eruption was ~30-40% juvenile in nature. Following the 29 August 2000 eruption, activity was much weaker. A summit pit crater or caldera, formed as a result of "drain back" as magma was intruded elsewhere, stabilized in August 2000 with a diameter of 1.4 km.
On 16 March 2001 the JMA reported that the strongest tremor since 29 August 2000 had occurred. Three days later, on 19 March, an eruption produced a black ash cloud that rose 800 m above the volcano.
In mid-May 2001, based on information from the JMA, the Volcanic Research Center reported that no ash clouds had been observed since 19 March. They also reported that steam plumes with abundant SO2 were continuously emitted from the summit caldera to 0.5-2 km above the caldera rim. Continuous SO2 emission released as much as 33,000 to 46,000 metric tons of SO2 per day (figure 14). Low-level seismic activity continued; on 5 May 2001 a total of 446 small low-frequency earthquakes were registered, and on 7 May an M 2.8 earthquake occurred. Global positioning system (GPS) measurements showed steady, continuous deflation of the volcano, though the rate was lower than before September 2000. Very small collapses of the caldera rims were occasionally seen during air inspections.
About 20 small eruptions were recorded by the JMA during 2001 through the end of March 2002. Major eruptions were reported on 27 May, 26-27 September, and 16 October 2001. The eruptions produced ash plumes up to 1,500 m high.
On 25 January 2002 at 1015 Air Force Weather Agency staff detected a faint E-drifting volcanic plume emanating from Miyake-jima on MODIS imagery (figure 15).
The GSJ reported that as of 1 April 2002, eruptions were continuing and significant quantities of SO2 (10,000-20,000 t/d) discharged from the summit pit crater (figure 14). According to a news report, a minor eruption occurred at Miyake-jima on 2 April shortly after 1000. While evacuated residents were visiting the island, ash rose to ~300 m above the volcano and fell around Miyake-jima. The island is currently uninhabited because activity that began on 26-27 June 2000 prompted officials to order an evacuation on 1 September 2000.
Geologic Background. The circular, 8-km-wide island of Miyakejima forms a low-angle stratovolcano that rises about 1,100 m from the sea floor in the northern Izu Islands about 200 km SSW of Tokyo. The basaltic volcano is truncated by small summit calderas, one of which, 3.5 km wide, was formed during a major eruption about 2,500 years ago. Numerous craters and vents, including maars near the coast and radially oriented fissure vents, are present on the flanks. Frequent eruptions have been recorded since 1085 CE at vents ranging from the summit to below sea level, causing much damage on this small populated island. After a three-century-long hiatus ending in 1469 CE, activity has been dominated by flank fissure eruptions sometimes accompanied by minor summit eruptions. A 1.6-km-wide summit crater was slowly formed by subsidence during an eruption in 2000.
Information Contacts: Japan Meteorological Agency (JMA), Volcanological Division, 1-3-4 Ote-machi, Chiyoda-ku, Tokyo 100, Japan (URL: http://www.jma.go.jp/); Setsuya Nakada and Hidefumi Watanabe, Volcano Research Center, Earthquake Research Institute, University of Tokyo, Yayoi 1-1-1, Bunkyo-ku, Tokyo 113-0032, Japan (URL: http://www.eri.u-tokyo.ac.jp/VRC/index_E.html); Akihiko Tomiya, Geological Survey of Japan (GSJ), National Institute of Advanced Industrial Science and Technology (AIST), Tsukuba Central 7, Tsukuba 305-8567, Japan (URL: http://staff.aist.go.jp/a.tomiya/miyakeE.html); Charles Holliday, Air Force Weather Agency (AFWA),106 Peacekeeper Dr., Ste 2NE; Offutt AFB, NE 68113-4039 USA; National Aeronautics and Space Administration (NASA), Washington, DC 20456-0001, USA (URL: https://www.nasa.gov/); Kusatsu-Shirane Volcano Observatory (KSVO), Tokyo Institute of Technology, Kusatsu, Agatsuma-gun, Gunma 377-17, Japan; Dow Jones News.
Nyiragongo (DR Congo) — March 2002  Cite this Report
Nyiragongo
DR Congo
1.52°S, 29.25°E; summit elev. 3470 m
All times are local (unless otherwise noted)
Report of field work; MODIS imagery from January 2002 eruption
During 17-18 January 2002 Nyiragongo, located ~18 km N of Lake Kivu in the Democratic Republic of Congo (DRC) close to the border of Rwanda, erupted an estimated 20 x 106 m3 volume of lava (BGVN 26:12). Lava flows originated from the central crater and from several locations along a huge system of fractures that rapidly developed along the entire S flank of the volcano down to the city of Goma (~400,000 people) on the N shore of Lake Kivu. Goma was then invaded by extensive lava flows, which destroyed at least 13% of the surface of the city before reaching the lake. The advancing lava flows caused the spontaneous evacuation of at least 300,000 people, mostly toward the neighboring town of Gisenyi in Rwanda, and left more than 40,000 people homeless. About 100 people died as a consequence (direct or indirect) of the eruption. This disaster required an urgent public health response to evaluate the hazards to life and health. The assessment was especially important because of the humanitarian crisis in the eastern DRC that led many of the people who had fled from the lava flows to return to the city within one or two days, despite the danger of further eruptive activity or the possible risks arising from the proximity of the cooling lava flows (Baxter, 2002).
The following report, with the exception of the Moderate Resolution Imaging Spectroradiometer (MODIS) imagery, was compiled from field visits carried out by the volcanologists representing the United Nations Office for the Coordination of Human Affairs (UN-OCHA): Dario Tedesco, Paolo Papale, Orlando Vaselli, and Jacques Durieux. The team flew over the volcano and Goma in a helicopter on 22 and 24 January, and made field observations during 23 January-4 February. One team member continued studies on Lake Kivu until 13 February. The report provides an initial reconstruction of the main events of the eruption based on reports from local witnesses, observations and reports by researchers at the Goma Volcano Observatory (GVO), a closer inspection of seismograms recorded by GVO seismic stations, and field work by the UN-OCHA team. The UN-OCHA team worked closely with a French-British team of scientists (Patrick Allard, Peter Baxter, Michel Halbwachs, and Jean-Christophe Komorowski), whose report (Allard and others, 2002) will be summarized in a future Bulletin.
Activity during December 2000-January 2002. Since December 2000 the two GVO seismic stations had recorded long-period (LP) earthquake swarms. Commonly, each LP event was shortly followed by volcanic tremor.
On 6 February 2001 Nyamuragira erupted (BGVN 26:01). Following the 2-week eruption, seismicity did not decrease. On the contrary, volcanic tremor and LP earthquakes reappeared at both stations (Bulengo, BSS, S of Nyiragongo and Katale, KSS, NE of Nyiragongo, ~40 km from Bulengo), without showing any particular pattern, from March 2001 through January 2002. During the 10 months that preceded the January 2002 eruption, it was impossible to distinguish which volcano was the source of the seismicity.
In addition to the increased seismic activity, on 5 October strong vibrations were felt and on 7 October a strong tectonic earthquake (M 3.5-4.0), unusual for this region, was felt by the population. This earthquake was followed a few hours later by high-amplitude volcanic tremor.
Field trips by GVO personnel to the summit of Nyiragongo during 29 October-1 November and 8-10 December 2001 revealed several important changes. Immediately after the October tectonic event a white plume was visible inside the 1977 eruptive fracture on top of and inside the Shaheru crater (2 km S of the summit crater) at 2,700 m elevation. A similar plume was emerging from new cracks in the inner wall of the central crater, while a dark plume was visible from the small 1995 spatter cone inside the volcano. The new fumaroles on the side of the small central crater had a temperature of 70°C; the ground temperature, which was normally at 5-9°C, was recorded as 28°C; cracks near Shaheru crater were at ~50°C.
An increase in seismicity similar to that observed during early October occurred beginning on 4 January 2002, when an M > 4 earthquake occurred. On 7 January seismic activity triggered some visible changes, including reactivation of fumarolic activity. Following the 4 January earthquake seismicity remained high until 16 January. The onset of the eruption was preceded by about 8 hours of calm consisting of very low seismicity (without tremor or LP earthquakes).
Eruption during 17-18 January 2002. Early on 17 January a huge system of fractures began to develop on the S flank and eventually extended from high elevations down to Goma and Lake Kivu. The main trend of fractures was N15°W, which is similar to the general trend of the rift valley in the Nyiragongo region. The system of fractures appears to have propagated down from the volcano, starting at 2,800-3,000 m elevation (300-400 m N of the old Shaheru crater), and covering a distance of ~10 km towards Goma in less than 8 hours. The uppermost portion of the fracture started erupting at 0835 on 17 January. A single fracture ~2 m wide was visible above and inside Shaheru. Reactivated during the January event, it corresponded to the eruptive fracture of January 1977. Below the Shaheru crater the fracture was replaced by a more complex system, with two parallel main fractures ~300 m apart, also propagating N15°W. At about 1000 the system of fractures had reached ~1,900 m elevation; they then took ~30 minutes to cross the last system of ancient cones N of Goma, at ~1,700 m. By about 1400 the fractures were in the proximity of the Munigi village on the outskirts of Goma.
As the fractures advanced, several started erupting. Beginning around 1000 and lasting for at least two hours, lava flows escaped at ~1,950-2,000 m elevation S of the ancient Kanyambuzi-Mudjoga tuff cones. Fractures on the gentle slopes N of Goma lacked venting lava along a portion a few kilometers in length, but, at several locations the tips of intruded dykes ascended within only a few ten's of centimeters to a few meters below the ground surface.
At 1610 on 17 January the southernmost system of vents opened S of Munigi village and on the outskirts of Goma at 1,570-1,580 m elevation. Lava flows from these vents affected the Goma airport and destroyed part of the city before reaching the lake. About 10-20 minutes later a new N15°W-oriented fracture began to erupt at 1,950-2,000 m elevation, located ~1.5 km W of the main fracture system. Lava flows from this fracture partially destroyed the western part of Goma without reaching the lake.
Around the same time a fracture a few hundred meters long opened on the NW flank of the cone, at ~2,700-3,000 m elevation as estimated by helicopter, producing a lava flow that did not affect inhabited areas. Unlike the southern fracture system, this fracture had an estimated N30°E to N60°E trend. The eruptive activity at several places along the fracture system on the S flank reportedly lasted through part of the night or even up to daylight on 18 January.
MODIS images on 18, 21, and 27 January showed a hot spot in the vicinity of the volcano (figure 13). The 18 January image showed a single, large hot spot (3-4 pixels wide and ~11 pixels long on the S flank of Nyiragongo. The elongate hot spot had a NNE-SSW orientation. Its proximal section was located about mid-way up the S flank of the volcano (in the vicinity of the Shaheru-Djoga cinder cones and 1977 S-flank fissure) and the distal section was directly over Goma. The hot spot decreased over the following days, and by 27 January was barely visible.
Activity following the eruption. During the night of 21 January some earthquake swarms created panic in the population. During about 0600-1800 on 22 January no earthquakes were felt. However, at about 1800 a sequence began during which ~20 earthquakes were felt in less than 3 hours. The following days were characterized by periods of intense seismicity, alternating with intervals (~10-15 hours) of lower seismic activity.
Seismic events showed quite a range of magnitude, frequency content, and S-P times, suggesting several different origins. The earthquakes that occurred in the days following the eruption were ~M > 5. During the 5 days following the eruption ~100 tectonic earthquakes (M > 3.5) occurred with epicenters in the Goma-Nyiragongo region. Several houses collapsed or were seriously damaged due to seismic loading in Gisenyi, where nine people died as a direct result of roof collapse. Seismic signals showed a typical sequence of tectonic events, followed within minutes to hours by LP events and volcanic tremor lasting continuously for more than 10 hours. Such a sequence, which is identical to the typical sequence recorded during the year preceding the eruption, suggested rock fracturing followed by the intrusion and ascent of magma.
An estimate of the location of seismic events made by comparing the arrival time differences of P- and S-waves at the three seismic stations of Bulengo, Katale, and Goma (the last one provided by the French-British team) showed that on 27 and 28 January the shocks were concentrated in the area between the Nyiragongo crater and Goma, probably 4-6 km N of Lake Kivu. During the first days of February the epicenters of earthquakes were clustered in two areas. The first was along the system of fractures, stretching a few kilometers N and S of Goma (in part, beneath Lake Kivu). The second cluster lay S of the town of Sake, 15-20 km W of Goma, close to the W border of the rift.
Observations during a helicopter flight over the volcano on 21 January revealed that the crater floor (old surface of the 1994-95 lava lake) was cut by a N-S elongated depression (like a small graben) underlain by steaming cracks. The next day witnesses from villages 6 km SW and ~10 km N of the summit crater reported that at about 2100 an earthquake was felt and immediately followed by a red glow or "flames" above the crater. Later that evening fine ash fell along the road from Goma to Sake. On the morning of 23 January ash fell in Goma and at the airport. A helicopter survey revealed a layer of ash on the volcano's upper S and E flanks and devastated vegetation on the crater's N flank.
On 24 January the inside of the crater appeared as a huge cavity with an estimated depth of 800 m and a grayish-yellow colored floor. The old terraces that represented the remnants of the lava lake at different stages of its long history were nearly totally absent. The interpretation is that either the emptying of the lava lake, the fracturing of the system, or more likely both, destabilized the inner part of the crater. Seismic records showed higher-amplitude tremor, presumably related to the crater-floor collapses, starting on 22 January at 2051 and lasting for ~4 hours. During the same flight on 24 January an explosion or a new collapse at the crater produced a small cloud of steam and ash that reached a few hundred meters above the crater rim.
Gas blasts sporadically occurred, mainly after the eruption, ~100-200 m away from the main path of the lava flow in Goma causing displacement of pavement in small buildings. In a small garage in Goma a thick (~10 cm) concrete pavement was cracked and uplifted up to 50-70 cm by the gas blasts.
Observations and research at Lake Kivu. Interesting phenomena were noted on the shore of Lake Kivu in the area of Himbi. Women who used to wash clothes close to the lake observed that the water level had decreased a few centimeters 3-5 days before the eruption. During the night and early morning of 17-18 January waiters at a restaurant observed crabs and crayfish jumping out of the lake. During 20-21 January dead fish and bubbling spots were observed in the small bay close to the restaurant. Waiters stated that the temperature of the lake in those zones had increased and a brown-black stain appeared from the bottom of the lake in an area of several square meters. At the same time an odor of spoiled eggs (suggesting presence of H2S) was present. A similar phenomenon occurred early in the morning (at about 0230) on 30 January after an M 4.5 earthquake. The owners of the restaurant suddenly awoke due to difficulty breathing and the strong smell of rotten eggs. In both cases, the "normal" conditions were reestablished in a "short" (not well-defined) time. Soil-gas measurements indicated that CO2 concentrations reached values up to 20%.
A geochemical survey of the main fluid manifestations in and around the S part of Nyiragongo was carried out during the days after the 17 January eruption. Sampling included water from Lake Kivu, cold and thermal springs, dry vents, and soil gases. The main conclusions of this survey were: 1) contrary to rumors following the entry of lava flows into the lake, lake water only a few meters away from the lava front was not polluted; 2) the geochemical characteristics of water from the lake and from springs on land are close to those found previously by Tietze and others (1980) and Tuttle and others (1990); and 3) the analyzed gases appear to have a clear magmatic origin as revealed by their isotopic signature. An exception to the final conclusion is that gases from the Rambo sampling point, which sits next to a brewery in Gisenyi, appear to represent mixtures between biogenic (organic) and magmatic sources.
Immediately following the eruption, fishermen reported visible changes in the water level at Lake Kivu. This was confirmed by women who visited the lake shore daily for washing or collecting water. A series of measurements was started in close cooperation with the UN field officer Dominic Garcin, who has a vast knowledge of the lake. The first measurements were obtained on 28 January along the shoreline from Gisenyi to Sake. The results confirmed a significant subsidence of the ground and rise of the water level. The subsidence was highest (37 cm) in Goma, then progressively vanished towards the E (~10 cm in Gisenyi but 0 cm ~2 km farther E) and W (0 cm ~15 km W of Goma). After these first measurements, several others were systematically taken along the N shoreline of Lake Kivu as well as around the lake up to ten's of kilometers S of Goma, and at Idjwi Island, ~30 km S of Goma. The measurements showed that ground subsidence is an ongoing phenomenon in the entire rift area near Lake Kivu. One month after the eruption, maximum measured ground subsidence was 50-60 cm at the Goma harbor and at Idjwi Island (figure 14). Scientists note that the February-March westward shifting of the ground subsidence corresponds to a similar westward shifting of epicenters.
Conclusions. The characteristics of the erupted products and associated lava flows, together with the available information on the state of the volcano prior the eruption, suggest different dynamics of magma emission in the upper and lower portions of the fracture system. Two different interpretations have been offered. The "magmatic" hypothesis is that the energy for intense fracturing of the volcanic apparatus came from deep magma pushing from below inside the volcanic system. The "tectonic" hypothesis is that the energy for fracturing came from a non-volcanic source and was due to a rifting event related to regional tectonics. Further discussion of both hypotheses is offered in the report by the UN-OCHA team (Tedesco and others, 2002).
Goma is considered at a very high risk should reactivation of the volcano and rift system occur. The security of its inhabitants cannot be guaranteed even with the most sophisticated instrumental network. Thousands of lives can be saved by increased surveillance, continued scientific investigation, contingency plans, and information campaigns.
An outstanding effort by the UN and several donors allowed for the development of short and long-term aid to the Goma Volcano Observatory (GVO). This effort included support for foreign volcanologists, purchase of new equipment, establishing a new monitoring network, and help with logistics (transportation, communications, salaries, etc.). GVO is now publishing weekly reports on volcano activities.
References. Allard, P., Baxter, P., Halbwachs, M., and Komorowski, J-C, 2002, Final report of the French-British scientific team: submitted to the Ministry for Foreign Affairs, Paris, France, Foreign Office, London, United Kingdom and respective Embassies in Democratic Republic of Congo and Republic of Rwanda, 24 p.
Baxter, P.J., 2002, Eruption at Nyiragongo volcano, Democratic Republic of Congo, 17-18 January 2002: a report on a field visit to assess the initial hazards of the eruption, 15 p.
Tedesco, D., Papale, P., Vaselli, O., and Durieux, J., 2002, The January 17th, 2002 eruption of Nyiragongo, Democratic Republic of Congo: UN-OCHA report, 17 p.
Tietze, K., Geyh, M., Muller, H., Schroder, L. Stahl, W., and Wehner, H., 1980, Geol. Rund., v. 69, p. 452-472.
Tuttle, M.L., Lockwood, J.P., and Evans, W.C., 1990, Natural hazards associated with Lake Kivu in Rwanda and Zaire, central Africa: U.S. Geological Survey, Open File Report 90-691, 47 p.
General Reference. Tazieff, H., 1979, Nyiragongo, the forbidden volcano, translated by J. F. Bernard: Barron's, New York, 287 p. Originally published as Nyiragongo: Flammarion, Paris, 1975.
Geologic Background. The Nyiragongo stratovolcano contained a lava lake in its deep summit crater that was active for half a century before draining catastrophically through its outer flanks in 1977. The steep slopes contrast to the low profile of its neighboring shield volcano, Nyamuragira. Benches in the steep-walled, 1.2-km-wide summit crater mark levels of former lava lakes, which have been observed since the late-19th century. Two older stratovolcanoes, Baruta and Shaheru, are partially overlapped by Nyiragongo on the north and south. About 100 cones are located primarily along radial fissures south of Shaheru, east of the summit, and along a NE-SW zone extending as far as Lake Kivu. Many cones are buried by voluminous lava flows that extend long distances down the flanks, which is characterized by the eruption of foiditic rocks. The extremely fluid 1977 lava flows caused many fatalities, as did lava flows that inundated portions of the major city of Goma in January 2002.
Information Contacts: Dario Tedesco, Dipartimento Scienze Ambientali, Seconda Universita' di Napoli, Via Vivaldi 43, 81100 Caserta, Italy; Paolo Papale, Istituto Nazionale di Geofisica e Vulcanologia, via S. Maria, 53, I-56126 Pisa, Italy; Orlando Vaselli, Dipartimento Scienze della Terra, via G. La Pira, 4, 50121 Firenze, Italy; Jacques Durieux, Groupe d'Etude des Volcans Actifs, 6, Rue des Razes 69320 Feyzin, France; Dieudonné Wafula, Goma Volcano Observatory, Departement de Geophysique, Centre de Recherche en Sciences Naturelles, Lwiro, D.S. Bukavu, DRC; Andy Harris, Eric Pilger and Luke Flynn, Hawaii Institute of Geophysics and Planetology at the School of Ocean and Earth Science Technology (HIGP/SOEST), University of Hawaii, 2525 Correa Road, Honolulu, HI 96822 USA; Peter Baxter, Department of Community Medicine, Institute of Public Health, University of Cambridge, University Forvie Site, Robinson Way, Cambridge, CB2 2SR, United Kingdom.
Pacaya
Guatemala
14.382°N, 90.601°W; summit elev. 2569 m
All times are local (unless otherwise noted)
Costly 1999 aircraft-ash encounters due to ash plumes
At least two commercial aircraft flew through airborne ash near the Guatemala City airport on 21 May 1999. An eruption from Fuego that day was the first at that volcano since 1987 (BGVN 24:04). Although the aviator's reports attributed the ash from this encounter to Fuego, their aircraft intersected multiple ash plumes in widely different locations, and thus they may also have crossed plumes from Pacaya. The most likely plume near the southern approach to the airport (La Aurora, ~23 km N of Pacaya; ~40 km NE of Fuego) is from the almost constantly active Pacaya. In contrast, Fuego lies 32 km W of Pacaya and was the likely source of a plume intersected later during the flight, at higher altitude, and for much longer duration.
During the encounters the ~100 or more people on board the two aircraft, and many more on the ground, were at risk. Both encounters seriously damaged the aircraft but ended in safe landings without reported injuries. Volcanic ash can cause jet-engine failure, which creates a hazard not only to passengers, but to people on the ground as well. The risk in this situation was amplified by the airport's proximity to urban Guatemala City (population, >1.1 million).
This example leads to two conclusions discussed further below. First, ash avoidance methodology needs further refinement. Second, there exists an apparent bias towards under-reporting of aircraft-ash encounters, which could short-change their cost to air carriers, their perceived risk, and their funding allocation.
The original report of an aircraft-ash encounter was brought to our attention by Captain Edward Miller of the Air Line Pilots Association and provided on the condition that the air carrier remain anonymous. Bulletin editors also wish to acknowledge conversations with several additional anonymous contacts (commercial pilots). This case occurred in Guatemala; however, analogous situations exist at many airports adjacent to volcanoes. Modest eruptions from nearby volcanoes may be uncertain or difficult to see; they may be hard to detect or characterize; yet they still may yield mobile ash plumes carried by complex local winds to confront air traffic (Salinas, 2001; Hefter, 1998; Casadevall, 1994).
Although in most Bulletin reports we favor the use of local time to emphasize the reference frame of people on the scene, most of the source material (satellite and aviation) for this report refer to UTC (Coordinated Universal Time). UTC is the time on the Greenwich meridian (longitude zero), formerly GMT, a term which has fallen out of use. Accordingly, there are cases in this report that lack conversion to local time. Local time in Guatemala is 6 hours behind UTC.
Activity at Fuego and Pacaya. Fuego erupted on 21 May 1999 sending ash to the S, SE, and SW and ultimately dropping up to 40 cm of ash on local settlements (BGVN 24:04). The eruption occurred at 1800 local time (in terms of UTC, at 0000 the next day). Three hours later the eruption decreased and the Aeronautica Civil recommended that planes go no closer to Fuego than 40 km. One hour after that (at 2200 local, 0400 UTC), the atmospheric ash had settled, and Aeronautica Civil recommended flying no closer to Fuego than 15 km.
Bulletin reports for Pacaya in mid-1999 suggested relative calm, in harmony with the observation that it had chiefly been fuming. However, Pacaya is well-known for Strombolian outbursts. It lies directly in-line and only 23 km S of the N10°E-oriented airstrip. As is common for commercial aircraft there, the approaches described below passed very close to Pacaya. Pacaya typically has lower and smaller eruptions than Fuego, but because it lies so close to the southern approach to the airport, Pacaya's ash plumes easily enter the path of landing aircraft. The situation was particularly complex during this eruption because Fuego's ash was reported on cities that lie below the flight path as well as on the Pacaya's flanks.
Pilot's report of aircraft-ash encounter. What follows was taken from one flight crew's description of events and from later reports and dialog on the topic. In order to preserve the confidentiality of the airlines, the precise times of events on 21 May 1999 have been omitted. Pilots reported clear visibility and light wind, with both the capital and the airport in sight. They maneuvered the aircraft for a final approach from the S. Pilots were advised by air traffic control about erupted particulate ("volcanic sand") about 24 km (15 miles) SE of the airport, well away from their projected path to Runway 01. In addition, based on winds they detected as they neared the airport, the pilots concluded that the erupted particulate to the SE was downwind from their projected flight path to the airport. (In retrospect, this conclusion appears tenuous considering the possibility of either a fresh injection of ash from Fuego, or lingering ash in the trailing portion of the plume that lay to the SE.)
At ~32 km (20 miles) distance from the runway, the pilots maneuvered the plane through ~3,000 m (9,700 feet) altitude on a final approach to the airport with the plane's flaps partially extended (at ~15°, which slowed their aircraft to ~260 km/hour (160 mph), its auxiliary power unit (a small jet engine) on, and its landing gear down. Around this point in their descent, pilots saw bright yellow sparks through the windshield lasting a few seconds, a display unlike static electricity, but rather like that from a grinding wheel. This occurred again at 2,500 m (8,200 feet) altitude, but was more intense yet intermittent.
At this time, air-traffic control announced to the pilots that the aircraft landing in front of them had encountered volcanic particulate; they instructed the pilots to abort their landing and climb to 3,350 m (11,000 feet) altitude. Discussions of options and ash avoidance ensued between pilots and air-traffic control; ash had by this time accumulated on the runway, further complicating landing, even for approaches in the opposite direction. The pilots retracted the landing gear, accelerated to ~410 km/hour (~250 mph), began to climb, and after some discussion with air-traffic control, held on a course NE of the airport. They were subsequently cleared to climb to 6,700 m (22,000 feet) altitude and advised to proceed to an alternate airfield.
During the climb, at ~5,800 m (19,000 feet) altitude en-route to the alternate airport, the aircraft encountered volcanic particulate for 10 minutes. Within that interval the plane spent 2 minutes during ascent engulfed in denser and heavier particulate. During that period, window arcing was constant and the beam of their landing lights revealed a conspicuous cloud of reflecting particles. During ash ingestion the engines's speed lacked noticeable fluctuations. The aircraft exited the plume at about 6,100 m (20,000 feet) altitude and landed without encountering additional ash.
Upon landing, the pilots noticed reduced visibility through abraded windshields. Post-flight examination of the airplane revealed heavy damage, requiring the replacement of the engines (US $2 million each) and auxiliary-power-unit engine. (Note, however, that no deterioration in engine power or performance was noticed during the flight.) Other replaced parts included windshields, a heat exchanger, and coalescer bags. Minor damage was seen on the horizontal stabilizer and wing leading-edges.
Volcanic Ash Advisory Statements. The U.S. National Oceanic and Atmospheric Administration (NOAA), Satellite Services Division website contains two archived statements issued by the Volcanic Ash Advisory Center (VAAC) at Washington, D.C. for Fuego on 21-22 May 1999. The statements, issued to the aviation cummunity to warn of volcanic hazards, are intended for an audience accustomed to special terminology (figures 31 and 32). In the interest of advancing understanding of how volcanological and atmospheric data get transmitted to aviators, we offer brief explanations for many of the terms used (figure 31).
The Washington VAAC received first notification of the Fuego eruption from a routine surface weather observation from Guatemala City at 2000 local time (0200 UTC) on 22 May. They issued the first Volcanic Ash Advisory Statement a half-hour later (figure 31). Six hours later they issued the second Advisory Statement (figure 32). The Advisories were composed by staff of the Satellite Analysis Branch, one of the two NOAA components forming the Washington VAAC (Streett, 1999; Washington VAAC).
The section "Details of ash cloud" first says that the "surface observation from Guatemala City indicate that the Fuego volcano is in eruption" and that no additional information is available and then briefly describes in words observations that came from satellite imagery. The first sentence, "No eruption..." is self-explanatory, but highlights a limitation of the method in use that needs to be emphasized to aviators: an eruption may have occurred but its status is not revealed on the imagery. The sentence, "No eruption could be detected due to thunderstorm cloudiness covering the area around the volcano" is self-explanatory. Less clear is the term convective debris. It does not refer to ash; rather, it refers to remnants of thunderstorms. The gist of these latter two sentences is simply that the thunderstorms that covered the area made it challenging or impossible to see the ash on satellite imagery. Central American thunderstorm clouds typically can reach altitudes of more than 12,000 m (40,000 feet), and can mask or obscure airborne ash residing below that level.
Members of the Washington VAAC commented that this eruption demonstrates key problems that can arise when cloudy conditions prevent satellite detection of ash, foiling a primary mode of analysis. In such cases, they rely on ground observers (including observatories and weather observers), pilot reports, and reports from airlines. Thus, their ability to issue useful information in cloudy conditions depends on the quality of communications with local observers, the Meteorological Watch Office, volcanologists, geophysical observatories, and the aviation community.
The Advisory Statement listed México City weather balloon data acquired 1,050 km NW of Guatemala City. In retrospect, the Washington VAAC noted that they generally avoid using such distant sounding data. If a closer sounding cannot be found, they prefer to use upper-level wind forecasts taken from a numerical weather model. In any case, the scarcity of local sounding data presents a challenge to the realistic analysis of airborne ash.
The outlook section says to "see SIGMETS." SIGMETS are the true warnings to aircraft for SIGnificant METeorological events. They are issued by regional Meteorological Watch Offices (MWOs), in this case the MWO (for Guatemala) is in Tegucigalpa, Honduras. SIGMETS were lacking for this eruption; although the Washington VAAC tried to contact the MWO without response. Another complexity confronted at the VAAC is a lack of a single scale for communicating a volcano's hazard status.
Reporting of aviation ash encounters. In personal communications with Bulletin editors, airline personnel stated that many more encounters have occurred than have yet been tallied in publically accessible literature. In accord with those assertions, the 21 May 1999 encounters are absent from reports compiled by the International Civil Aviation Organization (ICAO, 2001). In that document (Appendix I, table 3A, p. I-12) Fuego fails to appear as a source vent for any aircraft-ash encounter. Pacaya is listed for two encounters, in January 1987 and in May 1998 (BGVN 23:05).
Even though the number of encounters was probably under-represented and thus reflects a minimum, ICAO (2001) notes that the international costs to aviation since 1982 summed to well in excess of $250 million. They noted, "In addition to its potential to cause a major aircraft accident, the economic cost of volcanic ash to international civil aviation is staggering. This involves numerous complete engine changes, engine overhauls, airframe refurbishing... aircraft downtime... [and] volcanic ash clearance from airports and the damage caused to equipment and buildings on the ground."
The incidents here suggest that there has been a strong bias toward under-reporting aircraft-ash encounters. If this tentative conclusion is correct, it implies consistent understatements of the hazard's magnitude. This, in turn, may have thwarted meaningful analysis of how and whether to proceed with designing more robust hazard-reduction systems. Accordingly, resources that could have been devoted to the problem have not yet been committed (see Gimmestad and others, 2001 for a discussion of a prototype on-board ash-detection instrument).
Communication challenges. While much of the aviation community needs to learn about volcanism rapidly, dependably, and with the aid of the Internet, some observers charged with reporting volcanic-ash hazards in Central and South America lack access to basic communication devices like reliable telephones and fax machines. To reduce the risks, the aviation, meteorological, remote sensing, and volcanological communities need to improve their ability to pass critical information to each other rapidly and precisely. The operational systems related to volcanic ash and aviation must transcend numerous boundaries (eg., languages, infrastructure, funding, governments, agencies, air carriers, pilots, aircraft manufactures, etc.). The systems need to portray complex, dynamic processes such as the rapid rise of an explosive plume, or large-scale ash-cloud movement.
Although the infrastructure for ash avoidance is greater than ever, members of the Washington VAAC have told Bulletin editors that they still depend heavily on people on the scene of the eruption to notify them promptly when eruptions occur. They said that thus far in parts of Central and South America a problem has been the expense of communication (eg., by phone, fax, and Internet). They also said that for the same regions the U.S. meteorological database regularly lacks pilot reports. Though serious, these problems have at least been identified and their solutions would appear to lack great technical or economic barriers.
The pilots involved in the May 1999 encounter recommended that far more emphasis be placed on forecasting and avoiding ash plumes. Other pilots cited the need for fast and accurate communications between those who observe eruptive activity and air traffic control personnel.
Issues like these continue to be an important subject at gatherings on the topic of ash hazards in aviation (Casadevall, 1994; Streett, D., 1999; Washington VAAC, 1999). The Airline Dispatcher's Federation (ADF) will participate in a 7-9 May 2002 conference and workshop: "Operational Implications of Airborne Volcanic Ash: Detection, Avoidance, and Mitigation." The gathering will provide the pilot and dispatcher with insights into volcanic ash, including its characteristics, affects on aircraft, detection/tracking, effective warning systems, and mitigation. A "hands-on" exercise will make this the first gathering of its kind to provide lab-style instruction on interpretation of satellite and wind data, and on models of ash trajectory and dispersion. Representatives from the Boeing company, and a host of US government agencies and non-governmental organizations will attend. The workshop will include lectures, demonstrations, laboratory exercises, and a simulated-eruption exercise involving volcanologists, forecasters, controllers, dispatchers, and pilots.
A second international symposium on ash and aviation safety is being planned by the U.S. Geological Survey, organized by Marianne Guffanti. It will be held in Washington, D.C. in September 2003.
References. Casadevall, T.J. (ed.), 1994, Proceedings of the First International Symposium on Volcanic Ash and Aviation Safety: U.S. Geological Survey Bulletin 2047, 450 p.
Gimmestad, G.G., Papanicolopoulos, C.D., Richards, M.A., Sherman, D.L., and West, L.L., 2001, Feasibility study of radiometry for airborne detection of aviation hazards, NASA/CR-2001-210855; Georgia Tech Research Institute, Atlanta, Georgia, 51 p. (URL: http://techreports.larc.nasa.gov/ltrs/PDF/2001/cr/).
Hefter, J.L., 1998, Verifying a volcanic ash forecasting model, Airline Pilot, v. 67, no. 5, pp. 20-23, 54.
International Civil Aviation Organization (ICAO), 2001, Manual on volcanic ash, radioactive material, and toxic chemical clouds, doc 9691-AN/954 (first edition): 999 University St., Montreal, Quebec, Canada H3C 5H7 (purchasing information: sales_unit@icao.int).
Rose, W.I., Bluth, J.S.G., Schneider, D.L., Ernst, G.G.J., Riley, C.M., Henderson, L.J., and McGimsey, R.G., 2001, Observations of volcanic clouds in the first few days of atmospheric residence: The 1992 eruptions of Crater Peak, Mount Spurr volcano, Alaska, Jour. of Geology, v. 109, p. 677-694.
Salinas, Leonard J., 2001, Volcanic ash clouds pose a real threat to aircraft safety: United Airlines, Chicago, Illinois (URL: http://www.dispatcher.org/library/VolcanicAsh.htm).
Simkin, T., and Siebert, L., 1994, Volcanoes of the World, 2nd edition: Geoscience Press in association with the Smithsonian Institution Global Volcanism Program, Tucson AZ, 368 p.
Streett, D., 1999, Satellite-based Volcanic Ash Advisories and an Ash Trajectory Model from the Washington VAAC: Eighth Conference on Aviation, Range, and Aerospace Meteorology, 10-15 January 1999, Dallas, Texas; American Meteorological Society, p. 290-294.
Washington VAAC, 1999, Operations of the Washington Volcanic Ash Advisory Center, in Aeronautical meteorological offices and their functions, and meteorological observation networks: Third Caribbean/South American Regional Air Navigation Meeting (Car/sam/ran/3); Buenos Aires, Argentina, 5 - 15 October, 1999; International Civil Aviation Organization (http://www.ssd.noaa.gov/ VAAC/PAPERS/carsam.html).
Geologic Background. Eruptions from Pacaya are frequently visible from Guatemala City, the nation's capital. This complex basaltic volcano was constructed just outside the southern topographic rim of the 14 x 16 km Pleistocene Amatitlán caldera. A cluster of dacitic lava domes occupies the southern caldera floor. The post-caldera Pacaya massif includes the older Pacaya Viejo and Cerro Grande stratovolcanoes and the currently active Mackenney stratovolcano. Collapse of Pacaya Viejo between 600 and 1,500 years ago produced a debris-avalanche deposit that extends 25 km onto the Pacific coastal plain and left an arcuate scarp inside which the modern Pacaya volcano (Mackenney cone) grew. The NW-flank Cerro Chino crater was last active in the 19th century. During the past several decades, activity has consisted of frequent Strombolian eruptions with intermittent lava flow extrusion that has partially filled in the caldera moat and covered the flanks of Mackenney cone, punctuated by occasional larger explosive eruptions that partially destroy the summit.
Information Contacts: Captain Edward Miller, Air Line Pilots Association (ALPA), Air Safety & Engineering Department, 535 Herndon Parkway, PO Box 1169, Herndon, VA 22070-1169, USA; Grace Swanson and Davida Streett, Washington VAAC, Satellite Analysis Branch (NOAA/NESDIS), 4700 Silver Hill Road, Stop 9910, Washington, DC 20233-9910, USA (URL: http://www.ssd.noaa.gov/); Bill Rose, Geological Engineering and Sciences, Michigan Technological University, Houghton, MI 49931, USA.
Rabaul (Papua New Guinea) — March 2002  Cite this Report
Rabaul
Papua New Guinea
4.2459°S, 152.1937°E; summit elev. 688 m
All times are local (unless otherwise noted)
M 5.6 earthquakes during March 2002 not related to volcanism
After explosions at Tavurvur during June and August 2001, activity decreased through October. During February-March 2002, the Rabaul Volcanological Observatory (RVO) reported that volcanic and seismic activity remained low, with some low-frequency earthquakes recorded. The active vent emitted weak-to-moderate amounts of white vapor. Ground deformation measurements showed no significant changes.
During mid-February, moderate-to-strong gas emissions drifted to the SE and E and damaged vegetation on the adjacent cone South Daughter, suggesting the presence of volcanic gases like sulphur dioxide within the emissions. The last ash-producing activity from Tavurvur occurred in early September 2001. RVO reported that the chance of mild ash activity occurring in the near future is very remote.
A few tectonic earthquakes were felt during mid-February. They were located 35-80 km NW and SW from the Rabaul-Kokopo area. An M 5.6 tectonic earthquake was felt at 0650 on 17 March. The earthquake was located offshore in the Pomio area. On 21 March, some high-frequency earthquakes occurred NE of Rabaul. Since 1995, these high-frequency earthquakes have been associated with eruptive activity at Tavurvur. During mid-March, some earthquakes were felt, unrelated to volcanic activity, that had magnitudes of 5.3-5.6.
Geologic Background. The low-lying Rabaul caldera on the tip of the Gazelle Peninsula at the NE end of New Britain forms a broad sheltered harbor utilized by what was the island's largest city prior to a major eruption in 1994. The outer flanks of the asymmetrical shield volcano are formed by thick pyroclastic-flow deposits. The 8 x 14 km caldera is widely breached on the east, where its floor is flooded by Blanche Bay and was formed about 1,400 years ago. An earlier caldera-forming eruption about 7,100 years ago is thought to have originated from Tavui caldera, offshore to the north. Three small stratovolcanoes lie outside the N and NE caldera rims. Post-caldera eruptions built basaltic-to-dacitic pyroclastic cones on the caldera floor near the NE and W caldera walls. Several of these, including Vulcan cone, which was formed during a large eruption in 1878, have produced major explosive activity during historical time. A powerful explosive eruption in 1994 occurred simultaneously from Vulcan and Tavurvur volcanoes and forced the temporary abandonment of Rabaul city.
Information Contacts: Ima Itikarai, Rabaul Volcano Observatory (RVO), P.O. Box 386, Rabaul, Papua New Guinea.
Sheveluch
Russia
56.653°N, 161.36°E; summit elev. 3283 m
All times are local (unless otherwise noted)
Growing dome, greater seismicity, and plumes to 10 km in early 2002
During late January to early April 2002, seismic activity at Shiveluch remained above background levels and the lava dome in the active crater continued to grow. Explosions, avalanches, pyroclastic flows, and plumes from combinations of steam, gas, and ash, all occurred without warning and rose as high as 7-10 km altitude. Many shallow earthquakes (ML less than or equal to 2.5) occurred within the volcano's edifice along with other shallow seismic events. The Alert Level was raised from Yellow to Orange during a period of increased activity, 12 February-mid-March. Then the Level was returned to Yellow.
Typical activities from the end of January through the first half of February 2002 included weak seismic events and short-lived explosions, which sent ash-gas plumes to heights of 0.8-1.0 km above the ~2.5 km-high dome (reaching 3.3-3.5 km altitude). Occasional explosions sent plumes to higher altitudes; on 25 January a plume rose to ~4.5 km altitude, while an explosive eruption on 1 February sent ash-gas plumes to heights over 5.0 km.
For the latter eruption, Advanced Very High Resolution Radiometer (AVHRR) satellite images show thermal anomalies up to 10 pixels. Many of these "hot" pixels were at the detector saturation level of 48°C, and appeared against typical background temperatures as low as -25°C. A satellite image on 2 February revealed a 40-pixel thermal anomaly; however, only 5-7 of the pixels had temperatures above 40°C, indicating that only those pixels were influenced by hot material on the ground. The other pixels with elevated temperatures were associated with a cloud caused by hot avalanches.
On the evening of 12 February, the character of the seismicity changed suggesting the occurrence of more intense gas-ash explosions. During the next 30 days, explosions occurred frequently, producing ash-and-gas plumes that rose over 1 km above the dome and occasionally over 3 km above it. On 22 February, a series of shallow seismic events registered for ~1 hour, possibly related to ash-gas explosions or a hot rock avalanche. A similar series was recorded on the night of 27 February, and the next morning observers from Klyuchi town (46 km S) reported a 2-km-long pyroclastic flow to the SE of the dome.
AVHRR images of the resulting plumes showed that some extended to distances of 100 km in various directions, depending upon local wind conditions. A satellite image on 21 February showed a circular ash cloud, 20 km in diameter, at an altitude of ~7.1 km. By 15 March seismic activity declined but remained above background levels. Short-lived explosions continued to send plumes as high as 7.5 km altitude during the last week of March.
Thermal anomalies and pixel size on AVHRR imagery. Dave Schneider (USGS, AVO) provided an explanation of relevant aspects of pixel size and thermal anomalies. The size of a "raw" AVHRR pixel varies across and along the scan of the sensor. The instrument scans from side to side as the satellite moves in orbit. Along the nadir (the line directly beneath the satellite sensor), the pixel size is ~1.1 km on a side. At the far extreme of the scan (55° from nadir) the pixel size increases to 2.4 x 6.5 km. The raw image looks very distorted due to this change in pixel size, so the raw data are resampled to a resolution of 1 x 1 km when processing the data for display. This resampling can generate artifacts, including duplicate "hot" pixels. Analysts usually recognize and account for this problem, and then accurately report the appropriate number of hot pixels.
Another complication is the cause and significance of hot pixels. An AVHRR pixel will begin to appear anomalously warm, compared to its neighbors, when very hot material (hundred's of degrees) occupy a very small percentage of the total pixel area (much less that 1%). So, when a report mentions four hot pixels, and the pixel is 1 km square, one might be tempted to interpret this as 4 km2 of hot material. However, this is not correct. Typically, only a very small portion of a pixel area is hot, but sufficiently hot to reach the pixel's saturation value of ~50°C. The numbers of hot pixels are not all that relevant in an absolute sense. In a relative sense, however, the number of hot pixels can be important, for example, during episodes where we have seen anomalies grow from 1-4 hot pixels and then reach 10-20 hot pixels after an eruption.
Geologic Background. The high, isolated massif of Sheveluch volcano (also spelled Shiveluch) rises above the lowlands NNE of the Kliuchevskaya volcano group. The 1,300 km3 andesitic volcano is one of Kamchatka's largest and most active volcanic structures, with at least 60 large eruptions during the Holocene. The summit of roughly 65,000-year-old Stary Shiveluch is truncated by a broad 9-km-wide late-Pleistocene caldera breached to the south. Many lava domes occur on its outer flanks. The Molodoy Shiveluch lava dome complex was constructed during the Holocene within the large open caldera; Holocene lava dome extrusion also took place on the flanks of Stary Shiveluch. Widespread tephra layers from these eruptions have provided valuable time markers for dating volcanic events in Kamchatka. Frequent collapses of dome complexes, most recently in 1964, have produced debris avalanches whose deposits cover much of the floor of the breached caldera.
Information Contacts: Olga Chubarova, Kamchatka Volcanic Eruptions Response Team (KVERT), Institute of Volcanic Geology and Geochemistry, Piip Ave. 9, Petropavlovsk-Kamchatsky, 683006, Russia; Tom Miller and Dave Schneider, Alaska Volcano Observatory (AVO), a cooperative program of a) U.S. Geological Survey, 4200 University Drive, Anchorage, AK 99508-4667, USA (URL: http://www.avo.alaska.edu/), b) Geophysical Institute, University of Alaska, PO Box 757320, Fairbanks, AK 99775-7320, USA, and c) Alaska Division of Geological & Geophysical Surveys, 794 University Ave., Suite 200, Fairbanks, AK 99709, USA.
Ulawun (Papua New Guinea) — March 2002  Cite this Report
Ulawun
Papua New Guinea
5.05°S, 151.33°E; summit elev. 2334 m
All times are local (unless otherwise noted)
Isolated tremor episodes and slow deflation through March 2002
An eruption occurred at Ulawun during 25-30 April 2001 (BGVN 26:06). Limited evacuations occurred on 3 May due to the occurrence of relatively high seismic activity and the possibility of further volcanic activity. On 14 June the Rabaul Volcanological Observatory (RVO) recommended that the Alert Level be reduced from 2 to 1. At this stage of alert, people could move back to their homes with the approval of the local disaster committee.
Volcanic tremor began at 2200 on 24 September. It peaked at about 1000 on 27 September and generally declined afterward. By 30 September seismic activity was at moderate levels. During 27-30 September a very slow deflationary trend was detected. Volcanic tremor continued to occur at moderate-to-high levels until it dropped dramatically on 11 October. After 11 October seismicity only consisted of discrete low-frequency earthquakes. On 8 and 9 October loud roaring noises emanated from the volcano.
During October through March 2002 activity was generally low. The main crater produced weak-to-moderate volumes of white and white-gray vapor. The N valley vent occasionally released weak volumes of thin white vapor. RSAM data revealed conspicuous seismicity on 26 October; incandescence was observed that night. A rapid trend of deflation beneath the summit area during the previous two weeks stopped on 24 December.
During mid-February tremor increased to moderate levels for the first time since December 2001. On 21 February weak roaring noises were heard and weak incandescence was visible for a short time. After 22 February tremor returned to background levels. Seismic activity returned to background levels after volcanic tremor ceased on 18 March. Discrete low-frequency earthquakes continued to occur in small numbers. The electronic tiltmeter continued to show long-term deflation of the summit area. Based on recent observations, activity at Ulawun is expected to remain low.
General References. Johnson, R.W., Davies, R.A., and White, A.J.R., 1972, Ulawun volcano, New Britain: Australia Bureau of Mineral Resources, Geology and Geophysics, Bulletin 142, 42 p.
McKee, C.O., 1983, Volcanic hazards at Ulawun volcano: Geological Survey of Papua New Guinea Report 83/13, 21 p.
Geologic Background. The symmetrical basaltic-to-andesitic Ulawun stratovolcano is the highest volcano of the Bismarck arc, and one of Papua New Guinea's most frequently active. The volcano, also known as the Father, rises above the N coast of the island of New Britain across a low saddle NE of Bamus volcano, the South Son. The upper 1,000 m is unvegetated. A prominent E-W escarpment on the south may be the result of large-scale slumping. Satellitic cones occupy the NW and E flanks. A steep-walled valley cuts the NW side, and a flank lava-flow complex lies to the south of this valley. Historical eruptions date back to the beginning of the 18th century. Twentieth-century eruptions were mildly explosive until 1967, but after 1970 several larger eruptions produced lava flows and basaltic pyroclastic flows, greatly modifying the summit crater.
Information Contacts: Ima Itikarai, Rabaul Volcano Observatory (RVO), P.O. Box 386, Rabaul, Papua New Guinea.

