Recently Published Bulletin Reports
Erebus (Antarctica) Lava lake remains active; most thermal alerts recorded since 2019
Rincon de la Vieja (Costa Rica) Frequent phreatic explosions during July-December 2023
Bezymianny (Russia) Explosion on 18 October 2023 sends ash plume 8 km high; lava flows and incandescent avalanches
Kilauea (United States) Low-level lava effusions in the lava lake at Halema’uma’u during July-December 2022
Nyamulagira (DR Congo) Lava flows and thermal activity during May-October 2023
Bagana (Papua New Guinea) Explosions, ash plumes, ashfall, and lava flows during April-September 2023
Mayon (Philippines) Lava flows, pyroclastic flows, ash emissions, and seismicity during April-September 2023
Nishinoshima (Japan) Eruption plumes and gas-and-steam plumes during May-August 2023
Krakatau (Indonesia) White gas-and-steam plumes and occasional ash plumes during May-August 2023
Villarrica (Chile) Strombolian activity, gas-and-ash emissions, and crater incandescence during April-September 2023
Merapi (Indonesia) Frequent incandescent avalanches during April-September 2023
Ebeko (Russia) Moderate explosive activity with ash plumes continued during June-November 2023
Erebus (Antarctica) — January 2024  Cite this Report
Erebus
Antarctica
77.53°S, 167.17°E; summit elev. 3794 m
All times are local (unless otherwise noted)
Lava lake remains active; most thermal alerts recorded since 2019
The lava lake in the summit crater of Erebus has been active since at least 1972. Located in Antarctica overlooking the McMurdo Station on Ross Island, it is the southernmost active volcano on the planet. Because of the remote location, activity is primarily monitored by satellites. This report covers activity during 2023.
The number of thermal alerts recorded by the Hawai'i Institute of Geophysics and Planetology’s MODVOLC Thermal Alerts System increased considerably in 2023 compared to the years 2020-2022 (table 9). In contrast to previous years, the MODIS instruments aboard the Aqua and Terra satellites captured data from Erebus every month during 2023. Consistent with previous years, the lowest number of anomalous pixels were recorded in January, November, and December.
Table 9. Number of monthly MODIS-MODVOLC thermal alert pixels recorded at Erebus during 2017-2023. See BGVN 42:06 for data from 2000 through 2016. The table was compiled using data provided by the HIGP – MODVOLC Thermal Alerts System.
| Year |
Jan |
Feb |
Mar |
Apr |
May |
Jun |
Jul |
Aug |
Sep |
Oct |
Nov |
Dec |
SUM |
| 2017 |
0 |
21 |
9 |
0 |
0 |
1 |
11 |
61 |
76 |
52 |
0 |
3 |
234 |
| 2018 |
0 |
21 |
58 |
182 |
55 |
17 |
137 |
172 |
103 |
29 |
0 |
0 |
774 |
| 2019 |
2 |
21 |
162 |
151 |
55 |
56 |
75 |
53 |
29 |
19 |
1 |
0 |
624 |
| 2020 |
0 |
2 |
16 |
18 |
4 |
4 |
1 |
3 |
18 |
3 |
1 |
6 |
76 |
| 2021 |
0 |
9 |
1 |
0 |
2 |
56 |
46 |
47 |
35 |
52 |
5 |
3 |
256 |
| 2022 |
1 |
13 |
55 |
22 |
15 |
32 |
39 |
19 |
31 |
11 |
0 |
0 |
238 |
| 2023 |
2 |
33 |
49 |
82 |
41 |
32 |
70 |
64 |
42 |
17 |
5 |
11 |
448 |
Sentinel-2 infrared images showed one or two prominent heat sources within the summit crater, accompanied by adjacent smaller sources, similar to recent years (see BGVN 46:01, 47:02, and 48:01). A unique image was obtained on 25 November 2023 by the OLI-2 (Operational Land Imager-2) on Landsat 9, showing the upper part of the volcano surrounded by clouds (figure 32).
Geologic Background. Mount Erebus, the world's southernmost historically active volcano, overlooks the McMurdo research station on Ross Island. It is the largest of three major volcanoes forming the crudely triangular Ross Island. The summit of the dominantly phonolitic volcano has been modified by one or two generations of caldera formation. A summit plateau at about 3,200 m elevation marks the rim of the youngest caldera, which formed during the late-Pleistocene and within which the modern cone was constructed. An elliptical 500 x 600 m wide, 110-m-deep crater truncates the summit and contains an active lava lake within a 250-m-wide, 100-m-deep inner crater; other lava lakes are sometimes present. The glacier-covered volcano was erupting when first sighted by Captain James Ross in 1841. Continuous lava-lake activity with minor explosions, punctuated by occasional larger Strombolian explosions that eject bombs onto the crater rim, has been documented since 1972, but has probably been occurring for much of the volcano's recent history.
Information Contacts: Hawai'i Institute of Geophysics and Planetology (HIGP) - MODVOLC Thermal Alerts System, School of Ocean and Earth Science and Technology (SOEST), Univ. of Hawai'i, 2525 Correa Road, Honolulu, HI 96822, USA (URL: http://modis.higp.hawaii.edu/); Copernicus Browser, Copernicus Data Space Ecosystem, European Space Agency (URL: https://dataspace.copernicus.eu/browser/); NASA Earth Observatory, EOS Project Science Office, NASA Goddard Space Flight Center, Goddard, Maryland, USA (URL: https://earthobservatory.nasa.gov/images/152134/erebus-breaks-through).
Rincon de la Vieja (Costa Rica) — January 2024 Cite this Report
Rincon de la Vieja
Costa Rica
10.83°N, 85.324°W; summit elev. 1916 m
All times are local (unless otherwise noted)
Frequent phreatic explosions during July-December 2023
Rincón de la Vieja is a volcanic complex in Costa Rica with a hot convecting acid lake that exhibits frequent weak phreatic explosions, gas-and-steam emissions, and occasional elevated sulfur dioxide levels (BGVN 45:10, 46:03, 46:11). The current eruption period began June 2021. This report covers activity during July-December 2023 and is based on weekly bulletins and occasional daily reports from the Observatorio Vulcanologico Sismologica de Costa Rica-Universidad Nacional (OVSICORI-UNA).
Numerous weak phreatic explosions continued during July-December 2023, along with gas-and-steam emissions and plumes that rose as high as 3 km above the crater rim. Many weekly OVSICORI-UNA bulletins included the previous week's number of explosions and emissions (table 9). For many explosions, the time of explosion was given (table 10). Frequent seismic activity (long-period earthquakes, volcano-tectonic earthquakes, and tremor) accompanied the phreatic activity.
Table 9. Number of reported weekly phreatic explosions and gas-and-steam emissions at Rincón de la Vieja, July-December 2023. Counts are reported for the week before the Weekly Bulletin date; not all reports included these data. Courtesy of OVSICORI-UNA.
| OVSICORI Weekly Bulletin |
Number of explosions |
Number of emissions |
| 28 Jul 2023 |
6 |
14 |
| 4 Aug 2023 |
10 |
12 |
| 1 Sep 2023 |
13 |
11 |
| 22 Sep 2023 |
12 |
13 |
| 29 Sep 2023 |
6 |
11 |
| 6 Oct 2023 |
12 |
5 |
| 13 Oct 2023 |
7 |
9 |
| 20 Oct 2023 |
1 |
15 |
| 27 Oct 2023 |
3 |
23 |
| 3 Nov 2023 |
3 |
10 |
| 17 Nov 2023 |
0 |
Some |
| 24 Nov 2023 |
0 |
14 |
| 8 Dec 2023 |
4 |
16 |
| 22 Dec 2023 |
8 |
18 |
Table 10. Summary of activity at Rincón de la Vieja during July-December 2023. Weak phreatic explosions and gas emissions are noted where the time of explosion was indicated in the weekly or daily bulletins. Height of plumes or emissions are distance above the crater rim. Courtesy of OVSICORI-UNA.
| Date |
Time |
Description of Activity |
| 1 Jul 2023 |
0156 |
Explosion. |
| 2 Jul 2023 |
0305 |
Explosion. |
| 4 Jul 2023 |
0229, 0635 |
Event at 0635 produced a gas-and-steam plume that rose 700 m and drifted W; seen by residents in Liberia (21 km SW). |
| 9 Jul 2023 |
1843 |
Explosion. |
| 21 Jul 2023 |
0705 |
Explosion. |
| 26 Jul 2023 |
1807 |
Explosion. |
| 28 Jul 2023 |
0802 |
Explosion generated a gas-and-steam plume that rose 500 m. |
| 30 Jul 2023 |
1250 |
Explosion. |
| 31 Jul 2023 |
2136 |
Explosion. |
| 11 Aug 2023 |
0828 |
Explosion. |
| 18 Aug 2023 |
1304 |
Explosion. |
| 21 Aug 2023 |
1224 |
Explosion generated gas-and-steam plumes rose 500-600 m. |
| 22 Aug 2023 |
0749 |
Explosion generated gas-and-steam plumes rose 500-600 m. |
| 24 Aug 2023 |
1900 |
Explosion. |
| 25 Aug 2023 |
0828 |
Event produced a steam-and-gas plume that rose 3 km and drifted NW. |
| 27-28 Aug 2023 |
0813 |
Four small events; the event at 0813 on 28 August lasted two minutes and generated a steam-and-gas plume that rose 2.5 km. |
| 1 Sep 2023 |
1526 |
Explosion generated plume that rose 2 km and ejected material onto the flanks. |
| 2-3 Sep 2023 |
- |
Small explosions detected in infrasound data. |
| 4 Sep 2023 |
1251 |
Gas-and-steam plume rose 1 km and drifted W. |
| 7 Nov 2023 |
1113 |
Explosion. |
| 8 Nov 2023 |
0722 |
Explosion. |
| 12 Nov 2023 |
0136 |
Small gas emissions. |
| 14 Nov 2023 |
0415 |
Small gas emissions. |
According to OVSICORI-UNA, during July-October the average weekly sulfur dioxide (SO2) flux ranged from 68 to 240 tonnes/day. However, in mid-November the flux increased to as high as 334 tonnes/day, the highest value measured in recent years. The high SO2 flux in mid-November was also detected by the TROPOMI instrument on the Sentinel-5P satellite (figure 43).
Geologic Background. Rincón de la Vieja, the largest volcano in NW Costa Rica, is a remote volcanic complex in the Guanacaste Range. The volcano consists of an elongated, arcuate NW-SE-trending ridge constructed within the 15-km-wide early Pleistocene Guachipelín caldera, whose rim is exposed on the south side. Sometimes known as the "Colossus of Guanacaste," it has an estimated volume of 130 km3 and contains at least nine major eruptive centers. Activity has migrated to the SE, where the youngest-looking craters are located. The twin cone of Santa María volcano, the highest peak of the complex, is located at the eastern end of a smaller, 5-km-wide caldera and has a 500-m-wide crater. A Plinian eruption producing the 0.25 km3 Río Blanca tephra about 3,500 years ago was the last major magmatic eruption. All subsequent eruptions, including numerous historical eruptions possibly dating back to the 16th century, have been from the prominent active crater containing a 500-m-wide acid lake located ENE of Von Seebach crater.
Information Contacts: Observatorio Vulcanológico Sismológica de Costa Rica-Universidad Nacional (OVSICORI-UNA), Apartado 86-3000, Heredia, Costa Rica (URL: http://www.ovsicori.una.ac.cr/); NASA Global Sulfur Dioxide Monitoring Page, Atmospheric Chemistry and Dynamics Laboratory, NASA Goddard Space Flight Center (NASA/GSFC), 8800 Greenbelt Road, Goddard MD 20771, USA (URL: https://so2.gsfc.nasa.gov/).
Bezymianny (Russia) — November 2023 Cite this Report
Bezymianny
Russia
55.972°N, 160.595°E; summit elev. 2882 m
All times are local (unless otherwise noted)
Explosion on 18 October 2023 sends ash plume 8 km high; lava flows and incandescent avalanches
Bezymianny, located on Russia’s Kamchatka Peninsula, has had eruptions since 1955 characterized by dome growth, explosions, pyroclastic flows, ash plumes, and ashfall. Activity during November 2022-April 2023 included gas-and-steam emissions, lava dome collapses generating avalanches, and persistent thermal activity. Similar eruptive activity continued from May through October 2023, described here based on information from weekly and daily reports of the Kamchatka Volcano Eruptions Response Team (KVERT), notices from Tokyo VAAC (Volcanic Ash Advisory Center), and from satellite data.
Overall activity decreased after the strong period of activity in late March through April 2023, which included ash explosions during 29 March and 7-8 April 2023 that sent plumes as high as 10-12 km altitude, along with dome growth and lava flows (BGVN 48:05). This reduced activity can be seen in the MIROVA thermal detection system graph (figure 56), which was consistent with data from the MODVOLC thermal detection system and with Sentinel-2 satellite images that showed persistent hotspots in the summit crater when conditions allowed observations. A renewed period of strong activity began in mid-October 2023.
Activity increased significantly on 17 October 2023 when large collapses began during 0700-0830 on the E flanks of the lava dome and continued to after 0930 the next day (figure 57). Ash plumes rose to an altitude of 4.5-5 km, extending 220 km NNE by 18 October. A large explosion at 1630 on 18 October produced an ash plume that rose to an altitude of 11 km (8 km above the summit) and drifted NNE and then NW, extending 900 km NW within two days at an altitude of 8 km. Minor ashfall was noted in Kozyrevsk (45 km WNW). At 0820 on 20 October an ash plume was identified in satellite images drifting 100 km ENE at altitudes of 4-4.5 km.
Lava flows and hot avalanches from the dome down the SE flank continued over the next few days, including 23 October when clear conditions allowed good observations (figures 58 and 59). A large thermal anomaly was observed over the volcano through 24 October, and in the summit crater on 30 October (figure 60). Strong fumarolic activity continued, with numerous avalanches and occasional incandescence. By the last week of October, volcanic activity had decreased to a level consistent with that earlier in the reporting period.
Aviation warnings were frequently updated during 17-20 October. KVERT issued a Volcano Observatory Notice for Aviation (VONA) on 17 October at 1419 and 1727 (0219 and 0527 UTC) raising the Aviation Color Code (ACC) from Yellow to Orange (second highest level). The next day, KVERT issued a VONA at 1705 (0505 UTC) raising the ACC to Red (highest level) but lowered it back to Orange at 2117 (0917 UTC). After another decrease to Yellow and back to Orange, the ACC was reduced to Yellow on 20 October at 1204 (0004 UTC). In addition, the Tokyo VAAC issued a series of Volcanic Ash Advisories beginning on 16 October and continuing through 30 October.
Geologic Background. The modern Bezymianny, much smaller than its massive neighbors Kamen and Kliuchevskoi on the Kamchatka Peninsula, was formed about 4,700 years ago over a late-Pleistocene lava-dome complex and an edifice built about 11,000-7,000 years ago. Three periods of intensified activity have occurred during the past 3,000 years. The latest period, which was preceded by a 1,000-year quiescence, began with the dramatic 1955-56 eruption. This eruption, similar to that of St. Helens in 1980, produced a large open crater that was formed by collapse of the summit and an associated lateral blast. Subsequent episodic but ongoing lava-dome growth, accompanied by intermittent explosive activity and pyroclastic flows, has largely filled the 1956 crater.
Information Contacts: Kamchatka Volcanic Eruptions Response Team (KVERT), Far Eastern Branch, Russian Academy of Sciences, 9 Piip Blvd., Petropavlovsk-Kamchatsky, 683006, Russia (URL: http://www.kscnet.ru/ivs/kvert/); Kamchatka Volcanological Station, Kamchatka Branch of Geophysical Survey, (KB GS RAS), Klyuchi, Kamchatka Krai, Russia (URL: http://volkstat.ru/); Tokyo Volcanic Ash Advisory Center (VAAC), 1-3-4 Otemachi, Chiyoda-ku, Tokyo 100-8122, Japan (URL: http://ds.data.jma.go.jp/svd/vaac/data/); Hawai'i Institute of Geophysics and Planetology (HIGP) - MODVOLC Thermal Alerts System, School of Ocean and Earth Science and Technology (SOEST), Univ. of Hawai'i, 2525 Correa Road, Honolulu, HI 96822, USA (URL: http://modis.higp.hawaii.edu/); MIROVA (Middle InfraRed Observation of Volcanic Activity), a collaborative project between the Universities of Turin and Florence (Italy) supported by the Centre for Volcanic Risk of the Italian Civil Protection Department (URL: http://www.mirovaweb.it/); Copernicus Browser, Copernicus Data Space Ecosystem, European Space Agency (URL: https://dataspace.copernicus.eu/browser/).chr
Kilauea (United States) — January 2023 Cite this Report
Kilauea
United States
19.421°N, 155.287°W; summit elev. 1222 m
All times are local (unless otherwise noted)
Low-level lava effusions in the lava lake at Halema’uma’u during July-December 2022
Kīlauea is the southeastern-most volcano in Hawaii and overlaps the E flank of the Mauna Loa volcano. Its East Rift Zone (ERZ) has been intermittently active for at least 2,000 years. An extended eruption period began in January 1983 and was characterized by open lava lakes and lava flows from the summit caldera and the East Rift Zone. During May 2018 magma migrated into the Lower East Rift Zone (LERZ) and opened 24 fissures along a 6-km-long NE-trending fracture zone that produced lava flows traveling in multiple directions. As lava emerged from the fissures, the lava lake at Halema'uma'u drained and explosions sent ash plumes to several kilometers altitude (BGVN 43:10).
The current eruption period started during September 2021 and has recently been characterized by lava effusions, spatter, and sulfur dioxide emissions in the active Halema’uma’u lava lake (BGVN 47:08). Lava effusions, some spatter, and sulfur dioxide emissions have continued during this reporting period of July through December 2022 using daily reports, volcanic activity notices, and abundant photo, map, and video data from the US Geological Survey's (USGS) Hawaiian Volcano Observatory (HVO).
Summary of activity during July-December 2022. Low-level effusions have continued at the western vent of the Halema’uma’u crater during July through early December 2022. Occasional weak ooze-outs (also called lava break outs) would occur along the margins of the crater floor. The overall level of the active lava lake throughout the reporting period gradually increased due to infilling, however it stagnated in mid-September (table 13). During September through November, activity began to decline, though lava effusions persisted at the western vent. By 9 December, the active part of the lava lake had completely crusted over, and incandescence was no longer visible.
Table 13. Summary of measurements taken during overflights at Kīlauea that show a gradual increase in the active lava lake level and the volume of lava effused since 29 September 2021. Lower activity was reported during September-October. Data collected during July-December 2022. Courtesy of HVO.
| Date: |
Level of the active lava lake (m): |
Cumulative volume of lava effused (million cubic meters): |
| 7 Jul 2022 |
130 |
95 |
| 19 Jul 2022 |
133 |
98 |
| 4 Aug 2022 |
136 |
102 |
| 16 Aug 2022 |
137 |
104 |
| 12 Sep 2022 |
143 |
111 |
| 5 Oct 2022 |
143 |
111 |
| 28 Oct 2022 |
143 |
111 |
Activity during July 2022. Lava effusions were reported from the western vent in the Halema’uma’u crater, along with occasional weak ooze-outs along the margins of the crater floor. The height of the lava lake was variable due to deflation-inflation tilt events; for example, the lake level dropped approximately 3-4 m during a summit deflation-inflation event reported on 1 July. Webcam images taken during the night of 6-12 July showed intermittent low-level spattering at the western vent that rose less than 10 m above the vent (figure 519). Measurements made during an overflight on 7 July indicated that the crater floor was infilled about 130 m and that 95 million cubic meters of lava had been effused since 29 September 2021. A single, relatively small lava ooze-out was active to the S of the lava lake. Around midnight on 8 July there were two brief periods of lava overflow onto the lake margins. On 9 July lava ooze-outs were reported near the SE and NE edges of the crater floor and during 10-11 July they occurred near the E, NE, and NW edges. On 16 July crater incandescence was reported, though the ooze-outs and spattering were not visible. On 18 July overnight webcam images showed incandescence in the western vent complex and two ooze-outs were reported around 0000 and 0200 on 19 July. By 0900 there were active ooze-outs along the SW edge of the crater floor. Measurements made from an overflight on 19 July indicated that the crater floor was infilled about 133 m and 98 million cubic meters of lava had erupted since 29 September 2021 (figure 520). On 20 July around 1600 active ooze-outs were visible along the N edge of the crater, which continued through the next day. Extensive ooze-outs occurred along the W margin during 24 July until 1900; on 26 July minor ooze-outs were noted along the N margin. Minor spattering was visible on 29 July along the E margin of the lake. The sulfur dioxide emission rates ranged 650-2,800 tons per day (t/d), the higher of which was measured on 8 July (figure 519).
Activity during August 2022. The eruption continued in the Halema’uma’u crater at the western vent. According to HVO the lava in the active lake remained at the level of the bounding levees. Occasional minor ooze-outs were observed along the margins of the crater floor. Strong nighttime crater incandescence was visible after midnight on 6 August over the western vent cone. During 6-7 August scattered small lava lobes were active along the crater floor and incandescence persisted above the western vent through 9 August. During 7-9 August HVO reported a single lava effusion source was active along the NW margin of the crater floor. Measurements from an overflight on 4 August indicated that the crater floor was infilled about 136 m total and that 102 million cubic meters of lava had been erupted since the start of the eruption. Lava breakouts were reported along the N, NE, E, S, and W margins of the crater during 10-16 August. Another overflight survey conducted on 16 August indicated that the crater floor infilled about 137 m and 104 million cubic meters of lava had been erupted since September 2021. Measured sulfur dioxide emissions rates ranged 1,150-2,450 t/d, the higher of which occurred on 8 August.
Activity during September 2022. During September, lava effusion continued from the western vent into the active lava lake and onto the crater floor. Intermittent minor ooze-outs were reported through the month. A small ooze-out was visible on the W crater floor margin at 0220 on 2 September, which showed decreasing surface activity throughout the day, but remained active through 3 September. On 3 September around 1900 a lava outbreak occurred along the NW margin of the crater floor but had stopped by the evening of 4 September. Field crews monitoring the summit lava lake on 9 September observed spattering on the NE margin of the lake that rose no higher than 10 m, before falling back onto the lava lake crust (figure 521). Overflight measurements on 12 September indicated that the crater floor was infilled a total of 143 m and 111 million cubic meters of lava had been erupted since September 2021. Extensive breakouts in the W and N part of the crater floor were reported at 1600 on 20 September and continued into 26 September. The active part of the lava lake dropped by 10 m while other parts of the crater floor dropped by several meters. Summit tiltmeters recorded a summit seismic swarm of more than 80 earthquakes during 1500-1800 on 21 September, which occurred about 1.5 km below Halema’uma’u; a majority of these were less than Mw 2. By 22 September the active part of the lava lake was infilled about 2 m. On 23 September the western vent areas exhibited several small spatter cones with incandescent openings, along with weak, sporadic spattering (figure 522). The sulfur dioxide emission rate ranged from 930 t/d to 2,000 t/d, the higher of which was measured on 6 September.
Activity during October 2022. Activity during October declined slightly compared to previous months, though lava effusions persisted from the western vent into the active lava lake and onto the crater floor during October (figure 523). Slight variations in the lava lake were noted throughout the month. HVO reported that around 0600 on 3 October the level of the lava lake has lowered slightly. Overflight measurements taken on 5 October indicated that the crater floor was infilled a total of about 143 m and that 111 million cubic meters of lava had been effused since September 2021. During 6-7 October the lake gradually rose 0.5 m. Sulfur dioxide measurements made on 22 October had an emission rate of 700 t/d. Another overflight taken on 28 October showed that there was little to no change in the elevation of the crater floor: the crater floor was infilled a total of 143 m and 111 million cubic meters of lava had erupted since the start of the eruption.
Activity during November 2022. Activity remained low during November, though HVO reported that lava from the western vent continued to effuse into the active lava lake and onto the crater floor throughout the month. The rate of sulfur dioxide emissions during November ranged from 300-600 t/d, the higher amount of which occurred on 9 November.
Activity during December 2022. Similar low activity was reported during December, with lava effusing from the western vent into the active lava lake and onto the crater floor. During 4-5 December the active part of the lava lake was slightly variable in elevation and fluctuated within 1 m. On 9 December HVO reported that lava was no longer erupting from the western vent in the Halema’uma’u crater and that sulfur dioxide emissions had returned to near pre-eruption background levels; during 10-11 December, the lava lake had completely crusted over, and no incandescence was visible (figure 524). Time lapse camera images covering the 4-10 December showed that the crater floor showed weak deflation and no inflation. Some passive events of crustal overturning were reported during 14-15 December, which brought fresh incandescent lava to the lake surface. The sulfur dioxide emission rate was approximately 200 t/d on 14 December. A smaller overturn event on 17 December and another that occurred around 0000 and into the morning of 20 December were also detected. A small seismic swarm was later detected on 30 December.
Geologic Background. Kilauea overlaps the E flank of the massive Mauna Loa shield volcano in the island of Hawaii. Eruptions are prominent in Polynesian legends; written documentation since 1820 records frequent summit and flank lava flow eruptions interspersed with periods of long-term lava lake activity at Halemaumau crater in the summit caldera until 1924. The 3 x 5 km caldera was formed in several stages about 1,500 years ago and during the 18th century; eruptions have also originated from the lengthy East and Southwest rift zones, which extend to the ocean in both directions. About 90% of the surface of the basaltic shield volcano is formed of lava flows less than about 1,100 years old; 70% of the surface is younger than 600 years. The long-term eruption from the East rift zone between 1983 and 2018 produced lava flows covering more than 100 km2, destroyed hundreds of houses, and added new coastline.
Information Contacts: Hawaiian Volcano Observatory (HVO), U.S. Geological Survey, PO Box 51, Hawai'i National Park, HI 96718, USA (URL: http://hvo.wr.usgs.gov/).
Nyamulagira (DR Congo) — November 2023 Cite this Report
Nyamulagira
DR Congo
1.408°S, 29.2°E; summit elev. 3058 m
All times are local (unless otherwise noted)
Lava flows and thermal activity during May-October 2023
Nyamulagira (also known as Nyamuragira) is a shield volcano in the Democratic Republic of Congo with the summit truncated by a small 2 x 2.3 km caldera with walls up to about 100 m high. Documented eruptions have occurred within the summit caldera, as well as from numerous flank fissures and cinder cones. The current eruption period began in April 2018 and has more recently been characterized by summit crater lava flows and thermal activity (BGVN 48:05). This report describes lava flows and variable thermal activity during May through October 2023, based on information from the Observatoire Volcanologique de Goma (OVG) and various satellite data.
Lava lake activity continued during May. The MIROVA (Middle InfraRed Observation of Volcanic Activity) system recorded moderate-to-strong thermal activity throughout the reporting period; activity was more intense during May and October and relatively weaker from June through September (figure 95). The MODVOLC thermal algorithm, detected a total of 209 thermal alerts. There were 143 hotspots detected during May, eight during June, nine during September, and 49 during October. This activity was also reflected in infrared satellite images, where a lava flow was visible in the NW part of the crater on 7 May and strong activity was seen in the center of the crater on 4 October (figure 96). Another infrared satellite image taken on 12 May showed still active lava flows along the NW margin of the crater. According to OVG lava effusions were active during 7-29 May and moved to the N and NW parts of the crater beginning on 9 May. Strong summit crater incandescence was visible from Goma (27 km S) during the nights of 17, 19, and 20 May (figure 97). On 17 May there was an increase in eruptive activity, which peaked at 0100 on 20 May. Notable sulfur dioxide plumes drifted NW and W during 19-20 May (figure 98). Drone footage acquired in partnership with the USGS (United States Geological Survey) on 20 May captured images of narrow lava flows that traveled about 100 m down the W flank (figure 99). Data from the Rumangabo seismic station indicated a decreasing trend in activity during 17-21 May. Although weather clouds prevented clear views of the summit, a strong thermal signature on the NW flank was visible in an infrared satellite image on 22 May, based on an infrared satellite image. On 28 May the lava flows on the upper W flank began to cool and solidify. By 29 May seismicity returned to levels similar to those recorded before the 17 May increase. Lava effusion continued but was confined to the summit crater; periodic crater incandescence was observed.
Low-level activity was noted during June through October. On 1 June OVG reported that seismicity remained at lower levels and that crater incandescence had been absent for three days, though infrared satellite imagery showed continued lava effusion in the summit crater. The lava flows on the flanks covered an estimated 0.6 km2. Satellite imagery continued to show thermal activity confined to the lava lake through October (figure 96), although no lava flows or significant sulfur dioxide emissions were reported.
Geologic Background. Africa's most active volcano, Nyamulagira (also known as Nyamuragira), is a massive high-potassium basaltic shield about 25 km N of Lake Kivu and 13 km NNW of the steep-sided Nyiragongo volcano. The summit is truncated by a small 2 x 2.3 km caldera that has walls up to about 100 m high. Documented eruptions have occurred within the summit caldera, as well as from the numerous flank fissures and cinder cones. A lava lake in the summit crater, active since at least 1921, drained in 1938, at the time of a major flank eruption. Recent lava flows extend down the flanks more than 30 km from the summit as far as Lake Kivu; extensive lava flows from this volcano have covered 1,500 km2 of the western branch of the East African Rift.
Information Contacts: Observatoire Volcanologique de Goma (OVG), Departement de Geophysique, Centre de Recherche en Sciences Naturelles, Lwiro, D.S. Bukavu, DR Congo; Hawai'i Institute of Geophysics and Planetology (HIGP) - MODVOLC Thermal Alerts System, School of Ocean and Earth Science and Technology (SOEST), Univ. of Hawai'i, 2525 Correa Road, Honolulu, HI 96822, USA (URL: http://modis.higp.hawaii.edu/); MIROVA (Middle InfraRed Observation of Volcanic Activity), a collaborative project between the Universities of Turin and Florence (Italy) supported by the Centre for Volcanic Risk of the Italian Civil Protection Department (URL: http://www.mirovaweb.it/); NASA Global Sulfur Dioxide Monitoring Page, Atmospheric Chemistry and Dynamics Laboratory, NASA Goddard Space Flight Center (NASA/GSFC), 8800 Greenbelt Road, Goddard, Maryland, USA (URL: https://so2.gsfc.nasa.gov/); Copernicus Browser, Copernicus Data Space Ecosystem, European Space Agency (URL: https://dataspace.copernicus.eu/browser/); Charles Balagizi, Goma Volcano Observatory, Departement de Geophysique, Centre de Recherche en Sciences Naturelles, Lwiro, D.S. Bukavu, DR Congo.
Bagana (Papua New Guinea) — October 2023 Cite this Report
Bagana
Papua New Guinea
6.137°S, 155.196°E; summit elev. 1855 m
All times are local (unless otherwise noted)
Explosions, ash plumes, ashfall, and lava flows during April-September 2023
The remote volcano of Bagana is located in central Bougainville Island, Papua New Guinea. Recorded eruptions date back to 1842 and activity has consisted of effusive activity that has built a small lava dome in the summit crater and occasional explosions that produced pyroclastic flows. The most recent eruption has been ongoing since February 2000 and has produced occasional explosions, ash plumes, and lava flows. More recently, activity has been characterized by ongoing effusive activity and ash emissions (BGVN 48:04). This report updates activity from April through September 2023 that has consisted of explosions, ash plumes, ashfall, and lava flows, using information from the Darwin Volcanic Ash Advisory Center (VAAC) and satellite data.
An explosive eruption was reported on 7 July that generated a large gas-and-ash plume to high altitudes and caused significant ashfall in local communities; the eruption plume had reached upper tropospheric (16-18 km altitude) altitudes by 2200, according to satellite images. Sulfur dioxide plumes were detected in satellite images on 8 July and indicated that the plume was likely a mixture of gas, ice, and ash. A report issued by the Autonomous Bougainville Government (ABG) (Torokina District, Education Section) on 10 July noted that significant ash began falling during 2000-2100 on 7 July and covered most areas in the Vuakovi, Gotana (9 km SW), Koromaketo, Laruma (25 km W) and Atsilima (27 km NW) villages. Pyroclastic flows also occurred, according to ground-based reports; small deposits confined to one drainage were inspected by RVO during an overflight on 17 July and were confirmed to be from the 7 July event. Ashfall continued until 10 July and covered vegetation, which destroyed bushes and gardens and contaminated rivers and streams.
RVO reported another eruption on 14 July. The Darwin VAAC stated that an explosive event started around 0830 on 15 July and produced an ash plume that rose to 16.5 km altitude by 1000 and drifted N, according to satellite images. The plume continued to drift N and remained visible through 1900, and by 2150 it had dissipated.
Ashfall likely from both the 7 and 15 July events impacted about 8,111 people in Torokina (20 km SW), including Tsito/Vuakovi, Gotana, Koromaketo, Kenaia, Longkogari, Kenbaki, Piva (13 km SW), and Atsinima, and in the Tsitovi district, according to ABG. Significant ashfall was also reported in Ruruvu (22 km N) in the Wakunai District of Central Bougainville, though the thickness of these deposits could not be confirmed. An evacuation was called for the villages in Wakunai, where heavy ashfall had contaminated water sources; the communities of Ruruvu, Togarau, Kakarapaia, Karauturi, Atao, and Kuritaturi were asked to evacuate to a disaster center at the Wakunai District Station, and communities in Torokina were asked to evacuate to the Piva District station. According to a news article, more than 7,000 people needed temporary accommodations, with about 1,000 people in evacuation shelters. Ashfall had deposited over a broad area, contaminating water supplies, affecting crops, and collapsing some roofs and houses in rural areas. Schools were temporarily shut down. Intermittent ash emissions continued through the end of July and drifted NNW, NW, and SW. Fine ashfall was reported on the coast of Torokina, and ash plumes also drifted toward Laruma and Atsilima.
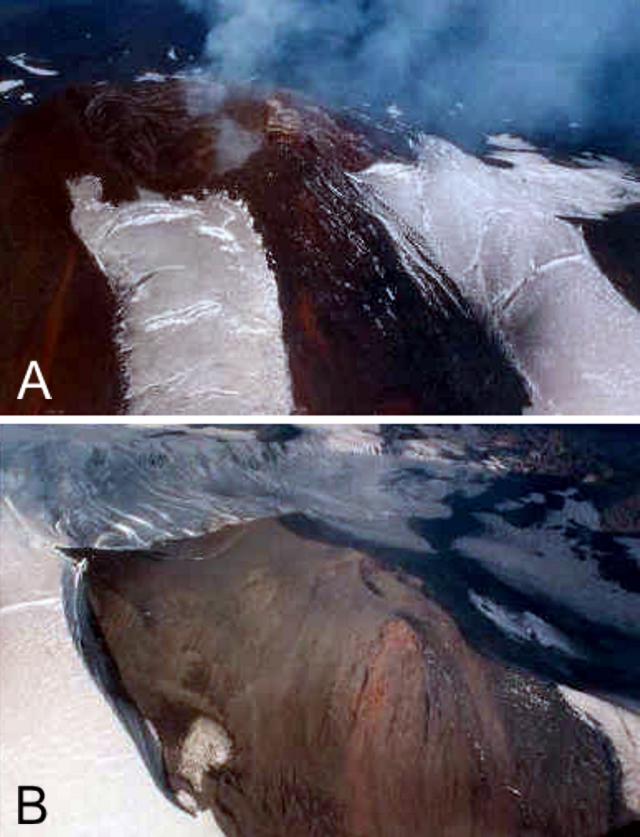
A small explosive eruption occurred at 2130 on 28 July that ejected material from the crater vents, according to reports from Torokina, in addition to a lava flow that contained two lobes. A second explosion was detected at 2157. Incandescence from the lava flow was visible from Piva as it descended the W flank around 2000 on 29 July (figure 47). The Darwin VAAC reported that a strong thermal anomaly was visible in satellite images during 30-31 July and that ash emissions rose to 2.4 km altitude and drifted WSW on 30 July. A ground report from RVO described localized emissions at 0900 on 31 July.
The Darwin VAAC reported that ash plumes were identified in satellite imagery at 0800 and 1220 on 12 August and rose to 2.1 km and 3 km altitude and drifted NW and W, respectively. A news report stated that aid was sent to more than 6,300 people that were adversely affected by the eruption. Photos taken during 17-19 August showed ash emissions rising no higher than 1 km above the summit and drifting SE. A small explosion generated an ash plume during the morning of 19 August. Deposits from small pyroclastic flows were also captured in the photos. Satellite images captured lava flows and pyroclastic flow deposits. Two temporary seismic stations were installed near Bagana on 17 August at distances of 7 km WSW (Vakovi station) and 11 km SW (Kepox station). The Kepox station immediately started to record continuous, low-frequency background seismicity.
Satellite data. Little to no thermal activity was detected during April through mid-July 2023; only one anomaly was recorded during early April and one during early June, according to MIROVA (Middle InfraRed Observation of Volcanic Activity) data (figure 48). Thermal activity increased in both power and frequency during mid-July through September, although there were still some short gaps in detected activity. MODVOLC also detected increased thermal activity during August; thermal hotspots were detected a total of five times on 19, 20, and 27 August. Weak thermal anomalies were also captured in infrared satellite images on clear weather days throughout the reporting period on 7, 12, and 17 April, 27 May, 1, 6, 16, and 31 July, and 19 September (figure 48); a strong thermal anomaly was visible on 31 July. Distinct sulfur dioxide plumes that drifted generally NW were intermittently captured by the TROPOMI instrument on the Sentinel-5P satellite and sometimes exceeded two Dobson Units (DUs) (figure 49).
Geologic Background. Bagana volcano, in a remote portion of central Bougainville Island, is frequently active. This massive symmetrical cone was largely constructed by an accumulation of viscous andesitic lava flows. The entire edifice could have been constructed in about 300 years at its present rate of lava production. Eruptive activity is characterized by non-explosive effusion of viscous lava that maintains a small lava dome in the summit crater, although occasional explosive activity produces pyroclastic flows. Lava flows with tongue-shaped lobes up to 50 m thick and prominent levees descend the flanks on all sides.
Information Contacts: Rabaul Volcano Observatory (RVO), Geohazards Management Division, Department of Mineral Policy and Geohazards Management (DMPGM), PO Box 3386, Kokopo, East New Britain Province, Papua New Guinea; Darwin Volcanic Ash Advisory Centre (VAAC), Bureau of Meteorology, Northern Territory Regional Office, PO Box 40050, Casuarina, NT 0811, Australia (URL: http://www.bom.gov.au/info/vaac/); MIROVA (Middle InfraRed Observation of Volcanic Activity), a collaborative project between the Universities of Turin and Florence (Italy) supported by the Centre for Volcanic Risk of the Italian Civil Protection Department (URL: http://www.mirovaweb.it/); Hawai'i Institute of Geophysics and Planetology (HIGP) - MODVOLC Thermal Alerts System, School of Ocean and Earth Science and Technology (SOEST), Univ. of Hawai'i, 2525 Correa Road, Honolulu, HI 96822, USA (URL: http://modis.higp.hawaii.edu/); NASA Global Sulfur Dioxide Monitoring Page, Atmospheric Chemistry and Dynamics Laboratory, NASA Goddard Space Flight Center (NASA/GSFC), 8800 Greenbelt Road, Goddard, Maryland, USA (URL: https://so2.gsfc.nasa.gov/); Copernicus Browser, Copernicus Data Space Ecosystem, European Space Agency (URL: https://dataspace.copernicus.eu/browser/); Autonomous Bougainville Government, P.O Box 322, Buka, AROB, PNG (URL: https://abg.gov.pg/); Andrew Tupper (Twitter: @andrewcraigtupp); Simon Carn, Geological and Mining Engineering and Sciences, Michigan Technological University, 1400 Townsend Drive, Houghton, MI 49931, USA (URL: http://www.volcarno.com/, Twitter: @simoncarn); Radio NZ (URL: https://www.rnz.co.nz/news/pacific/494464/more-than-7-000-people-in-bougainville-need-temporary-accommodation-after-eruption); USAID, 1300 Pennsylvania Ave, NW, Washington DC 20004, USA (URL: https://www.usaid.gov/pacific-islands/press-releases/aug-08-2023-united-states-provides-immediate-emergency-assistance-support-communities-affected-mount-bagana-volcanic-eruptions).
Mayon (Philippines) — October 2023 Cite this Report
Mayon
Philippines
13.257°N, 123.685°E; summit elev. 2462 m
All times are local (unless otherwise noted)
Lava flows, pyroclastic flows, ash emissions, and seismicity during April-September 2023
Mayon is located in the Philippines and has steep upper slopes capped by a small summit crater. Historical eruptions date back to 1616 CE that have been characterized by Strombolian eruptions, lava flows, pyroclastic flows, and mudflows. Eruptions mostly originated from a central conduit. Pyroclastic flows and mudflows have commonly descended many of the approximately 40 drainages that surround the volcano. The most recent eruption occurred during June through October 2022 and consisted of lava dome growth and gas-and-steam emissions (BGVN 47:12). A new eruption was reported during late April 2023 and has included lava flows, pyroclastic density currents, ash emissions, and seismicity. This report covers activity during April through September 2023 based on daily bulletins from the Philippine Institute of Volcanology and Seismology (PHIVOLCS).
During April through September 2023, PHIVOLCS reported near-daily rockfall events, frequent volcanic earthquakes, and sulfur dioxide measurements. Gas-and-steam emissions rose 100-900 m above the crater and drifted in different directions. Nighttime crater incandescence was often visible during clear weather and was accompanied by incandescent avalanches of material. Activity notably increased during June when lava flows were reported on the S, SE, and E flanks (figure 52). The MIROVA graph (Middle InfraRed Observation of Volcanic Activity) showed strong thermal activity coincident with these lava flows, which remained active through September (figure 53). According to the MODVOLC thermal algorithm, a total of 110 thermal alerts were detected during the reporting period: 17 during June, 40 during July, 27 during August, and 26 during September. During early June, pyroclastic density currents (PDCs) started to occur more frequently.
Low activity was reported during much of April and May; gas-and-steam emissions rose 100-900 m above the crater and generally drifted in different directions. A total of 52 rockfall events and 18 volcanic earthquakes were detected during April and 147 rockfall events and 13 volcanic events during May. Sulfur dioxide flux measurements ranged between 400-576 tons per day (t/d) during April, the latter of which was measured on 29 April and between 162-343 t/d during May, the latter of which was measured on 13 May.
Activity during June increased, characterized by lava flows, pyroclastic density currents (PDCs), crater incandescence and incandescent rockfall events, gas-and-steam emissions, and continued seismicity. Weather clouds often prevented clear views of the summit, but during clear days, moderate gas-and-steam emissions rose 100-2,500 m above the crater and drifted in multiple directions. A total of 6,237 rockfall events and 288 volcanic earthquakes were detected. The rockfall events often deposited material on the S and SE flanks within 700-1,500 m of the summit crater and ash from the events drifted SW, S, SE, NE, and E. Sulfur dioxide emissions ranged between 149-1,205 t/d, the latter of which was measured on 10 June. Short-term observations from EDM and electronic tiltmeter monitoring indicated that the upper slopes were inflating since February 2023. Longer-term ground deformation parameters based on EDM, precise leveling, continuous GPS, and electronic tilt monitoring indicated that the volcano remained inflated, especially on the NW and SE flanks. At 1000 on 5 June the Volcano Alert Level (VAL) was raised to 2 (on a 0-5 scale). PHIVOLCS noted that although low-level volcanic earthquakes, ground deformation, and volcanic gas emissions indicated unrest, the steep increase in rockfall frequency may indicate increased dome activity.
A total of 151 dome-collapse PDCs occurred during 8-9 and 11-30 June, traveled 500-2,000 m, and deposited material on the S flank within 2 km of the summit crater. During 8-9 June the VAL was raised to 3. At approximately 1947 on 11 June lava flow activity was reported; two lobes traveled within 500 m from the crater and deposited material on the S (Mi-isi), SE (Bonga), and E (Basud) flanks. Weak seismicity accompanied the lava flow and slight inflation on the upper flanks. This lava flow remained active through 30 June, moving down the S and SE flank as far as 2.5 km and 1.8 km, respectively and depositing material up to 3.3 km from the crater. During 15-16 June traces of ashfall from the PDCs were reported in Sitio Buga, Nabonton, City of Ligao and Purok, and San Francisco, Municipality of Guinobatan. During 28-29 June there were two PDCs generated by the collapse of the lava flow front, which generated a light-brown ash plume 1 km high. Satellite monitors detected significant concentrations of sulfur dioxide beginning on 29 June. On 30 June PDCs primarily affected the Basud Gully on the E flank, the largest of which occurred at 1301 and lasted eight minutes, based on the seismic record. Four PDCs generated between 1800 and 2000 that lasted approximately four minutes each traveled 3-4 km on the E flank and generated an ash plume that rose 1 km above the crater and drifted N and NW. Ashfall was recorded in Tabaco City.
Similar strong activity continued during July; slow lava effusion remained active on the S and SE flanks and traveled as far as 2.8 km and 2.8 km, respectively and material was deposited as far as 4 km from the crater. There was a total of 6,983 rockfall events and 189 PDCs that affected the S, SE, and E flanks. The volcano network detected a total of 2,124 volcanic earthquakes. Continuous gas-and-steam emissions rose 200-2,000 m above the crater and drifted in multiple directions. Sulfur dioxide emissions averaged 792-4,113 t/d, the latter of which was measured on 28 July. During 2-4 July three PDCs were generated from the collapse of the lava flow and resulting light brown plumes rose 200-300 m above the crater. Continuous tremor pulses were reported beginning at 1547 on 3 July through 7 July at 1200, at 2300 on 8 July and going through 0300 on 10 July, and at 2300 on 16 July, as recorded by the seismic network. During 6-9 July there were 10 lava flow-collapse-related PDCs that generated light brown plumes 300-500 m above the crater. During 10-11 July light ashfall was reported in some areas of Mabinit, Legazpi City, Budiao and Salvacion, Daraga, and Camalig, Albay. By 18 July the lava flow advanced 600 m on the E flank as well.
During 1733 on 18 July and 0434 on 19 July PHIVOLCS reported 30 “ashing” events, which are degassing events accompanied by audible thunder-like sounds and entrained ash at the crater, which produced short, dark plumes that drifted SW. These events each lasted 20-40 seconds, and plume heights ranged from 150-300 m above the crater, as recorded by seismic, infrasound, visual, and thermal monitors. Three more ashing events occurred during 19-20 July. Short-term observations from electronic tilt and GPS monitoring indicate deflation on the E lower flanks in early July and inflation on the NW middle flanks during the third week of July. Longer-term ground deformation parameters from EDM, precise leveling, continuous GPS, and electronic tilt monitoring indicated that the volcano was still generally inflated relative to baseline levels. A short-lived lava pulse lasted 28 seconds at 1956 on 21 July, which was accompanied by seismic and infrasound signals. By 22 July, the only lava flow that remained active was on the SE flank, and continued to extend 3.4 km, while those on the S and E flanks weakened markedly. One ashing event was detected during 30-31 July, whereas there were 57 detected during 31 July-1 August; according to PHIVOLCS beginning at approximately 1800 on 31 July eruptive activity was dominated by phases of intermittent ashing, as well as increased in the apparent rates of lava effusion from the summit crater. The ashing phases consisted of discrete events recorded as low-frequency volcanic earthquakes (LFVQ) typically 30 seconds in duration, based on seismic and infrasound signals. Gray ash plume rose 100 m above the crater and generally drifted NE. Shortly after these ashing events began, new lava began to effuse rapidly from the crater, feeding the established flowed on the SE, E, and E flanks and generating frequent rockfall events.
Intensified unrest persisted during August. There was a total of 4,141 rockfall events, 2,881 volcanic earthquakes, which included volcanic tremor events, 32 ashing events, and 101 PDCs detected throughout the month. On clear weather days, gas-and-steam emissions rose 300-1,500 m above the crater and drifted in different directions (figure 54). Sulfur dioxide emissions averaged 735-4,756 t/d, the higher value of which was measured on 16 August. During 1-2 August the rate of lava effusion decreased, but continued to feed the flows on the SE, S, and E flanks, maintaining their advances to 3.4 km, 2.8 km, and 1.1 km from the crater, respectively (figure 55). Rockfall and PDCs generated by collapses at the lava flow margins and from the summit dome deposited material within 4 km of the crater. During 3-4 August there were 10 tremor events detected that lasted 1-4 minutes. Short-lived lava pulse lasted 35 seconds and was accompanied by seismic and infrasound signals at 0442 on 6 August. Seven collapses were recorded at the front of the lava flow during 12-14 August.
During September, similar activity of slow lava effusion, PDCs, gas-and-steam emissions, and seismicity continued. There was a total of 4,452 rockfall events, 329 volcanic earthquakes, which included volcanic tremor events, two ashing events, and 85 PDCs recorded throughout the month. On clear weather days, gas-and-steam emissions rose 100-1,500 m above the crater and drifted in multiple directions. Sulfur dioxide emissions averaged 609-2,252 t/d, the higher average of which was measured on 6 September. Slow lava effusion continued advancing on the SE, S, and E flanks, maintaining lengths of 3.4 km, 2.8 km, and 1.1 km, respectively. Rockfall and PDC events generated by collapses along the lava flow margins and at the summit dome deposited material within 4 km of the crater.
Geologic Background. Symmetrical Mayon, which rises above the Albay Gulf NW of Legazpi City, is the most active volcano of the Philippines. The steep upper slopes are capped by a small summit crater. Recorded eruptions since 1616 CE range from Strombolian to basaltic Plinian, with cyclical activity beginning with basaltic eruptions, followed by longer periods of andesitic lava flows. Eruptions occur predominately from the central conduit and have also produced lava flows that travel far down the flanks. Pyroclastic density currents and mudflows have commonly swept down many of the approximately 40 ravines that radiate from the summit and have often damaged populated lowland areas. A violent eruption in 1814 killed more than 1,200 people and devastated several towns.
Information Contacts: Philippine Institute of Volcanology and Seismology (PHIVOLCS), Department of Science and Technology, University of the Philippines Campus, Diliman, Quezon City, Philippines (URL: http://www.phivolcs.dost.gov.ph/); MIROVA (Middle InfraRed Observation of Volcanic Activity), a collaborative project between the Universities of Turin and Florence (Italy) supported by the Centre for Volcanic Risk of the Italian Civil Protection Department (URL: http://www.mirovaweb.it/); Hawai'i Institute of Geophysics and Planetology (HIGP) - MODVOLC Thermal Alerts System, School of Ocean and Earth Science and Technology (SOEST), Univ. of Hawai'i, 2525 Correa Road, Honolulu, HI 96822, USA (URL: http://modis.higp.hawaii.edu/); Copernicus Browser, Copernicus Data Space Ecosystem, European Space Agency (URL: https://dataspace.copernicus.eu/browser/); William Rogers, Legazpi City, Albay Province, Philippines.
Nishinoshima (Japan) — October 2023 Cite this Report
Nishinoshima
Japan
27.247°N, 140.874°E; summit elev. 100 m
All times are local (unless otherwise noted)
Eruption plumes and gas-and-steam plumes during May-August 2023
Nishinoshima, located about 1,000 km S of Tokyo, is a small island in the Ogasawara Arc in Japan. The island is the summit of a massive submarine volcano that has prominent submarine peaks to the S, W, and NE. Eruptions date back to 1973 and the current eruption period began in October 2022. Recent activity has consisted of small ash plumes and fumarolic activity (BGVN 48:07). This report covers activity during May through August 2023, using information from monthly reports of the Japan Meteorological Agency (JMA) monthly reports and satellite data.
Activity during May through June was relatively low. The Japan Coast Guard (JCG) did overflights on 14 and 22 June and reported white gas-and-steam emissions rising 600 m and 1,200 m from the central crater of the pyroclastic cone, respectively (figure 125). In addition, multiple white gas-and-steam emissions rose from the inner rim of the W side of the crater and from the SE flank of the pyroclastic cone. Discolored brown-to-green water was observed around almost the entire perimeter of the island; on 22 June light green discolored water was observed off the S coast of the island.
Observations from the Himawari meteorological satellite confirmed an eruption on 9 and 10 July. An eruption plume rose 1.6 km above the crater and drifted N around 1300 on 9 July. Satellite images acquired at 1420 and 2020 on 9 July and at 0220 on 10 July showed continuing emissions that rose 1.3-1.6 km above the crater and drifted NE and N. The Tokyo VAAC reported that an ash plume seen by a pilot and identified in a satellite image at 0630 on 21 July rose to 3 km altitude and drifted S.
Aerial observations conducted by JCG on 8 August showed a white-and-gray plume rising from the central crater of the pyroclastic cone, and multiple white gas-and-steam emissions were rising from the inner edge of the western crater and along the NW-SE flanks of the island (figure 126). Brown-to-green discolored water was also noted around the perimeter of the island.
Intermittent low-to-moderate power thermal anomalies were recorded in the MIROVA graph (Middle InfraRed Observation of Volcanic Activity), showing an increase in both frequency and power beginning in July (figure 127). This increase in activity coincides with eruptive activity on 9 and 10 July, characterized by eruption plumes. According to the MODVOLC thermal alert algorithm, one thermal hotspot was recorded on 20 July. Weak thermal anomalies were also detected in infrared satellite imagery, accompanied by strong gas-and-steam plumes (figure 128).
Geologic Background. The small island of Nishinoshima was enlarged when several new islands coalesced during an eruption in 1973-74. Multiple eruptions that began in 2013 completely covered the previous exposed surface and continued to enlarge the island. The island is the summit of a massive submarine volcano that has prominent peaks to the S, W, and NE. The summit of the southern cone rises to within 214 m of the ocean surface 9 km SSE.
Information Contacts: Japan Meteorological Agency (JMA), 1-3-4 Otemachi, Chiyoda-ku, Tokyo 100-8122, Japan (URL: http://www.jma.go.jp/jma/indexe.html); Tokyo Volcanic Ash Advisory Center (VAAC), 1-3-4 Otemachi, Chiyoda-ku, Tokyo 100-8122, Japan (URL: http://ds.data.jma.go.jp/svd/vaac/data/); MIROVA (Middle InfraRed Observation of Volcanic Activity), a collaborative project between the Universities of Turin and Florence (Italy) supported by the Centre for Volcanic Risk of the Italian Civil Protection Department (URL: http://www.mirovaweb.it/); Copernicus Browser, Copernicus Data Space Ecosystem, European Space Agency (URL: https://dataspace.copernicus.eu/browser/).
Krakatau (Indonesia) — October 2023 Cite this Report
Krakatau
Indonesia
6.1009°S, 105.4233°E; summit elev. 285 m
All times are local (unless otherwise noted)
White gas-and-steam plumes and occasional ash plumes during May-August 2023
Krakatau is located in the Sunda Strait between Java and Sumatra, Indonesia. Caldera collapse during the catastrophic 1883 eruption destroyed Danan and Perbuwatan cones and left only a remnant of Rakata. The post-collapse cone of Anak Krakatau (Child of Krakatau) was constructed within the 1883 caldera at a point between the former Danan and Perbuwatan cones; it has been the site of frequent eruptions since 1927. The current eruption period began in May 2021 and has recently consisted of Strombolian eruptions and ash plumes (BGVN 48:07). This report describes lower levels of activity consisting of ash and white gas-and-steam plumes during May through August 2023, based on information provided by the Indonesian Center for Volcanology and Geological Hazard Mitigation, referred to as Pusat Vulkanologi dan Mitigasi Bencana Geologi (PVMBG), MAGMA Indonesia, and satellite data.
Activity was relatively low during May and June. Daily white gas-and-steam emissions rose 25-200 m above the crater and drifted in different directions. Five ash plumes were detected at 0519 on 10 May, 1241 on 11 May, 0920 on 12 May, 2320 on 12 May, and at 0710 on 13 May, and rose 1-2.5 km above the crater and drifted SW. A webcam image taken on 12 May showed ejection of incandescent material above the vent. A total of nine ash plumes were detected during 6-11 June: at 1434 and 00220 on 6 and 7 June the ash plumes rose 500 m above the crater and drifted NW, at 1537 on 8 June the ash plume rose 1 km above the crater and drifted SW, at 0746 and at 0846 on 9 June the ash plumes rose 800 m and 3 km above the crater and drifted SW, respectively, at 0423, 1431, and 1750 on 10 June the ash plumes rose 2 km, 1.5 km, and 3.5 km above the crater and drifted NW, respectively, and at 0030 on 11 June an ash plume rose 2 km above the crater and drifted NW. Webcam images taken on 10 and 11 June at 0455 and 0102, respectively, showed incandescent material ejected above the vent. On 19 June an ash plume at 0822 rose 1.5 km above the crater and drifted SE.
Similar low activity of white gas-and-steam emissions and few ash plumes were reported during July and August. Daily white gas-and-steam emissions rose 25-300 m above the crater and drifted in multiple directions. Three ash plumes were reported at 0843, 0851, and 0852 on 20 July that rose 500-2,000 m above the crater and drifted NW.
The MIROVA (Middle InfraRed Observation of Volcanic Activity) graph of MODIS thermal anomaly data showed intermittent low-to-moderate power thermal anomalies during May through August 2023 (figure 140). Although activity was often obscured by weather clouds, a thermal anomaly was visible in an infrared satellite image of the crater on 12 May, accompanied by an eruption plume that drifted SW (figure 141).
Geologic Background. The renowned Krakatau (frequently mis-named as Krakatoa) volcano lies in the Sunda Strait between Java and Sumatra. Collapse of an older edifice, perhaps in 416 or 535 CE, formed a 7-km-wide caldera. Remnants of that volcano are preserved in Verlaten and Lang Islands; subsequently the Rakata, Danan, and Perbuwatan cones were formed, coalescing to create the pre-1883 Krakatau Island. Caldera collapse during the catastrophic 1883 eruption destroyed Danan and Perbuwatan, and left only a remnant of Rakata. This eruption caused more than 36,000 fatalities, most as a result of tsunamis that swept the adjacent coastlines of Sumatra and Java. Pyroclastic surges traveled 40 km across the Sunda Strait and reached the Sumatra coast. After a quiescence of less than a half century, the post-collapse cone of Anak Krakatau (Child of Krakatau) was constructed within the 1883 caldera at a point between the former Danan and Perbuwatan cones. Anak Krakatau has been the site of frequent eruptions since 1927.
Information Contacts: Pusat Vulkanologi dan Mitigasi Bencana Geologi (PVMBG, also known as Indonesian Center for Volcanology and Geological Hazard Mitigation, CVGHM), Jalan Diponegoro 57, Bandung 40122, Indonesia (URL: http://www.vsi.esdm.go.id/); MAGMA Indonesia, Kementerian Energi dan Sumber Daya Mineral (URL: https://magma.esdm.go.id/v1); MIROVA (Middle InfraRed Observation of Volcanic Activity), a collaborative project between the Universities of Turin and Florence (Italy) supported by the Centre for Volcanic Risk of the Italian Civil Protection Department (URL: http://www.mirovaweb.it/); Copernicus Browser, Copernicus Data Space Ecosystem, European Space Agency (URL: https://dataspace.copernicus.eu/browser/).
Villarrica (Chile) — October 2023 Cite this Report
Villarrica
Chile
39.42°S, 71.93°W; summit elev. 2847 m
All times are local (unless otherwise noted)
Strombolian activity, gas-and-ash emissions, and crater incandescence during April-September 2023
Villarrica, in central Chile, consists of a 2-km-wide caldera that formed about 3,500 years ago and is located at the base of the presently active cone at the NW margin of a 6-km-wide caldera. Historical eruptions eruptions date back to 1558 and have been characterized by mild-to-moderate explosive activity with occasional lava effusions. The current eruption period began in December 2014 and has recently consisted of nighttime crater incandescence, ash emissions, and seismicity (BGVN 48:04). This report covers activity during April through September 2023 and describes occasional Strombolian activity, gas-and-ash emissions, and nighttime crater incandescence. Information for this report primarily comes from the Southern Andes Volcano Observatory (Observatorio Volcanológico de Los Andes del Sur, OVDAS), part of Chile's National Service of Geology and Mining (Servicio Nacional de Geología y Minería, SERNAGEOMIN) and satellite data.
Seismicity during April consisted of long period (LP) events and tremor (TRE); a total of 9,413 LP-type events and 759 TR-type events were detected throughout the month. Nighttime crater incandescence persisted and was visible in the degassing column. Sulfur dioxide data was obtained using Differential Absorption Optical Spectroscopy Equipment (DOAS) that showed an average value of 1,450 ± 198 tons per day (t/d) during 1-15 April and 1,129 ± 201 t/d during 16-30 April, with a maximum daily value of 2,784 t/d on 9 April. Gas-and-steam emissions of variable intensities rose above the active crater as high as 1.3 km above the crater on 13 April. Strombolian explosions were not observed and there was a slight decrease in the lava lake level.
There were 14,123 LP-type events and 727 TR-type events detected during May. According to sulfur dioxide measurements taken with DOAS equipment, the active crater emitted an average value of 1,826 ± 482 t/d during 1-15 May and 912 ± 41 t/d during 16-30 May, with a daily maximum value of 5,155 t/d on 13 May. Surveillance cameras showed continuous white gas-and-steam emissions that rose as high as 430 m above the crater on 27 May. Nighttime incandescence illuminated the gas column less than 300 m above the crater rim was and no pyroclastic emissions were reported. A landslide was identified on 13 May on the E flank of the volcano 50 m from the crater rim and extending 300 m away; SERNAGEOMIN noted that this event may have occurred on 12 May. During the morning of 27 and 28 May minor Strombolian explosions characterized by incandescent ejecta were recorded at the crater rim; the last reported Strombolian explosions had occurred at the end of March.
Seismic activity during June consisted of five volcano-tectonic (VT)-type events, 21,606 LP-type events, and 2,085 TR-type events. The average value of sulfur dioxide flux obtained by DOAS equipment was 1,420 ± 217 t/d during 1-15 June and 2,562 ± 804 t/d, with a maximum daily value of 4,810 t/d on 17 June. White gas-and-steam emissions rose less than 480 m above the crater; frequent nighttime crater incandescence was reflected in the degassing plume. On 12 June an emission rose 100 m above the crater and drifted NNW. On 15 June one or several emissions resulted in ashfall to the NE as far as 5.5 km from the crater, based on a Skysat satellite image. Several Strombolian explosions occurred within the crater; activity on 15 June was higher energy and ejected blocks 200-300 m on the NE slope. Surveillance cameras showed white gas-and-steam emissions rising 480 m above the crater on 16 June. On 19 and 24 June low-intensity Strombolian activity was observed, ejecting material as far as 200 m from the center of the crater to the E.
During July, seismicity included 29,319 LP-type events, 3,736 TR-type events, and two VT-type events. DOAS equipment recorded two days of sulfur dioxide emissions of 4,220 t/d and 1,009 t/d on 1 and 13 July, respectively. Constant nighttime incandescence was also recorded and was particularly noticeable when accompanied by eruptive columns on 12 and 16 July. Minor explosive events were detected in the crater. According to Skysat satellite images taken on 12, 13, and 16 July, ashfall deposits were identified 155 m S of the crater. According to POVI, incandescence was visible from two vents on the crater floor around 0336 on 12 July. Gas-and-ash emissions rose as high as 1.2 km above the crater on 13 July and drifted E and NW. A series of gas-and-steam pulses containing some ash deposited material on the upper E flank around 1551 on 13 July. During 16-31 July, average sulfur dioxide emissions of 1,679 ± 406 t/d were recorded, with a maximum daily value of 2,343 t/d on 28 July. Fine ash emissions were also reported on 16, 17, and 23 July.
Seismicity persisted during August, characterized by 27,011 LP-type events, 3,323 TR-type events, and three VT-type events. The average value of sulfur dioxide measurements taken during 1-15 August was 1,642 ± 270 t/d and 2,207 ± 4,549 t/d during 16-31 August, with a maximum daily value of 3,294 t/d on 27 August. Nighttime crater incandescence remained visible in degassing columns. White gas-and-steam emissions rose 480 m above the crater on 6 August. According to a Skysat satellite image from 6 August, ash accumulation was observed proximal to the crater and was mainly distributed toward the E slope. White gas-and-steam emissions rose 320 m above the crater on 26 August. Nighttime incandescence and Strombolian activity that generated ash emissions were reported on 27 August.
Seismicity during September was characterized by five VT-type events, 12,057 LP-type events, and 2,058 TR-type events. Nighttime incandescence persisted. On 2 September an ash emission rose 180 m above the crater and drifted SE at 1643 (figure 125) and a white gas-and-steam plume rose 320 m above the crater. According to the Buenos Aires VAAC, periods of continuous gas-and-ash emissions were visible in webcam images from 1830 on 2 September to 0110 on 3 September. Strombolian activity was observed on 2 September and during the early morning of 3 September, the latter event of which generated an ash emission that rose 60 m above the crater and drifted 100 m from the center of the crater to the NE and SW. Ashfall was reported to the SE and S as far as 750 m from the crater. The lava lake was active during 3-4 September and lava fountaining was visible for the first time since 26 March 2023, according to POVI. Fountains captured in webcam images at 2133 on 3 September and at 0054 on 4 September rose as high as 60 m above the crater rim and ejected material onto the upper W flank. Sulfur dioxide flux of 1,730 t/d and 1,281 t/d was measured on 3 and 4 September, respectively, according to data obtained by DOAS equipment.
Strong Strombolian activity and larger gas-and-ash plumes were reported during 18-20 September. On 18 September activity was also associated with energetic LP-type events and notable sulfur dioxide fluxes (as high as 4,277 t/d). On 19 September Strombolian activity and incandescence were observed. On 20 September at 0914 ash emissions rose 50 m above the crater and drifted SSE, accompanied by Strombolian activity that ejected material less than 100 m SSE, causing fall deposits on that respective flank. SERNAGEOMIN reported that a Planet Scope satellite image taken on 20 September showed the lava lake in the crater, measuring 32 m x 35 m and an area of 0.001 km2. Several ash emissions were recorded at 0841, 0910, 1251, 1306, 1312, 1315, and 1324 on 23 September and rose less than 150 m above the crater. The sulfur dioxide flux value was 698 t/d on 23 September and 1,097 t/d on 24 September. On 24 September the Volcanic Alert Level (VAL) was raised to Orange (the third level on a four-color scale). SENAPRED maintained the Alert Level at Yellow (the middle level on a three-color scale) for the communities of Villarrica, Pucón (16 km N), Curarrehue, and Panguipulli.
During 24-25 September there was an increase in seismic energy (observed at TR-events) and acoustic signals, characterized by 1 VT-type event, 213 LP-type events, and 124 TR-type events. Mainly white gas-and-steam emissions, in addition to occasional fine ash emissions were recorded. During the early morning of 25 September Strombolian explosions were reported and ejected material 250 m in all directions, though dominantly toward the NW. On 25 September the average value of sulfur dioxide flux was 760 t/d. Seismicity during 25-30 September consisted of five VT-type events, 1,937 LP-type events, and 456 TR-type events.
During 25-29 September moderate Strombolian activity was observed and ejected material as far as the crater rim. In addition, ash pulses lasting roughly 50 minutes were observed around 0700 and dispersed ENE. During 26-27 September a TR episode lasted 6.5 hours and was accompanied by discrete acoustic signals. Satellite images from 26 September showed a spatter cone on the crater floor with one vent that measured 10 x 14 m and a smaller vent about 35 m NE of the cone. SERNAGEOMIN reported an abundant number of bomb-sized blocks up to 150 m from the crater, as well as impact marks on the snow, which indicated explosive activity. A low-altitude ash emission was observed drifting NW around 1140 on 28 September, based on webcam images. Between 0620 and 0850 on 29 September an ash emission rose 60 m above the crater and drifted NW. During an overflight taken around 1000 on 29 September scientists observed molten material in the vent, a large accumulation of pyroclasts inside the crater, and energetic degassing, some of which contained a small amount of ash. Block-sized pyroclasts were deposited on the internal walls and near the crater, and a distal ash deposit was also visible. The average sulfur dioxide flux measured on 28 September was 344 t/d. Satellite images taken on 29 September ashfall was deposited roughly 3 km WNW from the crater and nighttime crater incandescence remained visible. The average sulfur dioxide flux value from 29 September was 199 t/d. On 30 September at 0740 a pulsating ash emission rose 1.1 km above the crater and drifted NNW (figure 126). Deposits on the S flank extended as far as 4.5 km from the crater rim, based on satellite images from 30 September.
Infrared MODIS satellite data processed by MIROVA (Middle InfraRed Observation of Volcanic Activity) showed intermittent thermal activity during April through September, with slightly stronger activity detected during late September (figure 127). Small clusters of thermal activity were detected during mid-June, early July, early August, and late September. According to the MODVOLC thermal alert system, a total of four thermal hotspots were detected on 7 July and 3 and 23 September. This activity was also intermittently captured in infrared satellite imagery on clear weather days (figure 128).
Geologic Background. The glacier-covered Villarrica stratovolcano, in the northern Lakes District of central Chile, is ~15 km south of the city of Pucon. A 2-km-wide caldera that formed about 3,500 years ago is located at the base of the presently active, dominantly basaltic to basaltic andesite cone at the NW margin of a 6-km-wide Pleistocene caldera. More than 30 scoria cones and fissure vents are present on the flanks. Plinian eruptions and pyroclastic flows that have extended up to 20 km from the volcano were produced during the Holocene. Lava flows up to 18 km long have issued from summit and flank vents. Eruptions documented since 1558 CE have consisted largely of mild-to-moderate explosive activity with occasional lava effusion. Glaciers cover 40 km2 of the volcano, and lahars have damaged towns on its flanks.
Information Contacts: Servicio Nacional de Geología y Minería (SERNAGEOMIN), Observatorio Volcanológico de Los Andes del Sur (OVDAS), Avda Sta María No. 0104, Santiago, Chile (URL: http://www.sernageomin.cl/); Proyecto Observación Villarrica Internet (POVI) (URL: http://www.povi.cl/); Sistema y Servicio Nacional de Prevención y Repuesta Ante Desastres (SENAPRED), Av. Beauchef 1671, Santiago, Chile (URL: https://web.senapred.cl/); Buenos Aires Volcanic Ash Advisory Center (VAAC), Servicio Meteorológico Nacional-Fuerza Aérea Argentina, 25 de mayo 658, Buenos Aires, Argentina (URL: http://www.smn.gov.ar/vaac/buenosaires/inicio.php); MIROVA (Middle InfraRed Observation of Volcanic Activity), a collaborative project between the Universities of Turin and Florence (Italy) supported by the Centre for Volcanic Risk of the Italian Civil Protection Department (URL: http://www.mirovaweb.it/); Hawai'i Institute of Geophysics and Planetology (HIGP) - MODVOLC Thermal Alerts System, School of Ocean and Earth Science and Technology (SOEST), Univ. of Hawai'i, 2525 Correa Road, Honolulu, HI 96822, USA (URL: http://modis.higp.hawaii.edu/); Copernicus Browser, Copernicus Data Space Ecosystem, European Space Agency (URL: https://dataspace.copernicus.eu/browser/).
Merapi (Indonesia) — October 2023 Cite this Report
Merapi
Indonesia
7.54°S, 110.446°E; summit elev. 2910 m
All times are local (unless otherwise noted)
Frequent incandescent avalanches during April-September 2023
Merapi, located just north of the major city of Yogyakarta in central Java, Indonesia, has had activity within the last 20 years characterized by pyroclastic flows and lahars accompanying growth and collapse of the steep-sided active summit lava dome. The current eruption period began in late December 2020 and has more recently consisted of ash plumes, intermittent incandescent avalanches of material, and pyroclastic flows (BGVN 48:04). This report covers activity during April through September 2023, based on information from Balai Penyelidikan dan Pengembangan Teknologi Kebencanaan Geologi (BPPTKG), the Center for Research and Development of Geological Disaster Technology, a branch of PVMBG which specifically monitors Merapi. Additional information comes from the Pusat Vulkanologi dan Mitigasi Bencana Geologi (PVMBG, also known as Indonesian Center for Volcanology and Geological Hazard Mitigation, CVGHM), MAGMA Indonesia, the Darwin Volcanic Ash Advisory Centre (VAAC), and various satellite data.
Activity during April through September 2023 primarily consisted of incandescent avalanches of material that mainly affected the SW and W flanks and traveled as far as 2.3 km from the summit (table 25) and white gas-and-steam emissions that rose 10-1,000 m above the crater.
Table 25. Monthly summary of avalanches and avalanche distances recorded at Merapi during April through September 2023. The number of reported avalanches does not include instances where possible avalanches were heard but could not be visually confirmed as a result of inclement weather. Data courtesy of BPPTKG (April-September 2023 daily reports).
| Month |
Average number of avalanches per day |
Distance avalanches traveled (m) |
| Apr 2023 |
19 |
1,200-2,000 |
| May 2023 |
22 |
500-2,000 |
| Jun 2023 |
18 |
1,200-2,000 |
| Jul 2023 |
30 |
300-2,000 |
| Aug 2023 |
25 |
400-2,300 |
| Sep 2023 |
23 |
600-2,000 |
BPPTKG reported that during April and May white gas-and-steam emissions rose 10-750 m above the crater, incandescent avalanches descended 500-2,000 m on the SW and W flanks (figure 135). Cloudy weather often prevented clear views of the summit, and sometimes avalanches could not be confirmed. According to a webcam image, a pyroclastic flow was visible on 17 April at 0531. During the week of 28 April and 4 May a pyroclastic flow was reported on the SW flank, traveling up to 2.5 km. According to a drone overflight taken on 17 May the SW lava dome volume was an estimated 2,372,800 cubic meters and the dome in the main crater was an estimated 2,337,300 cubic meters.
During June and July similar activity persisted with white gas-and-steam emissions rising 10-350 m above the crater and frequent incandescent avalanches that traveled 300-2,000 m down the SW, W, and S flanks (figure 136). Based on an analysis of aerial photos taken on 24 June the volume of the SW lava dome was approximately 2.5 million cubic meters. A pyroclastic flow was observed on 5 July that traveled 2.7 km on the SW flank. According to the Darwin VAAC multiple minor ash plumes were identified in satellite images on 19 July that rose to 3.7 km altitude and drifted S and SW. During 22, 25, and 26 July a total of 17 avalanches descended as far as 1.8 km on the S flank.
Frequent white gas-and-steam emissions continued during August and September, rising 10-450 m above the crater. Incandescent avalanches mainly affected the SW and W flanks and traveled 400-2,300 m from the vent (figure 137). An aerial survey conducted on 10 August was analyzed and reported that estimates of the SW dome volume was 2,764,300 cubic meters and the dome in the main crater was 2,369,800 cubic meters.
Frequent and moderate-power thermal activity continued throughout the reporting period, according to a MIROVA (Middle InfraRed Observation of Volcanic Activity) analysis of MODIS satellite data (figure 138). There was an increase in the number of detected anomalies during mid-May. The MODVOLC thermal algorithm recorded a total of 47 thermal hotspots: six during April, nine during May, eight during June, 15 during July, four during August, and five during September. Some of this activity was captured in infrared satellite imagery on clear weather days, sometimes accompanied by incandescent material on the SW flank (figure 139).
Geologic Background. Merapi, one of Indonesia's most active volcanoes, lies in one of the world's most densely populated areas and dominates the landscape immediately north of the major city of Yogyakarta. It is the youngest and southernmost of a volcanic chain extending NNW to Ungaran volcano. Growth of Old Merapi during the Pleistocene ended with major edifice collapse perhaps about 2,000 years ago, leaving a large arcuate scarp cutting the eroded older Batulawang volcano. Subsequent growth of the steep-sided Young Merapi edifice, its upper part unvegetated due to frequent activity, began SW of the earlier collapse scarp. Pyroclastic flows and lahars accompanying growth and collapse of the steep-sided active summit lava dome have devastated cultivated lands on the western-to-southern flanks and caused many fatalities.
Information Contacts: Balai Penyelidikan dan Pengembangan Teknologi Kebencanaan Geologi (BPPTKG), Center for Research and Development of Geological Disaster Technology (URL: http://merapi.bgl.esdm.go.id/, Twitter: @BPPTKG); MAGMA Indonesia, Kementerian Energi dan Sumber Daya Mineral (URL: https://magma.esdm.go.id/v1); Pusat Vulkanologi dan Mitigasi Bencana Geologi (PVMBG, also known as Indonesian Center for Volcanology and Geological Hazard Mitigation, CVGHM), Jalan Diponegoro 57, Bandung 40122, Indonesia (URL: http://www.vsi.esdm.go.id/); Darwin Volcanic Ash Advisory Centre (VAAC), Bureau of Meteorology, Northern Territory Regional Office, PO Box 40050, Casuarina, NT 0811, Australia (URL: http://www.bom.gov.au/info/vaac/); MIROVA (Middle InfraRed Observation of Volcanic Activity), a collaborative project between the Universities of Turin and Florence (Italy) supported by the Centre for Volcanic Risk of the Italian Civil Protection Department (URL: http://www.mirovaweb.it/); Hawai'i Institute of Geophysics and Planetology (HIGP) - MODVOLC Thermal Alerts System, School of Ocean and Earth Science and Technology (SOEST), Univ. of Hawai'i, 2525 Correa Road, Honolulu, HI 96822, USA (URL: http://modis.higp.hawaii.edu/); Copernicus Browser, Copernicus Data Space Ecosystem, European Space Agency (URL: https://dataspace.copernicus.eu/browser/); Øystein Lund Andersen (URL: https://www.oysteinlundandersen.com/, https://twitter.com/oysteinvolcano).
Ebeko
Russia
50.686°N, 156.014°E; summit elev. 1103 m
All times are local (unless otherwise noted)
Moderate explosive activity with ash plumes continued during June-November 2023
Ebeko, located on the N end of Paramushir Island in Russia’s Kuril Islands just S of the Kamchatka Peninsula, consists of three summit craters along a SSW-NNE line at the northern end of a complex of five volcanic cones. Observed eruptions date back to the late 18th century and have been characterized as small-to-moderate explosions from the summit crater, accompanied by intense fumarolic activity. The current eruptive period began in June 2022, consisting of frequent explosions, ash plumes, and thermal activity (BGVN 47:10, 48:06). This report covers similar activity during June-November 2023, based on information from the Kamchatka Volcanic Eruptions Response Team (KVERT) and satellite data.
Moderate explosive activity continued during June-November 2023 (figures 50 and 51). According to visual data from Severo-Kurilsk, explosions sent ash 2-3.5 km above the summit (3-4.5 km altitude) during most days during June through mid-September. Activity after mid-September was slightly weaker, with ash usually reaching less than 2 km above the summit. According to KVERT the volcano in October and November was, with a few exceptions, either quiet or obscured by clouds that prevented satellite observations. KVERT issued Volcano Observatory Notices for Aviation (VONA) on 8 and 12 June, 13 and 22 July, 3 and 21 August, and 31 October warning of potential aviation hazards from ash plumes drifting 3-15 km from the volcano. Based on satellite data, KVERT reported a persistent thermal anomaly whenever weather clouds permitted viewing.
Geologic Background. The flat-topped summit of the central cone of Ebeko volcano, one of the most active in the Kuril Islands, occupies the northern end of Paramushir Island. Three summit craters located along a SSW-NNE line form Ebeko volcano proper, at the northern end of a complex of five volcanic cones. Blocky lava flows extend west from Ebeko and SE from the neighboring Nezametnyi cone. The eastern part of the southern crater contains strong solfataras and a large boiling spring. The central crater is filled by a lake about 20 m deep whose shores are lined with steaming solfataras; the northern crater lies across a narrow, low barrier from the central crater and contains a small, cold crescentic lake. Historical activity, recorded since the late-18th century, has been restricted to small-to-moderate explosive eruptions from the summit craters. Intense fumarolic activity occurs in the summit craters, on the outer flanks of the cone, and in lateral explosion craters.
Information Contacts: Kamchatka Volcanic Eruptions Response Team (KVERT), Far Eastern Branch, Russian Academy of Sciences, 9 Piip Blvd., Petropavlovsk-Kamchatsky, 683006, Russia (URL: http://www.kscnet.ru/ivs/kvert/).
Search Bulletin Archive by Publication Date
Select a month and year from the drop-downs and click "Show Issue" to have that issue displayed in this tab.
The default month and year is the latest issue available.
Bulletin of the Global Volcanism Network - Volume 29, Number 02 (February 2004)
Managing Editor: Edward Venzke
Erta Ale (Ethiopia)
February 2004 expedition finds molten-surfaced lava lake nearly gone
Kilauea (United States)
Activity through April 2004 focuses in upper flow field (maps and diagrams)
Langila (Papua New Guinea)
MODIS thermal alerts in April 2003, and January 2004
Lengai, Ol Doinyo (Tanzania)
During February 2004, lavas still escape crater; temperature measurements
Llaima (Chile)
Extreme glacial crevassing and melting; April 2003 ash emissions
Manam (Papua New Guinea)
One minor eruption but otherwise low activity during February 2004
Rabaul (Papua New Guinea)
1-17 February 2004-ash falls 30 km to the E
Ruang (Indonesia)
Eruption on 25 September 2002 is the largest in Indonesia in many years
Ruapehu (New Zealand)
Strategy, prediction, and management of crater-lake overflow and powerful lahar
Soufriere Hills (United Kingdom)
Ash to 7 km altitude on 3 March 2004; pyroclastic flows reached the sea
Stromboli (Italy)
After 10 February 2004, explosions at upper limit of that typically seen
Ulawun (Papua New Guinea)
Tabulation of aviation reports issued during 2000-mid-2003
Witori (Papua New Guinea)
Two explosions on 24 February 2004, otherwise quiet during that month
Erta Ale (Ethiopia) — February 2004 Cite this Report
Erta Ale
Ethiopia
13.601°N, 40.666°E; summit elev. 585 m
All times are local (unless otherwise noted)
February 2004 expedition finds molten-surfaced lava lake nearly gone
In February 2004 an expedition led by German scientists visited Erta Ale. Afterwards, an overflight completed the survey of volcanic activity. Of significance was the discovery that an earlier lava lake had largely disappeared. Information from their report follows.
German scientists were at Erta Ale during 9-13 February 2004. They explored areas around the S crater of the volcano, which for the past several years has contained an active lava lake (see BGVN 28:04 and 26:12). The S crater retained only a very small fraction of the former lava lake. When visited it stood ~ 15 m in diameter, located roughly in the center of the old lake. Around the small lake were many active gas vents, and there was a hornito, about 2 m tall, on the SE side. Behind its ~ 1.5-m-high walls, the lake's lava changed levels and occasional lava fountains rose to ~ 10 m high.
On 12 February the expedition team descended to the second terrace (~90 m below the rim) of the S crater, to the surface of the former lake, and approached the small elevated lake. Samples of newly ejected lava were collected, and some were given to Gezahegn Yirgu at the University of Addis Ababa for analysis. Samples retained by the expedition team showed white crystals, approximately 1-2 mm in size, embedded in black material. On the evening of 12 February the team witnessed an overflow of the little lake, flooding the NW half of the second terrace. Parts of the western lake wall eventually collapsed, causing a lava flood wave as well as more violent fountaining (up to 20 m). This event lasted approximately 2 hours.
The entire crater was fogged by fumaroles, which were mainly active in the SE corner of the first terrace (~ 50 m below the rim). Gas masks were necessary inside the crater. From the smell and (blueish) color, these gases contained a high quantity of SO2.
No earthquakes were felt during the visit.
On 21 February a low overflight was made across the volcano. There were no more signs of a lava lake, and only three hornitos were active. Although the flight was made during the day, the glow allowed the hornitos to be visible. Upon return, Chris Heinlein noted that he found photos on the web by Luigi Cantamessa showing that during 15-17 November 2003 the lava lake was also largely gone.
Geologic Background. The Erta Ale basaltic shield volcano in Ethiopia has a 50-km-wide edifice that rises more than 600 m from below sea level in the Danakil depression. The volcano includes a 0.7 x 1.6 km summit crater hosting steep-sided pit craters. Another larger 1.8 x 3.1 km wide depression elongated parallel to the trend of the Erta Ale range is located SE of the summit and is bounded by curvilinear fault scarps on the SE side. Basaltic lava flows from these fissures have poured into the caldera and locally overflowed its rim. The summit caldera usually also holds at least one long-term lava lake that has been active since at least 1967, and possibly since 1906. Recent fissure eruptions have occurred on the N flank.
Information Contacts: Carsten Peter, Meilenbergerstr. 1, D-82057 Icking-Dorfen, Germany; Chris Heinlein, Kreuzelbergstr. 62, 76189 Karlsruhe, Germany; Arne Kaiser, Institute of Geophysics, University of Hamburg, Bundesstraβe 55, 20146 Hamburg, Germany; Luigi Cantamessa, Geó-Découverte, 12-14 rue de Cendrier, CH-1201 Geneva, Switzerland (URL: http://geo-decouverte.ch/); Gezahegn Yirgu, Department of Geology and Geophysics, Faculty of Science, Addis Ababa University, P.O. Box 1176, Addis Ababa, Ethiopia (URL: http://www.aau.edu.et/natural-sciences/geology/).
Kilauea (United States) — February 2004 Cite this Report
Kilauea
United States
19.421°N, 155.287°W; summit elev. 1222 m
All times are local (unless otherwise noted)
Activity through April 2004 focuses in upper flow field (maps and diagrams)
Kīlauea continued to be active at Pu`u `O`o during December 2003 through early March 2004. Figure 161 shows simplified maps and a diagrammatic cross-section on the Island of Hawaii, emphasizing local geography, and known and inferred conditions at Kīlauea. During the reporting interval observers noted incandescence and surface lava flows at Kīlauea's upper flow field. In general, surface lava flows were not seen on the coastal flat or Pulama pali. Various vents within Pu`u `O`o were active, and new lava flows covered parts of the crater floor. Seismicity at Kīlauea has generally included a few small earthquakes recorded at the volcano's summit, along with steady weak tremor. Tremor occurred continuously at moderate levels at Pu`u `O`o.
During 0550 to 0830 on 18 January 2004, a large period of tilt occurred at Kīlauea's Pu`u `O`o cone, amounting to 18.1 microradians of net deflation. During this period a fissure opened at the SE base of Pu`u `O`o, trending approximately radial to the cone. Lava was emitted from the fissure and from three to four vents nearby. The initial flow reached about 1.5 km S of the cone. The S side of Pu`u `O`o was cut by many new fractures. The longest fracture constituted the N boundary of a shallow graben (a linear trough bounded by faults) that was ~ 75 m long and up to 1 m deep. Surface lava flows were emitted from the E end of the graben, at the base of Pu`u `O`o. The area S of Pu`u `O`o cone appeared to be quite unstable, so Hawaiian Volcano Observatory (HVO) scientists warned that no one should venture into the area. Seismicity at Kīlauea's summit during 15-20 January was at low levels, while tremor at Pu`u `O`o was continuous and at moderate levels. The tremor picked up during the formation of the graben on 18 January. As of 20 January tilt continued to steadily decline following the 18 January deflation event.
On 22 January lava was emitted from the vent formed on 19 January. The vent and lava flow S of Pu`u `O`o cone were named MLK in honor of the activity that began on the American civil rights leader M.L. King Jr.'s birthday (19 January; see figures 162 and 163).
A term that has come into common use at Kīlauea is "rootless shield." Local geologists define this as a pile of lava flows built over a lava tube rather than over a conduit feeding magma from within the Earth. Rootless shields along the tube system commonly have flat tops containing shallow lava ponds. In the reporting interval, there were also surface lava flows at the W side of the rootless shield called Amalgamated Bend, a feature located SW of Pu`u `O`o (figure 6). By 26 January there were no surface lava flows at the MLK vent, and incandescence was only visible at the S part of the rootless shield complex. On 23 January moderate-to-strong tremor stopped beneath Kīlauea's caldera and lessened at Pu`u `O`o. On 26 January deflation that began on 18 January ended at Pu`u `O`o after reaching 24.7 microradians. This was probably the largest deflation event since early 1997.
During 29 January to 1 February mild volcanic activity occurred at Kīlauea, with incandescence visible at vents in Pu`u `O`o's crater and small surface flows on the central or southern part of the rootless shield complex. Starting on 18 January, when the MLK vent formed, the distance across the summit caldera decreased significantly, ending a period of increasing extension rate since the Mother's Day event in May 2002. During the report period, weak tremor occurred at Kīlauea's summit along with a few long-period earthquakes. Tremor at Pu`u `O`o remained moderate. During much of February 2004 and into early March, lava flows and incandescence were sometimes visible in Pu`u `O`o's crater and at the rootless shield complex (an area ~ 0.5 km SW of Pu`u `O`o). Weak background tremor occurred at Kīlauea's summit along with a few long-period earthquakes. Tremor at Pu`u `O`o was at moderate-to-low levels. Small deflation and inflation events occurred at the summit and at Pu`u `O`o.
Geologic Background. Kilauea overlaps the E flank of the massive Mauna Loa shield volcano in the island of Hawaii. Eruptions are prominent in Polynesian legends; written documentation since 1820 records frequent summit and flank lava flow eruptions interspersed with periods of long-term lava lake activity at Halemaumau crater in the summit caldera until 1924. The 3 x 5 km caldera was formed in several stages about 1,500 years ago and during the 18th century; eruptions have also originated from the lengthy East and Southwest rift zones, which extend to the ocean in both directions. About 90% of the surface of the basaltic shield volcano is formed of lava flows less than about 1,100 years old; 70% of the surface is younger than 600 years. The long-term eruption from the East rift zone between 1983 and 2018 produced lava flows covering more than 100 km2, destroyed hundreds of houses, and added new coastline.
Information Contacts: Hawaiian Volcano Observatory (HVO), U.S. Geological Survey, PO Box 51, Hawaii National Park, HI 96718, USA (URL: https://volcanoes.usgs.gov/observatories/hvo/).
Langila (Papua New Guinea) — February 2004 Cite this Report
Langila
Papua New Guinea
5.525°S, 148.42°E; summit elev. 1330 m
All times are local (unless otherwise noted)
MODIS thermal alerts in April 2003, and January 2004
Langila was last reported in BGVN 28:03, following a large ash-bearing explosion on 18 January 2003. MODIS thermal alerts were subsequently recorded on 9 April and 20, 23, 25, and 27 January 2004. One daylight alert was received and omitted (22 September 2003). Daylight alerts posted by the current algorithm are considered less reliable. No corroborative reports of activity have been received from the Rabaul Volcano Observatory or the Darwin Volcanic Ash Advisory Center (VAAC).
Geologic Background. Langila, one of the most active volcanoes of New Britain, consists of a group of four small overlapping composite basaltic-andesitic cones on the lower E flank of the extinct Talawe volcano in the Cape Gloucester area of NW New Britain. A rectangular, 2.5-km-long crater is breached widely to the SE; Langila was constructed NE of the breached crater of Talawe. An extensive lava field reaches the coast on the N and NE sides of Langila. Frequent mild-to-moderate explosive eruptions, sometimes accompanied by lava flows, have been recorded since the 19th century from three active craters at the summit. The youngest and smallest crater (no. 3 crater) was formed in 1960 and has a diameter of 150 m.
Information Contacts: Rob Wright, Luke Flynn, and Eric Pilger, MODIS Thermal Alert System, Hawaii Institute of Geophysics and Planetology (HIGP), School of Ocean and Earth Science and Technology, University of Hawaii at Manoa (URL: http://modis.hgip.hawaii.edu/).
Ol Doinyo Lengai (Tanzania) — February 2004 Cite this Report
Ol Doinyo Lengai
Tanzania
2.764°S, 35.914°E; summit elev. 2962 m
All times are local (unless otherwise noted)
During February 2004, lavas still escape crater; temperature measurements
Activity at Ol Doinyo Lengai has continued intermittently since October 2002 (BGVN 27:10). (According to Fred Belton, in that same month, October 2002, Paramount Pictures used the crater to shoot footage for the film "Tomb Raiders II.").
This summary report for 2003 is based on observations made by Joerg Keller, Jurgis Klaudius, Fred Belton, and Christoph Weber, as well as information collected by Celia Nyamweru from visits to the area. Christoph Weber most recently visited Lengai in February 2004, when he collected GPS data for a new, precise crater map (figure 78). He also took temperature measurements of fumaroles and lava flows (see tables 5 and 6), and gathered lava samples to be given to research departments.
Table 5. Lava temperature measured at Ol Doinyo Lengai by a digital thermometer (TM 914C with a stab feeler, standard K-Type). The instrument was used in the 0-1200° Celsius mode. Calibration was made using the delta-T method, where temperature values are ± 6°C in the 0-750°C range associated with at least four replicate measurements at one spot. Courtesy of Christoph Weber.
| Date |
Location |
Temperature (°C) |
| 28 Aug 1999 |
T40 lava lake |
529 |
| 01 Sep 1999 |
Pahoehoe flow in a tube near T40 |
519 |
| 01 Sep 1999 |
Aa flow still in motion on flat terrain (60 cm thick) |
516 |
| 03 Oct 2000 |
Pahoehoe flow in a tube near T49B |
507 |
| 03 Oct 2000 |
Aa flow still in slow motion on flat terrain (25 cm thick) |
496 |
| 11 Feb 2004 |
Pahoehoe flow in a tube near T49G |
588 |
| 12 Feb 2004 |
Pahoehoe flow in a tube near T49B |
579 |
| 13 Feb 2004 |
Aa flow immobile and on flat terrain (15 cm thick) |
490 |
Table 6. Fumarole temperatures measured at cracks in the crater floor of Ol Doinyo Lengai, using the above-described digital thermometer. Courtesy of Christoph Weber.
| Date |
Location |
Temperature (°C) |
| 28 Aug 1999 |
F1 |
70 |
| 28 Aug 1999 |
Near T49 |
82 |
| 03 Oct 2000 |
Near T49C |
75 |
| 03 Oct 2000 |
F1 |
69 |
| 20 Oct 2002 |
The hottest cracks in the crater floor |
124 |
| 20 Oct 2002 |
F1 |
78 |
| 30 Jun 2003 |
F1 |
86 |
| 30 Jun 2003 |
Near T49C |
76 |
| 12 Feb 2004 |
F1 |
88 |
Summary of 2003 activity. During the first half of 2003, two new hornitos appeared in the center of the active crater at Ol Doinyo Lengai at the T49 and T58B (T48) locations (see figure 78 and caption). A huge lava pond appeared at these locations and caused several lava flows in all directions. According to Burra Gadiye, a local Lengai observer, by mid-June unusually dramatic activity started at both new hornitos. An expedition led by Frederick Belton in August 2003 reported that strong degassing and rhythmic explosive eruptions threw lapilli, ash, and lava spatter to 100 m above the hornito. Those eruptions, best described as Strombolian, continued until January 2004. They were accompanied by several lava flows and built up the comparatively tall strato-type hornitos at the T49-T56B locations and at the T48-T48B-T58B locations. The summit of T48B stood just above the former T44 hornito, but T44 itself was no longer visible.
Observations during February 2004. An expedition team including Christoph Weber and others visited Lengai for five days, 10-14 February 2004 (figures 79, 80, and 81). The team used GPS to conclude that the summit of the tallest hornito, located in the center area of the active crater at Ol Doinyo Lengai (T49 or T56B location), was at approximately 2,886 m elevation, standing about 33 m above the surrounding crater floor to the N. While this hornito was no longer active, T48B (T58B) contained a lava lake deep inside, which was clearly indicated by noise and tremor. Observers in February noted effusive and lava lake activity. This occurred at the old T49 eruption center, also indicated by the activity of T49B during observation and an active new vent (numbered T49G by Weber, figure 81) at the N flank of T49 (T56B), about half way up from its base to the N side.
This new activity probably caused two collapses (which left depressions) in the N flank of T49 (T56B), seen since January 2004. The T49G vent, located at the upper collapse, had a steady degassing lava lake with many overflows recorded during the February visit. Lava penetrated the lower collapse at T49 and lava flows reached as far as the NW overflow. On 12 and 13 February the T49B vent spattered lava for hours, feeding lava flows to the W (to the vicinity of T51), and finally escaping into a lava tube system. The lava temperature very close to the lava lake was measured at 588°C. Immobile aa lava flows on flat terrain were measured between 480°C and 500°C (table 5).
On 7 February team members Christoph Weber and R. Albiez were staying at the N slope of the neighboring Karimassi volcano and heard a paroxysm at T48B (T58B) lasting 30 seconds. During the visit on 10 February evidence of this paroxysm included fresh lava spatter and bombs cast around T58B for a radius of ~ 100 m.
Evacuation project at Ol Doinyo Lengai. Contributors to this report belong to a group committed to creating and funding evacuation plans. That group is called Volcano Hazards Documentation and Logistic Research (see Information Contacts). The group is working with the local Masaii and authorities on preparations in case of a dangerous eruption.
Geologic Background. The symmetrical Ol Doinyo Lengai is the only volcano known to have erupted carbonatite tephras and lavas in historical time. The prominent stratovolcano, known to the Maasai as "The Mountain of God," rises abruptly above the broad plain south of Lake Natron in the Gregory Rift Valley. The cone-building stage ended about 15,000 years ago and was followed by periodic ejection of natrocarbonatitic and nephelinite tephra during the Holocene. Historical eruptions have consisted of smaller tephra ejections and emission of numerous natrocarbonatitic lava flows on the floor of the summit crater and occasionally down the upper flanks. The depth and morphology of the northern crater have changed dramatically during the course of historical eruptions, ranging from steep crater walls about 200 m deep in the mid-20th century to shallow platforms mostly filling the crater. Long-term lava effusion in the summit crater beginning in 1983 had by the turn of the century mostly filled the northern crater; by late 1998 lava had begun overflowing the crater rim.
Information Contacts: Christoph Weber, Volcano Expeditions International, Muehlweg 11, 74199 Untergruppenbach, Germany (URL: http://www.v-e-i.de); Celia Nyamweru, Department of Anthropology, St. Lawrence University, Canton NY 13617 USA (URL: http://blogs.stlawu.edu/lengai/); Jurgis Klaudius, IMPG, Albert-Ludwig-University Freiburg, Albertstrasse 23b, 79104 Freiburg, Germany; Frederick Belton, 3555 Philsdale Ave., Memphis, TN 38111 USA (URL: http://oldoinyolengai.pbworks.com/); Volcano Hazards Documentation and Logistic Research, VHDL; Germany, Muehlweg 11, 74199 Untergruppenbach (URL: http://www.v-e-i.de/vhdl/).
Llaima
Chile
38.692°S, 71.729°W; summit elev. 3125 m
All times are local (unless otherwise noted)
Extreme glacial crevassing and melting; April 2003 ash emissions
During late 2002 and early 2003 Chilean scientists at Llaima documented increases in seismicity, fumarolic output, a minor eruption, and pronounced glacial disruption. For example, on 8 January 2003 they found that the ice and snow formerly capping the N and S craters had completely melted. Larger eruptions began in April 2003, depositing pyroclastic material, dispersing numerous ballistic blocks, and creating substantial plumes.
Although this report covers the time interval from January 2002 through most of April 2003, the concern then was that Llaima might erupt with the vigor seen in 1994 (BGVN 19:04 and 19:05). However, during the 2002-03 reporting interval eruptions remained comparatively modest.
Ice covered, passively degassing. On 26 September and 30 October 2002, scientists from Chile's Volcanic Risk Program and the Volcanologic Observatory of the South Andes (OVDAS) flew over Llaima in response to steady increases in seismicity and fumarolic activity since the end of June 2002. On the 26 September flight they viewed the summit with its N (main) crater, and Pichillaima, the smaller SE-flank cone and its crater. They found only a weak steam plume rising gently from the main crater and attaining little additional height. This was in contrast to typical previous behavior, which consisted of puffs that rose several hundred meters before dissipating.
The 26 September 2002 aerial observations found the internal walls of the main crater draped in ice and snow. Pichillaima lay beneath a cover of clean ice and snow, and its crater emitted only a small gas plume. The overall scene was of quiet, with minor degassing amid frigid conditions.
Views of the main crater rim on 30 October 2002 indicated minor ash on the snow, an irregular, figure-eight-shaped hole emitting gases, and a much larger and optically denser steam plume than on 26 September. Llaima's cover of ice and snow was more complete than noted in October 1998. Thus, by comparison, in late 2002 visible signs of thermal activity had diminished significantly. In contrast to what was typically seen, the crater's ice-covered internal walls lacked escaping gases. Except for seismicity, the ice-bound Llaima seemed stable.
Seismically restless. Despite the lack of visible volcanism or thermal activity, the seismicity in September 2002 was notably greater than in January 2002 (table 2). The frequency of tremor increased from 0.9 Hz in January 2002 (a typical value in times of relative quiet) to 1.2 Hz in September 2002. In describing April 2003 tremor amplitude the OVDAS reports stated that it was about "5-fold larger" than at base level.
Table 2. Seismic activity at Llaima summarized as RSAM (Real-time seismic amplitude) values and principal tremor frequencies. In times of relative quiet, baseline values at Llaima are ~ 20 RSAM units and 0.9 Hz. These data were taken from reports by OVDAS-SERNAGEOMIN (which omitted some time intervals).
| Date |
Seismicity (RSAM units) |
Tremor frequency (Hz) |
| Jan 2002 |
28 |
0.9 |
| Jun 2002 |
20 |
-- |
| Sep 2002 |
57 |
1.2 |
| Dec 2002 |
99 |
1.2 (during 18-20 Dec) |
| Mid-Jan 2003 |
93 |
-- |
| Late Jan 2003 |
60 |
-- |
| Apr 2003 |
92 |
1-2.2 |
| 18-19 Apr 2003 |
98 |
-- |
In September 2002, seismic instruments included two permanent stations (LLAI and MELI) located respectively on Llaima's S flank and S foot. In December 2002, there were two portable seismic receivers placed on the E flank at Lago Verde, which also recorded unrest. The seismicity continued to increase from December 2002 to mid-January 2003 (from ~70 to ~100 RSAM units). After that, it diminished and stabilized for about two months.
Sudden changes. A flight on 8 January 2003 led OVDAS to see remarkable changes since the late 2003 observations (figure 11). First, the dense fumarole emitted from the main crater was much stronger than the one seen 26 September 2002 (figure 11, top left). Second, the ice and snow had completely melted from main crater's internal walls. Third, complete melting of ice and snow had left exposed rock at both the summit and Pichillaima (figure 11, lower right). Fourth, numerous new crevasses had appeared in the cone's glaciers, particularly on the E flank. Down all flanks of the volcano, the 8 January observers saw ice falls, snow avalanches, ice detachments, and rockfalls.
Although the melting came at the time of the annual thaw, the situation on the volcano indicated that processes such as local heating accelerated the melting. Snow had fallen in early October 2002. The absence of ice and snow cover on both the shaded and unshaded sides of Llaima was cited as evidence indicating elevated rock temperature. Observers saw the melting and also noted a halt to any new accumulation of ice and snow deposits. The melting was attributed to magma at depth in the conduit, and considerable heat emerging at the locations where the ice melted.
The report issued 20 January 2003 noted that field work on Llaima's W side (Cherquenco-El Salto) had disclosed deep new crevasses in the glacial ice reaching 1.5 km long. These were affiliated with avalanching from near the main cone's summit to the cone's NW foot (~ 3 km long by 0.5 km wide). Observers also noticed continued signs of thawing, including the appearance of small fumaroles, which they again attributed to the volcano warming.
The next available reports, from the period 9-11 April, came from eye-witnesses. Rodrigo Marín of Conguillío national park, noted "an increase of fumarole activity in the main crater between 9 and 10 April, which was accompanied by ash emission." In addition, from the N slope (Captrén) people heard underground noises.
At 1330 on 10 April a teacher at Los Andes de Melipeuco elementary school noted three ash explosions that reached ~ 500 m above the main crater and dispersed NE. Several others observers noted ash-bearing emissions from the main crater, including one at 1340 and another at 1350. A park ranger noted that around 2100-2200 on 10 April strong and continuous explosions awoke him and ash began to fall on him in the N-slope sector of Captrén. Later, the explosions became more sporadic, and he heard sounds similar to those made by the motion of heavy machinery. This continued into the early morning of 11 April.
The director of the above-mentioned school reported to OVDAS that on 11 April at 0915 he saw "...continuing ash emission from the main crater." Finally, at 1100 on 11 April, OVDAS observatory (Cerro ñielol-Temuco) staff observed a vertical column, mainly of volcanic gases, which rose to about 600-700 m above the crater rim. This fed a large, horizontal, lenticular cloud ~ 30 km in diameter, the top of which rose to about 3,900 m altitude.
An 11 April helicopter flight disclosed a thin layer of pyroclastic material spread widely across the glaciers on the NE, E, SE, and SW flanks, visible out to distances of ~ 4 km. Impact craters in the ice testified to numerous bouncing and rolling projectiles. Scientists on that flight noted vigorous fumarolic activity and dense clouds with colors and odors indicating the presence of SO2 and HCl. At multiple spots, small fumaroles had sprouted from the crater walls. The crater floor contained a 50-m-diameter vent emitting gases, but no lava flows had emerged. Although the 9-11-April eruptions were modest, they prompted Llaima's hazard status to rise from Green to Yellow.
Figure 12 portrays further melting and exposure of underlying rock at both the summit (top) and Pichillaima (bottom) on 11 April. When photographed, the ice and snow at Pichillaima had receded by 1.0-1.5 km from its topographic high. Ice margins appeared sub-vertical and engulfed circular melt areas.
Other amazing photos taken 11 April 2003 revealed dramatic changes in glaciers and snow fields (figure 13). Many regions of the ice appeared to be in motion and undergoing acute mechanical failure. Numerous profound crevasses had emerged, including sets of broadly transverse, arcuate crevasses trending from glacial margins and extending well into their axial areas.
On 12-13 April 2003 the main crater issued intense pulsing fumarolic degassing at 1- to 3-minute intervals. Odors and celeste color were again indicative of SO2 and HCl components; such emissions were noted until 1500 on 13 April. Other processes on those days included mass wasting, sometimes with associated dust, apparent vibrations at the summit, and ballistic discharges from the main crater. At 1310 on 13 April, expulsions intensified and occurred at 1 minute intervals. Plumes blew E.
Continued observations resulted in the recommendation to maintain the Yellow status at least through 16 April as eruptions began to contain significant tephra. Volcanologists expressed concern that the volcano's glacial ice-cover could undergo further melting, which might lead to large and sudden outbursts of water (glacier bursts) traveling down local drainages.
On 16 April at 1453 OVDAS personnel in the Lago Verde area confirmed gaseous emissions were continuing to escape from the crater. They reported that at 1535 these emissions intensified and reached 200 m above the crater rim, with the plume blowing SE and being visible for ~ 8 km. They noted that at 1537 gaseous emissions escaped at Pichillaima. On the N (Captrén) side of the mountain at 1704 the observers saw gray-colored fumaroles. During 1130-1355 on 17 April from a point near the Lago Verde they perceived SO2 and HCl; they witnessed gas emissions to the NE reaching 200 m above the crater rim and spawning a plume visible for ~ 10 km.
The 20 and 23 April 2003 OVDAS reports discussed poor visibility but the permanent stations indicated high-amplitude tremor and considerable seismicity (eg., 98 RSAM units on 18 and 19 April). OVDAS staff interpreted these signals as due to fluids and gases moving in internal conduits. They also pointed out the absence of high- and low-frequency earthquake swarms, signals that generally precede emissions of ash. Small swarms of long-period earthquakes began, however, on 25 April.
Ascent during mid-April 2003. In mid-April 2003 Klaus Bataille (a physicist and seismologist teaching geophysics at the University of Concepción) and his students conducted field work on Llaima. Amid an interval of seismic and volcanic quiet on 18 April they ascended into the region of ice melt near the summit region, and made direct observations relevant to the issue of heat transport. Bataille made the following comments.
"A week after the explosion announced by the OVDAS, we (8 students and myself) went to install two broadband seismic stations to study the evolution of its activity, and we installed a GPS receiver as well. When we finished with the installation, it was a clear day and we decided to climb as much as we could. We began early in the morning [of 18 April] . . . [and] could see from the distance fumaroles coming from the crater, and several vents with vapor and gases coming out from different places, some 200-300 m below the crater, towards the N. We did not find any impediment to continue climbing, neither physical difficulties nor anomalous activity from the crater. Thus the whole group continued up to 300 m below the crater, where four persons stayed due to physical conditions, and five continued up to the crater. The persons who stayed (me included) realized that there was an incredible warm feeling while laying on the ground. This was due to the amount of vapor with some faint smell of sulphur. We could even take off our jackets and shirts, as long as we were laying flat. After lying for a while it was even too hot to [continue]. Fantastic feeling, lying almost on top of the volcano, with a tremendous view, feeling the warmth through the rocks."
Thus, on 18 April, Bataille and students affirmed the previously stated idea of heat emerging to cause the melting and leading to the sudden emergence of crevasses observed since December 2002. A later clarification from Bataille on the mode of heat transfer (viz., "conductive heating," passed through the rocks; or "convective heating," transported by warmed fluids such as gases) resulted in this statement: "I'm not convinced of 'conductive heating' as a direct source for the ice melting, because of the large amount of gases through the system. I'm inclined instead, to believe that melting of the ice is simply due to the large amount of vapor flowing through the loose rocks. However, I agree that [these] gases have to be produced while in contact with hot material, and in this sense [could] be affected by 'conductive heating.'"
Thus, Bataille observed that the rocks in the ice-melt zone around the summit were warm to the touch. He concluded that they were heated by deeper sources and water vapor transported the heat to the surface.
The scientists discussed their results in a subsequent conference paper (Bataille and others, 2003) and on their website, highlighting the seismic and GPS stations installed on Llaima's W and N sides. The former seismic station, near the Refuge Tucapel, began operating on 17-18 April. The latter seismic station, near Captrén, began operating on 19-20 April.
Their recordings lacked earthquakes that could be linked to deeper sources (no fractures nor seismo-tectonic events) during the period between April and the following 4 months. The whole period was dominated by a sequence of tremors due to the activity associated with the crater. Tremor energy decayed gradually in time. The frequencies involved were generally stable, though peculiar and without a good model for their genesis.
Reference. Bataille, K., Hermosilla, G., and Mora, D., 2003, (title translated from Spanish) Seismic activity of Llaima volcano: Dominated by phreatomagmatic sources?, 10th Chilean Geological Congress (10° Congreso Geológico), session 5, paper 63, (October 2003, Universidad de Concepción) (also cited in Revista geológica de Chile; ISSN 0716-0208)
Geologic Background. Llaima, one of Chile's largest and most active volcanoes, contains two main historically active craters, one at the summit and the other, Pichillaima, to the SE. The massive, dominantly basaltic-to-andesitic, stratovolcano has a volume of 400 km3. A Holocene edifice built primarily of accumulated lava flows was constructed over an 8-km-wide caldera that formed about 13,200 years ago, following the eruption of the 24 km3 Curacautín Ignimbrite. More than 40 scoria cones dot the volcano's flanks. Following the end of an explosive stage about 7200 years ago, construction of the present edifice began, characterized by Strombolian, Hawaiian, and infrequent subplinian eruptions. Frequent moderate explosive eruptions with occasional lava flows have been recorded since the 17th century.
Information Contacts: Hugo Alberto Moreno Roa, Gustavo Alejandro Fuentealba Cifuentes, Paola Andrea Peña Salazar, Erwin Edinson Medel Segura, Pedro Jorge Ortiz Hernandez, Beatriz Eliana Alarcón Avedaño, Chile Observatorio Volcanológico de los Andes del Sur-Servivio Nacional de Geologia y Mineria (Chile Volcanologic Observatory of the South Andes—National Service of Geology and Mining) (OVDAS-SERNAGEOMIN), Manantial 1710-Carmino del Alba, Temuco, Chile (URL: http://www.sernageomin.cl/); Servicio Nacional de Geología e Minería (SERNAGEOMIN), Av. Santa María 0104, Casilla 10465, Santiago, Chile (URL: http://www.sernageomin.cl/); Klaus Bataille, Departamento Ciencias de la Tierra, Universidad de Concepción, Víctor Lamas 1290, Casilla 160-C, Concepción, Chile (URL: http://www3.udec.cl/geologia/).
Manam (Papua New Guinea) — February 2004 Cite this Report
Manam
Papua New Guinea
4.08°S, 145.037°E; summit elev. 1807 m
All times are local (unless otherwise noted)
One minor eruption but otherwise low activity during February 2004
Activity at Manam's two summit craters remained low during February 2004. The summit area was cloud covered most of the month; however, when clear, both craters were observed releasing white vapor at weak to moderate rates. A single explosion occurred during the month, on 14 February at Southern Crater. A thick dark gray ash cloud and weak roaring noises accompanied the explosion. The ash cloud rose several hundred meters above the summit before drifting NW of the island, resulting in fine ashfall downwind. There was no nighttime glow observed.
Geologic Background. The 10-km-wide island of Manam, lying 13 km off the northern coast of mainland Papua New Guinea, is one of the country's most active volcanoes. Four large radial valleys extend from the unvegetated summit of the conical basaltic-andesitic stratovolcano to its lower flanks. These valleys channel lava flows and pyroclastic avalanches that have sometimes reached the coast. Five small satellitic centers are located near the island's shoreline on the northern, southern, and western sides. Two summit craters are present; both are active, although most observed eruptions have originated from the southern crater, concentrating eruptive products during much of the past century into the SE valley. Frequent eruptions, typically of mild-to-moderate scale, have been recorded since 1616. Occasional larger eruptions have produced pyroclastic flows and lava flows that reached flat-lying coastal areas and entered the sea, sometimes impacting populated areas.
Information Contacts: Rabaul Volcano Observatory (RVO), P.O. Box 386, Rabaul, Papua New Guinea.
Rabaul (Papua New Guinea) — February 2004 Cite this Report
Rabaul
Papua New Guinea
4.2459°S, 152.1937°E; summit elev. 688 m
All times are local (unless otherwise noted)
1-17 February 2004-ash falls 30 km to the E
The eruptive activity at Tavurvur that began in early October 2002 ceased on 17 February 2004. From 1-17 February the activity was characterized by emissions of light to pale ash clouds accompanied by occasional moderate explosions that produced thick ash plumes. The ash plumes rose 1000-2000 m above the summit before being blown to the E and NE resulting in ashfall in the Duke of York islands, ~ 30 km E of Rabaul.
A slight change in wind direction resulted in fine ashfall over Rabaul Town and villages downwind on 6 and 13-15 February. Occasional weak roaring noises accompanied some of the explosions on 5 and 11 February. From 18 February until the month's end, Tavurvur was only releasing weak white vapor, with occasional blue vapor.
Seismic activity between 1 and 17 February reflected the ash emissions at the summit. One high frequency event occurred on 5 February, located NE of the caldera. Ground deformation indicated a deflationary trend. The real-time GPS and electronic tilt site on Matupit Island, in the center of the caldera, showed a deflationary trend since the middle of the month.
Geologic Background. The low-lying Rabaul caldera on the tip of the Gazelle Peninsula at the NE end of New Britain forms a broad sheltered harbor utilized by what was the island's largest city prior to a major eruption in 1994. The outer flanks of the asymmetrical shield volcano are formed by thick pyroclastic-flow deposits. The 8 x 14 km caldera is widely breached on the east, where its floor is flooded by Blanche Bay and was formed about 1,400 years ago. An earlier caldera-forming eruption about 7,100 years ago is thought to have originated from Tavui caldera, offshore to the north. Three small stratovolcanoes lie outside the N and NE caldera rims. Post-caldera eruptions built basaltic-to-dacitic pyroclastic cones on the caldera floor near the NE and W caldera walls. Several of these, including Vulcan cone, which was formed during a large eruption in 1878, have produced major explosive activity during historical time. A powerful explosive eruption in 1994 occurred simultaneously from Vulcan and Tavurvur volcanoes and forced the temporary abandonment of Rabaul city.
Information Contacts: Ima Itikarai, Rabaul Volcano Observatory (RVO), P.O. Box 386, Rabaul, Papua New Guinea.
Ruang (Indonesia) — February 2004 Cite this Report
Ruang
Indonesia
2.3058°N, 125.3671°E; summit elev. 703 m
All times are local (unless otherwise noted)
Eruption on 25 September 2002 is the largest in Indonesia in many years
The 25 September 2002 eruption of Ruang (BGVN 27:10 and 28:08) was, according to the Darwin Volcanic Ash Advisory Center (VAAC), the largest in Indonesia for many years and was well observed by satellite sensors. The eruption cloud reached a height of ~ 20 km, and a pyroclastic flow toward the SE damaged an area 1.6 km². Although no village was hit by the pyroclastic flow, two were heavily damaged by very thick ash material.
The Darwin VAAC and Bureau of Meteorology have published images and animations of the eruption clouds (figure 2). The satellites and images included those from Aqua/MODIS, GMS Java Animation, and AVHRR sensors. Some ash clouds dispersed towards Singapore and Jakarta. A higher level cloud remained nearly stationary near the tropopause (the top of the troposphere, where most of the Earth's weather occurs). The highest cloud moved eastwards in the stratosphere. The color/shading reflects the strength of the detected ash signal.
The TOMS scientists published an image on their website (figure 3), described as follows: "The TOMS overpass on September 25 was too early to capture the fresh eruption cloud, but ash and SO2 were evident on the following day. The aerosol signal over S Borneo is at least partly due to smoke from biomass burning; the ash cloud from Ruang can be seen over NE Borneo. A data gap may be obscuring any SO2 or ash immediately W of Ruang."
Geologic Background. Ruang volcano is the southernmost volcano in the Sangihe Island arc, north of Sulawesi Island; it is not the better known Raung volcano on Java. The 4 x 5 km island volcano is across a narrow strait SW of the larger Tagulandang Island. The summit contains a crater partially filled by a lava dome initially emplaced in 1904. Explosive eruptions recorded since 1808 have often been accompanied by lava dome formation and pyroclastic flows that have damaged inhabited areas.
Information Contacts: Darwin Volcanic Ash Advisory Center (VAAC), Commonwealth Bureau of Meteorology, Northern Territory Regional Office, PO Box 40050, Casuarina, NT 0811, Australia (URL: http://www.bom.gov.au/info/vaac/); Nia Haerani, Directorate of Volcanology and Geological Hazards (formerly VSI), Jalan Diponegoro No 57, Bandung 40122, Indonesia (URL: http://www.vsi.esdm.go.id/); Simon A. Carn and Arlin Krueger, Joint Center for Earth Systems Technology (NASA/UMBC), University of Maryland, Baltimore County, 1000 Hilltop Circle, Baltimore, MD 21250, USA (URL: https://so2.gsfc.nasa.gov/).
Ruapehu (New Zealand) — February 2004 Cite this Report
Ruapehu
New Zealand
39.28°S, 175.57°E; summit elev. 2797 m
All times are local (unless otherwise noted)
Strategy, prediction, and management of crater-lake overflow and powerful lahar
Citing risks about a lahar expected when an ash dam surrounding Ruapehu's crater collapses, the New Zealand government decided that draining, sluicing, or siphoning the volcano's crater lake to reduce the danger was too hazardous, reported Jo-Marie Brown in The New Zealand Times (10, 17, and 19 March 2004). The articles noted that, instead, the government decided to bolster extensive safety measures already in place around the volcano, including improving alarm systems. These new measures should provide warnings of lahar occurrences at least an hour and a half in advance. The government also elected to strengthen bridges and build an embankment to withstand lahars.
The New Zealand Department of Conservation has an extensive outreach to discuss the crater lake-lahar problem (figure 26). They point out that the crater lake on Mt. Ruapehu was refilling after it was emptied by eruptions in 1995 and 1996. This lake lies over the main active vent of the volcano. Before the eruptions, the level of the crater lake was controlled by an outlet that drained water across a sill of lava into the head of the Whangaehu Valley. During the 1995-96 eruptions, this outlet was blocked by 7 m of tephra (fine ash particles and other larger materials ejected by the volcano).
The Department also noted that since March 1999, the crater lake had risen 52 m and was filling at a rate of 5,300 m3 per day. On 15 March 2004 the lake's surface elevation was reported at 2,527.6 m above sea level. In mid-March 2004 the Department also reported that the lake was then ~ 96% full, a point ~ 2 m below the base of the tephra dam emplaced by the 1995-6 eruptions (the old overflow point). The predicted time for the lake to completely fill was given as early April 2004 to November 2004. An estimated 60 lahars have swept down the mountain's southern side through the Whangaehu Valley in the past 150 years. A lahar in 1953 killed 151 people at Tangiwai. The Department of Conservation reported additional details regarding the crater lake: there was low to normal hydrothermal activity; the water temperature on 15 March 2004 was 35°C; and the lake color was gray.
Geologic Background. Ruapehu, one of New Zealand's most active volcanoes, is a complex stratovolcano constructed during at least four cone-building episodes dating back to about 200,000 years ago. The dominantly andesitic 110 km3 volcanic massif is elongated in a NNE-SSW direction and surrounded by another 100 km3 ring plain of volcaniclastic debris, including the NW-flank Murimoto debris-avalanche deposit. A series of subplinian eruptions took place between about 22,600 and 10,000 years ago, but pyroclastic flows have been infrequent. The broad summait area and flank contain at least six vents active during the Holocene. Frequent mild-to-moderate explosive eruptions have been recorded from the Te Wai a-Moe (Crater Lake) vent, and tephra characteristics suggest that the crater lake may have formed as recently as 3,000 years ago. Lahars resulting from phreatic eruptions at the summit crater lake are a hazard to a ski area on the upper flanks and lower river valleys.
Information Contacts: The New Zealand Herald, PO Box 32, Auckland, New Zealand (URL: http://www.nzherald.co.nz/); New Zealand Department of Conservation, Private Bag, Turangi, New Zealand (URL: http://www.doc.govt.nz/); Institute of Geological & Nuclear Sciences (IGNS), Private Bag 2000, Wairakei, New Zealand (URL: http://www.gns/cri.nz/).
Soufriere Hills (United Kingdom) — February 2004 Cite this Report
Soufriere Hills
United Kingdom
16.72°N, 62.18°W; summit elev. 915 m
All times are local (unless otherwise noted)
Ash to 7 km altitude on 3 March 2004; pyroclastic flows reached the sea
The Soufrière Hills volcano was quiet for the last few months of 2003, following activity in May and July that included significant dome growth (BGVN 28:10 and 28:12). Light ash-venting had last occurred during a period of low-amplitude tremor 3-8 October. A seismic event in mid-January 2004 and a period of tremor and mudflow activity in late February 2004 were followed by renewed eruptive activity on 3 March 2004.
Between 1 October and 18 December 2003 no dome growth was observed, and only a few earthquakes per week were recorded. Beginning 18 December 2003, SO2 emissions increased markedly from the previous month's average of 500 tons/day (t/d), reaching 3,600 t/d (see table 53). On 18 January 2004, a swarm of low-amplitude long-period (LP) earthquakes began, with ~1,000 separate events over an interval of 36 hours. Fewer than 40 of these earthquakes triggered the automatic seismic-detection systems. Another swarm occurred on 30 January, this time lasting about 30 hours. Again, instruments recorded ~1,000 separate events; these, however, were much weaker and only four triggered the detection systems.
Table 53. Summary of SO2 emissions recorded at Soufrière Hills, 5 December 2003 to 12 March 2004, using an array of three scanning UV spectrometers. Courtesy of Montserrat Volcano Observatory.
| Date |
SO2 emissions (metric tons/day) |
| 05 Dec-11 Dec 2003 |
300-900 |
| 12 Dec-18 Dec 2003 |
500-3,600 |
| 19 Dec-25 Dec 2003 |
-- |
| 26 Dec-01 Jan 2004 |
500 |
| 02 Jan-08 Jan 2004 |
300 |
| 09 Jan-15 Jan 2004 |
200-590 |
| 16 Jan-22 Jan 2004 |
440 on 22 January (equipment servicing on other days) |
| 23 Jan-29 Jan 2004 |
500-700 |
| 30 Jan-05 Feb 2004 |
439-1017 |
| 06 Feb-12 Feb 2004 |
350-450 |
| 13 Feb-19 Feb 2004 |
350-650 |
| 20 Feb-26 Feb 2004 |
496-920 |
| 27 Feb-04 Mar 2004 |
480-820 |
| 05 Mar-12 Mar 2004 |
340-1250 |
A period of low-level tremor, consisting of many small LP earthquakes, lasted for about 36 hours beginning 21 February. On 24 February heavy rainfall (10 mm in 2.5 hours) resulted in mudflow activity in the Belham valley; signs of mudflows were also observed in Plymouth.
Beginning the week of 27 February, activity increased significantly. On 2 March, a period of low-level tremor included some small hybrid earthquakes. The tremor continued until afternoon on 3 March, when, at around 1444, seismicity greatly increased and an explosion and collapse event occurred. According to reports from the Montserrat Volcano Observatory (MVO) this was the most significant event since the collapse event of 12-13 July 2003.
The event on 3 March 2004 produced ash clouds that reached altitudes of about 7 km above sea level, and pyroclastic flows were observed in the Tar River, with at least two incidents of flows reaching the sea. Seismicity returned to close to background levels by 1525, but vigorous ash venting continued until the following morning. Low-level tremor accompanied by hybrid earthquakes continued for the next 18 hours, including a series of hybrid earthquakes during the evening of 3 March.
Visual observations first suggested that the 3 March explosion removed the small dome that had grown in the collapse scar in late July 2003. Photographs taken on 28 February and 5 March showed the 3 March collapse to have also removed part of the NW dome remnant originally built up during 1995-1998.
After 3 March, activity remained elevated for several days. A period of low-level tremor occurred on 4 March, beginning at around 1300 and lasting three hours. On 5 March a small explosion was recorded at 1009, followed by a period of ash venting. Between 5 and 12 March activity returned to lower levels, with 1 LP and 15 hybrid earthquakes recorded. On 10 March, however, there was a short (10-20 minutes) period of elevated seismicity early in the morning; later in the day fresh pyroclastic-flow deposits were observed in the upper reaches of the Tar River Valley. During the second half of the week, short episodes of ash and steam venting were periodically observed, and ash fallout occurred as far N as St. Georges Hill.
On 15 March, the Washington VAAC reported a plume of ash extending to the W from the summit. The following day MVO reported a plume extending 250 km (135 nautical miles) W of the volcano. SO2 emissions fluctuated during February and the first two weeks of March, peaking at 1017 t/d on 1 February and 1250 t/d on 9 March (table 2).
A beautifully illustrated look at the eruption from 1995 to present is now available (Kokelaar, 2002; Druitt and Kokellar, 2002).
References. Kokelaar, B.P., 2002, Setting, chronology and consequences of the eruption of Soufrière Hills Volcano, Montserrat (1995-1999), in Druitt, T.H. and Kokelaar, B.P., eds., 2002: The eruption of the Soufrière Hills Volcano, Montserrat from 1995 to 1999. Geological Society London, Memoir No. 21, p. 1-43.
Druitt, T.H. and Kokelaar, B.P., eds., 2002: The eruption of the Soufrière Hills Volcano, Montserrat from 1995 to 1999. Geological Society London.
Geologic Background. The complex, dominantly andesitic Soufrière Hills volcano occupies the southern half of the island of Montserrat. The summit area consists primarily of a series of lava domes emplaced along an ESE-trending zone. The volcano is flanked by Pleistocene complexes to the north and south. English's Crater, a 1-km-wide crater breached widely to the east by edifice collapse, was formed about 2000 years ago as a result of the youngest of several collapse events producing submarine debris-avalanche deposits. Block-and-ash flow and surge deposits associated with dome growth predominate in flank deposits, including those from an eruption that likely preceded the 1632 CE settlement of the island, allowing cultivation on recently devegetated land to near the summit. Non-eruptive seismic swarms occurred at 30-year intervals in the 20th century, but no historical eruptions were recorded until 1995. Long-term small-to-moderate ash eruptions beginning in that year were later accompanied by lava-dome growth and pyroclastic flows that forced evacuation of the southern half of the island and ultimately destroyed the capital city of Plymouth, causing major social and economic disruption.
Information Contacts: Montserrat Volcano Observatory (MVO), Fleming, Montserrat, West Indies (URL: http://www.mvo.ms/); Washington Volcanic Ash Advisory Center (VAAC), Satellite Analysis Branch (SAB), NOAA/NESDIS E/SP23, NOAA Science Center Room 401, 5200 Auth Rd, Camp Springs, MD 20746, USA (URL: http://www.ssd.noaa.gov).
Stromboli (Italy) — February 2004 Cite this Report
Stromboli
Italy
38.789°N, 15.213°E; summit elev. 924 m
All times are local (unless otherwise noted)
After 10 February 2004, explosions at upper limit of that typically seen
According to aviation reports from the U.S. Air Force, the web camera at Stromboli captured shots of light ash emissions on 7 and 11 November 2003. In both cases plumes rose to ~ 2.5 km elevation. The Stromboli Web video camera showed a small explosion on 10 December 2003 that produced a plume to a height of ~ 1 km above the volcano. No ash was visible on satellite imagery.
The Istituto Nazionale di Geofisica e Vulcanologia (INGV) in Catania reported that explosive activity at Stromboli's three summit craters increased after 10 February 2004, leading to significant growth of the cinder cones inside the craters. Several powerful explosions, especially from Crater 1 (the NE crater) and Crater 3 (the SW crater), sent scoriae 200 m above the rims. These powerful explosions led to fallout of fresh bombs and lapilli on Il Pizzo Sopra la Fossa (an area atop the volcano about 100 m above the crater terrace) in early March. As of 8 March, Strombolian activity was occurring at the volcano, with variations in the number and frequency of explosions within normally observed limits, and the intensity of explosions at the higher limit of commonly observed activity.
Geologic Background. Spectacular incandescent nighttime explosions at Stromboli have long attracted visitors to the "Lighthouse of the Mediterranean" in the NE Aeolian Islands. This volcano has lent its name to the frequent mild explosive activity that has characterized its eruptions throughout much of historical time. The small island is the emergent summit of a volcano that grew in two main eruptive cycles, the last of which formed the western portion of the island. The Neostromboli eruptive period took place between about 13,000 and 5,000 years ago. The active summit vents are located at the head of the Sciara del Fuoco, a prominent scarp that formed about 5,000 years ago due to a series of slope failures which extends to below sea level. The modern volcano has been constructed within this scarp, which funnels pyroclastic ejecta and lava flows to the NW. Essentially continuous mild Strombolian explosions, sometimes accompanied by lava flows, have been recorded for more than a millennium.
Information Contacts: Istituto Nazionale di Geofisica e Vulcanologia (INGV), Sezione di Catania Piazza Roma 2, 95123 Catania, Italy (URL: http://www.ct.ingv.it/); Toulouse VAAC, Météo-France, 42 Avenue G. Coriolis, 31057 Toulouse, France (URL: http://www.meteo.fr/vaac/); AGI Online news service, Italy (URL: http://www.agi.it/).
Ulawun (Papua New Guinea) — February 2004 Cite this Report
Ulawun
Papua New Guinea
5.05°S, 151.33°E; summit elev. 2334 m
All times are local (unless otherwise noted)
Tabulation of aviation reports issued during 2000-mid-2003
Activity on Ulawun occurs frequently and is monitored and reported from several sources including the Rabaul Volcano Observatory (RVO), the Darwin Volcanic Ash Advisory Center (VAAC), the U.S. Air Force Weather Agency (AFWA), and imagery from several satellites including NOAA GMS (daylight) and MODIS (infrared). The continuing activity after an eruption on 28 September 2000 (see BGVN 25:08) resulted in BGVN reports every few months since that event (BGVN reports on Ulawun have appeared in nine subsequent issues through the end of 2003).
This issue supplements the Bulletin reports with those from the Darwin VAAC archives (table 2), which included information provided from ground, airborne, and space-based sensing. RVO reports that Ulawun remained quiet during February 2004. Emissions from the main vent consisted of white vapor being released at weak to moderate rates. No noise or night-time glow were reported during the month. No emission was reported from the two N-valley vents. Seismicity was at a low level.
Table 2. Dates of issue and the principal comments in Darwin VAAC reports concerning Ulawun, September 2000-July 2003. Similar or duplicate messages are not shown. In many cases ash cloud trajectory information has been omitted. On this table, the distance unit Nautical Miles (NM) has not been converted to kilometers (1 NM = 1.852 km (exactly)). Courtesy of the Darwin VAAC.
| Date |
Source |
Eruption Details / Ash Cloud |
| 28 Sep 2000 |
AIREP, AIR NIUGINI, ANK. |
Volcanic Activity reported at 28/2005Z - Ash plume to 11 km, rapid growth at top, spreading out 30 NM to N to SW. ASH CLOUD: Latest satellite imagery shows possible ash cloud extending 60 NM in an arc from ENE to the WSW. |
| 29 Sep 2000 |
AIREP, AIR NIUGINI, ANK. |
There is evidence of volcanic ash on satellite imagery from 28/1800Z |
| 30 Sep 2000 |
AIREP/Geological Survey Papua New Guinea. |
The Geological Survey confirms this eruption and notes that limited evacuations have commenced with the prospect of further seismic and eruptive activity. However 29/2230Z ash emissions were limited to infrequent puffs. |
| 01 Oct 2000 |
AIREP/Geological Survey Papua New Guinea. |
A Geological Survey report (at 01/0001Z) noted the summit activity was relatively quiet for last 24 hours. QANTAS AIREP at 30/0501Z also observed the lack of activity. |
| 29 Apr 2001 |
AIREP from PNG at 292130Z. |
Aircraft observed smoke cloud up to 9 km and drifting NW and SW direction out to 50/70 miles radius. ASH CLOUD: Satellite imagery [29/2132Z] shows possible volcanic plume extending 65 NM to the W and 30 NM to the N and S. |
| 30 Apr 2001 |
-- |
Examination of latest satellite imagery [30/0530Z] indicates significant eruption has ceased. Ash plume may reach 14 km. |
| 01 May 2001 |
Visual and infra-red GMS and NOAA satellite imagery, RVO. |
RVO advise remains on a high alert level with further eruptions possible. ASH CLOUD: There is no evidence of ash cloud at this time, but widespread cloud in the area is making detection difficult. |
| 03 May 2001 |
AIREP from PNG 29/4/2001 2130Z. Visual and infra-red GMS and NOAA satellite imagery, RVO. |
A report by an aircraft of volcanic activity [on 29 April] at about 2130Z with smoke/ash cloud up to 9 km, and confirmed by the RVO and satellites surveillance, initiated a series of Volcanic Advisories. The latest report from RVO this morning states that activity has moderated. ASH CLOUD: Satellite surveillance has not identified any ash cloud since the initial eruption. |
| 28 Aug 2001 |
GMS/NOAA Satellite Imagery. |
Ash observed on satellite imagery. Analysis indicates eruption is low level. ASH CLOUD: Ash plume 5 NM wide, extending 15 miles to the S of the summit. Ash expected to be below 4 km. |
| 12 Sep 2002 |
NOAA/GMS satellite imagery. |
Small low level plume detected on visible satellite imagery at 11/2100Z. Plume extended 60 NM from summit in the sector NNW to NNE. |
| 18 Sep 2002 |
GMS satellite imagery. |
Low level plume detected on visible satellite imagery at 18/2100Z. ASH CLOUD: Very thin plume extends 40 NM to the WSW |
| 19 Sep 2002 |
GMS satellite imagery. |
Plume can no longer be detected on latest GMS imagery. |
| 27 Sep 2002 |
GMS satellite imagery. |
Ash plume observed on satellite imagery [27/]2030Z. ASH CLOUD: Narrow ash cloud extends 40 NM to SW |
| 28 Sep 2002 |
GMS satellite imagery. |
Ash plume observed on satellite imagery 2130Z. ASH CLOUD: Narrow ash cloud extends 20 NM to the NNW. |
| 15 Oct 2002 |
GMS satellite imagery. |
Low level ash plume observed on satellite imagery 15/2225Z. ASH CLOUD: Ash plume extends 20 NM N of volcano. Winds indicate plume probably low level. |
| 21 Oct 2002 |
AIREP PZ-ANF, GMS imagery. |
Smoke reported in area, and plume observed via GMS imagery. ASH CLOUD: Cloud up to 4 km, extending 5 NM, 30 NM wide to SE. |
| 01 Nov 2002 |
AIREP. |
Smoke observed 01/0042Z drifting to NW of volcano at 3 km. |
| 02 Nov 2002 |
AIREP AIR NIUGINI. |
Ash observed 02/2030Z drifting to ESE of volcano to 3 km. |
| 11 Apr 2003 |
NOAA and GMS imagery. |
Plume evident on 10/2019Z and 11/0357Z NOAA image[s], height estimated below 3 km. |
| 14 Apr 2003 |
GMS imagery. |
Possible plume evident on 13/2032Z, 13/2132Z and 13/2225Z [images], height estimated below 3 km |
| 26 Apr 2003 |
GMS imagery. |
Possible plume evident on 26/0325Z MODIS as reported by KGWC/ Washington VAAC, height estimated below 4 km. |
| 30 Apr 2003 |
GMS and MODIS imagery. |
Possible narrow low level plume evident on 30/0010Z MODIS and 30/0230Z GMS visible image[s], extending 30 NM WNW, height estimated below 3 km. |
| 03 May 2003 |
KGWC. |
Ash/steam plume observed on 02/2026Z F13 DMSP Imagery. Plume extends 80 NM W of volcano, height to 4 km. |
| 04 May 2003 |
NOAA satellite imagery. |
Thin low level plume observed on 04/2053Z. Plume extends 10 NM SW of Ulawun, height estimated at 4 km. |
| 06 May 2003 |
GMS satellite imagery. |
Thin low level plume observed on 06/2032Z. |
| 01 Jun 2003 |
GOES9 satellite imagery. |
Thin low level plume observed on [May] 31/2325Z. |
| 18 Jun 2003 |
AFWA. |
Faint ash/steam plume seen on 18/2206Z satellite imagery. |
| 20 Jun 2003 |
NOAA 17. |
Faint plume seen on NOAA 17 20/0004Z satellite imagery. |
| 20 Jun 2003 |
NOAA 15. |
Faint plume seen 20/2050Z. |
| 23 Jun 2003 |
NOAA 15. |
Faint plume seen on 23/2120Z. |
| 24 Jun 2003 |
NOAA 15. |
Faint plume seen on 24/2057Z. |
| 26 Jun 2003 |
MODIS. |
Faint plume seen on 26/0005Z extending 25 NM SW, height estimated at 4 km. |
| 28 Jun 2003 |
NOAA 15. |
Faint plume seen on 28/2101Z. |
| 02 Jul 2003 |
NOAA 15. |
Thin ash plume to 5 km extending 25 NM WSW of summit on 02/2108Z. |
| 13 Jul 2003 |
AFWA. |
Thin ash plume to 4 km moving to the W at 10 knots [10 NM/hour or 18 km/hour]. |
| 22 Jul 2003 |
GOES9. |
Possible ash plume seen on 22/0130Z visible GOES imagery, extending 30 NM to NW, height estimated at 3 km. |
The VAAC reports contain numerous abbreviations; however, a few of the terms here are in widespread use referring to satellites, meteorology, and various related agencies (NOAA, AFWA, GOES9, MODIS, and KGWC . . . DMSP Imagery, etc.) or AIREP (atmospheric conditions reported from aircraft). "RVO" stands for Rabaul Volcano Observatory. Other terms may be less familiar: "AIR NIUGINI, ANK." refers to a commuter plane in the fleet of the national airline based in Papua New Guinea. The stated dates and times are not local ones, but instead refer to those at the zero (prime) meridian. For example, 04/2240Z means the fourth day of the stated month at 2240 UTC (i.e. "Z," spoken as Zulu, is shorthand for Coordinated Universal Time (UTC).
Geologic Background. The symmetrical basaltic-to-andesitic Ulawun stratovolcano is the highest volcano of the Bismarck arc, and one of Papua New Guinea's most frequently active. The volcano, also known as the Father, rises above the N coast of the island of New Britain across a low saddle NE of Bamus volcano, the South Son. The upper 1,000 m is unvegetated. A prominent E-W escarpment on the south may be the result of large-scale slumping. Satellitic cones occupy the NW and E flanks. A steep-walled valley cuts the NW side, and a flank lava-flow complex lies to the south of this valley. Historical eruptions date back to the beginning of the 18th century. Twentieth-century eruptions were mildly explosive until 1967, but after 1970 several larger eruptions produced lava flows and basaltic pyroclastic flows, greatly modifying the summit crater.
Information Contacts: Rabaul Volcano Observatory (RVO), P.O. Box 386, Rabaul, Papua New Guinea; Darwin Volcanic Ash Advisory Center (VAAC), Commonwealth Bureau of Meteorology, Northern Territory Regional Office, PO Box 40050, Casuarina, NT 0811, Australia (URL: http://www.bom.gov.au/info/vaac/).
Witori (Papua New Guinea) — February 2004 Cite this Report
Witori
Papua New Guinea
5.5745°S, 150.5161°E; summit elev. 724 m
All times are local (unless otherwise noted)
Two explosions on 24 February 2004, otherwise quiet during that month
Pago was mainly quiet throughout the month of February 2004. However, two explosions were reported in the early hours of 24 February [see update and correction in BGVN 29:04]. The explosions were accompanied by thick dark grey ash clouds from the lower and upper vents. The ash clouds drifted SW of the volcano resulting in fine ashfall downwind. Jet-like noises were also heard at 0140 on 24 February accompanying the explosions. A weak glow was visible from the lower vents.
Geologic Background. The active Pago cone has grown within the Witori caldera (5.5 x 7.5 km) on the northern coast of central New Britain contains the active Pago cone. The gently sloping outer caldera flanks consist primarily of dacitic pyroclastic-flow and airfall deposits produced during a series of five major explosive eruptions from about 5,600 to 1,200 years ago, many of which may have been associated with caldera formation. Pago cone may have formed less than 350 years ago; it has grown to a height above the caldera rim, and a series of ten dacitic lava flows from it covers much of the caldera floor. The youngest of these was erupted during 2002-2003 from vents extending from the summit nearly to the NW caldera wall. The Buru caldera cuts the SW flank.
Information Contacts: Rabaul Volcano Observatory (RVO), P.O. Box 386, Rabaul, Papua New Guinea.