Recently Published Bulletin Reports
Manam (Papua New Guinea) Few ash plumes during November-December 2022
Krakatau (Indonesia) Strombolian activity and ash plumes during November 2022-April 2023
Stromboli (Italy) Strombolian explosions and lava flows continue during January-April 2023
Nishinoshima (Japan) Small ash plumes and fumarolic activity during November 2022 through April 2023
Karangetang (Indonesia) Lava flows, incandescent avalanches, and ash plumes during January-June 2023
Ahyi (United States) Intermittent hydroacoustic signals and discolored plumes during November 2022-June 2023
Kadovar (Papua New Guinea) An ash plume and weak thermal anomaly during May 2023
San Miguel (El Salvador) Small gas-and-ash explosions during March and May 2023
Semisopochnoi (United States) Occasional explosions, ash deposits, and gas-and-steam plumes during December 2022-May 2023
Ebeko (Russia) Continued explosions, ash plumes, and ashfall during October 2022-May 2023
Home Reef (Tonga) Discolored plumes continued during November 2022-April 2023
Ambae (Vanuatu) New lava flow, ash plumes, and sulfur dioxide plumes during February-May 2023
Manam (Papua New Guinea) — July 2023  Cite this Report
Manam
Papua New Guinea
4.08°S, 145.037°E; summit elev. 1807 m
All times are local (unless otherwise noted)
Few ash plumes during November-December 2022
Manam is a 10-km-wide island that consists of two active summit craters: the Main summit crater and the South summit crater and is located 13 km off the northern coast of mainland Papua New Guinea. Frequent mild-to-moderate eruptions have been recorded since 1616. The current eruption period began during June 2014 and has more recently been characterized by intermittent ash plumes and thermal activity (BGVN 47:11). This report updates activity that occurred from November 2022 through May 2023 based on information from the Darwin Volcanic Ash Advisory Center (VAAC) and various satellite data.
Ash plumes were reported during November and December 2022 by the Darwin VAAC. On 7 November an ash plume rose to 2.1 km altitude and drifted NE based on satellite images and weather models. On 14 November an ash plume rose to 2.1 km altitude and drifted W based on RVO webcam images. On 20 November ash plumes rose to 1.8 km altitude and drifted NW. On 26 December an ash plume rose to 3 km altitude and drifted S and SSE.
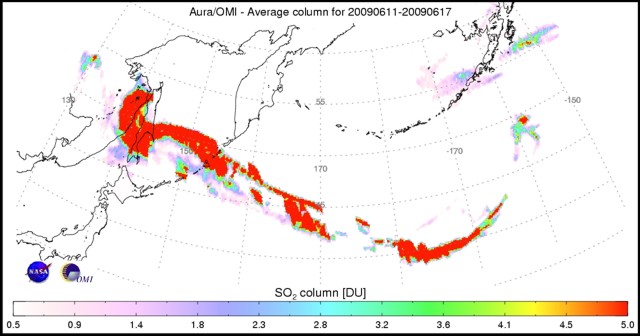
Intermittent sulfur dioxide plumes were detected using the TROPOMI instrument on the Sentinel-5P satellite, some of which exceeded at least two Dobson Units (DU) and drifted in different directions (figure 93). Occasional low-to-moderate power thermal anomalies were recorded by the MIROVA (Middle InfraRed Observation of Volcanic Activity) system; less than five anomalies were recorded each month during November 2022 through May 2023 (figure 94). Two thermal hotspots were detected by the MODVOLC thermal alerts system on 10 December 2022. On clear weather days, thermal activity was also captured in infrared satellite imagery in both the Main and South summit craters, accompanied by gas-and-steam emissions (figure 95).
Geologic Background. The 10-km-wide island of Manam, lying 13 km off the northern coast of mainland Papua New Guinea, is one of the country's most active volcanoes. Four large radial valleys extend from the unvegetated summit of the conical basaltic-andesitic stratovolcano to its lower flanks. These valleys channel lava flows and pyroclastic avalanches that have sometimes reached the coast. Five small satellitic centers are located near the island's shoreline on the northern, southern, and western sides. Two summit craters are present; both are active, although most observed eruptions have originated from the southern crater, concentrating eruptive products during much of the past century into the SE valley. Frequent eruptions, typically of mild-to-moderate scale, have been recorded since 1616. Occasional larger eruptions have produced pyroclastic flows and lava flows that reached flat-lying coastal areas and entered the sea, sometimes impacting populated areas.
Information Contacts: Rabaul Volcano Observatory (RVO), Geohazards Management Division, Department of Mineral Policy and Geohazards Management (DMPGM), PO Box 3386, Kokopo, East New Britain Province, Papua New Guinea; Darwin Volcanic Ash Advisory Centre (VAAC), Bureau of Meteorology, Northern Territory Regional Office, PO Box 40050, Casuarina, NT 0811, Australia (URL: http://www.bom.gov.au/info/vaac/); MIROVA (Middle InfraRed Observation of Volcanic Activity), a collaborative project between the Universities of Turin and Florence (Italy) supported by the Centre for Volcanic Risk of the Italian Civil Protection Department (URL: http://www.mirovaweb.it/); Hawai'i Institute of Geophysics and Planetology (HIGP) - MODVOLC Thermal Alerts System, School of Ocean and Earth Science and Technology (SOEST), Univ. of Hawai'i, 2525 Correa Road, Honolulu, HI 96822, USA (URL: http://modis.higp.hawaii.edu/); NASA Global Sulfur Dioxide Monitoring Page, Atmospheric Chemistry and Dynamics Laboratory, NASA Goddard Space Flight Center (NASA/GSFC), 8800 Greenbelt Road, Goddard, Maryland, USA (URL: https://so2.gsfc.nasa.gov/); Copernicus Browser, Copernicus Data Space Ecosystem, European Space Agency (URL: https://dataspace.copernicus.eu/browser/).
Krakatau (Indonesia) — July 2023 Cite this Report
Krakatau
Indonesia
6.1009°S, 105.4233°E; summit elev. 285 m
All times are local (unless otherwise noted)
Strombolian activity and ash plumes during November 2022-April 2023
Krakatau is located in the Sunda Strait between Java and Sumatra, Indonesia. Caldera collapse during the catastrophic 1883 eruption destroyed Danan and Perbuwatan cones and left only a remnant of Rakata. The post-collapse cone of Anak Krakatau (Child of Krakatau) was constructed within the 1883 caldera at a point between the former Danan and Perbuwatan cones; it has been the site of frequent eruptions since 1927. The current eruption period began in May 2021 and has recently consisted of explosions, ash plumes, and thermal activity (BGVN 47:11). This report covers activity during November 2022 through April 2023 based on information provided by the Indonesian Center for Volcanology and Geological Hazard Mitigation, referred to as Pusat Vulkanologi dan Mitigasi Bencana Geologi (PVMBG), MAGMA Indonesia, the Darwin Volcanic Ash Advisory Center (VAAC), and several sources of satellite data.
Activity was relatively low during November and December 2022. Daily white gas-and-steam plumes rose 25-100 m above the summit and drifted in different directions. Gray ash plumes rose 200 m above the summit and drifted NE at 1047 and at 2343 on 11 November. On 14 November at 0933 ash plumes rose 300 m above the summit and drifted E. An ash plume was reported at 0935 on 15 December that rose 100 m above the summit and drifted NE. An eruptive event at 1031 later that day generated an ash plume that rose 700 m above the summit and drifted NE. A gray ash plume at 1910 rose 100 m above the summit and drifted E. Incandescent material was ejected above the vent based on an image taken at 1936.
During January 2023 daily white gas-and-steam plumes rose 25-300 m above the summit and drifted in multiple directions. Gray-to-brown ash plumes were reported at 1638 on 3 January, at 1410 and 1509 on 4 January, and at 0013 on 5 January that rose 100-750 m above the summit and drifted NE and E; the gray-to-black ash plume at 1509 on 4 January rose as high as 3 km above the summit and drifted E. Gray ash plumes were recorded at 1754, 2241, and 2325 on 11 January and at 0046 on 12 January and rose 200-300 m above the summit and drifted NE. Toward the end of January, PVMBG reported that activity had intensified; Strombolian activity was visible in webcam images taken at 0041, 0043, and 0450 on 23 January. Multiple gray ash plumes throughout the day rose 200-500 m above the summit and drifted E and SE (figure 135). Webcam images showed progressively intensifying Strombolian activity at 1919, 1958, and 2113 on 24 January; a gray ash plume at 1957 rose 300 m above the summit and drifted E (figure 135). Eruptive events at 0231 and 2256 on 25 January and at 0003 on 26 January ejected incandescent material from the vent, based on webcam images. Gray ash plumes observed during 26-27 January rose 300-500 m above the summit and drifted NE, E, and SE.
Low levels of activity were reported during February and March. Daily white gas-and-steam plumes rose 25-300 m above the summit and drifted in different directions. The Darwin VAAC reported that continuous ash emissions rose to 1.5-1.8 km altitude and drifted W and NW during 1240-1300 on 10 March, based on satellite images, weather models, and PVMBG webcams. White-and-gray ash plumes rose 500 m and 300 m above the summit and drifted SW at 1446 and 1846 on 18 March, respectively. An eruptive event was recorded at 2143, though it was not visible due to darkness. Multiple ash plumes were reported during 27-29 March that rose as high as 2.5 km above the summit and drifted NE, W, and SW (figure 136). Webcam images captured incandescent ejecta above the vent at 0415 and around the summit area at 2003 on 28 March and at 0047 above the vent on 29 March.
Daily white gas-and-steam plumes rose 25-300 m above the summit and drifted in multiple directions during April and May. White-and-gray and black plumes rose 50-300 m above the summit on 2 and 9 April. On 11 May at 1241 a gray ash plume rose 1-3 km above the summit and drifted SW. On 12 May at 0920 a gray ash plume rose 2.5 km above the summit and drifted SW and at 2320 an ash plume rose 1.5 km above the summit and drifted SW. An accompanying webcam image showed incandescent ejecta. On 13 May at 0710 a gray ash plume rose 2 km above the summit and drifted SW (figure 137).
The MIROVA (Middle InfraRed Observation of Volcanic Activity) graph of MODIS thermal anomaly data showed intermittent low-to-moderate power thermal anomalies during November 2022 through April 2023 (figure 138). Some of this thermal activity was also visible in infrared satellite imagery at the crater, accompanied by gas-and-steam and ash plumes that drifted in different directions (figure 139).
Geologic Background. The renowned Krakatau (frequently mis-named as Krakatoa) volcano lies in the Sunda Strait between Java and Sumatra. Collapse of an older edifice, perhaps in 416 or 535 CE, formed a 7-km-wide caldera. Remnants of that volcano are preserved in Verlaten and Lang Islands; subsequently the Rakata, Danan, and Perbuwatan cones were formed, coalescing to create the pre-1883 Krakatau Island. Caldera collapse during the catastrophic 1883 eruption destroyed Danan and Perbuwatan, and left only a remnant of Rakata. This eruption caused more than 36,000 fatalities, most as a result of tsunamis that swept the adjacent coastlines of Sumatra and Java. Pyroclastic surges traveled 40 km across the Sunda Strait and reached the Sumatra coast. After a quiescence of less than a half century, the post-collapse cone of Anak Krakatau (Child of Krakatau) was constructed within the 1883 caldera at a point between the former Danan and Perbuwatan cones. Anak Krakatau has been the site of frequent eruptions since 1927.
Information Contacts: Pusat Vulkanologi dan Mitigasi Bencana Geologi (PVMBG, also known as Indonesian Center for Volcanology and Geological Hazard Mitigation, CVGHM), Jalan Diponegoro 57, Bandung 40122, Indonesia (URL: http://www.vsi.esdm.go.id/); MAGMA Indonesia, Kementerian Energi dan Sumber Daya Mineral (URL: https://magma.esdm.go.id/v1); Darwin Volcanic Ash Advisory Centre (VAAC), Bureau of Meteorology, Northern Territory Regional Office, PO Box 40050, Casuarina, NT 0811, Australia (URL: http://www.bom.gov.au/info/vaac/); MIROVA (Middle InfraRed Observation of Volcanic Activity), a collaborative project between the Universities of Turin and Florence (Italy) supported by the Centre for Volcanic Risk of the Italian Civil Protection Department (URL: http://www.mirovaweb.it/); Copernicus Browser, Copernicus Data Space Ecosystem, European Space Agency (URL: https://dataspace.copernicus.eu/browser/).
Stromboli
Italy
38.789°N, 15.213°E; summit elev. 924 m
All times are local (unless otherwise noted)
Strombolian explosions and lava flows continue during January-April 2023
Stromboli, located in Italy, has exhibited nearly constant lava fountains for the past 2,000 years; recorded eruptions date back to 350 BCE. Eruptive activity occurs at the summit from multiple vents, which include a north crater area (N area) and a central-southern crater (CS area) on a terrace known as the ‘terrazza craterica’ at the head of the Sciara del Fuoco, a large scarp that runs from the summit down the NW side of the volcano-island. Activity typically consists of Strombolian explosions, incandescent ejecta, lava flows, and pyroclastic flows. Thermal and visual monitoring cameras are located on the nearby Pizzo Sopra La Fossa, above the terrazza craterica, and at multiple flank locations. The current eruption period has been ongoing since 1934 and recent activity has consisted of frequent Strombolian explosions and lava flows (BGVN 48:02). This report updates activity during January through April 2023 primarily characterized by Strombolian explosions and lava flows based on reports from Italy's Istituto Nazionale di Geofisica e Vulcanologia (INGV) and various satellite data.
Frequent explosive activity continued throughout the reporting period, generally in the low-to-medium range, based on the number of hourly explosions in the summit crater (figure 253, table 16). Intermittent thermal activity was recorded by the MIROVA (Middle InfraRed Observation of Volcanic Activity) analysis of MODIS satellite data (figure 254). According to data collected by the MODVOLC thermal algorithm, a total of 9 thermal alerts were detected: one on 2 January 2023, one on 1 February, five on 24 March, and two on 26 March. The stronger pulses of thermal activity likely reflected lava flow events. Infrared satellite imagery captured relatively strong thermal hotspots at the two active summit craters on clear weather days, showing an especially strong event on 8 March (figure 255).
Table 16. Summary of type, frequency, and intensity of explosive activity at Stromboli by month during January-April 2023; information from webcam observations. Courtesy of INGV weekly reports.
| Month |
Explosive Activity |
| Jan 2023 |
Typical Strombolian activity with spattering and lava overflows in the N crater area. Explosions were reported from 4 vents in the N area and 1-2 vents in the CS area. The average hourly frequency of explosions was low-to-medium (1-12 events/hour). The intensity of the explosions varied from low (less than 80 m high) to medium (less than 150 m high) in the N crater area and up to high (greater than 150 m high) in the CS crater area. |
| Feb 2023 |
Typical Strombolian activity with spattering in the N crater area. Explosions were reported from 2-3 vents in the N area and 1-4 vents in the CS area. The average hourly frequency of explosions was low-to-medium (1-14 events/hour). The intensity of the explosions varied from low (less than 80 m high) to medium (less than 150 m high) in the N crater area and up to high (greater than 150 m high) in the CS crater area. |
| Mar 2023 |
Typical Strombolian activity with spattering and lava overflows in the N crater area. Explosions were reported from 2-3 vents in the N area and 2-4 vents in the CS area. The average hourly frequency of explosions was low-to-medium (1-18 events/hour). The intensity of the explosions varied from low (less than 80 m high) to medium (less than 150 m high) in the N crater area and up to high (greater than 150 m high) in the CS crater area. |
| Apr 2023 |
Typical Strombolian activity. Explosions were reported from 2 vents in the N area and 2-3 vents in the CS area. The average hourly frequency of explosions was low-to-high (1-16 events/hour). The intensity of the explosions varied from low (less than 80 m high) to medium (less than 150 m high) in both the N and CS crater areas. |
Activity during January-February 2023. Strombolian explosions were reported in the N crater area, as well as lava effusion. Explosive activity in the N crater area ejected coarse material (bombs and lapilli). Intense spattering was observed in both the N1 and N2 craters. In the CS crater area, explosions generally ejected fine material (ash), sometimes to heights greater than 250 m. The intensity of the explosions was characterized as low-to-medium in the N crater and medium-to-high in the CS crater. After intense spattering activity from the N crater area, a lava overflow began at 2136 on 2 January that flowed part way down the Sciara del Fuoco, possibly moving down the drainage that formed in October, out of view from webcams. The flow remained active for a couple of hours before stopping and beginning to cool. A second lava flow was reported at 0224 on 4 January that similarly remained active for a few hours before stopping and cooling. Intense spattering was observed on 11 and 13 January from the N1 crater. After intense spattering activity at the N2 crater at 1052 on 17 January another lava flow started to flow into the upper part of the Sciara del Fuoco (figure 256), dividing into two: one that traveled in the direction of the drainage formed in October, and the other one moving parallel to the point of emission. By the afternoon, the rate of the flow began to decrease, and at 1900 it started to cool. A lava flow was reported at 1519 on 24 January following intense spattering in the N2 area, which began to flow into the upper part of the Sciara del Fuoco. By the morning of 25 January, the lava flow had begun to cool. During 27 January the frequency of eruption in the CS crater area increased to 6-7 events/hour compared to the typical 1-7 events/hour; the following two days showed a decrease in frequency to less than 1 event/hour. Starting at 1007 on 30 January a high-energy explosive sequence was produced by vents in the CS crater area. The sequence began with an initial energetic pulse that lasted 45 seconds, ejecting predominantly coarse products 300 m above the crater that fell in an ESE direction. Subsequent and less intense explosions ejected material 100 m above the crater. The total duration of this event lasted approximately two minutes. During 31 January through 6, 13, and 24 February spattering activity was particularly intense for short periods in the N2 crater.
An explosive sequence was reported on 16 February that was characterized by a major explosion in the CS crater area (figure 257). The sequence began at 1817 near the S2 crater that ejected material radially. A few seconds later, lava fountains were observed in the central part of the crater. Three explosions of medium intensity (material was ejected less than 150 m high) were recorded at the S2 crater. The first part of this sequence lasted approximately one minute, according to INGV, and material rose 300 m above the crater and then was deposited along the Sciara del Fuoco. The second phase began at 1818 at the S1 crater; it lasted seven seconds and material was ejected 150 m above the crater. Another event 20 seconds later lasted 12 seconds, also ejecting material 150 m above the crater. The sequence ended with at least three explosions of mostly fine material from the S1 crater. The total duration of this sequence was about two minutes.
Short, intense spattering activity was noted above the N1 crater on 27 and 28 February. A lava overflow was first reported at 0657 from the N2 crater on 27 February that flowed into the October 2022 drainage. By 1900 the flow had stopped. A second lava overflow also in the N crater area occurred at 2149, which overlapped the first flow and then stopped by 0150 on 28 February. Material detached from both the lava overflows rolled down the Sciara del Fuoco, some of which was visible in webcam images.
Activity during March-April 2023. Strombolian activity continued with spattering activity and lava overflows in the N crater area during March. Explosive activity at the N crater area varied from low (less than 80 m high) to medium (less than 150 m high) and ejected coarse material, such as bombs and lapilli. Spattering was observed above the N1 crater, while explosive activity at the CS crater area varied from medium to high (greater than 150 m high) and ejected coarse material. Intense spattering activity was observed for short periods on 6 March above the N1 crater. At approximately 0610 a lava overflow was reported around the N2 crater on 8 March, which then flowed into the October 2022 drainage. By 1700 the flow started to cool. A second overflow began at 1712 on 9 March and overlapped the previous flow. It had stopped by 2100. Material from both flows was deposited along the Sciara del Fuoco, though much of the activity was not visible in webcam images. On 11 March a lava overflow was observed at 0215 that overlapped the two previous flows in the October 2022 drainage. By late afternoon on 12 March, it had stopped.
During a field excursion on 16 March, scientists noted that a vent in the central crater area was degassing. Another vent showed occasional Strombolian activity that emitted ash and lapilli. During 1200-1430 low-to-medium intense activity was reported; the N1 crater emitted ash emissions and the N2 crater emitted both ash and coarse material. Some explosions also occurred in the CS crater area that ejected coarse material. The C crater in the CS crater area occasionally showed gas jetting and low intensity explosions on 17 and 22 March; no activity was observed at the S1 crater. Intense, longer periods of spattering were reported in the N1 crater on 19, 24, and 25 March. Around 2242 on 23 March a lava overflow began from the N1 crater that, after about an hour, began moving down the October 2022 drainage and flow along the Sciara del Fuoco (figure 258). Between 0200 and 0400 on 26 March the flow rate increased, which generated avalanches of material from collapses at the advancing flow front. By early afternoon, the flow began to cool. On 25 March at 1548 an explosive sequence began from one of the vents at S2 in the CS crater area (figure 258). Fine ash mixed with coarse material was ejected 300 m above the crater rim and drifted SSE. Some modest explosions around Vent C were detected at 1549 on 25 March, which included an explosion at 1551 that ejected coarse material. The entire explosive sequence lasted approximately three minutes.
During April explosions persisted in both the N and CS crater areas. Fine material was ejected less than 80 m above the N crater rim until 6 April, followed by ejection of coarser material. Fine material was also ejected less than 80 m above the CS crater rim. The C and S2 crater did not show significant eruptive activity. On 7 April an explosive sequence was detected in the CS crater area at 1203 (figure 259). The first explosion lasted approximately 18 seconds and ejected material 400 m above the crater rim, depositing pyroclastic material in the upper part of the Sciara del Fuoco. At 1204 a second, less intense explosion lasted approximately four seconds and deposited pyroclastic products outside the crater area and near Pizzo Sopra La Fossa. A third explosion at 1205 was mainly composed of ash that rose about 150 m above the crater and lasted roughly 20 seconds. A fourth explosion occurred at 1205 about 28 seconds after the third explosion and ejected a mixture of coarse and fine material about 200 m above the crater; the explosion lasted roughly seven seconds. Overall, the entire explosive sequence lasted about two minutes and 20 seconds. After the explosive sequence on 7 April, explosions in both the N and CS crater areas ejected material as high as 150 m above the crater.
On 21 April research scientists from INGV made field observations in the summit area of Stromboli, and some lapilli samples were collected. In the N crater area near the N1 crater, a small cone was observed with at least two active vents, one of which was characterized by Strombolian explosions. The other vent produced explosions that ejected ash and chunks of cooled lava. At the N2 crater at least one vent was active and frequently emitted ash. In the CS crater area, a small cone contained 2-3 degassing vents and a smaller, possible fissure area also showed signs of degassing close to the Pizzo Sopra La Fossa. In the S part of the crater, three vents were active: a small hornito was characterized by modest and rare explosions, a vent that intermittently produced weak Strombolian explosions, and a vent at the end of the terrace that produced frequent ash emissions. Near the S1 crater there was a hornito that generally emitted weak gas-and-steam emissions, sometimes associated with “gas rings”. On 22 April another field inspection was carried out that reported two large sliding surfaces on the Sciara del Fuoco that showed where blocks frequently descended toward the sea. A thermal anomaly was detected at 0150 on 29 April.
Geologic Background. Spectacular incandescent nighttime explosions at Stromboli have long attracted visitors to the "Lighthouse of the Mediterranean" in the NE Aeolian Islands. This volcano has lent its name to the frequent mild explosive activity that has characterized its eruptions throughout much of historical time. The small island is the emergent summit of a volcano that grew in two main eruptive cycles, the last of which formed the western portion of the island. The Neostromboli eruptive period took place between about 13,000 and 5,000 years ago. The active summit vents are located at the head of the Sciara del Fuoco, a prominent scarp that formed about 5,000 years ago due to a series of slope failures which extends to below sea level. The modern volcano has been constructed within this scarp, which funnels pyroclastic ejecta and lava flows to the NW. Essentially continuous mild Strombolian explosions, sometimes accompanied by lava flows, have been recorded for more than a millennium.
Information Contacts: Istituto Nazionale di Geofisica e Vulcanologia (INGV), Sezione di Catania, Piazza Roma 2, 95123 Catania, Italy, (URL: http://www.ct.ingv.it/en/); MIROVA (Middle InfraRed Observation of Volcanic Activity), a collaborative project between the Universities of Turin and Florence (Italy) supported by the Centre for Volcanic Risk of the Italian Civil Protection Department (URL: http://www.mirovaweb.it/); Hawai'i Institute of Geophysics and Planetology (HIGP) - MODVOLC Thermal Alerts System, School of Ocean and Earth Science and Technology (SOEST), Univ. of Hawai'i, 2525 Correa Road, Honolulu, HI 96822, USA (URL: http://modis.higp.hawaii.edu/); Copernicus Browser, Copernicus Data Space Ecosystem, European Space Agency (URL: https://dataspace.copernicus.eu/browser/).
Nishinoshima (Japan) — July 2023 Cite this Report
Nishinoshima
Japan
27.247°N, 140.874°E; summit elev. 100 m
All times are local (unless otherwise noted)
Small ash plumes and fumarolic activity during November 2022 through April 2023
Nishinoshima is a small island located about 1,000 km S of Tokyo in the Ogasawara Arc in Japan. The island is the summit of a massive submarine volcano that has prominent peaks to the S, W, and NE. Eruptions date back to 1973; the most recent eruption period began in October 2022 and was characterized by ash plumes and fumarolic activity (BGVN 47:12). This report describes ash plumes and fumarolic activity during November 2022 through April 2023 based on monthly reports from the Japan Meteorological Agency (JMA) monthly reports and satellite data.
The most recent eruptive activity prior to the reporting internal occurred on 12 October 2022, when an ash plume rose 3.5 km above the crater rim. An aerial observation conducted by the Japan Coast Guard (JCG) on 25 November reported that white fumaroles rose approximately 200 m above the central crater of a pyroclastic cone (figure 119), and multiple plumes were observed on the ESE flank of the cone. Discolored water ranging from reddish-brown to brown and yellowish-green were visible around the perimeter of the island (figure 119). No significant activity was reported in December.
During an overflight conducted by JCG on 25 January 2023 intermittent activity and small, blackish-gray plumes rose 900 m above the central part of the crater were observed (figure 120). The fumarolic zone of the E flank and base of the cone had expanded and emissions had intensified. Dark brown discolored water was visible around the perimeter of the island.
No significant activity was reported during February through March. Ash plumes at 1050 and 1420 on 11 April rose 1.9 km above the crater rim and drifted NW and N. These were the first ash plumes observed since 12 October 2022. On 14 April JCG carried out an overflight and reported that no further eruptive activity was visible, although white gas-and-steam plumes were visible from the central crater and rose 900 m high (figure 121). Brownish and yellow-green discolored water surrounded the island.
Intermittent low-to-moderate power thermal anomalies were recorded in the MIROVA graph (Middle InfraRed Observation of Volcanic Activity) during November 2022 through April 2023 (figure 123). A cluster of six to eight anomalies were detected during November while a smaller number were detected during the following months: two to three during December, one during mid-January 2023, one during February, five during March, and two during April. Thermal activity was also reflected in infrared satellite data at the summit crater, accompanied by occasional gas-and-steam plumes (figure 124).
Geologic Background. The small island of Nishinoshima was enlarged when several new islands coalesced during an eruption in 1973-74. Multiple eruptions that began in 2013 completely covered the previous exposed surface and continued to enlarge the island. The island is the summit of a massive submarine volcano that has prominent peaks to the S, W, and NE. The summit of the southern cone rises to within 214 m of the ocean surface 9 km SSE.
Information Contacts: Japan Meteorological Agency (JMA), 1-3-4 Otemachi, Chiyoda-ku, Tokyo 100-8122, Japan (URL: http://www.jma.go.jp/jma/indexe.html); MIROVA (Middle InfraRed Observation of Volcanic Activity), a collaborative project between the Universities of Turin and Florence (Italy) supported by the Centre for Volcanic Risk of the Italian Civil Protection Department (URL: http://www.mirovaweb.it/); Copernicus Browser, Copernicus Data Space Ecosystem, European Space Agency (URL: https://dataspace.copernicus.eu/browser/).
Karangetang (Indonesia) — July 2023 Cite this Report
Karangetang
Indonesia
2.781°N, 125.407°E; summit elev. 1797 m
All times are local (unless otherwise noted)
Lava flows, incandescent avalanches, and ash plumes during January-June 2023
Karangetang (also known as Api Siau), at the northern end of the island of Siau, Indonesia, contains five summit craters along a N-S line. More than 40 eruptions have been recorded since 1675; recent eruptions have included frequent explosive activity, sometimes accompanied by pyroclastic flows and lahars. Lava dome growth has occurred in the summit craters and collapses of lava flow fronts have produced pyroclastic flows. The two active summit craters are Kawah Dua (the N crater) and Kawah Utama (the S crater, also referred to as the “Main Crater”). The most recent eruption began in late November 2018 and has more recently consisted of weak thermal activity and gas-and-steam emissions (BGVN 48:01). This report updates activity characterized by lava flows, incandescent avalanches, and ash plumes during January through June 2023 using reports from Pusat Vulkanologi dan Mitigasi Bencana Geologi (PVMBG, also known as CVGHM, or the Center of Volcanology and Geological Hazard Mitigation), MAGMA Indonesia, the Darwin VAAC (Volcano Ash Advisory Center), and satellite data.
Activity during January was relatively low and mainly consisted of white gas-and-steam emissions that rose 25-150 m above Main Crater (S crater) and drifted in different directions. Incandescence was visible from the lava dome in Kawah Dua (the N crater). Weather conditions often prevented clear views of the summit. On 18 January the number of seismic signals that indicated avalanches of material began to increase. In addition, there were a total of 71 earthquakes detected during the month.
Activity continued to increase during the first week of February. Material from Main Crater traveled as far as 800 m down the Batuawang (S) and Batang (W) drainages and as far as 1 km W down the Beha (W) drainage on 4 February. On 6 February 43 earthquake events were recorded, and on 7 February, 62 events were recorded. White gas-and-steam emissions rose 25-250 m above both summit craters throughout the month. PVMBG reported an eruption began during the evening of 8 February around 1700. Photos showed incandescent material at Main Crater. Incandescent material had also descended the flank in at least two unconfirmed directions as far as 2 km from Main Crater, accompanied by ash plumes (figure 60). As a result, PVMBG increased the Volcano Alert Level (VAL) to 3 (the second highest level on a 1-4 scale).
Occasional nighttime webcam images showed three main incandescent lava flows of differing lengths traveling down the S, SW, and W flanks (figure 61). Incandescent rocks were visible on the upper flanks, possibly from ejected or collapsed material from the crater, and incandescence was the most intense at the summit. Based on analyses of satellite imagery and weather models, the Darwin VAAC reported that daily ash plumes during 16-20 February rose to 2.1-3 km altitude and drifted NNE, E, and SE. BNPB reported on 16 February that as many as 77 people were evacuated and relocated to the East Siau Museum. A webcam image taken at 2156 on 17 February possibly showed incandescent material descending the SE flank. Ash plumes rose to 2.1 km altitude and drifted SE during 22-23 February, according to the Darwin VAAC.
Incandescent avalanches of material and summit incandescence at Main Crater continued during March. White gas-and-steam emissions during March generally rose 25-150 m above the summit crater; on 31 March gas-and-steam emissions rose 200-400 m high. An ash plume rose to 2.4 km altitude and drifted S at 1710 on 9 March and a large thermal anomaly was visible in images taken at 0550 and 0930 on 10 March. Incandescent material was visible at the summit and on the flanks based on webcam images taken at 0007 and 2345 on 16 March, at 1828 on 17 March, at 1940 on 18 March, at 2311 on 19 March, and at 2351 on 20 March. Incandescence was most intense on 18 and 20 March and webcam images showed possible Strombolian explosions (figure 62). An ash plume rose to 2.4 km altitude and drifted SW on 18 March, accompanied by a thermal anomaly.
Summit crater incandescence at Main Crater and on the flanks persisted during April. Incandescent material at the S crater and on the flanks was reported at 0016 on 1 April. The lava flows had stopped by 1 April according to PVMBG, although incandescence was still visible up to 10 m high. Seismic signals indicating effusion decreased and by 6 April they were no longer detected. Incandescence was visible from both summit craters. On 26 April the VAL was lowered to 2 (the second lowest level on a 1-4 scale). White gas-and-steam emissions rose 25-200 m above the summit crater.
During May white gas-and-steam emissions generally rose 50-250 m above the summit, though it was often cloudy, which prevented clear views; on 21 May gas-and-steam emissions rose 50-400 m high. Nighttime N summit crater incandescence rose 10-25 m above the lava dome, and less intense incandescence was noted above Main Crater, which reached about 10 m above the dome. Sounds of falling rocks at Main Crater were heard on 15 May and the seismic network recorded 32 rockfall events in the crater on 17 May. Avalanches traveled as far as 1.5 km down the SW and S flanks, accompanied by rumbling sounds on 18 May. Incandescent material descending the flanks was captured in a webcam image at 2025 on 19 May (figure 63) and on 29 May; summit crater incandescence was observed in webcam images at 2332 on 26 May and at 2304 on 29 May. On 19 May the VAL was again raised to 3.
Occasional Main Crater incandescence was reported during June, as well as incandescent material on the flanks. White gas-and-steam emissions rose 10-200 m above the summit crater. Ash plumes rose to 2.1 km altitude and drifted SE and E during 2-4 June, according to the Darwin VAAC. Material on the flanks of Main Crater were observed at 2225 on 7 June, at 2051 on 9 June, at 0007 on 17 June, and at 0440 on 18 June. Webcam images taken on 21, 25, and 27 June showed incandescence at Main Crater and from material on the flanks.
MIROVA (Middle InfraRed Observation of Volcanic Activity) analysis of MODIS satellite data showed strong thermal activity during mid-February through March and mid-May through June, which represented incandescent avalanches and lava flows (figure 64). During April through mid-May the power of the anomalies decreased but frequent anomalies were still detected. Brief gaps in activity occurred during late March through early April and during mid-June. Infrared satellite images showed strong lava flows mainly affecting the SW and S flanks, accompanied by gas-and-steam emissions (figure 65). According to data recorded by the MODVOLC thermal algorithm, there were a total of 79 thermal hotspots detected: 28 during February, 24 during March, one during April, five during May, and 21 during June.
Geologic Background. Karangetang (Api Siau) volcano lies at the northern end of the island of Siau, about 125 km NNE of the NE-most point of Sulawesi. The stratovolcano contains five summit craters along a N-S line. It is one of Indonesia's most active volcanoes, with more than 40 eruptions recorded since 1675 and many additional small eruptions that were not documented (Neumann van Padang, 1951). Twentieth-century eruptions have included frequent explosive activity sometimes accompanied by pyroclastic flows and lahars. Lava dome growth has occurred in the summit craters; collapse of lava flow fronts have produced pyroclastic flows.
Information Contacts: Pusat Vulkanologi dan Mitigasi Bencana Geologi (PVMBG, also known as Indonesian Center for Volcanology and Geological Hazard Mitigation, CVGHM), Jalan Diponegoro 57, Bandung 40122, Indonesia (URL: http://www.vsi.esdm.go.id/); MAGMA Indonesia, Kementerian Energi dan Sumber Daya Mineral (URL: https://magma.esdm.go.id/v1); Badan Nasional Penanggulangan Bencana (BNPB), National Disaster Management Agency, Graha BNPB - Jl. Scout Kav.38, East Jakarta 13120, Indonesia (URL: http://www.bnpb.go.id/); Darwin Volcanic Ash Advisory Centre (VAAC), Bureau of Meteorology, Northern Territory Regional Office, PO Box 40050, Casuarina, NT 0811, Australia (URL: http://www.bom.gov.au/info/vaac/); MIROVA (Middle InfraRed Observation of Volcanic Activity), a collaborative project between the Universities of Turin and Florence (Italy) supported by the Centre for Volcanic Risk of the Italian Civil Protection Department (URL: http://www.mirovaweb.it/); Hawai'i Institute of Geophysics and Planetology (HIGP) - MODVOLC Thermal Alerts System, School of Ocean and Earth Science and Technology (SOEST), Univ. of Hawai'i, 2525 Correa Road, Honolulu, HI 96822, USA (URL: http://modis.higp.hawaii.edu/); Copernicus Browser, Copernicus Data Space Ecosystem, European Space Agency (URL: https://dataspace.copernicus.eu/browser/); IDN Times, Jl. Jend. Gatot Subroto Kav. 27 3rd Floor Kuningan, Jakarta, Indonesia 12950, Status of Karangetang Volcano in Sitaro Islands Increases (URL: https://sulsel.idntimes.com/news/indonesia/savi/status-gunung-api-karangetang-di-kepulauan-sitaro-meningkat?page=all).
Ahyi (United States) — July 2023 Cite this Report
Ahyi
United States
20.42°N, 145.03°E; summit elev. -75 m
All times are local (unless otherwise noted)
Intermittent hydroacoustic signals and discolored plumes during November 2022-June 2023
Ahyi seamount is a large, conical submarine volcano that rises to within 75 m of the ocean surface about 18 km SE of the island of Farallon de Pajaros in the Northern Marianas. The remote location of the seamount has made eruptions difficult to document, but seismic stations installed in the region confirmed an eruption in the vicinity in 2001. No new activity was detected until April-May 2014 when an eruption was detected by NOAA (National Oceanic and Atmospheric Administration) divers, hydroacoustic sensors, and seismic stations (BGVN 42:04). New activity was first detected on 15 November by hydroacoustic sensors that were consistent with submarine volcanic activity. This report covers activity during November 2022 through June 2023 based on daily and weekly reports from the US Geological Survey.
Starting in mid-October, hydroacoustic sensors at Wake Island (2.2 km E) recorded signals consistent with submarine volcanic activity, according to a report from the USGS issued on 15 November 2022. A combined analysis of the hydroacoustic signals and seismic stations located at Guam and Chichijima Island, Japan, suggested that the source of this activity was at or near the Ahyi seamount. After a re-analysis of a satellite image of the area that was captured on 6 November, USGS confirmed that there was no evidence of discoloration at the ocean surface. Few hydroacoustic and seismic signals continued through November, including on 18 November, which USGS suggested signified a decline or pause in unrest. A VONA (Volcano Observatory Notice for Aviation) reported that a discolored water plume was persistently visible in satellite data starting on 18 November (figure 6). Though clouds often obscured clear views of the volcano, another discolored water plume was captured in a satellite image on 26 November. The Aviation Color Code (ACC) was raised to Yellow (the second lowest level on a four-color scale) and the Volcano Alert Level (VAL) was raised to Advisory (the second lowest level on a four-level scale) on 29 November.
During December, occasional detections were recorded on the Wake Island hydrophone sensors and discolored water over the seamount remained visible. During 2-7, 10-12, and 16-31 December possible explosion signals were detected. A small area of discolored water was observed in high-resolution Sentinel-2 satellite images during 1-6 December (figure 7). High-resolution satellite images recorded discolored water plumes on 13 December that originated from the summit region; no observations indicated that activity breached the ocean surface. A possible underwater plume was visible in satellite images on 18 December, and during 19-20 December a definite but diffuse underwater plume located SSE from the main vent was reported. An underwater plume was visible in a satellite image taken on 26 December (figure 7).
Hydrophone sensors continued to detect signals consistent with possible explosions during 1-8 January 2023. USGS reported that the number of detections decreased during 4-5 January. The hydrophone sensors experienced a data outage that started at 0118 on 8 January and continued through 10 January, though according to USGS, possible explosions were recorded prior to the data outage and likely continued during the outage. A discolored water plume originating from the summit region was detected in a partly cloudy satellite image on 8 January. On 11-12 and 15-17 January possible explosion signals were recorded again. One small signal was detected during 22-23 January and several signals were recorded on 25 and 31 January. During 27-31 January a plume of discolored water was observed above the seamount in satellite imagery (figure 8).
Low levels of activity continued during February and March, based on data from pressure sensors on Wake Island. During 1 and 4-6 February activity was reported, and a submarine plume was observed on 4 February (figure 8). Possible explosion signals were detected during 7-8, 10, 13-14, and 24 February. During 1-2 and 3-5 March a plume of discolored water was observed in satellite imagery (figure 8). Almost continuous hydroacoustic signals were detected in remote pressure sensor data on Wake Island 2,270 km E from the volcano during 7-13 March. During 12-13 March water discoloration around the seamount was observed in satellite imagery, despite cloudy weather. By 14 March discolored water extended about 35 km, but no direction was noted. USGS reported that the continuous hydroacoustic signals detected during 13-14 March stopped abruptly on 14 March and no new detections were observed. Three 30 second hydroacoustic detections were reported during 17-19 March, but no activity was visible due to cloudy weather. A data outage was reported during 21-22 March, making pressure sensor data unavailable; a discolored water plume was, however, visible in satellite data. A possible underwater explosion signal was detected by pressure sensors at Wake Island on 26, 29, and 31 March, though the cause and origin of these events were unclear.
Similar low activity continued during April, May, and June. Several signals were detected during 1-3 April in pressure sensors at Wake Island. USGS suggested that these may be related to underwater explosions or earthquakes at the volcano, but no underwater plumes were visible in clear satellite images. The pressure sensors had data outages during 12-13 April and no data were recorded; no underwater plumes were visible in satellite images, although cloudy weather obscured most clear views. Eruptive activity was reported starting at 2210 on 21 May. On 22 May a discolored water plume that extended 4 km was visible in satellite images, though no direction was recorded. During 23-24 May some signals were detected by the underwater pressure sensors. Possible hydroacoustic signals were detected during 2-3 and 6-8 June. Multiple hydroacoustic signals were detected during 9-11 and 16-17 June, although no activity was visible in satellite images. One hydroacoustic signal was detected during 23-24 June, but there was some uncertainty about its association with volcanic activity. A single possible hydroacoustic signal was detected during 30 June to 1 July.
Geologic Background. Ahyi seamount is a large conical submarine volcano that rises to within 75 m of the ocean surface ~18 km SE of the island of Farallon de Pajaros in the northern Marianas. Water discoloration has been observed there, and in 1979 the crew of a fishing boat felt shocks over the summit area, followed by upwelling of sulfur-bearing water. On 24-25 April 2001 an explosive eruption was detected seismically by a station on Rangiroa Atoll, Tuamotu Archipelago. The event was well constrained (+/- 15 km) at a location near the southern base of Ahyi. An eruption in April-May 2014 was detected by NOAA divers, hydroacoustic sensors, and seismic stations.
Information Contacts: US Geological Survey, Volcano Hazards Program (USGS-VHP), 12201 Sunrise Valley Drive, Reston, VA, USA, https://volcanoes.usgs.gov/index.html; Copernicus Browser, Copernicus Data Space Ecosystem, European Space Agency (URL: https://dataspace.copernicus.eu/browser/).
Kadovar (Papua New Guinea) — June 2023 Cite this Report
Kadovar
Papua New Guinea
3.608°S, 144.588°E; summit elev. 365 m
All times are local (unless otherwise noted)
An ash plume and weak thermal anomaly during May 2023
Kadovar is a 2-km-wide island that is the emergent summit of a Bismarck Sea stratovolcano. It lies off the coast of New Guinea, about 25 km N of the mouth of the Sepik River. Prior to an eruption that began in 2018, a lava dome formed the high point of the volcano, filling an arcuate landslide scarp open to the S. Submarine debris-avalanche deposits occur to the S of the island. The current eruption began in January 2018 and has comprised lava effusion from vents at the summit and at the E coast; more recent activity has consisted of ash plumes, weak thermal activity, and gas-and-steam plumes (BGVN 48:02). This report covers activity during February through May 2023 using information from the Darwin Volcanic Ash Advisory Center (VAAC) and satellite data.
Activity during the reporting period was relatively low and mainly consisted of white gas-and-steam plumes that were visible in natural color satellite images on clear weather days (figure 67). According to a Darwin VAAC report, at 2040 on 6 May an ash plume rose to 4.6 km altitude and drifted W; by 2300 the plume had dissipated. MODIS satellite instruments using the MODVOLC thermal algorithm detected a single thermal hotspot on the SE side of the island on 7 May. Weak thermal activity was also detected in a satellite image on the E side of the island on 14 May, accompanied by a white gas-and-steam plume that drifted SE (figure 68).
Geologic Background. The 2-km-wide island of Kadovar is the emergent summit of a Bismarck Sea stratovolcano of Holocene age. It is part of the Schouten Islands, and lies off the coast of New Guinea, about 25 km N of the mouth of the Sepik River. Prior to an eruption that began in 2018, a lava dome formed the high point of the andesitic volcano, filling an arcuate landslide scarp open to the south; submarine debris-avalanche deposits occur in that direction. Thick lava flows with columnar jointing forms low cliffs along the coast. The youthful island lacks fringing or offshore reefs. A period of heightened thermal phenomena took place in 1976. An eruption began in January 2018 that included lava effusion from vents at the summit and at the E coast.
Information Contacts: Darwin Volcanic Ash Advisory Centre (VAAC), Bureau of Meteorology, Northern Territory Regional Office, PO Box 40050, Casuarina, NT 0811, Australia (URL: http://www.bom.gov.au/info/vaac/); Hawai'i Institute of Geophysics and Planetology (HIGP) - MODVOLC Thermal Alerts System, School of Ocean and Earth Science and Technology (SOEST), Univ. of Hawai'i, 2525 Correa Road, Honolulu, HI 96822, USA (URL: http://modis.higp.hawaii.edu/); Copernicus Browser, Copernicus Data Space Ecosystem, European Space Agency (URL: https://dataspace.copernicus.eu/browser/).
San Miguel (El Salvador) — June 2023 Cite this Report
San Miguel
El Salvador
13.434°N, 88.269°W; summit elev. 2130 m
All times are local (unless otherwise noted)
Small gas-and-ash explosions during March and May 2023
San Miguel in El Salvador is a broad, deep crater complex that has been frequently modified by eruptions recorded since the early 16th century and consists of the summit known locally as Chaparrastique. Flank eruptions have produced lava flows that extended to the N, NE, and SE during the 17-19th centuries. The most recent activity has consisted of minor ash eruptions from the summit crater. The current eruption period began in November 2022 and has been characterized by frequent phreatic explosions, gas-and-ash emissions, and sulfur dioxide plumes (BGVN 47:12). This report describes small gas-and-ash explosions during December 2022 through May 2023 based on special reports from the Ministero de Medio Ambiente y Recursos Naturales (MARN).
Activity has been relatively low since the last recorded explosions on 29 November 2022. Seismicity recorded by the San Miguel Volcano Station (VSM) located on the N flank at 1.7 km elevation had decreased by 7 December. Sulfur dioxide gas measurements taken with DOAS (Differential Optical Absorption Spectroscopy) mobile equipment were below typical previously recorded values: 300 tons per day (t/d). During December, small explosions were recorded by the seismic network and manifested as gas-and-steam emissions.
Gas-and-ash explosions in the crater occurred during January 2023, which were recorded by the seismic network. Sulfur dioxide values remained low, between 300-400 t/d through 10 March. At 0817 on 14 January a gas-and-ash emission was visible in webcam images, rising just above the crater rim. Some mornings during February, small gas-and-steam plumes were visible in the crater. On 7 March at 2252 MARN noted an increase in degassing from the central crater; gas emissions were constantly observed through the early morning hours on 8 March. During the early morning of 8 March through the afternoon on 9 March, 12 emissions were registered, some accompanied by ash. The last gas-and-ash emission was recorded at 1210 on 9 March; very fine ashfall was reported in El Tránsito (10 km S), La Morita (6 km W), and La Piedrita (3 km W). The smell of sulfur was reported in Piedra Azul (5 km SW). On 16 March MARN reported that gas-and-steam emissions decreased.
Low degassing and very low seismicity were reported during April; no explosions have been detected between 9 March and 27 May. The sulfur dioxide emissions remained between 350-400 t/d; during 13-20 April sulfur dioxide values fluctuated between 30-300 t/d. Activity remained low through most of May; on 23 May seismicity increased. An explosion was detected at 1647 on 27 May generated a gas-and-ash plume that rose 700 m high (figure 32); a decrease in seismicity and gas emissions followed. The DOAS station installed on the W flank recorded sulfur dioxide values that reached 400 t/d on 27 May; subsequent measurements showed a decrease to 268 t/d on 28 May and 100 t/d on 29 May.
Geologic Background. The symmetrical cone of San Miguel, one of the most active volcanoes in El Salvador, rises from near sea level to form one of the country's most prominent landmarks. A broad, deep, crater complex that has been frequently modified by eruptions recorded since the early 16th century caps the truncated unvegetated summit, also known locally as Chaparrastique. Flanks eruptions of the basaltic-andesitic volcano have produced many lava flows, including several during the 17th-19th centuries that extended to the N, NE, and SE. The SE-flank flows are the largest and form broad, sparsely vegetated lava fields crossed by highways and a railroad skirting the base of the volcano. Flank vent locations have migrated higher on the edifice during historical time, and the most recent activity has consisted of minor ash eruptions from the summit crater.
Information Contacts: Ministero de Medio Ambiente y Recursos Naturales (MARN), Km. 5½ Carretera a Nueva San Salvador, Avenida las Mercedes, San Salvador, El Salvador (URL: http://www.snet.gob.sv/ver/vulcanologia).
Semisopochnoi (United States) — June 2023 Cite this Report
Semisopochnoi
United States
51.93°N, 179.58°E; summit elev. 1221 m
All times are local (unless otherwise noted)
Occasional explosions, ash deposits, and gas-and-steam plumes during December 2022-May 2023
Semisopochnoi is located in the western Aleutians, is 20-km-wide at sea level, and contains an 8-km-wide caldera. The three-peaked Mount Young (formerly Cerberus) was constructed within the caldera during the Holocene. Each of these peaks contains a summit crater; the lava flows on the N flank appear younger than those on the S side. The current eruption period began in early February 2021 and has more recently consisted of intermittent explosions and ash emissions (BGVN 47:12). This report updates activity during December 2022 through May 2023 using daily, weekly, and special reports from the Alaska Volcano Observatory (AVO). AVO monitors the volcano using local seismic and infrasound sensors, satellite data, web cameras, and remote infrasound and lightning networks.
Activity during most of December 2022 was relatively quiet; according to AVO no eruptive or explosive activity was observed since 7 November 2022. Intermittent tremor and occasional small earthquakes were observed in geophysical data. Continuous gas-and-steam emissions were observed from the N crater of Mount Young in webcam images on clear weather days (figure 25). On 24 December, there was a slight increase in earthquake activity and several small possible explosion signals were detected in infrasound data. Eruptive activity resumed on 27 December at the N crater of Mount Young; AVO issued a Volcano Activity Notice (VAN) that reported minor ash deposits on the flanks of Mount Young that extended as far as 1 km from the vent, according to webcam images taken during 27-28 December (figure 26). No ash plumes were observed in webcam or satellite imagery, but a persistent gas-and-steam plume that might have contained some ash rose to 1.5 km altitude. As a result, AVO raised the Aviation Color Code (ACC) to Orange (the second highest level on a four-color scale) and the Volcano Alert Level (VAL) to Watch (the second highest level on a four-level scale). Possible explosions were detected during 21 December 2022 through 1 January 2023 and seismic tremor was recorded during 30-31 December.
During January 2023 eruptive activity continued at the active N crater of Mount Young. Minor ash deposits were observed on the flanks, extending about 2 km SSW, based on webcam images from 1 and 3 January. A possible explosion occurred during 1-2 January based on elevated seismicity recorded on local seismometers and an infrasound signal recorded minutes later by an array at Adak. Though no ash plumes were observed in webcam or satellite imagery, a persistent gas-and-steam plume rose to 1.5 km altitude that might have carried minor traces of ash. Ash deposits were accompanied by periods of elevated seismicity and infrasound signals from the local geophysical network, which AVO reported were likely due to weak explosive activity. Low-level explosive activity was also detected during 2-3 January, with minor gas-and-steam emissions and a new ash deposit that was visible in webcam images. Low-level explosive activity was detected in geophysical data during 4-5 January, with elevated seismicity and infrasound signals observed on local stations. Volcanic tremor was detected during 7-9 January and very weak explosive activity was detected in seismic and infrasound data on 9 January. Weak seismic and infrasound signals were recorded on 17 January, which indicated minor explosive activity, but no ash emissions were observed in clear webcam images; a gas-and-steam plume continued to rise to 1.5 km altitude. During 29-30 January, ash deposits near the summit were observed on fresh snow, according to webcam images.
The active N cone at Mount Young continued to produce a gas-and-steam plume during February, but no ash emissions or explosive events were detected. Seismicity remained elevated with faint tremor during early February. Gas-and-steam emissions from the N crater were observed in clear webcam images on 11-13 and 16 February; no explosive activity was detected in seismic, infrasound, or satellite data. Seismicity has also decreased, with no significant seismic tremor observed since 25 January. Therefore, the ACC was lowered to Yellow (the second lowest level on a four-color scale) and the VAL was lowered to Advisory (the second lowest level on a four-color scale) on 22 February.
Gas-and-steam emissions persisted during March from the N cone of Mount Young, based on clear webcam images. A few brief episodes of weak tremor were detected in seismic data, although seismicity decreased over the month. A gas-and-steam plume detected in satellite data extended 150 km on 18 March. Low-level ash emissions from the N cone at Mount Young were observed in several webcam images during 18-19 March, in addition to small explosions and volcanic tremor. The ACC was raised to Orange and the VAL increased to Watch on 19 March. A small explosion was detected in seismic and infrasound data on 21 March.
Low-level unrest continued during April, although cloudy weather often obscured views of the summit; periods of seismic tremor and local earthquakes were recorded. During 3-4 April a gas-and-steam plume was visible traveling more than 200 km overnight; no ash was evident in the plume, according to AVO. A gas-and-steam plume was observed during 4-6 April that extended 400 km but did not seem to contain ash. Small explosions were detected in seismic and infrasound data on 5 April. Occasional clear webcam images showed continuing gas-and-steam emissions rose from Mount Young, but no ash deposits were observed on the snow. On 19 April small explosions and tremor were detected in seismic and infrasound data. A period of seismic tremor was detected during 22-25 April, with possible weak explosions on 25 April. Ash deposits were visible near the crater rim, but it was unclear if these deposits were recent or due to older deposits.
Occasional small earthquakes were recorded during May, but there were no signs of explosive activity seen in geophysical data. Gas-and-steam emissions continued from the N crater of Mount Young, based on webcam images, and seismicity remained slightly elevated. A new, light ash deposit was visible during the morning of 5 May on fresh snow on the NW flank of Mount Young. During 10 May periods of volcanic tremor were observed. The ACC was lowered to Yellow and the VAL to Advisory on 17 May due to no additional evidence of activity.
Geologic Background. Semisopochnoi, the largest subaerial volcano of the western Aleutians, is 20 km wide at sea level and contains an 8-km-wide caldera. It formed as a result of collapse of a low-angle, dominantly basaltic volcano following the eruption of a large volume of dacitic pumice. The high point of the island is Anvil Peak, a double-peaked late-Pleistocene cone that forms much of the island's northern part. The three-peaked Mount Cerberus (renamed Mount Young in 2023) was constructed within the caldera during the Holocene. Each of the peaks contains a summit crater; lava flows on the N flank appear younger than those on the south side. Other post-caldera volcanoes include the symmetrical Sugarloaf Peak SSE of the caldera and Lakeshore Cone, a small cinder cone at the edge of Fenner Lake in the NE part of the caldera. Most documented eruptions have originated from Young, although Coats (1950) considered that both Sugarloaf and Lakeshore Cone could have been recently active.
Information Contacts: Alaska Volcano Observatory (AVO), a cooperative program of a) U.S. Geological Survey, 4200 University Drive, Anchorage, AK 99508-4667 USA (URL: https://avo.alaska.edu/), b) Geophysical Institute, University of Alaska, PO Box 757320, Fairbanks, AK 99775-7320, USA, and c) Alaska Division of Geological & Geophysical Surveys, 794 University Ave., Suite 200, Fairbanks, AK 99709, USA (URL: http://dggs.alaska.gov/).
Ebeko
Russia
50.686°N, 156.014°E; summit elev. 1103 m
All times are local (unless otherwise noted)
Continued explosions, ash plumes, and ashfall during October 2022-May 2023
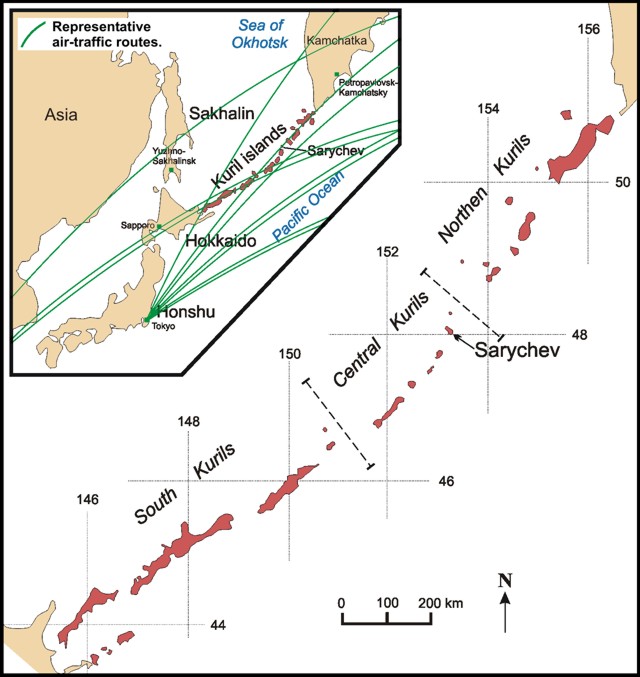
Ebeko, located on the N end of Paramushir Island in the Kuril Islands, consists of three summit craters along a SSW-NNE line at the northern end of a complex of five volcanic cones. Eruptions date back to the late 18th century and have been characterized as small-to-moderate explosions from the summit crater, accompanied by intense fumarolic activity. The current eruption period began in June 2022 and has recently consisted of frequent explosions, ash plumes, and thermal activity (BGVN 47:10). This report covers similar activity during October 2022 through May 2023, based on information from the Kamchatka Volcanic Eruptions Response Team (KVERT) and satellite data.
Activity during October consisted of explosive activity, ash plumes, and occasional thermal anomalies. Visual data by volcanologists from Severo-Kurilsk showed explosions producing ash clouds up to 2.1-3 km altitude which drifted E, N, NE, and SE during 1-8, 10, 16, and 18 October. KVERT issued several Volcano Observatory Notices for Aviation (VONA) on 7, 13-15, and 27 October 2022, stating that explosions generated ash plumes that rose to 2.3-4 km altitude and drifted 5 km E, NE, and SE. Ashfall was reported in Severo-Kurilsk (Paramushir Island, about 7 km E) on 7 and 13 October. Satellite data showed a thermal anomaly over the volcano on 15-16 October. Visual data showed ash plumes rising to 2.5-3.6 km altitude on 22, 25-29, and 31 October and moving NE due to constant explosions.
Similar activity continued during November, with explosions, ash plumes, and ashfall occurring. KVERT issued VONAs on 1-2, 4, 6-7, 9, 13, and 16 November that reported explosions and resulting ash plumes that rose to 1.7-3.6 km altitude and drifted 3-5 km SE, ESE, E, and NE. On 1 November ash plumes extended as far as 110 km SE. On 5, 8, 12, and 24-25 November explosions and ash plumes rose to 2-3.1 km altitude and drifted N and E. Ashfall was observed in Severo-Kurilsk on 7 and 16 November. A thermal anomaly was visible during 1-4, 16, and 20 November. Explosions during 26 November rose as high as 2.7 km altitude and drifted NE (figure 45).
Explosions and ash plumes continued to occur in December. During 1-2 and 4 December volcanologists from Severo-Kurilsk observed explosions that sent ash to 1.9-2.5 km altitude and drifted NE and SE (figure 46). VONAs were issued on 5, 9, and 16 December reporting that explosions generated ash plumes rising to 1.9 km, 2.6 km, and 2.4 km altitude and drifted 5 km SE, E, and NE, respectively. A thermal anomaly was visible in satellite imagery on 16 December. On 18 and 27-28 December explosions produced ash plumes that rose to 2.5 km altitude and drifted NE and SE. On 31 December an ash plume rose to 2 km altitude and drifted NE.
Explosions continued during January 2023, based on visual observations by volcanologists from Severo-Kurilsk. During 1-7 January explosions generated ash plumes that rose to 4 km altitude and drifted NE, E, W, and SE. According to VONAs issued by KVERT on 2, 4, 10, and 23 January, explosions produced ash plumes that rose to 2-4 km altitude and drifted 5 km N, NE, E, and ENE; the ash plume that rose to 4 km altitude occurred on 10 January (figure 47). Satellite data showed a thermal anomaly during 3-4, 10, 13, 16, 21, 22, and 31 January. KVERT reported that an ash cloud on 4 January moved 12 km NE. On 6 and 9-11 January explosions sent ash plumes to 4.5 km altitude and drifted W and ESE. On 13 January an ash plume rose to 3 km altitude and drifted SE. During 20-24 January ash plumes from explosions rose to 3.7 km altitude and drifted SE, N, and NE. On 21 January the ash plume drifted as far as 40 km NE. During 28-29 and 31 January and 1 February ash plumes rose to 4 km altitude and drifted NE.
During February, explosions, ash plumes, and ashfall were reported. During 1, 4-5 and 7-8 February explosions generated ash plumes that rose to 4.5 km altitude and drifted E and NE; ashfall was observed on 5 and 8 February. On 6 February an explosion produced an ash plume that rose to 3 km altitude and drifted 7 km E, causing ashfall in Severo-Kurilsk. A thermal anomaly was visible in satellite data on 8, 9, 13, and 21 February. Explosions on 9 and 12-13 February produced ash plumes that rose to 4 km altitude and drifted E and NE; the ash cloud on 12 February extended as far as 45 km E. On 22 February explosions sent ash to 3 km altitude that drifted E. During 24 and 26-27 February ash plumes rose to 4 km altitude and drifted E. On 28 February an explosion sent ash to 2.5-3 km altitude and drifted 5 km E; ashfall was observed in Severo-Kurilsk.
Activity continued during March; visual observations showed that explosions generated ash plumes that rose to 3.6 km altitude on 3, 5-7, and 9-12 March and drifted E, NE, and NW. Thermal anomalies were visible on 10, 13, and 29-30 March in satellite imagery. On 18, 21-23, 26, and 29-30 March explosions produced ash plumes that rose to 2.8 km altitude and drifted NE and E; the ash plumes during 22-23 March extended up to 76 km E. A VONA issued on 21 March reported an explosion that produced an ash plume that rose to 2.8 km altitude and drifted 5 km E. Another VONA issued on 23 March reported that satellite data showed an ash plume rising to 3 km altitude and drifted 14 km E.
Explosions during April continued to generate ash plumes. On 1 and 4 April an ash plume rose to 2.8-3.5 km altitude and drifted SE and NE. A thermal anomaly was visible in satellite imagery during 1-6 April. Satellite data showed ash plumes and clouds rising to 2-3 km altitude and drifting up to 12 km SW and E on 3 and 6 April (figure 48). KVERT issued VONAs on 3, 5, 14, 16 April describing explosions that produced ash plumes rising to 3 km, 3.5 km, 3.5 km, and 3 km altitude and drifting 5 km S, 5 km NE and SE, 72 km NNE, and 5 km NE, respectively. According to satellite data, the resulting ash cloud from the explosion on 14 April was 25 x 7 km in size and drifted 72-104 km NNE during 14-15 April. According to visual data by volcanologists from Severo-Kurilsk explosions sent ash up to 3.5 km altitude that drifted NE and E during 15-16, 22, 25-26, and 29 April.
The explosive eruption continued during May. Explosions during 3-4, 6-7, and 9-10 May generated ash plumes that rose to 4 km altitude and drifted SW and E. Satellite data showed a thermal anomaly on 3, 9, 13-14, and 24 May. During 12-16, 23-25, and 27-28 May ash plumes rose to 3.5 km altitude and drifted in different directions due to explosions. Two VONA notices were issued on 16 and 25 May, describing explosions that generated ash plumes rising to 3 km and 3.5 km altitude, respectively and extending 5 km E. The ash cloud on 25 May drifted 75 km SE.
Thermal activity in the summit crater, occasionally accompanied by ash plumes and ash deposits on the SE and E flanks due to frequent explosions, were visible in infrared and true color satellite images (figure 49).
Geologic Background. The flat-topped summit of the central cone of Ebeko volcano, one of the most active in the Kuril Islands, occupies the northern end of Paramushir Island. Three summit craters located along a SSW-NNE line form Ebeko volcano proper, at the northern end of a complex of five volcanic cones. Blocky lava flows extend west from Ebeko and SE from the neighboring Nezametnyi cone. The eastern part of the southern crater contains strong solfataras and a large boiling spring. The central crater is filled by a lake about 20 m deep whose shores are lined with steaming solfataras; the northern crater lies across a narrow, low barrier from the central crater and contains a small, cold crescentic lake. Historical activity, recorded since the late-18th century, has been restricted to small-to-moderate explosive eruptions from the summit craters. Intense fumarolic activity occurs in the summit craters, on the outer flanks of the cone, and in lateral explosion craters.
Information Contacts: Kamchatka Volcanic Eruptions Response Team (KVERT), Far Eastern Branch, Russian Academy of Sciences, 9 Piip Blvd., Petropavlovsk-Kamchatsky, 683006, Russia (URL: http://www.kscnet.ru/ivs/kvert/); MIROVA (Middle InfraRed Observation of Volcanic Activity), a collaborative project between the Universities of Turin and Florence (Italy) supported by the Centre for Volcanic Risk of the Italian Civil Protection Department (URL: http://www.mirovaweb.it/); Copernicus Browser, Copernicus Data Space Ecosystem, European Space Agency (URL: https://dataspace.copernicus.eu/browser/).
Home Reef
Tonga
18.992°S, 174.775°W; summit elev. -10 m
All times are local (unless otherwise noted)
Discolored plumes continued during November 2022-April 2023
Home Reef is a submarine volcano located in the central Tonga islands between Lateiki (Metis Shoal) and Late Island. The first recorded eruption occurred in the mid-19th century, when an ephemeral island formed. An eruption in 1984 produced a 12-km-high eruption plume, a large volume of floating pumice, and an ephemeral island 500 x 1,500 m wide, with cliffs 30-50 m high that enclosed a water-filled crater. Another island-forming eruption in 2006 produced widespread pumice rafts that drifted as far as Australia; by 2008 the island had eroded below sea level. The previous eruption occurred during October 2022 and was characterized by a new island-forming eruption, lava effusion, ash plumes, discolored water, and gas-and-steam plumes (BGVN 47:11). This report covers discolored water plumes during November 2022 through April 2023 using satellite data.
Discolored plumes continued during the reporting period and were observed in true color satellite images on clear weather days. Satellite images show light green-yellow discolored water extending W on 8 and 28 November 2022 (figure 31), and SW on 18 November. Light green-yellow plumes extended W on 3 December, S on 13 December, SW on 18 December, and W and S on 23 December (figure 31). On 12 January 2023 discolored green-yellow plumes extended to the NE, E, SE, and N. The plume moved SE on 17 January and NW on 22 January. Faint discolored water in February was visible moving NE on 1 February. A discolored plume extended NW on 8 and 28 March and NW on 13 March (figure 31). During April, clear weather showed green-blue discolored plumes moving S on 2 April, W on 7 April, and NE and S on 12 April. A strong green-yellow discolored plume extended E and NE on 22 April for several kilometers (figure 31).
Geologic Background. Home Reef, a submarine volcano midway between Metis Shoal and Late Island in the central Tonga islands, was first reported active in the mid-19th century, when an ephemeral island formed. An eruption in 1984 produced a 12-km-high eruption plume, large amounts of floating pumice, and an ephemeral 500 x 1,500 m island, with cliffs 30-50 m high that enclosed a water-filled crater. In 2006 an island-forming eruption produced widespread dacitic pumice rafts that drifted as far as Australia. Another island was built during a September-October 2022 eruption.
Information Contacts: Copernicus Browser, Copernicus Data Space Ecosystem, European Space Agency (URL: https://dataspace.copernicus.eu/browser/).
Ambae
Vanuatu
15.389°S, 167.835°E; summit elev. 1496 m
All times are local (unless otherwise noted)
New lava flow, ash plumes, and sulfur dioxide plumes during February-May 2023
Ambae, also known as Aoba, is a large basaltic shield volcano in Vanuatu. A broad pyroclastic cone containing three crater lakes (Manaro Ngoru, Voui, and Manaro Lakua) is located at the summit within the youngest of at least two nested calderas. Periodic phreatic and pyroclastic explosions have been reported since the 16th century. A large eruption more than 400 years ago resulted in a volcanic cone within the summit crater that is now filled by Lake Voui; the similarly sized Lake Manaro fills the western third of the caldera. The previous eruption ended in August 2022 that was characterized by gas-and-steam and ash emissions and explosions of wet tephra (BGVN 47:10). This report covers a new eruption during February through May 2023 that consisted of a new lava flow, ash plumes, and sulfur dioxide emissions, using information from the Vanuatu Meteorology and Geo-Hazards Department (VMGD) and satellite data.
During the reporting period, the Alert Level remained at a 2 (on a scale of 0-5), which has been in place since December 2021. Activity during October 2022 through March 2023 remained relatively low and mostly consisted of gas-and-steam emissions in Lake Voui. VMGD reported that at 1300 on 15 November a satellite image captured a strong amount of sulfur dioxide rising above the volcano (figure 99), and that seismicity slightly increased. The southern and northern part of the island reported a strong sulfur dioxide smell and heard explosions. On 20 February 2023 a gas-and-ash plume rose 1.3 km above the summit and drifted SSW, according to a webcam image (figure 100). Gas-and-steam and possibly ash emissions continued on 23 February and volcanic earthquakes were recorded by the seismic network.
During April, volcanic earthquakes and gas-and-steam and ash emissions were reported from the cone in Lake Voui. VMGD reported that activity increased during 5-7 April; high gas-and-steam and ash plumes were visible, accompanied by nighttime incandescence. According to a Wellington VAAC report, a low-level ash plume rose as high as 2.5 km above the summit and drifted W and SW on 5 April, based on satellite imagery. Reports in Saratamata stated that a dark ash plume drifted to the WSW, but no loud explosion was heard. Webcam images from 2100 showed incandescence above the crater and reflected in the clouds. According to an aerial survey, field observations, and satellite data, water was no longer present in the lake. A lava flow was reported effusing from the vent and traveling N into the dry Lake Voui, which lasted three days. The next morning at 0745 on 6 April a gas-and-steam and ash plume rose 5.4 km above the summit and drifted ESE, based on information from VMGD (figure 101). The Wellington VAAC also reported that light ashfall was observed on the island. Intermittent gas-and-steam and ash emissions were visible on 7 April, some of which rose to an estimated 3 km above the summit and drifted E. Webcam images during 0107-0730 on 7 April showed continuing ash emissions. A gas-and-steam and ash plume rose 695 m above the summit crater at 0730 on 19 April and drifted ESE, based on a webcam image (figure 102).
According to visual and infrared satellite data, water was visible in Lake Voui as late as 24 March 2023 (figure 103). The vent in the caldera showed a gas-and-steam plume drifted SE. On 3 April thermal activity was first detected, accompanied by a gas-and-ash plume that drifted W (figure 103). The lava flow moved N within the dry lake and was shown cooling by 8 April. By 23 April much of the water in the lake had returned. Occasional sulfur dioxide plumes were detected by the TROPOMI instrument on the Sentinel-5P satellite that exceeded 2 Dobson Units (DU) and drifted in different directions (figure 104).
Geologic Background. The island of Ambae, also known as Aoba, is a massive 2,500 km3 basaltic shield that is the most voluminous volcano of the New Hebrides archipelago. A pronounced NE-SW-trending rift zone with numerous scoria cones gives the 16 x 38 km island an elongated form. A broad pyroclastic cone containing three crater lakes (Manaro Ngoru, Voui, and Manaro Lakua) is located at the summit within the youngest of at least two nested calderas, the largest of which is 6 km in diameter. That large central edifice is also called Manaro Voui or Lombenben volcano. Post-caldera explosive eruptions formed the summit craters about 360 years ago. A tuff cone was constructed within Lake Voui (or Vui) about 60 years later. The latest known flank eruption, about 300 years ago, destroyed the population of the Nduindui area near the western coast.
Information Contacts: Geo-Hazards Division, Vanuatu Meteorology and Geo-Hazards Department (VMGD), Ministry of Climate Change Adaptation, Meteorology, Geo-Hazards, Energy, Environment and Disaster Management, Private Mail Bag 9054, Lini Highway, Port Vila, Vanuatu (URL: http://www.vmgd.gov.vu/, https://www.facebook.com/VanuatuGeohazardsObservatory/); Wellington Volcanic Ash Advisory Centre (VAAC), Meteorological Service of New Zealand Ltd (MetService), PO Box 722, Wellington, New Zealand (URL: http://www.metservice.com/vaac/, http://www.ssd.noaa.gov/VAAC/OTH/NZ/messages.html); MIROVA (Middle InfraRed Observation of Volcanic Activity), a collaborative project between the Universities of Turin and Florence (Italy) supported by the Centre for Volcanic Risk of the Italian Civil Protection Department (URL: http://www.mirovaweb.it/); Global Sulfur Dioxide Monitoring Page, Atmospheric Chemistry and Dynamics Laboratory, NASA Goddard Space Flight Center (NASA/GSFC), 8800 Greenbelt Road, Goddard, Maryland, USA (URL: https://so2.gsfc.nasa.gov/); Copernicus Browser, Copernicus Data Space Ecosystem, European Space Agency (URL: https://dataspace.copernicus.eu/browser/).
Search Bulletin Archive by Publication Date
Select a month and year from the drop-downs and click "Show Issue" to have that issue displayed in this tab.
The default month and year is the latest issue available.
Bulletin of the Global Volcanism Network - Volume 34, Number 06 (June 2009)
Managing Editor: Richard Wunderman
Manda Hararo (Ethiopia)
Fissure eruption generates lava flows and large SO2 plume
Miyakejima (Japan)
Four minor eruptions between August 2006 and April 2009
NW Rota-1 (United States)
Ongoing eruption has created a new 40-m-high cone
Paluweh (Indonesia)
April 2009 spike in seismicity but no explosive activity or visible emissions
Redoubt (United States)
Dome growth apparently slows; threat level lowered
Rinjani (Indonesia)
Mid-2009 eruptions send lava flows to the caldera lake
Sangay (Ecuador)
Occasional ash plume activity continues
Sarychev Peak (Russia)
Widespread plumes from large 11-16 June 2009 eruption
Tafu-Maka (Tonga)
Submarine volcanism and lava flows on the Northeast Lau Spreading Center
Telica (Nicaragua)
Intermittent incandescence and ash explosions through January 2005
West Mata (Tonga)
Submarine effusive and explosive eruption seen at two vents in May 2009
Manda Hararo (Ethiopia) — June 2009 Cite this Report
Manda Hararo
Ethiopia
12.17°N, 40.82°E; summit elev. 600 m
All times are local (unless otherwise noted)
Fissure eruption generates lava flows and large SO2 plume
A large SO2 cloud in southern Afar, Ethiopia was detected by the OMI instrument aboard NASA's EOS-AURA satellite on 29 June 2009 (figure 4). The cloud appeared to originate from the Karbahi region of the Manda Hararo rift segment, a graben area with numerous active faults, fissures, and basalt flows. The cloud was similar in size to that observed during a basaltic fissure eruption in August 2007 (BGVN 32:07). As reported by Simon Carn, the 29 June 2009 cloud had a total mass of 3.864 kt, an area of 186,710 km2, and an SO2 max of 4.75 DU (Dobson Units). Other clouds were also seen, including a large one on 30 June.
MODIS satellite imagery from 2320 UTC on 28-29 June confirmed that the SO2 cloud was associated with thermal anomalies appearing in the immediate vicinity of the August 2007 eruption. According to Charles Holliday, METEOSAT real time Active Fire Monitoring data derived from METEOSAT imagery suggests the eruption began within 15 minutes of 1715 UTC on 28 June 2009, about 7 hours after a magnitude 4.4 earthquake, identified by the Addis Ababa Geophysical Observatory and the European-Mediterranean Seismological Centre.
A field team of scientists, including Gezahegn Yirgu, Tesfaye Kidane, Elias Lewi, Tesfaye Chernet, Girma Wolde Tinsae, David Ferguson, Talfan Barnie, and Osman Mohammed, reached the site of the thermal anomalies by helicopter on 4 July 2009 and spent about two hours on the scene. They found the eruption had emitted predominantly a'a basalt flows, approximately 2-3 m thick that originated from fissures approximately 4-5 km long. The vent areas contained scoria ramparts approximately 30-50 m high. The field team collected rock and gas samples and surveyed the erupted material using visible and FLIR (Forward-Looking Infrared) cameras from both the air and the ground. Hand samples suggested the erupted lava was feldspar-bearing porphyritic basalt. No lava effusion was observed, although some steam was seen at the fissure (figure 5).
The fissure itself was inaccessible over land because it was surrounded by hot rock and could only be observed from a distance. Only a small part of the margins of the flow were visited on the ground due to limited time, rough terrain, and high temperature and humidity. The lava flows appeared to have cooled significantly, with the FLIR recording typical temperatures of between 30 and 120°C for the flow surfaces, and a maximum temperature of 238°C observed from the air (figure 6). The team made gas measurements at hot cracks in the flow front where they smelled volcanic gases and the FLIR registered temperatures over 100°C. According to David Ferguson, the group used FLIR thermal images to determine a safe route for walking. While the front of the lava flow had a dark black crust, similar to that of much colder flows, the FLIR camera on land recorded temperatures of up to 162°C around the cracks and fissures of the flow surface.
A 6 July ASTER (Advanced Spaceborne Thermal Emission and Reflection Radiometer) image from the eruption site shows a warm 6.3 x 1.4 km flow erupted from a NW-SE trending fissure (figure 7). The area of the flow field is 4.0 km2. The coordinates of the center of the flow field are 40.655, 12.256. A 9 July EO-1 ALI panchromatic image shows the flow at a higher resolution (figure 8).
Geologic Background. As the southernmost axial range of western Afar, the Manda Hararo complex is located in the Kalo plain, SSE of Dabbahu volcano. The massive 105-km-long and 20-30 km wide complex represents an uplifted segment of a mid-ocean ridge spreading center. A small basaltic shield volcano is located at the N end of the complex, S of which is an area of abundant fissure-fed lava flows. Two basaltic shield volcanoes, the larger of which is Unda Hararo, occupy the center of the complex. The dominant Gumatmali-Gablaytu fissure system lies to the S. Voluminous fluid lava flows issued from these NNW-trending fissures, and solidified lava lakes occupy two large craters. The small Gablaytu shield volcano forms the SE-most end of the complex. Lava flows from Gablaytu and from Manda overlie 8,000-year-old sediments. Hot springs and fumaroles occur around Daorre lake. The first historical eruptions produced fissure-fed lava flows in 2007 and 2009.
Information Contacts: Gezahegn Yirgu, Dept of Earth Sciences, Addis Ababa University, P.O. Box 729/1033, Addis Ababa, Ethiopia; Simon Carn, Dept of Geological and Mining Engineering and Sciences, Michigan Technological Univ, 1400 Townsend Dr., Houghton, MI 49931, USA (URL: https://so2.gsfc.nasa.gov/); Afar Rift Consortium (URL: http://www.see.leeds.ac.uk/afar/); Charles Holliday, U.S. Air Force Weather Agency (AFWA)/XOGM, Offutt Air Force Base, NE 68113, USA; Hawai'i Institute of Geophysics and Planetology (HIGP) Thermal Alerts System, School of Ocean and Earth Science and Technology (SOEST), Univ. of Hawai'i, 2525 Correa Road, Honolulu, HI 96822, USA (URL: http://modis.higp.hawaii.edu/); guardian.co.uk Science Blog (URL: https://www.theguardian.com/science/blog); David Ferguson, Dept of Earth Sciences, Univ of Oxford, Parks Road, Oxford, OX1 3PR, United Kingdom; Talfan Barnie, Dept of Geography, Univ of Cambridge, Downing Place, Cambridge CB2 3EN, United Kingdom (URL: http://www.geog.cam.ac.uk/people/barnie/); Afar Rift Consortium, School of Earth and Environment, Univ of Leeds, Woodhouse Lane, Leeds, LS2 9JT, United Kingdom (URL: http://www.see.leeds.ac.uk/afar/); Matt Patrick, HIGP/SOEST, Univ of Hawaii-Manoa, 1680 East-West Road, Honolulu, HI 96822, USA.
Miyakejima
Japan
34.094°N, 139.526°E; summit elev. 775 m
All times are local (unless otherwise noted)
Four minor eruptions between August 2006 and April 2009
Miyake-jima has had a recent history of periodic minor eruptions and gas emissions containing relatively high concentrations of sulfur dioxide (SO2). SO2 emissions in January 2006 averaged about 2,000-5,000 tons per day, and there was a minor eruption on 17 February 2006 (BGVN 31:03).
The Tokyo Volcanic Ash Advisory Center (VAAC) described an eruption on 23 August 2006 that generated plumes which rose to an altitude of about 1.5 km and drifted SE. Ash was not identified on satellite imagery. No additional eruption reports were received until January 2008. Based on information from the Japan Meteorological Agency (JMA), the Tokyo VAAC reported that an eruption plume on 7 January rose to an altitude of 1.2 km and drifted SE. The JMA also reported an eruption on 8 May 2008. Another eruption reported by JMA produced an ash plume that rose 600 m above the crater and drifted E on 1 April 2009.
Geologic Background. The circular, 8-km-wide island of Miyakejima forms a low-angle stratovolcano that rises about 1,100 m from the sea floor in the northern Izu Islands about 200 km SSW of Tokyo. The basaltic volcano is truncated by small summit calderas, one of which, 3.5 km wide, was formed during a major eruption about 2,500 years ago. Numerous craters and vents, including maars near the coast and radially oriented fissure vents, are present on the flanks. Frequent eruptions have been recorded since 1085 CE at vents ranging from the summit to below sea level, causing much damage on this small populated island. After a three-century-long hiatus ending in 1469 CE, activity has been dominated by flank fissure eruptions sometimes accompanied by minor summit eruptions. A 1.6-km-wide summit crater was slowly formed by subsidence during an eruption in 2000.
Information Contacts: Tokyo Volcanic Ash Advisory Center (VAAC), Tokyo, Japan (URL: http://ds.data.jma.go.jp/svd/vaac/data/); Japan Meteorological Agency (JMA), Otemachi, 1-3-4, Chiyoda-ku Tokyo 100-8122, Japan (URL: http://www.jma.go.jp/).
NW Rota-1 (United States) — June 2009 Cite this Report
NW Rota-1
United States
14.601°N, 144.775°E; summit elev. -517 m
All times are local (unless otherwise noted)
Ongoing eruption has created a new 40-m-high cone
An oceanographic research expedition during 3-17 April 2009 visited NW Rota-1 submarine volcano, located about 100 km N of Guam in the Mariana arc. Scientists visited the volcano with research ressel Thomas G. Thompson, making dives with the Jason remotely operated vehicle (ROV). The volcano was erupting almost all of the time with varying amplitude. This volcano was previously observed erupting during ROV dives in March 2004 (BGVN 29:03) and April 2006 (BGVN 31:05) on National Oceanographic and Atmospheric Agency (NOAA) Ocean Exploration expeditions, and by the Japanese in October 2005 and February 2008 (<BGVN 32:02).
A hydrophone deployed from February 2008 until February 2009, operated under the direction of Robert Dziak, measured almost continuous signals from the volcano during the 1-year period. This hydrophone will record data for another year, but it lacks telemetry, so NOAA intends to retrieve its data in 6-12 months. Prior to the deployment of the hydrophone activity was observed using a ROV only during brief visits.
On the expedition blog, William Chadwick noted that with NW Rota-1 apparently nearly continuously active since at least 2003, the volcano can provide a natural laboratory for learning about underwater eruptions, how submarine volcanoes grow, and how they affect the ocean environment. Scientists are able to get close to the eruptive vent because the pressure of the ocean above keeps the energy of the eruptions subdued, allowing them to gain a view of what is happening in the vent. For example, scientists watched lava slowly being pushed up and out of the eruptive vent while the sea floor shuddered and quaked and huge blocks were bulldozed out of the way to make room for new lava emerging from the vent.
The volcano had grown considerably since 2006, producing a new cone ~ 40 m high and ~ 300 m wide. Despite the ongoing eruption, with ash and rocks falling everywhere and an extreme chemical environment, a thriving ecosystem was present. The population of animals and microbes had both increased relative to 2006 and become more diverse, including new species not yet found elsewhere.
At the end of the 2009 cruise, an array of instruments (hydrophone and chemical sensors) was left to monitor events over the next year. Moorings on the flanks will look for landslides and debris flows. Chadwick's group plans to return in 2010 to continue investigations. On his blog site are some video highlights from the 2009 expedition showing activity at the Brimstone eruptive vent at the top of the new cone.
Geologic Background. A submarine volcano detected during a 2003 NOAA bathymetric survey of the Mariana Island arc was found to be hydrothermally active and named NW Rota-1. The basaltic to basaltic-andesite seamount rises to within 517 m of the ocean surface SW of Esmeralda Bank, 64 km NW of Rota Island and ~100 km N of Guam. When Northwest Rota-1 was revisited in 2004, a minor submarine eruption from a vent named Brimstone Pit on the upper south flank about 40 m below the summit intermittently ejected a plume several hundred meters high containing ash, rock particles, and molten sulfur droplets that adhered to the surface of the remotely operated submersible vehicle. The active vent was funnel-shaped, about 20 m wide and 12 m deep. Prominent structural lineaments about a kilometer apart cut across the summit of the edifice and down the NE and SW flanks.
Information Contacts: William W. Chadwick, Oregon State University and NOAA Vents Program, Newport, Oregon; 2115 SE OSU Drive, Newport, OR 97365 USA (URL: http://nwrota2009.blogspot.com/); Robert G. Dziak, Oregon State University and NOAA Vents Program, Newport, Oregon; 2115 SE OSU Drive, Newport, OR 97365 USA.
Paluweh
Indonesia
8.32°S, 121.708°E; summit elev. 875 m
All times are local (unless otherwise noted)
April 2009 spike in seismicity but no explosive activity or visible emissions
During 1-17 April 2009, seismicity increased at Paluweh (table 1), prompting the Center of Volcanology and Geological Hazard Mitigation (CVGHM) to raise the Alert Level from 1 to 2 (Waspada) on 18 April. CVGHM staff in the observation post did not see any gas or ash emissions. Visitors were requested to stay away from the active crater adjacent to the peak.
Table 1. Average number of daily seismic events recorded from Paluweh, April 2009. Courtesy of CVGHM.
| Date |
Deep volcanic earthquakes (daily average) |
Shallow volcanic earthquakes (daily average) |
| 01-03 Apr 2009 |
2 |
2 |
| 04-05 Apr 2009 |
17 |
18 |
| 06-10 Apr 2009 |
6 |
11 |
| 11-13 Apr 2009 |
6 |
10 |
| 14-15 Apr 2009 |
22 |
10 |
| 16 Apr 2009 |
23 |
15 |
Explosive activity had most recently been observed in May 1984 and previously during November 1980-September 1981 (SEAN 06:01, 06:02, 06:08, and 06:09), October 1973, and October 1972-January 1973. Activity in December 1963-March 1966 included lava flows, pyroclastic flows, and fatalities.
An unconfirmed news report of activity in January 2005, not reported in the Bulletin, was later found to be false. The CVGHM staff found no activity at the volcano.
As background on hazard considerations, the mouth of the principal crater opens to the S, where there is plantation agriculture almost to the volcano's peak. In the advent of a future crisis, evacuation would be complicated because a safer area is about two hours journey by motor vessel, and leaving the island might not be possible during storms or rough seas. CVGHM is in continuous contact with the provincial and regional governments, some monitor of Paluweh occurs from the hamlet of Ropa on the N-central coast of the big island of Flores, to Paluweh's S. Regional civil-defense agencies (such as SATKORLAK-PB, the Provincial Coordinating Unit for Disaster Management) and district government agencies of Sikka and Ende (such as SATLAK-PB, the Local Coordinating Body for Disaster Relief) are continually apprised of the activity level.
Geologic Background. Paluweh volcano, also known as Rokatenda, forms the 8-km-wide island of Palu'e north of the volcanic arc that cuts across Flores Island. The broad irregular summit region contains overlapping craters up to 900 m wide and several lava domes. Several flank vents occur along a NW-trending fissure. The largest historical eruption occurred in 1928, when strong explosive activity was accompanied by landslide-induced tsunamis and lava dome emplacement. Pyroclastic flows in August 2013 resulted in fatalities.
Information Contacts: Center of Volcanology and Geological Hazard Mitigation (CVGHM), Jalan Diponegoro 57, Bandung 40122, Indonesia (URL: http://vsi.esdm.go.id/).
Redoubt (United States) — June 2009 Cite this Report
Redoubt
United States
60.485°N, 152.742°W; summit elev. 3108 m
All times are local (unless otherwise noted)
Dome growth apparently slows; threat level lowered
Major eruptions took place at Redoubt between 15 March and 4 April 2009 (BGVN 34:04) (figure 22-24). Subsequent to those eruptions, through mid-May 2009, the lava dome continued to grow. That growth was often associated with occasional rockfalls, and small plumes, some of which contained ash and sulfur dioxide. The eruption had significant economic impacts including to the aviation industry (BGVN 34:04). The current report summarizes activity from mid-May to 30 June 2009.
Alaska Volcano Observatory (AVO) reported seismicity from Redoubt during 13 May to 23 June 2009 remained above background levels. Signals disclosed rock avalanches, discrete earthquakes. Minor volcanic tremor continued. Growth of the lava dome in the summit crater (figure 25) continued, and by 15 May the dome's volume was an estimated 30-60 million cubic meters. By 12 June, the dome was an estimated 1 km long, 460 m wide, and 200 m high. AVO warned that the unstable lava dome could fail with little or no warning, leading to significant ash emissions and possible lahars in the Drift River valley. Occasional rockfalls originating from unstable slopes of the lava dome produced minor ash clouds near the summit.
Vigorous steam emissions from the margins of the lava dome were seen on the web camera. At times, incandescence was observed in nighttime images. During an overflight on 16 May, scientists observed a turquoise lake along the S margin of the dome, and a hot, vigorous, persistent fumarole on the W wall of the upper gorge.
By late June 2009, AVO reported declining seismicity. The lower seismicity and gas emissions, along with occasional observations, suggested that dome growth had significantly slowed. On 30 June, AVO lowered the Alert Level to Advisory and the Aviation Color Code to Yellow.
Aviation encounter on 26 March 2009. The Montreal VAAC received news that a plane for a Canadian carrier encountered a volcanic cloud over southern British Columbia, near Kelowna, at approximately 0000 UTC on 26 March 2009. At that time, to the best knowledge of the VAAC, the plume from the initial eruption of Redoubt (23 March) consisted of considerable amounts of SO2, but no ash. A full inspection of the plane found no ash.
Geologic Background. Redoubt is a glacier-covered stratovolcano with a breached summit crater in Lake Clark National Park about 170 km SW of Anchorage. Next to Mount Spurr, Redoubt has been the most active Holocene volcano in the upper Cook Inlet. The volcano was constructed beginning about 890,000 years ago over Mesozoic granitic rocks of the Alaska-Aleutian Range batholith. Collapse of the summit 13,000-10,500 years ago produced a major debris avalanche that reached Cook Inlet. Holocene activity has included the emplacement of a large debris avalanche and clay-rich lahars that dammed Lake Crescent on the south side and reached Cook Inlet about 3,500 years ago. Eruptions during the past few centuries have affected only the Drift River drainage on the north. Historical eruptions have originated from a vent at the north end of the 1.8-km-wide breached summit crater. The 1989-90 eruption had severe economic impact on the Cook Inlet region and affected air traffic far beyond the volcano.
Information Contacts: Alaska Volcano Observatory (AVO), a cooperative program of a) U.S. Geological Survey, 4200 University Drive, Anchorage, AK 99508-4667, USA (URL: http://www.avo.alaska.edu/), b) Geophysical Institute, University of Alaska, PO Box 757320, Fairbanks, AK 99775-7320, USA, and c) Alaska Division of Geological & Geophysical Surveys, 794 University Ave., Suite 200, Fairbanks, AK 99709, USA; Associated Press (URL: http://www.ap.org/); Dov Bensimon, Montréal VAAC, 2121 North Service Road, Trans-Canada Highway, Dorval, Quebec H9P 1J3, Canada.
Rinjani
Indonesia
8.42°S, 116.47°E; summit elev. 3726 m
All times are local (unless otherwise noted)
Mid-2009 eruptions send lava flows to the caldera lake
Eruptions at Rinjani (figures 8 and 9) between October 2004 and January 2005 (BGVN 30:02) was the first activity noted since September 1995. On 29 April 2009, the Center of Volcanology and Geological Hazard Mitigation (CVGHM) again detected an increase in earthquakes and tremor, with eruptions from Barujari's cone beginning 2 May 2009 and continuing through 21 June 2009.
According to a 4 May news article in the Jakarta Post, the first 2 May eruption consisted of four tectonic earthquakes, each lasting between 70 and 120 seconds. Heriyadi Rachmat, head of the East Nusa Tenggara province's mining, energy and mineral resources agency, stated in the article that "the peak of the activity was on Saturday 2 May with four tremors and the eruption of thick ash." This activity prompted CVGHM to raise the Alert Level from 1 to 2 (on a scale of 1 to 4). The head of the Mt. Rinjani National Park confirmed that, as of 3 May, the park had been officially closed to hikers. At that time, around 50 hikers were asked to come down from the mountain. Rinjani, a popular tourist destination, attracts an average of 9,000 hikers per year, 4,000 of whom are foreigners.
During May and June 2009, seismic activity consisted of numerous eruption signals, while observers saw ash plumes, incandescent material, and lava flows (table 3). CVGHM recorded the largest numbers of seismic signals between 7 and 31 May. In detail, during that interval there were 1,897 eruptive earthquakes, 2,163 low-frequency earthquakes, 1,341 harmonic tremor episodes, 3,249 air blasts, 17 shallow volcanic earthquakes, 39 deep volcanic earthquakes, seven local tectonic earthquakes, and three long-distance tectonic earthquakes. Although the volcano was frequently obscured by fog, people still saw impressive eruptions from the observation post at Sembalun Lawang. They noted continuous eruptions with ejected glowing material reaching 200 m in height above the vent, and thrown laterally out to a radius of 500 m from the summit. A great amount of ash, cinders, and incandescent material fell into the caldera, while smaller fragments were blown away.
Table 3. Earthquakes, tremor (both harmonic and non-harmonic with variable maximum amplitudes and durations), air blasts, and other observations between 2 May and 21 June 2009. Key: LD is long distance tectonic, SV is shallow volcanic, LT is local tectonic, DV is deep volcanic. Courtesy of CVGHM and the Darwin VAAC.
| Date |
Eruptive earthquake |
Low-frequency tremor |
Harmonic tremor |
Airblasts |
Other earthquakes |
Observations |
| 02 May 2009 |
-- |
-- |
-- |
-- |
-- |
Dense brown ash plume to 4.7 km altitude; booming noise. |
| 03 May 2009 |
21 |
13 |
-- |
-- |
-- |
Recorded during 1800-2400. |
| 04 May 2009 |
85 |
12 |
1 |
7 |
1 LD |
Ash eruption produced white to brown plume to 4.2-4.4 km altitude, drifting N. |
| 05 May 2009 |
83 |
2 |
45 |
-- |
-- |
-- |
| 06 May 2009 |
83 |
22 |
30 |
53 |
Three volcanic |
-- |
| 07 May 2009 |
92 |
43 |
29 |
88 |
-- |
Recorded between 0000 and 1800; thick white plume. |
| 07-31 May 2009 |
1,897 |
2,154 |
1,341 |
3,249 |
17 SV, 39 DV, 7 LT, 3 LD |
163 eruptions with dense white and gray plumes rising to 3.8-4.1 km altitude. |
| 01-06 Jun 2009 |
240 |
569 |
493 |
316 |
5 SV,10 DV, 2 LT, 6 LD |
-- |
| 07-15 Jun 2009 |
-- |
Continuous |
-- |
-- |
3 DV |
Dense white plumes to 1.3-2.7 km altitude. |
| 16 Jun 2009 |
-- |
Continuous |
-- |
-- |
1 LD |
Dense white plumes to 1.3-1.5 km altitude. |
| 21 Jun 2009 |
-- |
-- |
-- |
-- |
-- |
Ash plumes to altitude of 3.0 km; drifted N. |
Lava flowed into the caldera lake and then extended 100 m beyond the shoreline. CVGHM and Darwin Volcanic Ash Advisory Center (VAAC) reports also noted several ash plumes over the summit, including those of dense white and grayish color that rose 50-400 m above Sembalun Lawang observatory from 7 May through 29 May.
Potential hazards. As of 16 June 2009, the status of Rinjani remained at Alert Level 2. CVGHM recommended remaining at least 4 km from the Barujari vent, noting potential risks from ashfall and incandescent rocks both within the caldera and in the surrounding areas (figure 10). In addition, CVGHM cautioned that landslides could enter Lake Segara Anak, causing an overflow that could form lahars.
Geologic Background. Rinjani volcano on the island of Lombok rises to 3726 m, second in height among Indonesian volcanoes only to Sumatra's Kerinci volcano. Rinjani has a steep-sided conical profile when viewed from the east, but the west side of the compound volcano is truncated by the 6 x 8.5 km, oval-shaped Segara Anak (Samalas) caldera. The caldera formed during one of the largest Holocene eruptions globally in 1257 CE, which truncated Samalas stratovolcano. The western half of the caldera contains a 230-m-deep lake whose crescentic form results from growth of the post-caldera cone Barujari at the east end of the caldera. Historical eruptions dating back to 1847 have been restricted to Barujari cone and consist of moderate explosive activity and occasional lava flows that have entered Segara Anak lake.
Information Contacts: Center of Volcanology and Geological Hazard Mitigation (CVGHM), Jalan Diponegoro 57, Bandung 40122, Indonesia (URL: http://vsi.esdm.go.id/); Darwin Volcanic Ash Advisory Centre (VAAC), Bureau of Meteorology, Northern Territory Regional Office, PO Box 40050, Casuarina, NT 0811, Australia (URL: http://www.bom.gov.au/info/vaac/); The Jakarta Post (URL: http://www.thejakartapost.com/news/2009/05/04/mt-baru-jari-spews-ash.html); Rinjani Trekking Centre, Jalan Barakuda 10, BTN Griya Batu Bolong Senggigi, Senggigi-West Lombok 83355, Lombok-NTB-Indonesia (URL: http://www.rinjanimountain.com/rinjani-information-center.htm); Bohari Adventures, Jalan Cendrawasih 8, Cakranegara Mataram 83231, Lombok-NTB-Indonesia (URL: http://www.trekkingrinjani.com/).
Sangay
Ecuador
2.005°S, 78.341°W; summit elev. 5286 m
All times are local (unless otherwise noted)
Occasional ash plume activity continues
Our most recent reports on Sangay noted occasional steam and/or ash plumes between 11 October 2006 and 28 December 2007 (BGVN 33:03) and thermal anomalies between 27 March and 4 December 2008 (BGVN 34:01). The current report continues to tabulate this persistently erupting volcano's plumes from 28 December 2007 to 31 July 2009 (table 3), and thermal anomalies from 4 December 2008 to 10 August 2009 (table 4).
Table 3. Sangay ash plume activity, reported for 29 December 2008 to July 2009. NR signifies not reported and no plumes were observed 29-31 December 2008. TA is thermal anomaly. Courtesy of the Washington Volcanic Ash Advisory Center.
| Date |
Maximum Altitude |
Bearing |
Remarks |
| 05 Jan 2009 |
7 km |
S |
-- |
| 09 Feb 2009 |
7.9 |
-- |
-- |
| 10 Mar 2009 |
5.5 |
W |
TA detected |
| 15 Jun 2009 |
-- |
WNW |
TA reported by VAAC |
| 26 Jun 2009 |
7.6 |
W |
-- |
| 23 Jul 2009 |
7.9 |
-- |
-- |
Table 4. Thermal anomalies at Sangay based on MODIS-MODVOLC data during 4 December 2008 to 10 August 2009 (continued from the list in BGVN 34:01). Courtesy HIGP Thermal Alerts System.
| Date (UTC) |
Time (UTC) |
Pixels |
Satellite |
| 10 Mar 2009 |
0645 |
1 |
Aqua |
| 10 Aug 2009 |
0340 |
1 |
Terra |
Geologic Background. The isolated Sangay volcano, located east of the Andean crest, is the southernmost of Ecuador's volcanoes and its most active. The steep-sided, glacier-covered, dominantly andesitic volcano grew within the open calderas of two previous edifices which were destroyed by collapse to the east, producing large debris avalanches that reached the Amazonian lowlands. The modern edifice dates back to at least 14,000 years ago. It towers above the tropical jungle on the east side; on the other sides flat plains of ash have been eroded by heavy rains into steep-walled canyons up to 600 m deep. The earliest report of an eruption was in 1628. Almost continuous eruptions were reported from 1728 until 1916, and again from 1934 to the present. The almost constant activity has caused frequent changes to the morphology of the summit crater complex.
Information Contacts: Washington Volcanic Ash Advisory Center, Satellite Analysis Branch (SAB), NOAA/NESDIS E/SP23, NOAA Science Center Room 401, 5200 Auth Rd, Camp Springs, MD 20746, USA (URL: http://www.ospo.noaa.gov/Products/atmosphere/vaac/); Hawai'i Institute of Geophysics and Planetology (HIGP) Thermal Alerts System, School of Ocean and Earth Science and Technology (SOEST), Univ. of Hawai'i, 2525 Correa Road, Honolulu, HI 96822, USA (URL: http://modis.higp.hawaii.edu/).
Sarychev Peak (Russia) — June 2009 Cite this Report
Sarychev Peak
Russia
48.092°N, 153.2°E; summit elev. 1496 m
All times are local (unless otherwise noted)
Widespread plumes from large 11-16 June 2009 eruption
On 11 June 2009 one of the largest historical eruptions in the Kuril Islands began?from Sarychev Peak (figure 1). A report from the Sakhalin Volcanic Eruption Response Team (SVERT) covered events through June, and included both remote-sensing and on-the-scene observations by Russian scientists. Other contributors include astronauts and remote-sensing specialists. Synonyms for the volcano include Fue-san, Matsuwa-jima, Matua-jima, and Sarnicheff.
Monitoring. Volcano monitoring is conducted by SVERT in the southern and central Kurils, and by KVERT in the northern Kurils (figure 1). The region is well known for severe weather, including summertime cloudy and foggy conditions; volcano monitoring has depended heavily on remote-sensing methods.
With respect to civil aviation, the Kuril Islands are the responsibility of the Tokyo Volcanic Ash Advisory Center (VAAC). A zone without designated VAAC jurisdiction over N-central Russia is ~ 1,400 km N. The substantial plumes caused concern about that zone's ambiguous status and the whereabouts of Sarychev's ash.
This part of the North Pacific is sparsely populated but is one of the world's most heavily traveled air corridors, crossed by flights linking Europe and North America to northern Asia (including Japan, parts of China, Hong Kong, and Korea). Injecting ash into these flight routes, Sarychev's eruption triggered diversions or delays to an unknown number of flights. Reliable sources indicated that some aircraft diversions over Russia, and other unexpected factors, cost as much as $100,000 USD per flight.
Precursors and initial eruption, 11 June 2009. Before the June 2009 eruption the volcano was dormant with substantial fumarolic activity. Visitors looking into the crater in August 2008 encountered thick fog, but did heard noises. On 6 June 2009 specialists came to the island to service an autonomous GPS station. Photographs documented increased gas emissions.
SVERT's report stated that the first signs of eruption came as a result of satellite observations acquired on 11 June 2009. Distinct then were both a thermal anomaly and weak ash emissions. During the eruption, ashfalls were widespread and noted at sites including Raikoke, Rasshua, Ushishir, Ketoi, the Simushir islands, the northern part of Urup Island, and widespread on Sakhalin Island.
On the night of 11-12 June, the scientific research ship George Steller passed near the island without anyone noticing an eruption, according to an oral report from the expedition chief Vladimir Burkanov.
Space Station photograph, 12 June 2009. A stunning photo of the plume taken on 12 June 2009 (figure 2) from the International Space Station (ISS) shows not only a highly complex ash cloud, but at least two or three distinct (different colored) volcanic clouds hugging the ground surface and traveling radially out from the vent. One is an unmistakable, light-colored pyroclastic flow, narrowing as it progresses out over the island until ultimately hidden by the edge of the weather clouds. Another set are broader, dark-colored clouds, presumably other pyroclastic flows.
The vertical plume looks dense and well confined; absent is the strongly spreading upper region common in many eruptive plumes (an umbrella cloud). The top of this cloud is bulbous, and trailing below it is a narrower, columnar lower segment colored in shades of brown and cream. At the time of this writing no clear analysis of the plume height has come to our attention. Older dispersed plumes are also apparent at distance (some at the left edge of this photo) and on satellite imagery from 12 June, with airborne ash covering a considerable area and extending in more than one direction.
Capping the ash cloud's bulbous top and in a ring just below it, lies a strikingly smooth, white portion of the plume, a feature called a pileus cloud (figure 2). It results from a slab of uncontaminated air pushed upward ahead of the rapidly rising darker zone. Pileus clouds sometimes form above mountain tops and convectively rising weather clouds. For the pileus cloud to form, the lifted air layer must have sufficient moisture (relative humidity). The underlying clouds often punch through the pileus clouds, a process that seems to have started here. The lower clouds that result are sometimes described as cloud skirts (the ring in this case).
The hole in the weather clouds centered above the volcano is likely in part due to meteorological conditions; such holes often occur similarly centered over islands in the Kuril chain. This may result, for example, from an island's landmass warming moist air or forcing it upwards to mix with dryer air, resulting in a local loss of cloud cover; such an effect might combine with downwind eddies. A broader 12 June ISS image shows a series of holes in regional weather clouds in a pattern aligned broadly over the Kuriles. Another explanation, with many adherants, is that the hole may have been caused or influenced by effects associated with dynamics of the eruption and plume propagation (Wilkinson, 2009).
The opportune ISS flyover resulted in 29 still images of the eruption taken over a 1-minute interval. NASA used the photos to create a series of animations, also available on the NASA Earth Observatory website. The ISS orbits at ~ 400 km altitude and ~ 27,500 km/hour. Patrick Vantuyne created a red-blue stereo image of the 12 June plume, posted by NASA as a "Picture of the Day."
Satellite-based observations. SVERT reported that the energetic phase of the eruption, during 11-16 June, encompassed more than ten large explosions (figures 3 and 4). Resulting ash clouds rose up to altitudes of 8-16 km and, according to some estimates, up to 21 km. Ash plumes stretched N to W for 1,500 km, and E for more than 3,000 km. Comparative analysis of ASTER-Terra satellite images indicated newly formed territory amounted to 1.4 km2. The area of island covered by June 2009 pyroclastic flows was more than 8 km2. The preliminary estimated minimum volume of eruptive rock was 0.4 km3.
Broader imagery of the region also indicated more diffuse high-altitude ash clouds. Starting on 12 June, the ash spread hundreds of kilometers both E and W and to lesser extent N, a large elongate mass high in the atmosphere that closed off a huge critical area to commercial air carriers and created new problems not seen before by aviation authorities.
According to Simon Carn, the Ozone Monitoring Instrument (OMI) on NASA's Aura satellite tracked a sulfur dioxide plume across the northern Pacific from Sakhalin Island and mainland Russia and E as far as Alaska (figure 5). Carn's tentative conclusion was that the eruption was also the largest sulfur dioxide event so far in 2009.
By early July both atmospheric lidar instruments and the CALIPSO limb-sounding satellite had documented extended aerosol layers at 10-20 km altitude over the Northern Hemisphere. There were two potential sources for these aerosols, fires and the Sarychev Peak eruption. Fires due to biomass burning were seen around this time in both the Yukon and Alaska. Fire-generated aerosols are now known to reach 20 km altitudes (Mike Fromm, personal communication, and Fromm and others, 2004). According to Fromm, the Sarychev Peak eruptions must have at least contributed to high-altitude aerosols. As recent as mid-August, the atmospheric limb-sounding satellite CALYPSO had detected pronounced aerosol layers at 22-23 km altitude, layers also seen on MODIS visible-wavelength imagery. Fromm concluded the aerosol burden was larger than the substantial August-September 2008 eruption at Kasatochi (Alaska).
The microwave limb-sounding (MLS) satellite Aura can detect multiple gases. According to a NASA website, in mid-June 2009 it detected clear signals of both SO2 and HCl across a large span of the North Pacific.
Continuing activity during 16-28 June 2009. After 16 June, the eruptions entered a less energetic stage. Weak explosions continued and contained small amounts of tephra. The SVERT team visited the island during 26-28 June. Intense gas emissions came from still-hot deposits. Satellite data confirmed these gas emissions, which continued through at least 20 July. Field work and satellite observations led the team to consider the eruption to be VEI 4.
Good views of the island were obtained from the sea during the 26-28 June visit by SVERT (figures 6-8). One component of fieldwork involved the GPS-aided mapping of pyroclastic deposits seen along the seashore. The team used an inflatable boat to access the shoreline (figure 9). The bulk of pyroclastic flows reached the sea (figures 10 and 11), and although wave action had substantially eroded the deposits along the coastline, the deposits clearly continued out into the sea. Weakly eroded underwater pyroclastic flows sometimes returned distinctive reflections on echo soundings. The soundings and other observations also revealed submerged deposits emitting gases and still-stirring hydrothermal exchanges.
The field inspection revealed three pyroclastic flows from the eruption. The team also recognized other pyroclastic material, including volcanic bombs, scoria flows, and ash. Compositionally, the field analysis suggested the eruptions were basaltic andesite. In accord with the density of the fresh blocky deposits along the sea cliff, and the clasts within them (figure 11), the team saw no floating pumice.
The intense fumarolic discharges escaping the pyroclastic flows reached ~ 500°C. Fumaroles were seen most frequently associated with impacts from large volcanic bombs, and from fissures. Areas of fumarolic exhalation included sublimated minerals such as native sulfur (figure 12). The team also encountered a pond with hot water (figure 13).
Biological impacts. Prior to the eruption, the island was teeming with life and the SVERT team photographically documented many biological impacts (eg., surviving birds congregated at damaged or destroyed rookeries). The eruptions of June 2009 divided Matua Island into two sectors with a sharp and nearly linear boundary between them (eg., figure 5). On the NW side, nearest Sarychev Peak, its eruption left a dead zone. Many plants were buried by hot tephra, leaving a landscape devoid of vegetation on the current ground surface. This dead zone was bounded to the S by a deep ravine where a large mudflow had occurred, destroying ferns, thick growths of alder, and grass cover.
To the SE, ashfall damaged small plants, including rhododendron, crowberry, cassiopea, and phylodoce. Perhaps 10-15% of sites visited there had ash over 10 cm thick. Especially near the dead zone, many small plants suffered burial, yet they continued to blossom. Blossoming cowberry was buried in areas with thick ashfall.
Among high brush in the S part of the island, alder generally suffered little, but in some areas of ashfall (between Kruglaya mountain and the slopes of the volcano) it showed some leaf damage. The leaves of mountain ash displayed yellow rims and discolored spots. High-grasses located in the SE sector were little affected by ashfall.
In the dead zone, some bird colonies remained on the old lava flows supporting the island's capes. It was difficult to estimate how many birds had died or lost nests. Many seagulls sat on the warm surfaces of the steaming pyroclastic flows. Wounded and dead seagulls found on the surfaces of pyroclastic flows were probably killed by burns after the eruption. Near the NW part of Matua Island, the team saw large flocks of sea birds aloft.
On the 28th, SVERT visited seal habitats on the S portion of the island where they counted 20 eared seals and 10 fur seals. On a cape along Matua's W coast they encountered another seven eared seals. The team found no living land animals on the NW sector. On the SE sector, they found dead mice and three dead foxes.
Additional geological background from SVERT. The modern edifice of Sarychev Peak occupies the bulk of Matua Island but is centered towards the NW (figure 5). The island's SE side is flat, with average elevations of 30-40 m. The island's S and E sides are covered with brush and grass.
Before 25 August 1945, Matua Island supported a Japanese army base with as many as 4,000 residents. After 1945, the Soviet army occupied the island and maintained meteorological and seismic stations until a sharp decline in inhabitants at the end of the 1990's. The island still contains runways and structures. In recent years, the only people on the island were occasional visitors.
The geologic literature discusses Pliocene basaltic andesite volcanoes in this region (including Toporkovyi Island and the SE part of Matua). It is probable that these are part of an ancient shield volcano. In the SE part of Matua Island is a somma of an ancient caldera (Gorshkov 1967; Markhinin 1964; Andreev and others, 1978), making Sarychev Peak an intracaldera stratovolcano. It is formed by alternating lava and tephra of mainly basalt to andesite composition (Gorshkov 1967; Andreev et.al 1978).
According to Gorshkov (1967), after the major 1946 eruption the crater had both a diameter and depth of ~ 250 m, with steep, sometimes overhanging crater walls and a floor of solid lava. Modern lava flows consisted of two-pyroxene basalts and basaltic andesites vented from the central cone, forming small tongues near the crater.
After the 1960 eruption, field observers encountered dense fog and were thus unable to describe the crater (Shilov, 1962). According to eye-witnesses, the crater's N walls may have collapsed.
The 1976 eruption included strong emissions. Lava flows extended the W, SW, and NW slopes (Andreev and others, 1978). This eruption left the crater with a diameter of ~ 200 m and a flat bottom at a depth 50-70 m below the rim.
References. Andreev, V.N., Shantser, A.E., Khrenov, A.P., Okrugin, V.M., and Hechaev V.N., 1978, Eruption of the volcano Sarychev Peak in 1976: Bull.of volcanological stations, no. 55, p. 35-40.
Casadevall, T., and Thompson, T., 1995, World map of volcanoes and principal aeronautical features (1:34,268,000): U.S. Geological Survey, Geophysical Investigations Map GP-1011.
Fedorchenko, V.I., Abdurakhmanov, A.I., and Rodionova, R.I., 1989, Volcanism of Kurile Island arc: geology and petrogenesis: M. Nauka, p. 239.
Fromm, M., Bevilacqua, R., Stocks, B., and Servranckx, R., 2004, New Directions: Eruptive transport to the stratosphere: add fire-convection to volcanoes: Atmospheric Environment, v. 38, p. 163-165.
Glavadskii, S.N., and Efremov, G.K., 1948, Eruption of the volcano Sarychev Peak in the November 1946: Bull.of volcanological stations, no. 15, p. 48-12.
Gorshkov, G.S., 1948, Volcano Sarychev Peak: Bull.of volcanological stations, no. 15, p. 3-7.
Gorshkov, G.S., 1967, Volcanism of the Kurile Island arc: M. Nauka
Markhinin, E.K, 1964, Sarychev volcano: Bull. of volcanological stations, no. 35, p. 44-58.
Shilov, V.N., 1962, The eruption of volcano Sarychev Peak in 1960: The book of Sakhalin. v. 12, p.143-149.
Wilkinson, M.J., 2009, Sarychev Peak Eruption, Kurile Islands (caption): NASA Earth Observatory, posted 22 June 2009 (URL: http://earthobservatory.nasa.gov/IOTD/view.php?id=38985).
Geologic Background. Sarychev Peak, one of the most active volcanoes of the Kuril Islands, occupies the NW end of Matua Island in the central Kuriles. The andesitic central cone was constructed within a 3-3.5-km-wide caldera, whose rim is exposed only on the SW side. A dramatic 250-m-wide, very steep-walled crater with a jagged rim caps the volcano. The substantially higher SE rim forms the 1496 m high point of the island. Fresh-looking lava flows, prior to activity in 2009, had descended in all directions, often forming capes along the coast. Much of the lower-angle outer flanks of the volcano are overlain by pyroclastic-flow deposits. Eruptions have been recorded since the 1760s and include both quiet lava effusion and violent explosions. Large eruptions in 1946 and 2009 produced pyroclastic flows that reached the sea.
Information Contacts: Sakhalin Volcanic Eruptions Response Team (SVERT), Institute of Marine Geology and Geophysics (IMG & G) Far East Division Russian Academy of Sciences, 1B Science St., Yuzhno-Sakhalinsk, 693022, Russia (URL: http://www.imgg.ru/); B.W. Levin, A.V. Rybin, M.V. Chibisoba, and V.B. Gur'yanov, IMG & G; N.G. Razzhigaeva, Pacific Institute of Geography, Far East Division Russian Academy of Sciences, 7 Radio St., Vladivostok, 690041, Russia (URL: http://tig.dvo.ru/tig/); International Space Station (ISS) Expedition 20 (astronauts Gennady Padalka, Frank De Winne, Roman Romanenko, Robert Thirsk, Michael Barratt, Nicole Stott, Tim Kopra, and Koichi Wakata) (URL: http://www.nasa.gov/mission_pages/station/expeditions/expedition20/); Simon A. Carn, Department of Geological and Mining Engineering and Sciences, Michigan Technological University, 1400 Townsend Drive Houghton, MI 49931 USA; Mike Fromm, Computational Physics, Inc, 2750 Prosperity Ave, Fairfax, VA 22031, USA; NASA Astronomy Picture of the Day (URL: http://apod.nasa.gov/apod/ap090625.html); NASA Earth Observatory (URL: http://earthobservatory.nasa.gov/).
Tafu-Maka
Tonga
15.37°S, 174.23°W; summit elev. -1400 m
All times are local (unless otherwise noted)
Submarine volcanism and lava flows on the Northeast Lau Spreading Center
The following is the first Bulletin report about this submarine volcanic area in the S part of the Northeast Lau Spreading Center (NELSC) (figure 1). An informal paper by Resing and others (2009) reported that two recent eruption sites were discovered in the NE Lau Basin during a November 2008 scientific expedition aboard the research vessel RV Thompson. The first eruption site discovered was within the NELSC and contained two active submarine volcanoes, Tafu and Maka (figure 2). During the expedition a conductivity/temperature/depth (CTD)/rosette package was used to measure the physical and chemical nature of hydrothermal systems, and the Thompson's multibeam sonar provided high resolution bathymetry and seafloor backscatter imagery. Another expedition in May 2009 revealed fresh lava flows near the Maka cone.
Expedition during 13-28 November 2008. The Tafu-Maka eruption site was discovered on the neovolcanic zone of the southernmost segment of the NELSC at a depth of ~ 1,650 m depth (figure 1). Plumes characterized by high levels of turbidity, concentrations of volcanic glass shards, large temperature anomalies, pH anomalies, hydrogen, and methane were detected up to 800 m above the seafloor at several locations above this ridge between the Tafu and Maka features (figure 2). Volcanic glass and other clastic material were present in filtered particulate samples from the plume. Such high-rising plumes in this type of hydrographic setting have been reliable indicators of massive hydrothermal discharge associated with seafloor eruptions. The observed levels of hydrogen in plumes have only been associated with the interaction of molten rock and seawater. In addition, near-bottom temperature anomalies of ~ 0.5°C, measured with the CTDO (conductivity/temperature/depth/oxygen) package, coincided with high levels of H2 and CH4 on the neovolcanic ridge north of Maka.
Prior work in the area (German and others, 2006) had located an intense hydrothermal plume over Maka, and this plume was relocated and sampled in 2008. According to Resing, a survey in August 2008 using a commercial ROV funded by Nautilus Minerals, Inc., discovered a very active black smoker field underlying this plume. The vent was apparently at the boiling temperature, based on video observations. The 2008 dive found no hydrothermal activity during a traverse of the presumed eruption site on the ridge axis. There were also plumes at depths below the neovolcanic ridge. Many of these plumes were probably formed by fallout and/or bottom gravity flows of volcaniclastic material such as described from the erupting submarine volcano NW Rota-1 in the Mariana arc (BGVN 31:05 and 33:02).
Ed Baker, another scientist on the 2008 expedition, observed that many more plumes were found, and much higher above the seafloor, than expected. Instruments that were lowered above the summit of Tafu, the larger of the two (which rises some 500 m above the ridge, to a depth of ~ 1,400 m), found scant evidence of activity. Above Maka, with a summit 150 m deeper at, there was a plume found at a depth of 700 m. Instruments identified distinct layers, each chemical rich, some thick, some thin, until the instruments stopped at 1,560 m depth just above the summit.
Expedition during 5-13 May 2009. Inspection with the ROV Jason during another cruise in May 2009 documented a lava flow along the NELSC, draped and folded over the seafloor near Maka, that scientists named "Puipui," meaning "curtain" in Tongan. In a blog posting on the expedition website, Ken Rubin noted that the combination of steep topography, gas-rich fluid magma, and an apparently very fast lava effusion event, created a range of lava forms over a short spatial distance. The pre-eruption land surface strongly controlled where and how the young lava flowed. Ridges of old rock less than 2 m high dammed the flow in places, where it flowed in thin flat sheets between the high ground. Nearer the volcanic vents, which appear to be located along a narrow ridge, lava cascaded 10 m or more down steep rock faces, forming lava sheets. Rubin also reported that in other places the lava ponded, crusted over, and then drained out, leaving collapse pits and revealing chambers with lava shells held up by pillars of fresh rock.
References. Falloon, T.J., Danyushevsky, L.V., Crawford, T.J., Maas, R.W., Eggins, S.M., Bloomer, S.H., Wright, D.J., Zlobin, S.K., and Stacey, A.R., 2007, Multiple mantle plume components involved in the petrogenesis of subduction-related lavas from the northern termination of the Tonga Arc and northern Lau Basin: Evidence from the geochemistry of arc and backarc submarine volcanics: Geochemistry, Geophysics, Geosystems, v. 8, Q09003, doi:10.1029/2007GC001619.
German, C.R., Baker, E.T., Connelly, D.P., Lupton, J.E.. Resing, J., Prien, R.D., Walker, S.L., Edmonds, H.N., and Langmuir, C.H., 2006, Hydrothermal exploration of the Fonualei Rift and spreading center and the North East Lau Spreading Center: Geochemistry, Geophysics, Geosystems, v. 7, Q11022, doi: 10.1029/2006GC001324.
Resing, J., Lupton, J., Embley, R., Baker, E., and Lilley, M. (compilers), 2009, Preliminary findings from the North Lau eruption sites, informal report, 2/5/09 (URL: http://www.ridge2000.org/science/downloads/email/Nlaupreliminaryfindings25.pdf).
Geologic Background. Two submarine volcanoes, Tafu and Maka, lie along a NE-SW-trending ridge segment in the southern part of the NE Lau Spreading Center (NELSC). The NELSC is a back-arc spreading center in the northeast part of the Lau Basin. Tafu (Tongan for "source of fire") rises to about 1,400 m below sea level at the NE end of the ridge segment, and Maka (Tongan for "rock") reaches 1,560 m below sea level at the SW end. A November 2008 NOAA Vents Program expedition discovered submarine hydrothermal plumes consistent with very recent (days to weeks?) lava effusion from Maka; a return visit in May 2009 documented the freshly emplaced lava flow.
Information Contacts: 2008 Expedition to Lau Basin (website), NOAA/PMEL VENTS Program, Hatfield Marine Science Center, 2115 S.E. OSU Dr., Newport, OR 97365, USA (URL: https://www.pmel.noaa.gov/eoi/laubasin.html); 2009 Lau Basin Eruption Exploration Expedition (blog), NOAA/PMEL VENTS Program (URL: http://laueruptions.blogspot.com/).
Telica
Nicaragua
12.606°N, 86.84°W; summit elev. 1036 m
All times are local (unless otherwise noted)
Intermittent incandescence and ash explosions through January 2005
Intermittent ash explosions and crater incandescence were seen during 2000-2002, along with high levels of seismicity related to degassing and constant low tremor (BGVN 34:05). Strong gas emissions were typical in the first half of 2003, with incandescence often noted later in the year. Activity during 2004 included occasional ash explosions as well as incandescence. After small ash explosions in late January 2005 no volcanism was noted for the remainder of the year, with observers primarily noting crater wall collapses and degassing. The Nicaraguan Territorial Studies Institute (INETER) monitors activity; visits to the crater described below are by INETER staff (primarily Pedro Perez) unless otherwise noted, though scientists from other institutions may have also been present. Some observations were also made by a local resident who maintains the local seismic station.
Activity during 2003. In January 2003 gas emissions at Telica fluctuated in their intensity. Dense gas prevented observations of incandescence. During a crater visit on 6 May an observer heard a pressurized sound, smelled sulfur, and saw blue gases. Eucalyptus trees 2 km E of the crater appeared to have been burned by the acidic gases. There was a bluish glow in the crater on 25 June and a strong smell of sulfur. To the W of the volcano several trees dropped the bulk of their leaves due to acid rain. Gas emissions remained almost constant at a moderate level.
On 31 July a high pressure noise was heard and incandescence was observed in the center of the crater. Pressurized gases emerging on 22 August from the vent at the bottom of the crater emitted a loud, jet-like sound. As in July, the vent also showed incandescence and emitted a sulfur odor. Satellite images on 24 September showed a column of gas. On 7 October incandescent was again observed, along with a strong odor of sulfur. There was a collapse of material in the SE sector.
Activity during 2004. On 20 January 2004 a wavelike sound was heard, open fissures emitted little gas, and glow was observed in the crater (figure 14). A small ash explosion on 31 March at about 0856 was reported by the caretaker of the Tel3 seismic station. On 28 April an observer noted that internal collapses had covered almost half of the southern part of the crater floor with debris. As a result incandescence in the crater was difficult to detect.
A seismic swarm N of Telica lasted from 9 to 14 June. The earthquakes had magnitudes up to 2.4 and depths between 1 and 9 km, with some being felt by local residents in the Aguas Calientes area. On 28 June a seismic signal similar to that of an explosion was detected. INETER received no reports of ashfall in surrounding areas. Reports for July-September were not available. Ash explosions occurred from the crater on 5 and 11 November. On 10 December there was significant gas and ash output, with sounds of breaking rocks inside the crater. Unlike the previous months, no incandescence was seen.
Activity during 2005. On 29 January 2005 the volcano produced small ash explosions with abundant gases. The next day when INETER technician Pedro Pérez visited he heard jet-like sounds and smelled strong gas emissions. Low gas emissions persisted during February-April. On 15 May a small earthquake swarm lasted about ten hours. Observers to the crater on 1 May noted small blue gas emissions and sulfur odor, but no incandescence. Collapses were also seen in the W and S portions of the crater.
On 30 June observers saw minor gas emissions and new material in the eruptive fissure from crater wall collapses. Activity was low on 9 August (figure 15), no sounds heard, but the crater walls had some precipitates from the gas emissions. On a 7 September visit additional collapses of the crater walls were observed along with significant gas emission. Small gas emissions were observed by a monitoring webcam for almost the entire month of December.
Geologic Background. Telica, one of Nicaragua's most active volcanoes, has erupted frequently since the beginning of the Spanish era. This volcano group consists of several interlocking cones and vents with a general NW alignment. Sixteenth-century eruptions were reported at symmetrical Santa Clara volcano at the SW end of the group. However, its eroded and breached crater has been covered by forests throughout historical time, and these eruptions may have originated from Telica, whose upper slopes in contrast are unvegetated. The steep-sided cone of Telica is truncated by a 700-m-wide double crater; the southern crater, the source of recent eruptions, is 120 m deep. El Liston, immediately E, has several nested craters. The fumaroles and boiling mudpots of Hervideros de San Jacinto, SE of Telica, form a prominent geothermal area frequented by tourists, and geothermal exploration has occurred nearby.
Information Contacts: Wilfried Strauch, Instituto Nicaraguense de Estudios Territoriales (INETER), Apartado Postal 2110, Managua, Nicaragua (URL: http://www.ineter.gob.ni//geofisica.html).
West Mata
Tonga
15.1°S, 173.75°W; summit elev. -1174 m
All times are local (unless otherwise noted)
Submarine effusive and explosive eruption seen at two vents in May 2009
This is the first Bulletin report on West Mata, a small seamount ~ 200 km SW of Samoa, the scene of inferred ongoing eruptions when visited during November 2008 and an unambiguous eruption at multiple vents when visited during May 2009. West Mata is located in the NE Lau basin ~ 35 km E of the closest portion of the Lau spreading center (figure 1) and ~ 70 km NE of a now-erupting portion of the NE Lau spreading center (NELSC). Investigations of this site were made on two research cruises conducted in the region by the research ressel RV Thompson during November 2008 and May 2009.
Expedition during 13-28 November 2008. During the 2008 expedition, water column measurements were made, including a conductivity, temperature, and depth (CTD) rosette package to characterize the physical and chemical nature of hydrothermal systems. The RV Thompson's multibeam sonar provided high-resolution bathymetry and seafloor backscatter imagery. West Mata volcano (figure 2) was very likely erupting lava flows and/or pyroclastic material at this time. The intense plume rising ~ 175 m from the summit that was characterized by high values of turbidity, hydrogen, delta helium-3 (d3He), oxidation-reduction potential (Eh), and pH. The acoustic backscatter over portions of the volcano was uniformly high, indicating geologically young seafloor.
Although the marine optical backscatter was dominated by elemental sulfur and particulate iron, there was also an abundance of large mineral and/or glass shards in the plume. The larger clastic materials were composed almost exclusively of Mg-silicates, with lesser Ca-Mg-silicates. These compositions were consistent with the eruption of boninites (glass olivine-bronzite andesite that contains little or no feldspar) that previously have only been observed at inactive volcanoes. These chemical and geological characteristics match well with those of NW Rota-1 in the southern Mariana arc, which has been undergoing submarine Strombolian eruptions for at least 4 years (BGVN 29:03, 31:05, and 33:02).
Resing and others (2009) reported that the acoustic backscatter appeared to show extensive deposits of clastic material draping the volcano and extending over a recent lava flow at its eastern end, suggesting a recent and continuous state of eruption. Finally, they note that East Mata (figure 3), a similar volcano ~ 10 km closer to the Tofua arc, is also hydrothermally active, albeit less intense than West Mata.
Expedition during 5-13 May 2009. On 6-7 May, scientists onboard the RV Thompson used the Jason 2 ROV (remotely operated vehicle) to observe eruptions from two vents of West Mata (figure 3), Prometheus (at or near the summit) and Hades (slightly to the SW). According to Dave Clague, writing on the expedition blog, the deeper vent, Hades, sits on the SW rift. It was erupting both effusively and explosively at the same time on both days (6-7 May). Small bursts were occurring at one end of an erupting fissure ~ 5 m long at a depth of 1,208 m, while pillow lavas were being extruded from the other end. By the next night (7 May) the activity had become more vigorous, sometimes blowing glowing bubbles as much as a meter across from the fissure.
Clague noted that the second, shallower vent, Prometheus, was located very near the summit of the volcano and about 100 meters away from Hades, the first vent. The eruption here was entirely explosive with low-level, but nearly continuous fire fountains throwing ejecta into the water during both dives. Both vents were often obscured by sulfur gas emissions, but incandescence was visible for minutes at a time. According to an article on the Discovery News website, Jason 2 approached the vent and was promptly buried in ~ 45 kg of debris. Huge gas bubbles, maybe 1 m in diameter, were observed coming out of West Mata.
References. Resing, J., Lupton, J., Embley, R., Baker, E., and Lilley, M. (compilers), 2009, Preliminary findings from the North Lau eruption sites, informal report, 2/5/09 (URL: http://www.ridge2000.org/science/downloads/email/Nlaupreliminaryfindings25.pdf).
Geologic Background. West Mata, a submarine volcano rising to within 1,174 m of the ocean surface, is located in the northeastern Lau Basin at the northern end of the Tofua arc, about 200 km SW of Samoa and north of the Curacoa submarine volcano. Discovered during a November 2008 NOAA Vents Program expedition it was found to be producing submarine hydrothermal plumes consistent with recent lava effusion. A return visit in May 2009 documented explosive and effusive activity from two closely spaced vents, one at the summit, and the other on the SW rift zone.
Information Contacts: 2009 Lau Basin Eruption Exploration Expedition (blog), NOAA/PMEL VENTS Program (URL: http://laueruptions.blogspot.com/); National Oceanographic and Atmospheric Agency (NOAA) Vents Program (URL: http:/www.pmel.noaa.gov/vents/); Discovery News (URL: http://dsc.discovery.com/news/2009/06/05/undersea-eruption.html).