Recently Published Bulletin Reports
Aira (Japan) Intermittent explosions, eruption plumes, and ashfall during January-June 2023
Suwanosejima (Japan) Frequent eruption plumes, explosions, and incandescent ejecta during January-June 2023
Semeru (Indonesia) Ash plumes, incandescent avalanches, and pyroclastic flows during January-June 2023
Manam (Papua New Guinea) Few ash plumes during November-December 2022
Krakatau (Indonesia) Strombolian activity and ash plumes during November 2022-April 2023
Stromboli (Italy) Strombolian explosions and lava flows continue during January-April 2023
Nishinoshima (Japan) Small ash plumes and fumarolic activity during November 2022 through April 2023
Karangetang (Indonesia) Lava flows, incandescent avalanches, and ash plumes during January-June 2023
Ahyi (United States) Intermittent hydroacoustic signals and discolored plumes during November 2022-June 2023
Kadovar (Papua New Guinea) An ash plume and weak thermal anomaly during May 2023
San Miguel (El Salvador) Small gas-and-ash explosions during March and May 2023
Semisopochnoi (United States) Occasional explosions, ash deposits, and gas-and-steam plumes during December 2022-May 2023
Aira
Japan
31.5772°N, 130.6589°E; summit elev. 1117 m
All times are local (unless otherwise noted)
Intermittent explosions, eruption plumes, and ashfall during January-June 2023
Aira caldera, located in the northern half of Kagoshima Bay, contains the active post-caldera Sakurajima volcano near the southern tip of Japan’s Kyushu Island. Eruptions date back to the 8th century and have deposited ash on Kagoshima, one of Kyushu’s largest cities, 10 km W from the summit. The Minamidake summit cone and crater has had persistent activity since 1955; the Showa crater on the E flank has also been intermittently active since 2006. The current eruption period began during late March 2017 and has more recently consisted of explosions, ash plumes, and ashfall (BGVN 48:01). This report covers activity during January through June 2023, characterized by intermittent explosions, eruption events, eruption plumes, and ashfall from both summit craters, according to monthly activity reports from the Japan Meteorological Agency (JMA) and satellite data.
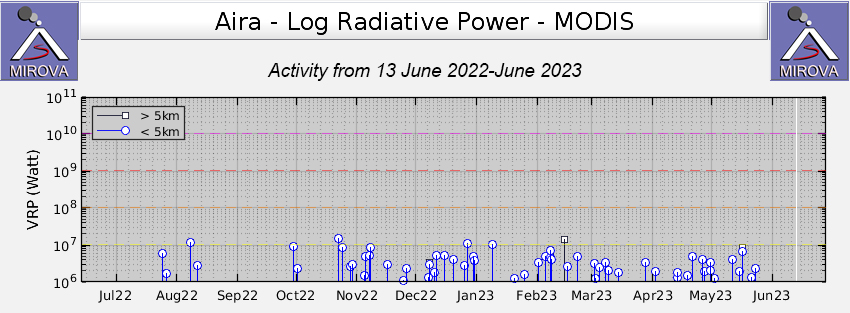
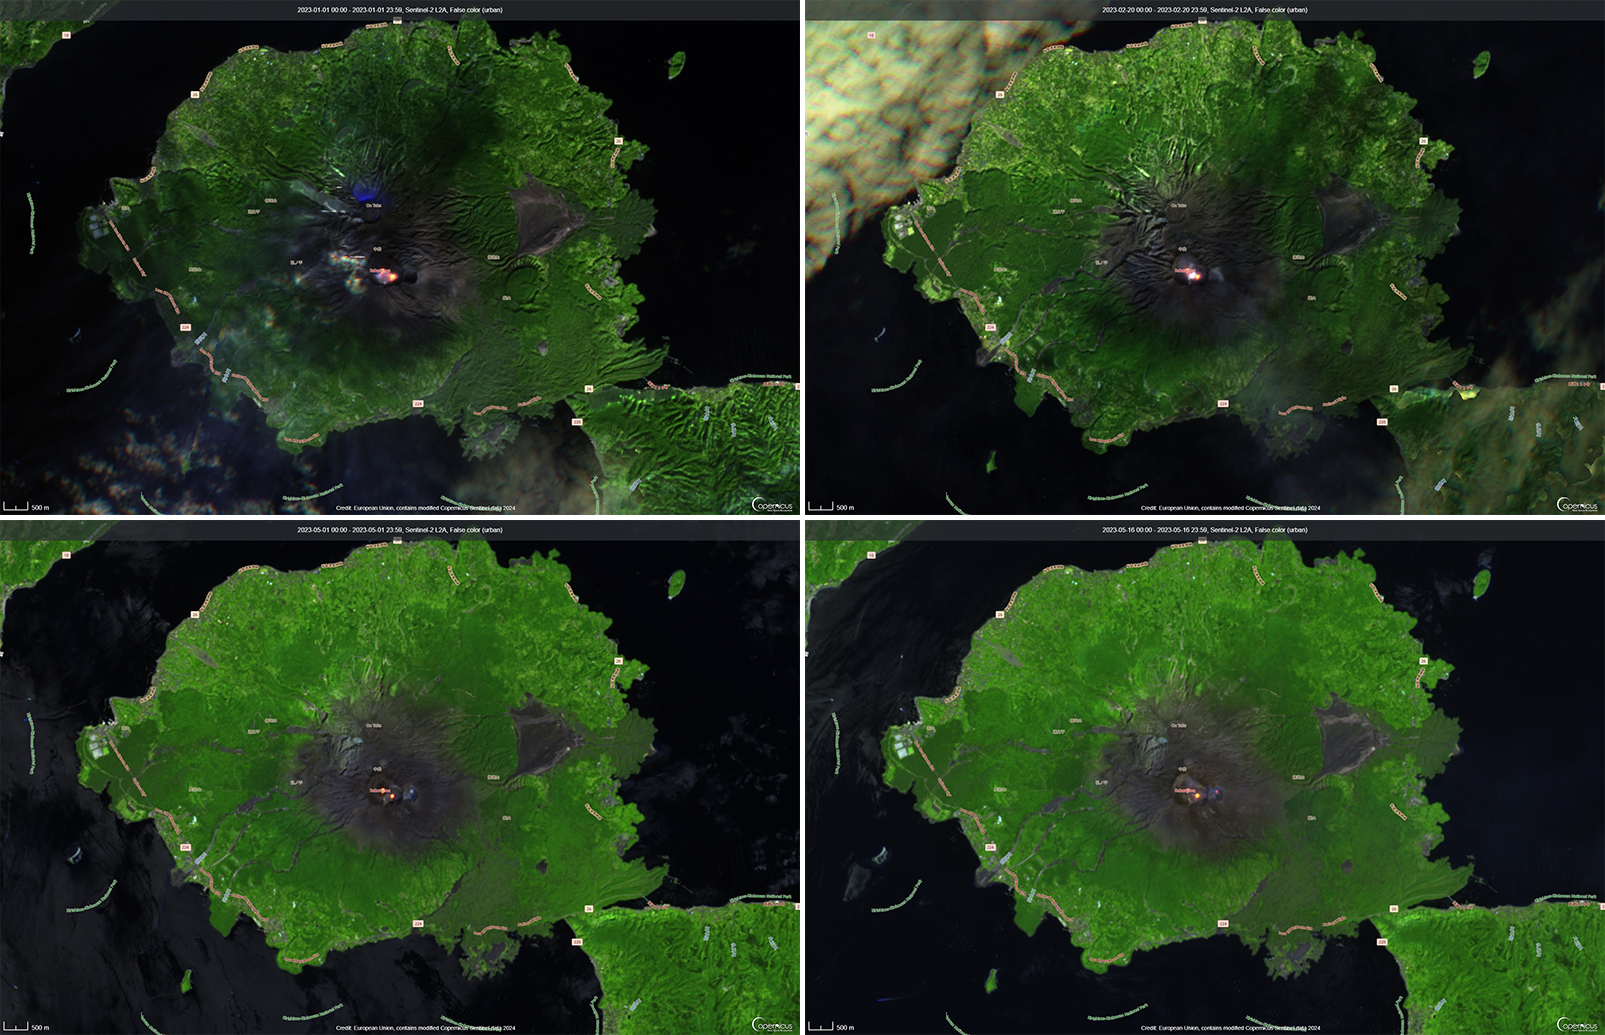
Thermal activity remained at low levels during this reporting period; less than ten thermal anomalies were detected each month by the MIROVA (Middle InfraRed Observation of Volcanic Activity) system (figure 139). Occasional thermal anomalies were visible in infrared satellite images mainly at the Minamidake crater (Vent A is located to the left and Vent B is located to the right) and during May, in the Showa crater on the E flank (figure 140).
Table 29. Number of monthly explosive events, days of ashfall, area of ash covered, and sulfur dioxide emissions from Sakurajima’s Minamidake crater at Aira during January-June 2023. Note that smaller ash events are not listed. Ashfall days were measured at Kagoshima Local Meteorological Observatory, and ashfall amounts represent material covering all the Kagoshima Prefecture. Data courtesy of JMA monthly reports.
| Month |
Explosive events |
Days of ashfall |
Ashfall amount (g/m3) |
SO2 emissions (tons/day) |
| Jan 2023 |
9 |
2 |
2 |
1,000-2,800 |
| Feb 2023 |
11 |
7 |
6 |
1,900-3,500 |
| Mar 2023 |
8 |
6 |
9 |
2,100-3,500 |
| Apr 2023 |
0 |
4 |
3 |
1,800-2,700 |
| May 2023 |
10 |
13 |
10 |
1,800-3,900 |
| Jun 2023 |
2 |
8 |
3 |
1,400-1,900 |
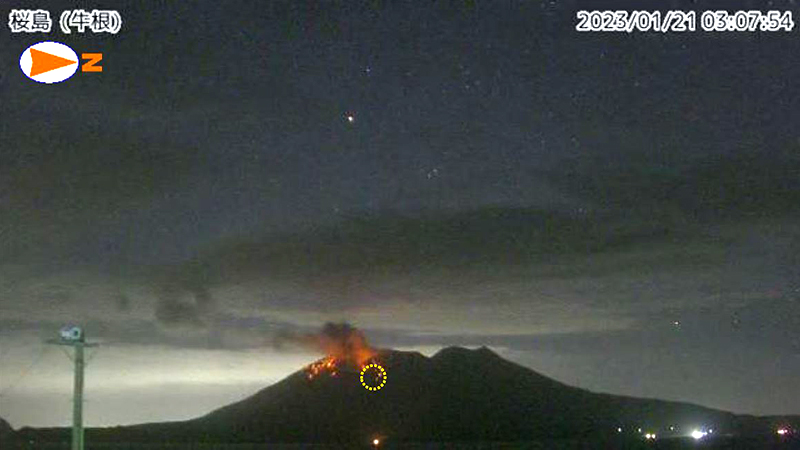
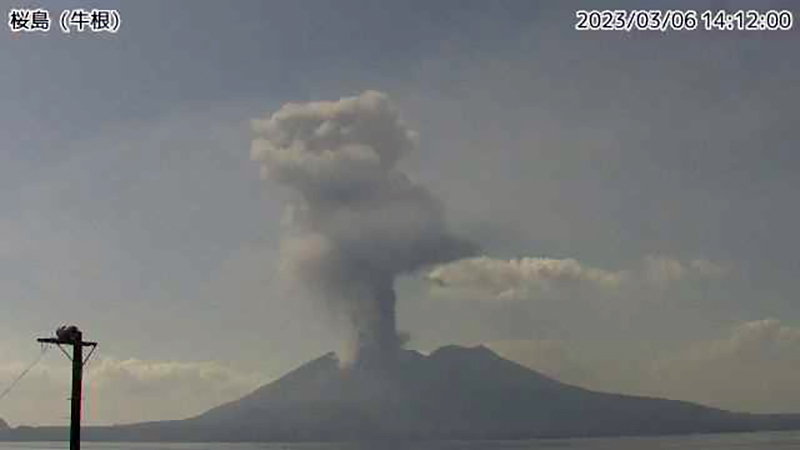
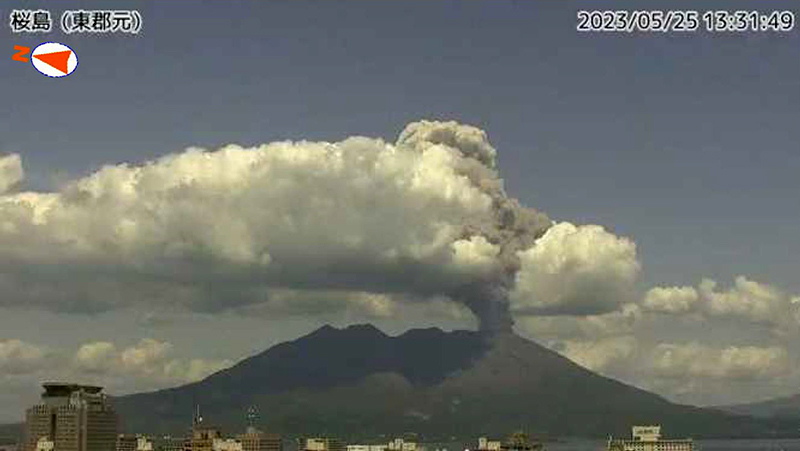
JMA reported that during January 2023, there were 14 eruptions, nine of which were explosion events. Accompanying eruption plumes rose 2.4 km above the crater rim. Large blocks were ejected 800-1,100 m from the Minamidake crater. Nighttime incandescence was observed in the Minamidake crater using a high-sensitivity surveillance camera. No eruptions in the Showa crater were reported, though there was a gradual increase in the amount of white gas-and-steam emissions beginning around mid-January. Seismicity consisted of 121 volcanic earthquakes, which was higher than the 78 earthquakes in December. The Kagoshima Local Meteorological Observatory reported a total of 2 g/m2 of ashfall was observed over the course of two days of the month. According to field surveys, daily sulfur dioxide emissions ranged from 1,000-2,800 tons/day (t/d); emissions have remained at comparable, elevated, levels since July 2022. Explosions were reported on 3 January at 1615, 8 January at 0642 and 1955, 18 January at 1215, 19 January at 0659, 21 January at 0307, and 28 January at 2342 where eruption plumes rose 1-2.4 km above the Minamidake crater and drifted SE and S. The explosion at 0307 on 21 January generated an eruption plume 1.6 km above the crater rim and ejected large blocks 800-1,100 m from the crater rim; crater incandescence was also visible (figure 141). On 28 January at 2342 an explosion produced an eruption plume that rose 2-2.2 km above the Minamidake summit crater and drifted SE.
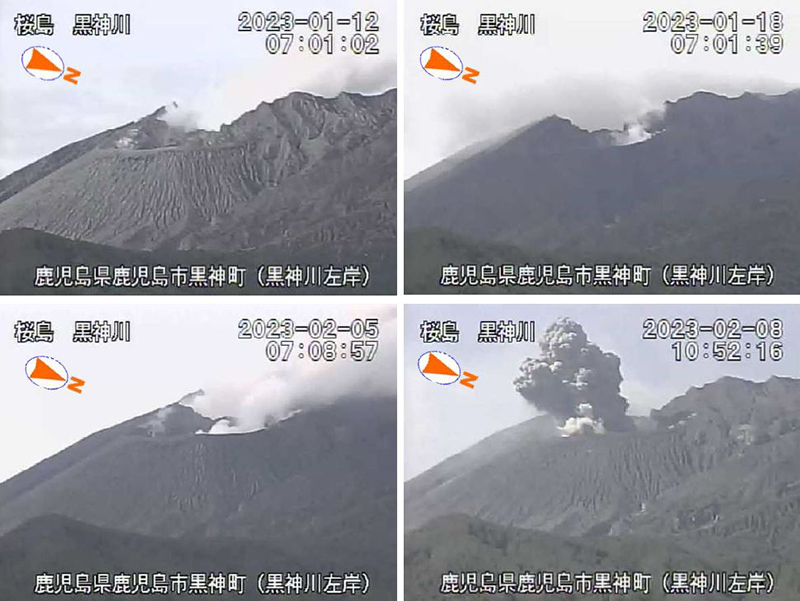
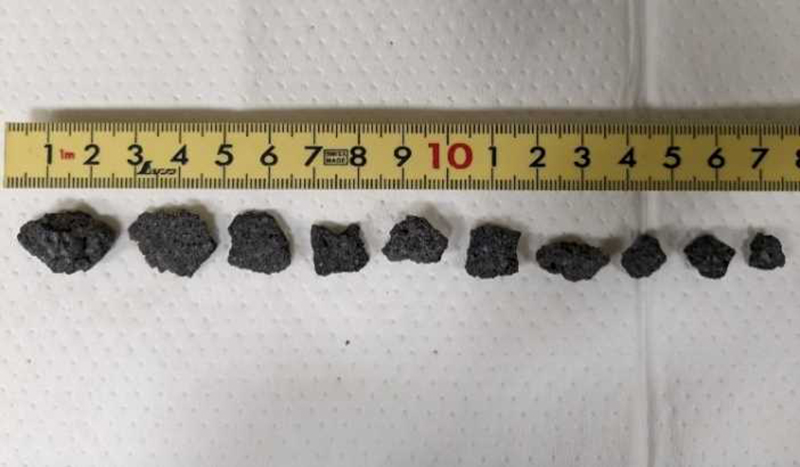
There were 26 eruptions reported during February, 11 of which were explosion events. Eruption plumes rose 2.4 km above the crater rim. Large blocks were ejected 800-1,100 m from the Minamidake summit crater, and daily nighttime crater incandescence continued. Occasional eruptive activity was observed in the Showa crater starting on 8 February, which included four eruptions (figure 142). The last time activity was reported in the Showa crater was early April 2018, according to JMA. There were 130 volcanic earthquakes detected during the month. Sulfur dioxide emissions ranged from 1,900-3,500 t/d. On 8 February large blocks were ejected 300-500 m from the Showa crater and an accompanying eruption plume rose 1.5 km above the crater rim. Summit crater incandescence was also visible at night during 8 and 21-26 February at the Showa crater. Weak crater incandescence was also reported on 8 February at the Minamidake summit crater. Explosions were recorded at 1815 on 9 February, at 1007 on 11 February, at 1448 on 14 February, at 0851 on 16 February, at 0206 on 19 February, at 2025 on 20 February, at 0937 and at 1322 on 21 February, and at 0558 on 28 February. Volcanic plumes rose 300-2,000 m above the Minamidake crater and drifted N, E, S, SE, and NE. An explosion at 1448 on 14 February at the Minamidake summit crater ejected large blocks 800-1,100 m from the crater. The eruption plume rose 800-1,200 m above the crater and drifted S. A field survey conducted on 14 February showed that the ejected volcanic clasts measured up to 3 cm in diameter, though most were smaller in size, and were deposited in Arimura, Kagoshima City (3 km SE) (figure 143). An aerial survey conducted by the Japan Maritime Self-Defense Force Air Group (JMSDF) on 21 February confirmed white gas-and-steam plumes rising from the N side of the Showa crater and water was visible at the bottom of the crater. Ashfall measurements showed that a total of 6 g/m2 fell over seven days during the month at the Kagoshima Local Metrological Observatory.
During March, 22 eruptions were reported, eight of which were explosion events. Volcanic plumes rose 2.8 km above the crater rim. There were four eruptions recorded at the Showa crater, for a total of eight eruptions during February and March. Large volcanic blocks were ejected 1,000-1,300 m from the Minamidake crater and nighttime incandescence remained visible at night, based on webcam images. Blocks ejected from the Showa crater traveled 500-800 m and accompanying eruption plumes rose 2.7 km above the crater rim. Nighttime crater incandescence was reported during 4-5 March at the Showa crater, based on webcam images. Seismicity included 97 volcanic earthquakes detected throughout the month. According to the Kagoshima Local Meteorological Observatory, a total of 9 g/m2 ashfall was observed over six days of the month. A field survey reported that 2,100-3,500 t/d of sulfur dioxide was released during the month. An eruption was detected at the Showa crater at 1404 on 6 March, that ejected blocks 500-800 m from the crater, accompanied by an eruption plume that rose 2.7 km above the crater rim (figure 144). Explosions were detected at 0116 on 3 March, at 2157 on 4 March, at 1322 on 8 March, at 2228 on 11 March, at 0418 on 14 March, and at 0035 on 22 March. Eruption plumes rose 1-2.8 km above the Minamidake crater and drifted SE, NE, NW, S, and SW. At 0035 on 22 March an explosion generated an eruption plume that rose 1.2 km above the Minamidake crater and drifted SW. Material was ejected 1-1.3 km from the Minamidake crater.
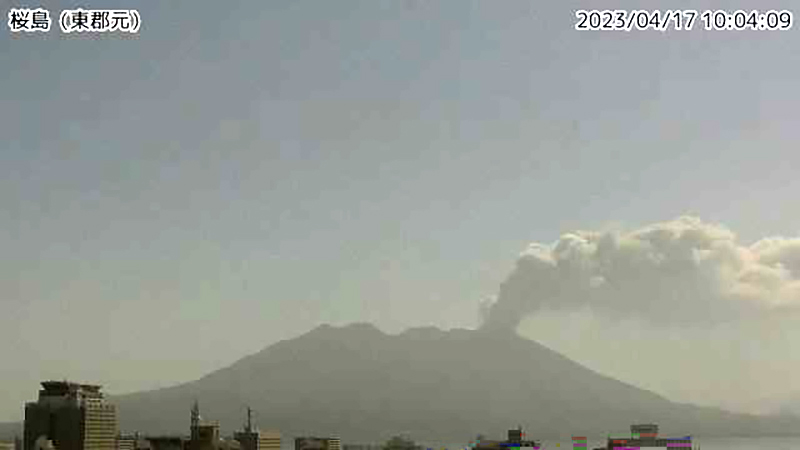
Two eruption events were reported in the Minamidake summit crater during April, neither of which were explosions; no eruptions occurred at the Showa crater. Eruption plumes rose 1.5 km above the crater rim and nighttime crater incandescence persisted nightly at the Minamidake crater. The number of volcanic earthquakes deceased to 38 and according to the Kagoshima Local Meteorological Observatory, a total of 3 g/m2 of ash fell over a period of four days during the month. The amount of sulfur dioxide released during the month ranged 1,800-2,700 t/d. An eruption event at 0955 on 17 April generated an eruption plume that rose 1.5 km above the crater rim (figure 145).
Eruptive activity during May consisted of 17 eruptions, 10 of which were explosion events. Volcanic plumes rose 2.3 km above the crater rim and large ejecta traveled 800-1,100 m from the Minamidake summit crater. Activity at the Showa crater was characterized by 11 eruption events and material was ejected 300-500 m from the crater. Nighttime crater incandescence was observed at both summit craters. The number of monthly volcanic earthquakes increased to 88 and the amount of ashfall recorded was 10 g/m2 over a period of 13 days during the month. According to a field survey, the amount of sulfur dioxide released ranged 1,800-3,900 t/d.
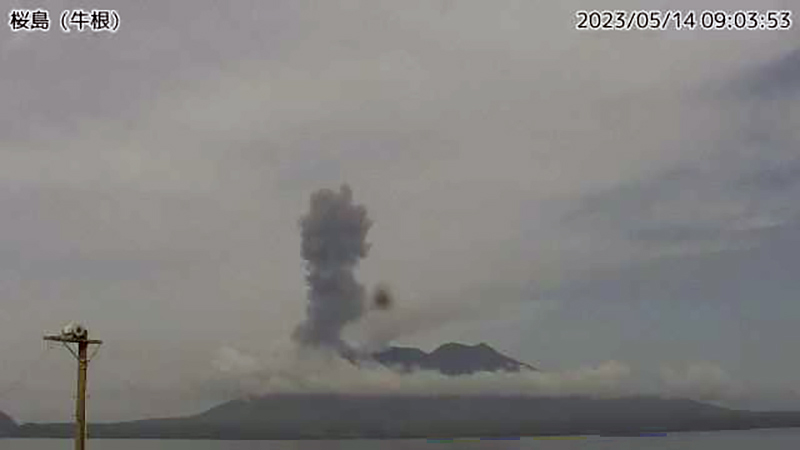
Explosions were recorded at 0422 on 2 May, at 0241 and at 1025 on 3 May, at 1315 on 9 May, at 2027 on 17 May, at 0610 on 24 May, at 1327 on 25 May, at 0647 and 1441 on 26 May, and at 1520 on 28 May. Resulting eruption plumes rose 400-1,800 m above the Minamidake crater and drifted SW, W, and N. On 14 May an eruption plume was visible above the Showa crater at 0859 that rose 1.7 km above the crater rim (figure 146). An eruption event at the Minamidake summit crater occurred at 1327 on 25 May; the eruption plume rose 2.3 km above the crater rim (figure 147).
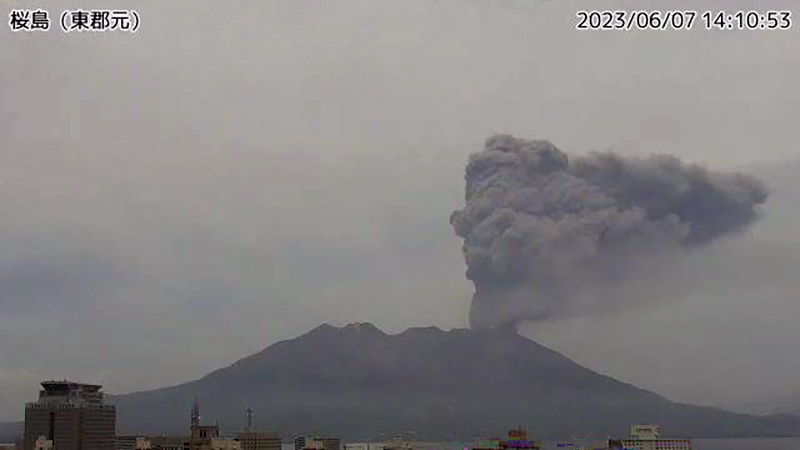
JMA reported four eruptions occurred during June, two of which were explosion events. Eruption plumes rose as high as 2.5 km above the Minamidake crater rim and large volcanic blocks were ejected 500-700 m from the crater rim. At the Showa crater, seven eruptions occurred, one of which was an explosion event. Eruption plumes rose 1.5 km above the Showa crater rim and large material was ejected 500 m from the crater rim. Nighttime incandescence was reported for both summit craters. There were 73 volcanic earthquakes detected during the month and a total of 3 g/m2 of ashfall during eight days of the month. According to a field survey, the amount of sulfur dioxide emissions released ranged 1,400-1,900 t/d. On 5 June at 0012 an explosion generated an eruption plume that rose 400-1,000 m above the Minamidake crater and drifted SE. An explosion at the Minamidake crater occurred at 1401 on 7 June that generated an eruption plume that rose 2.5 km above the crater and drifted SE (figure 148). A single explosion was reported at the Showa crater at 0438 on 22 June. The eruption plume rose 600 m above the crater rim and large blocks were ejected 500 m from the crater rim. This is the first report of an explosion at the Showa crater since October 2017, according to JMA.
Geologic Background. The Aira caldera in the northern half of Kagoshima Bay contains the post-caldera Sakurajima volcano, one of Japan's most active. Eruption of the voluminous Ito pyroclastic flow accompanied formation of the 17 x 23 km caldera about 22,000 years ago. The smaller Wakamiko caldera was formed during the early Holocene in the NE corner of the caldera, along with several post-caldera cones. The construction of Sakurajima began about 13,000 years ago on the southern rim and built an island that was joined to the Osumi Peninsula during the major explosive and effusive eruption of 1914. Activity at the Kitadake summit cone ended about 4,850 years ago, after which eruptions took place at Minamidake. Frequent eruptions since the 8th century have deposited ash on the city of Kagoshima, located across Kagoshima Bay only 8 km from the summit. The largest recorded eruption took place during 1471-76.
Information Contacts: Japan Meteorological Agency (JMA), 1-3-4 Otemachi, Chiyoda-ku, Tokyo 100-8122, Japan (URL: http://www.jma.go.jp/jma/indexe.html); MIROVA (Middle InfraRed Observation of Volcanic Activity), a collaborative project between the Universities of Turin and Florence (Italy) supported by the Centre for Volcanic Risk of the Italian Civil Protection Department (URL: http://www.mirovaweb.it/); Copernicus Browser, Copernicus Data Space Ecosystem, European Space Agency (URL: https://dataspace.copernicus.eu/browser/).
Suwanosejima (Japan) — July 2023  Cite this Report
Suwanosejima
Japan
29.638°N, 129.714°E; summit elev. 796 m
All times are local (unless otherwise noted)
Frequent eruption plumes, explosions, and incandescent ejecta during January-June 2023
Suwanosejima is located in the northern Ryukyu Islands, Japan, and is an 8-km-long island that consists of a stratovolcano and two active summit craters. Volcanism during the 20th century is characterized by Strombolian explosions, ash plumes, and ashfall. The current eruption began in October 2004 and has more recently consisted of intermittent explosions, eruption plumes, ashfall, and incandescent ejecta (BGVN 48:01). Similar activity continued during this reporting period of January through June 2023, based on monthly report from the Japan Meteorological Agency (JMA) and satellite data.
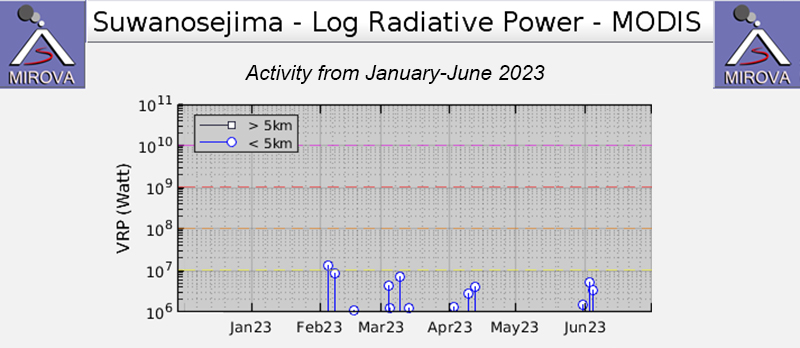
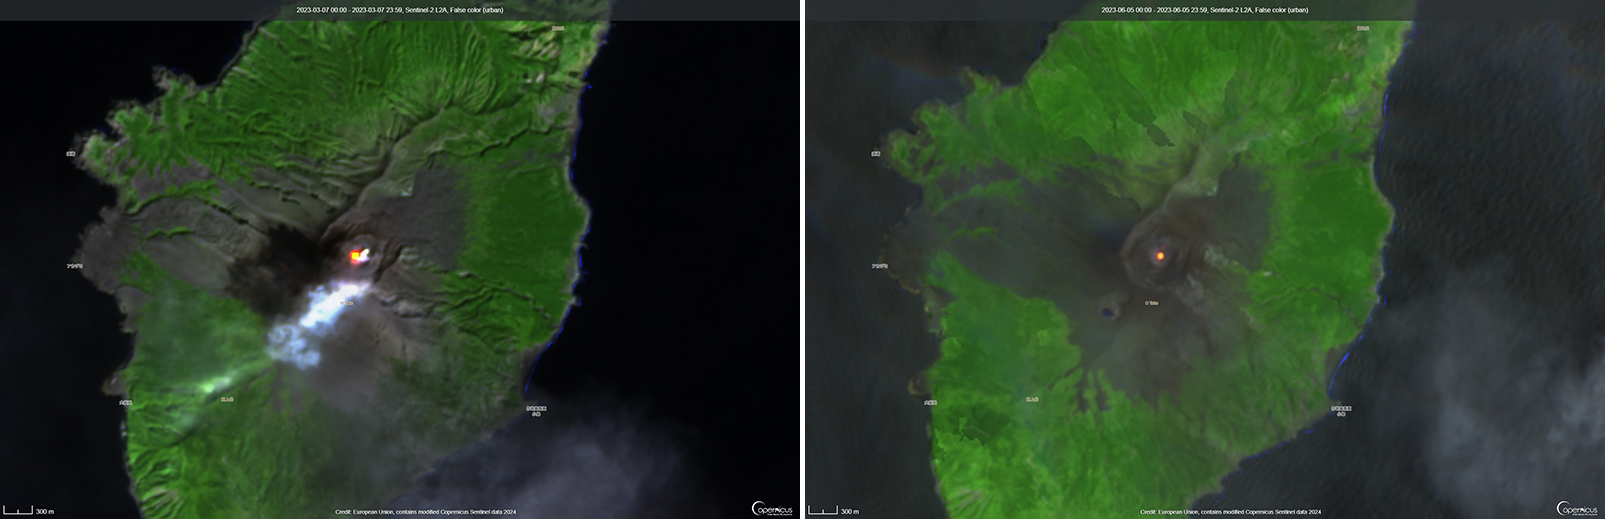
The MIROVA (Middle InfraRed Observation of Volcanic Activity) Log Radiative Power graph of the MODIS thermal anomaly data showed low thermal activity throughout the reporting period (figure 76). Three anomalies were detected during February, four during March, three during April, one during late May, and two during early June. A single thermal hotspot was detected by the MODVOLC thermal alerts system on the NE flank on 7 February. There were only two clear weather days in infrared satellite imagery that showed a thermal anomaly on 7 March and 5 June (figure 77).
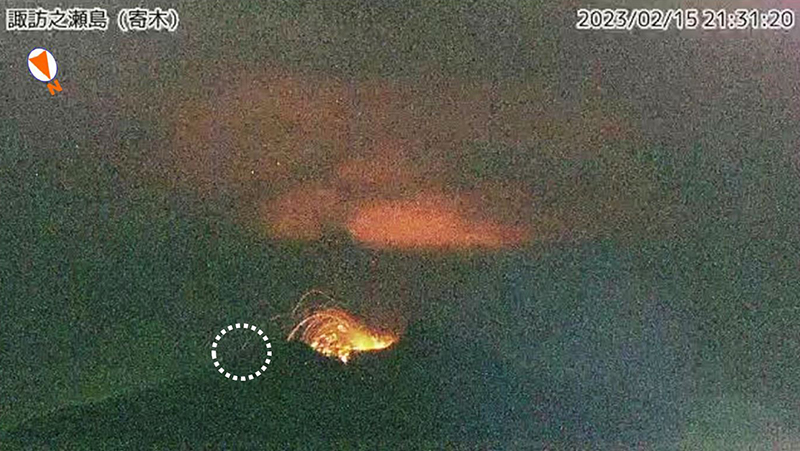
Activity in the Otake crater during January 2023 was relatively low, which prompted JMA to lower the Volcano Alert Level (VAL) from 3 to 2 (on a 5-level scale) on 24 January. The number of explosions recorded during the month was 13. There were 50 volcanic earthquakes detected on the W side of the island, which was roughly comparable to December (44), although near the Otake crater, there were 188 earthquakes recorded, which excluded earthquakes associated with explosions. An aerial overflight conducted on 11 January by the Japan Maritime Self-Defense Force Air Group (JMSDF) reported a gray-white plume rising from the Otake crater. During 26-30 January there was a brief increase in the number of explosions. An eruption at 0331 on 26 January generated an eruption plume that rose 1.7 km above the crater rim and ejected large blocks 400 m S from the crater. Nighttime crater incandescence was visible in a highly sensitive surveillance camera starting on 26 January. According to the Toshima Village Office, Suwanosejima Branch Office, ashfall was occasionally observed in the village (3.5 km SSW). According to observations conducted by the University of Tokyo Graduate School of Science, Kyoto University Disaster Prevention Research Institute, Toshima Village, and JMA, the amount of sulfur dioxide emissions released during the month was 200-600 tons per day (t/d).
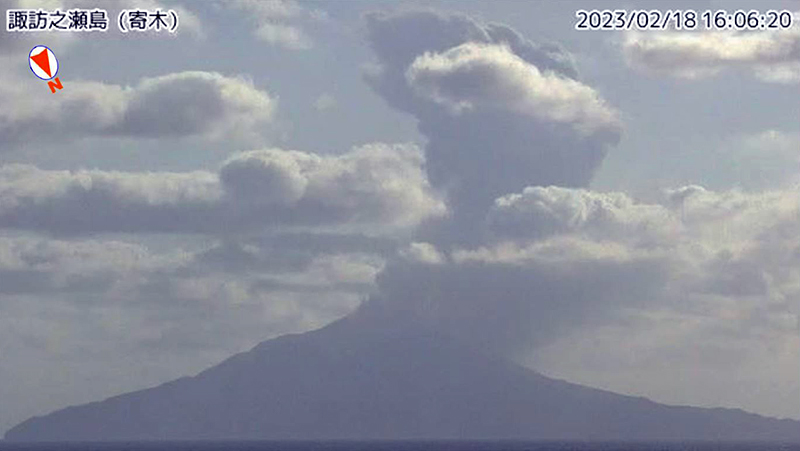
Eruptive activity in the Otake crater continued during February; the total number of explosions increased during this month from 13 to 56. There were 119 volcanic earthquakes detected on the W side of the island and 449 near the Otake crater, excluding earthquakes associated with explosions. During 15-21 February there was a brief increase in the number of explosions, and large blocks were ejected as far as 1 km from the crater. An explosion at 2131 on 15 March ejected material 900 m SE (figure 78). Eruptions on 18 and 27 February generated plumes that rose 2 km above the crater (figure 79). By 21 February the number of explosions reached 42, though no large-scale volcanic earthquakes were reported. Nighttime crater incandescence continued from late January through February. Ashfall was also occasionally observed in Toshima Village. The amount of sulfur dioxide emissions released during the month was 700 t/d.
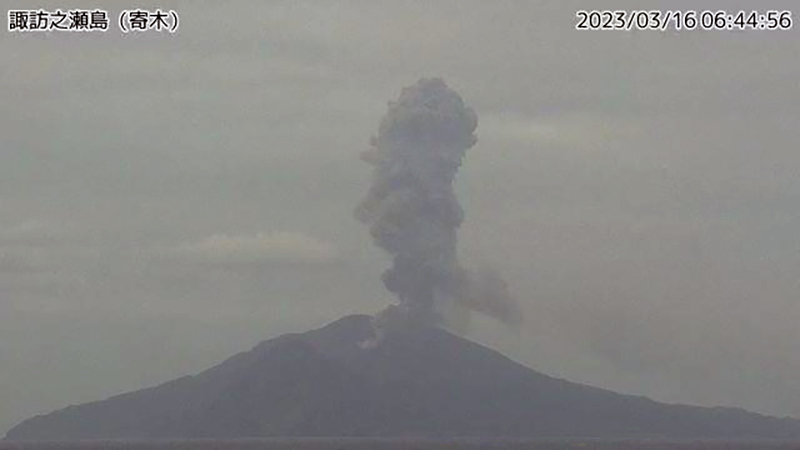
The number of explosions at the Otake crater increased during 2-5 March; 28 explosions were detected during this time. Large volcanic blocks were ejected 500 m from the crater. As a result, the VAL was increased to 3 on 5 March. There were 65 explosions recorded throughout the month. On the W side of the island, 63 volcanic earthquakes were reported, and closer to the Otake crater, 422 were detected, excluding earthquakes associated with explosions. Nighttime crater incandescence continued, as well as occasional ashfall in Toshima Village. On 16 March an eruption produced a volcanic plume that rose 2.4 km above the crater rim (figure 80). The amount of sulfur dioxide emissions released during the month was 200-1,100 t/d.
Eruptive activity continued at the Otake crater during April. Eruption plumes rose as high as 2 km above the crater rim and large blocks were ejected as far as 500 m from the crater. The number of explosions decreased to one throughout the month, although nighttime crater incandescence remained visible in the surveillance camera. Rumbling and ashfall continued intermittently in Toshima Village. There were 32 volcanic earthquakes detected, and 129 volcanic earthquakes near the Otake crater, not including those associated with explosions. According to JMA, the amount of sulfur dioxide released during the month was 200-1,400 t/d. On 16 April at 0402 an eruption ejected incandescent material 500 m S from the crater.
Activity continued at the Otake crater in May. An eruption plume rose 1.8 km above the crater rim and large volcanic blocks were ejected 300 m from the crater. The number of explosions remained low throughout the month (7) and nighttime crater incandescence persisted. Occasional ashfall was reported in Toshima Village. As many as 44 volcanic earthquakes were recorded on the W side of the island, and 205 were recorded closer to the Otake crater, which was higher compared to the previous month. Generally, the amount of sulfur dioxide released during the month ranged 400-700 t/d, but on 19 May the amount increased to 2,600 t/d. On 16 May an eruption produced a volcanic plume that rose 1.8 km above the crater rim.
Eruptive activity was relatively low in June; the number of explosions generally decreased and on 9 June the VAL was lowered to 2. Nighttime crater incandescence continued, and according to the Toshima Village Office, rumbling and ashfall were also noted occasionally. There were 31 explosions throughout the month and 28 volcanic earthquakes detected on the W side of the island and as many as 722 volcanic earthquakes were recorded near the Otake crater. During 13-19 June, JMA reported a brief increase in the number of explosions. On 15 June at 2200 an eruption generated a volcanic plume that rose 2 km above the crater rim. An eruption on 16 June at 2147 ejected material 400 m SE from the crater. The amount of sulfur dioxide emitted was relatively low, at 100 t/d on 27 June.
Geologic Background. The 8-km-long island of Suwanosejima in the northern Ryukyu Islands consists of an andesitic stratovolcano with two active summit craters. The summit is truncated by a large breached crater extending to the sea on the E flank that was formed by edifice collapse. One of Japan's most frequently active volcanoes, it was in a state of intermittent Strombolian activity from Otake, the NE summit crater, between 1949 and 1996, after which periods of inactivity lengthened. The largest recorded eruption took place in 1813-14, when thick scoria deposits covered residential areas, and the SW crater produced two lava flows that reached the western coast. At the end of the eruption the summit of Otake collapsed, forming a large debris avalanche and creating an open collapse scarp extending to the eastern coast. The island remained uninhabited for about 70 years after the 1813-1814 eruption. Lava flows reached the eastern coast of the island in 1884. Only about 50 people live on the island.
Information Contacts: Japan Meteorological Agency (JMA), 1-3-4 Otemachi, Chiyoda-ku, Tokyo 100-8122, Japan (URL: http://www.jma.go.jp/jma/indexe.html); MIROVA (Middle InfraRed Observation of Volcanic Activity), a collaborative project between the Universities of Turin and Florence (Italy) supported by the Centre for Volcanic Risk of the Italian Civil Protection Department (URL: http://www.mirovaweb.it/); Hawai'i Institute of Geophysics and Planetology (HIGP) - MODVOLC Thermal Alerts System, School of Ocean and Earth Science and Technology (SOEST), Univ. of Hawai'i, 2525 Correa Road, Honolulu, HI 96822, USA (URL: http://modis.higp.hawaii.edu/); Copernicus Browser, Copernicus Data Space Ecosystem, European Space Agency (URL: https://dataspace.copernicus.eu/browser/).
Semeru
Indonesia
8.108°S, 112.922°E; summit elev. 3657 m
All times are local (unless otherwise noted)
Ash plumes, incandescent avalanches, and pyroclastic flows during January-June 2023
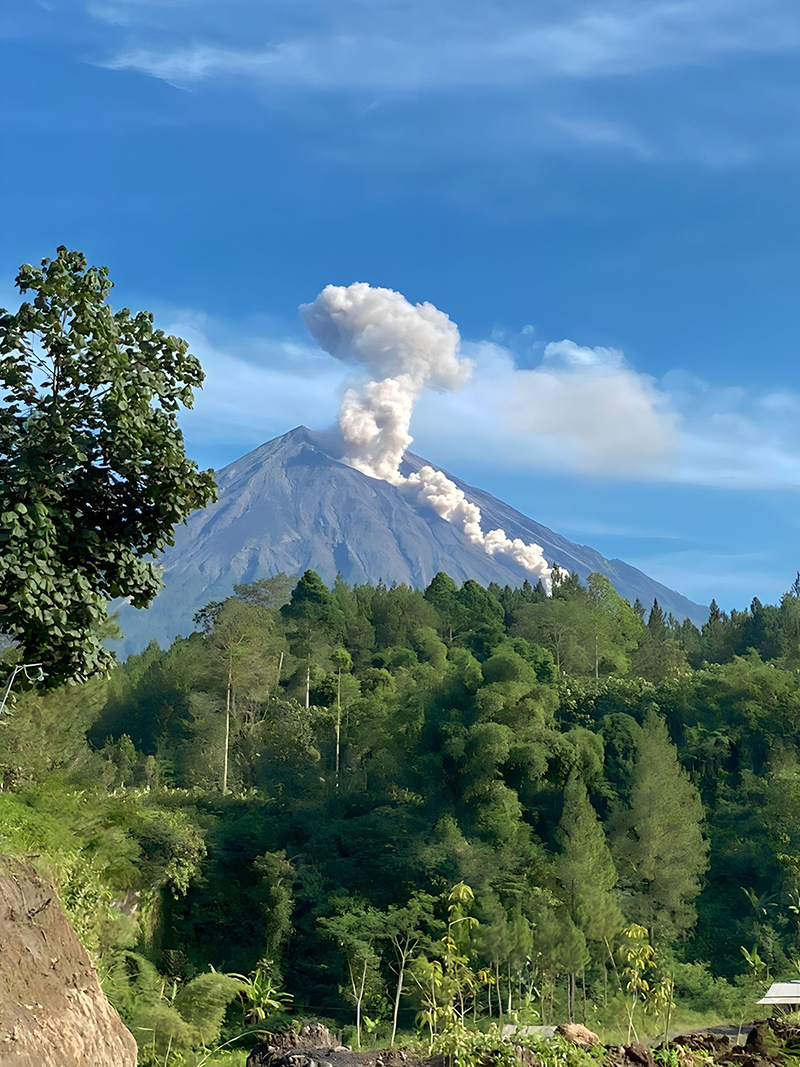
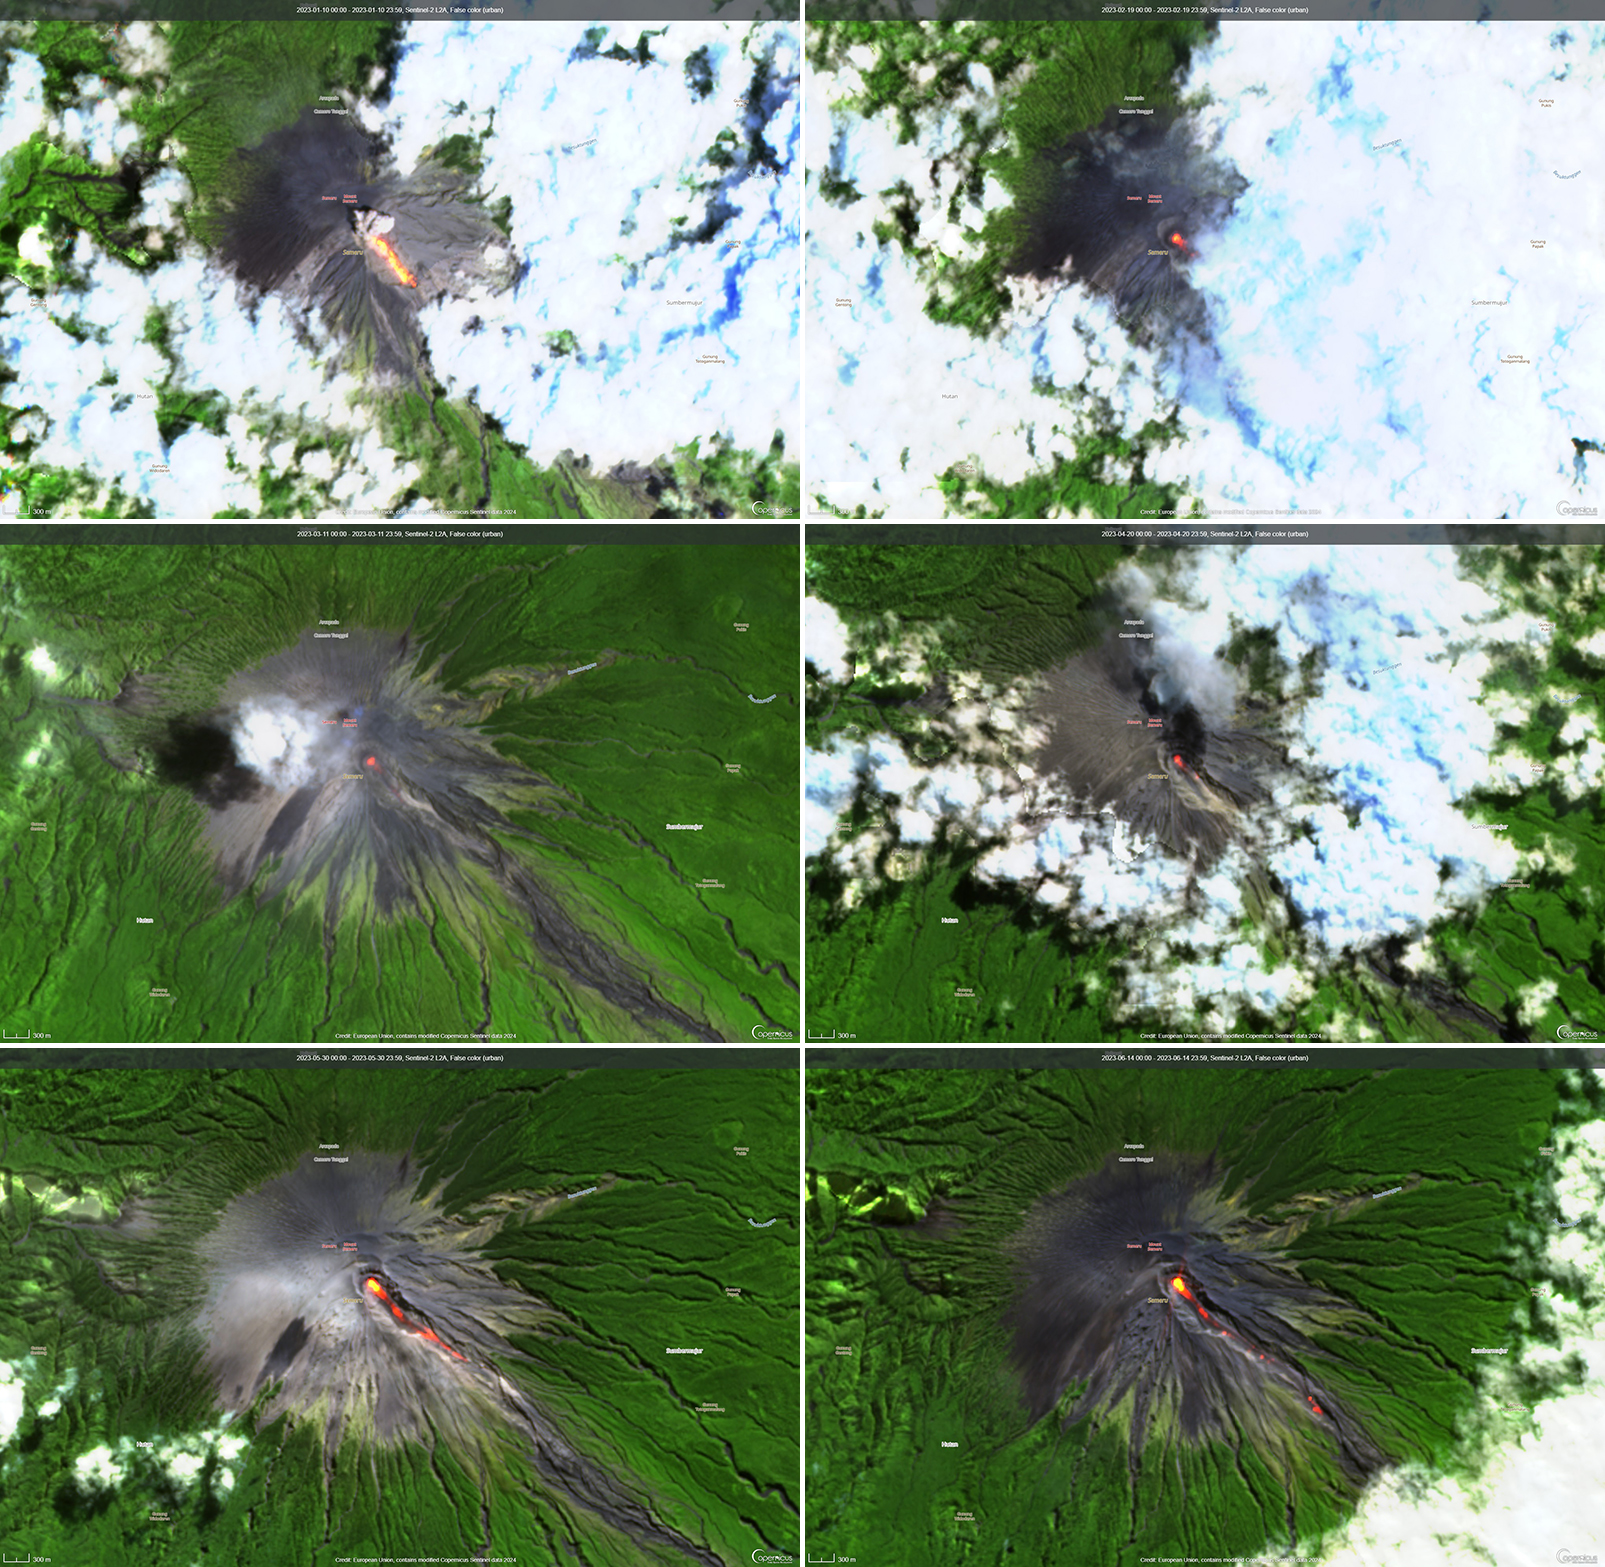
Semeru contains the active Jonggring-Seloko vent at the Mahameru summit and is located in East Java, Indonesia. Frequent 19th and 20th century eruptions were dominated by small-to-moderate explosions from the summit crater, with occasional lava flows and larger explosive eruptions accompanied by pyroclastic flows that have reached the lower flanks of the volcano. The current eruption began in June 2017 and more recently has been characterized by intermittent gas-and-ash plumes and incandescent avalanches (BGVN 48:01). This report updates activity such as ash plumes, incandescent avalanches, and pyroclastic flows from January through June 2023, based on information from daily, VONA, and special reports from the Pusat Vulkanologi dan Mitigasi Bencana Geologi (PVMBG, also known as Indonesian Center for Volcanology and Geological Hazard Mitigation, CVGHM), MAGMA Indonesia, and various satellite data.
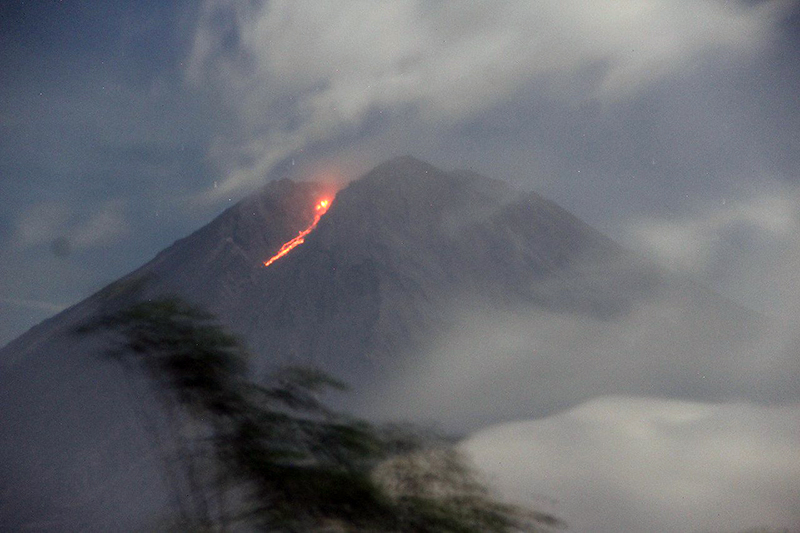
Activity during January and February mainly consisted of frequent ash plumes and white-and-gray emissions. The ash plumes during January rose 200-1,000 m above the crater and drifted in different directions. The white-and-gray emissions rose 200-1,000 m above the crater. A photo was posted on social media that showed an incandescent lava flow extending 500 m from the summit crater on the SE flank at 0027 on 8 January (figure 83). Video posted to social media on 5 February showed a pyroclastic flow descending the SE flank and ash plumes rising along the path and drifting N. Ash plumes rose 1 km above the crater at 0802 on 13 January, at 0536 on 17 January, at 0628 on 19 January and drifted SW, W, and SE, respectively. White, gray, and brown emissions were reported on 15 and 17 January that rose 300-1,000 m above the crater. During February, ash plumes rose 200-1,500 m above the crater and drifted mainly N and NE. White-and-gray emissions rose 100-1,000 m above the crater.
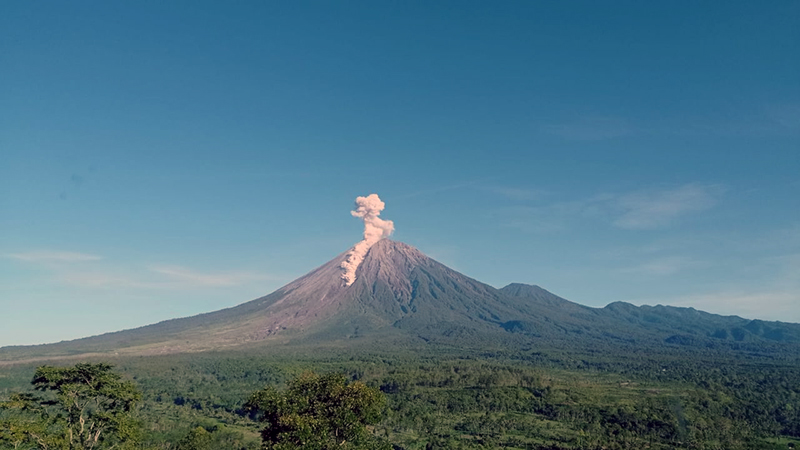
Similar activity consisting of frequent ash plumes and gas-and-steam emissions continued through March and April. During March, ash plumes rose 300-1,200 m above the crater and drifted in multiple directions. On 25 March at 0738 an ash plume rose 1.2 km above the crater and drifted SE. Occasional white-and-gray emissions rose 50-1,000 m above the crater. Ash plumes in April rose 400-1,200 m above the crater and drifted in different directions. An ash plume on 3 April rose 1.2 km above the crater and drifted SE and S at 0538. On 8 April a photo and videos were posted on social media showing a pyroclastic flow moving 1.5 km down the SE flank, accompanied by an ash plume (figure 84). New material was deposited along the crater, according to a local news source. Another pyroclastic flow occurred at 0710 on 18 April that descended up to 2 km from the crater to the SE (figure 85). White-and-gray emissions rose 100-800 m above the crater during April.
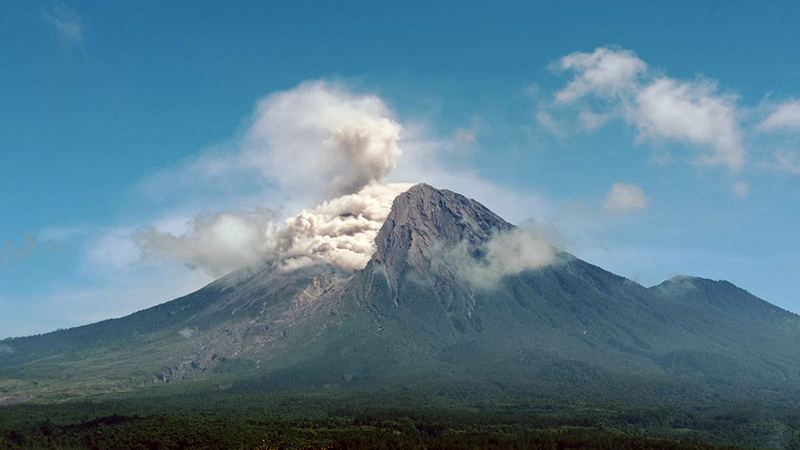
Ash plumes and white-and-gray emissions persisted during May and June. During May, ash plumes rose 300-1,200 m above the crater and drifted generally N and S. On 13 May around 1012 a pyroclastic flow was observed moving 1.5 km down the SE flank, accompanied by an ash plume (figure 86). On 27 May an ash plume rose 1.2 km above the crater and drifted S and SW at 0819. White-and-gray emissions rose 100-800 m above the crater. Ash plumes during June rose 200-1,500 m above the crater and generally drifted N and SW. A webcam image showed incandescent material at the summit and on the flanks at 0143 on 23 June that traveled 3.5 km. According to a local news source, a pyroclastic flow traveled 5 km down the SE flank at 1910 on 26 June; the accompanying an ash plume rose as high as 1.5 km above the crater and drifted NE and E. Dominantly white gas-and-steam emissions rose 50-300 m above the crater.
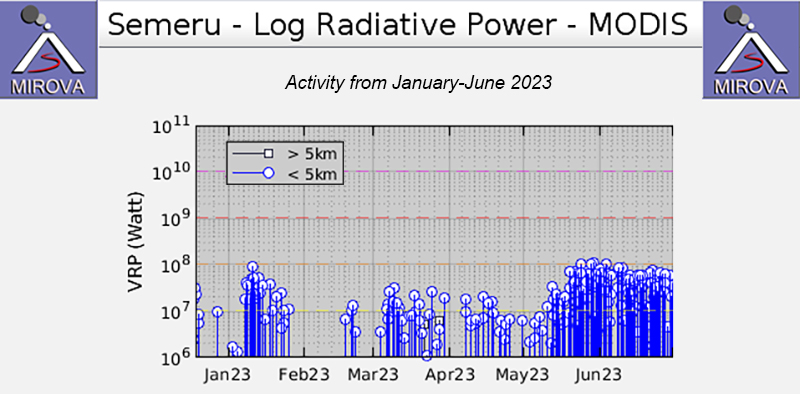
MIROVA (Middle InfraRed Observation of Volcanic Activity) analysis of MODIS satellite data showed frequent and moderate-power thermal anomalies during January through June 2023 (figure 87). There was a short gap in activity during late January through late February, followed by low-power and less frequent anomalies through April. During mid-May, there was an increase in both power and frequency of the anomalies. A total of 73 thermal hotspots were detected, based on data from the MODVOLC thermal algorithm. There were 10 detected in January, four in March, two in April, 17 in May, and 40 in June. Infrared satellite images showed persistent thermal activity at the summit crater during the reporting period; strong incandescent avalanches of material were occasionally captured in these images and affected the SE flank (figure 88).
Geologic Background. Semeru, the highest volcano on Java, and one of its most active, lies at the southern end of a volcanic massif extending north to the Tengger caldera. The steep-sided volcano, also referred to as Mahameru (Great Mountain), rises above coastal plains to the south. Gunung Semeru was constructed south of the overlapping Ajek-ajek and Jambangan calderas. A line of lake-filled maars was constructed along a N-S trend cutting through the summit, and cinder cones and lava domes occupy the eastern and NE flanks. Summit topography is complicated by the shifting of craters from NW to SE. Frequent 19th and 20th century eruptions were dominated by small-to-moderate explosions from the summit crater, with occasional lava flows and larger explosive eruptions accompanied by pyroclastic flows that have reached the lower flanks of the volcano.
Information Contacts: Pusat Vulkanologi dan Mitigasi Bencana Geologi (PVMBG, also known as Indonesian Center for Volcanology and Geological Hazard Mitigation, CVGHM), Jalan Diponegoro 57, Bandung 40122, Indonesia (URL: http://www.vsi.esdm.go.id/); MAGMA Indonesia, Kementerian Energi dan Sumber Daya Mineral (URL: https://magma.esdm.go.id/v1); Badan Nasional Penanggulangan Bencana (BNPB), National Disaster Management Agency, Graha BNPB - Jl. Scout Kav.38, East Jakarta 13120, Indonesia (URL: http://www.bnpb.go.id/); MIROVA (Middle InfraRed Observation of Volcanic Activity), a collaborative project between the Universities of Turin and Florence (Italy) supported by the Centre for Volcanic Risk of the Italian Civil Protection Department (URL: http://www.mirovaweb.it/); Hawai'i Institute of Geophysics and Planetology (HIGP) - MODVOLC Thermal Alerts System, School of Ocean and Earth Science and Technology (SOEST), Univ. of Hawai'i, 2525 Correa Road, Honolulu, HI 96822, USA (URL: http://modis.higp.hawaii.edu/); Copernicus Browser, Copernicus Data Space Ecosystem, European Space Agency (URL: https://dataspace.copernicus.eu/browser/); Info Semeru (Twitter: @info_semeru, https://twitter.com/info_semeru).
Manam (Papua New Guinea) — July 2023 Cite this Report
Manam
Papua New Guinea
4.08°S, 145.037°E; summit elev. 1807 m
All times are local (unless otherwise noted)
Few ash plumes during November-December 2022
Manam is a 10-km-wide island that consists of two active summit craters: the Main summit crater and the South summit crater and is located 13 km off the northern coast of mainland Papua New Guinea. Frequent mild-to-moderate eruptions have been recorded since 1616. The current eruption period began during June 2014 and has more recently been characterized by intermittent ash plumes and thermal activity (BGVN 47:11). This report updates activity that occurred from November 2022 through May 2023 based on information from the Darwin Volcanic Ash Advisory Center (VAAC) and various satellite data.
Ash plumes were reported during November and December 2022 by the Darwin VAAC. On 7 November an ash plume rose to 2.1 km altitude and drifted NE based on satellite images and weather models. On 14 November an ash plume rose to 2.1 km altitude and drifted W based on RVO webcam images. On 20 November ash plumes rose to 1.8 km altitude and drifted NW. On 26 December an ash plume rose to 3 km altitude and drifted S and SSE.
Intermittent sulfur dioxide plumes were detected using the TROPOMI instrument on the Sentinel-5P satellite, some of which exceeded at least two Dobson Units (DU) and drifted in different directions (figure 93). Occasional low-to-moderate power thermal anomalies were recorded by the MIROVA (Middle InfraRed Observation of Volcanic Activity) system; less than five anomalies were recorded each month during November 2022 through May 2023 (figure 94). Two thermal hotspots were detected by the MODVOLC thermal alerts system on 10 December 2022. On clear weather days, thermal activity was also captured in infrared satellite imagery in both the Main and South summit craters, accompanied by gas-and-steam emissions (figure 95).
Geologic Background. The 10-km-wide island of Manam, lying 13 km off the northern coast of mainland Papua New Guinea, is one of the country's most active volcanoes. Four large radial valleys extend from the unvegetated summit of the conical basaltic-andesitic stratovolcano to its lower flanks. These valleys channel lava flows and pyroclastic avalanches that have sometimes reached the coast. Five small satellitic centers are located near the island's shoreline on the northern, southern, and western sides. Two summit craters are present; both are active, although most observed eruptions have originated from the southern crater, concentrating eruptive products during much of the past century into the SE valley. Frequent eruptions, typically of mild-to-moderate scale, have been recorded since 1616. Occasional larger eruptions have produced pyroclastic flows and lava flows that reached flat-lying coastal areas and entered the sea, sometimes impacting populated areas.
Information Contacts: Rabaul Volcano Observatory (RVO), Geohazards Management Division, Department of Mineral Policy and Geohazards Management (DMPGM), PO Box 3386, Kokopo, East New Britain Province, Papua New Guinea; Darwin Volcanic Ash Advisory Centre (VAAC), Bureau of Meteorology, Northern Territory Regional Office, PO Box 40050, Casuarina, NT 0811, Australia (URL: http://www.bom.gov.au/info/vaac/); MIROVA (Middle InfraRed Observation of Volcanic Activity), a collaborative project between the Universities of Turin and Florence (Italy) supported by the Centre for Volcanic Risk of the Italian Civil Protection Department (URL: http://www.mirovaweb.it/); Hawai'i Institute of Geophysics and Planetology (HIGP) - MODVOLC Thermal Alerts System, School of Ocean and Earth Science and Technology (SOEST), Univ. of Hawai'i, 2525 Correa Road, Honolulu, HI 96822, USA (URL: http://modis.higp.hawaii.edu/); NASA Global Sulfur Dioxide Monitoring Page, Atmospheric Chemistry and Dynamics Laboratory, NASA Goddard Space Flight Center (NASA/GSFC), 8800 Greenbelt Road, Goddard, Maryland, USA (URL: https://so2.gsfc.nasa.gov/); Copernicus Browser, Copernicus Data Space Ecosystem, European Space Agency (URL: https://dataspace.copernicus.eu/browser/).
Krakatau (Indonesia) — July 2023 Cite this Report
Krakatau
Indonesia
6.1009°S, 105.4233°E; summit elev. 285 m
All times are local (unless otherwise noted)
Strombolian activity and ash plumes during November 2022-April 2023
Krakatau is located in the Sunda Strait between Java and Sumatra, Indonesia. Caldera collapse during the catastrophic 1883 eruption destroyed Danan and Perbuwatan cones and left only a remnant of Rakata. The post-collapse cone of Anak Krakatau (Child of Krakatau) was constructed within the 1883 caldera at a point between the former Danan and Perbuwatan cones; it has been the site of frequent eruptions since 1927. The current eruption period began in May 2021 and has recently consisted of explosions, ash plumes, and thermal activity (BGVN 47:11). This report covers activity during November 2022 through April 2023 based on information provided by the Indonesian Center for Volcanology and Geological Hazard Mitigation, referred to as Pusat Vulkanologi dan Mitigasi Bencana Geologi (PVMBG), MAGMA Indonesia, the Darwin Volcanic Ash Advisory Center (VAAC), and several sources of satellite data.
Activity was relatively low during November and December 2022. Daily white gas-and-steam plumes rose 25-100 m above the summit and drifted in different directions. Gray ash plumes rose 200 m above the summit and drifted NE at 1047 and at 2343 on 11 November. On 14 November at 0933 ash plumes rose 300 m above the summit and drifted E. An ash plume was reported at 0935 on 15 December that rose 100 m above the summit and drifted NE. An eruptive event at 1031 later that day generated an ash plume that rose 700 m above the summit and drifted NE. A gray ash plume at 1910 rose 100 m above the summit and drifted E. Incandescent material was ejected above the vent based on an image taken at 1936.
During January 2023 daily white gas-and-steam plumes rose 25-300 m above the summit and drifted in multiple directions. Gray-to-brown ash plumes were reported at 1638 on 3 January, at 1410 and 1509 on 4 January, and at 0013 on 5 January that rose 100-750 m above the summit and drifted NE and E; the gray-to-black ash plume at 1509 on 4 January rose as high as 3 km above the summit and drifted E. Gray ash plumes were recorded at 1754, 2241, and 2325 on 11 January and at 0046 on 12 January and rose 200-300 m above the summit and drifted NE. Toward the end of January, PVMBG reported that activity had intensified; Strombolian activity was visible in webcam images taken at 0041, 0043, and 0450 on 23 January. Multiple gray ash plumes throughout the day rose 200-500 m above the summit and drifted E and SE (figure 135). Webcam images showed progressively intensifying Strombolian activity at 1919, 1958, and 2113 on 24 January; a gray ash plume at 1957 rose 300 m above the summit and drifted E (figure 135). Eruptive events at 0231 and 2256 on 25 January and at 0003 on 26 January ejected incandescent material from the vent, based on webcam images. Gray ash plumes observed during 26-27 January rose 300-500 m above the summit and drifted NE, E, and SE.
Low levels of activity were reported during February and March. Daily white gas-and-steam plumes rose 25-300 m above the summit and drifted in different directions. The Darwin VAAC reported that continuous ash emissions rose to 1.5-1.8 km altitude and drifted W and NW during 1240-1300 on 10 March, based on satellite images, weather models, and PVMBG webcams. White-and-gray ash plumes rose 500 m and 300 m above the summit and drifted SW at 1446 and 1846 on 18 March, respectively. An eruptive event was recorded at 2143, though it was not visible due to darkness. Multiple ash plumes were reported during 27-29 March that rose as high as 2.5 km above the summit and drifted NE, W, and SW (figure 136). Webcam images captured incandescent ejecta above the vent at 0415 and around the summit area at 2003 on 28 March and at 0047 above the vent on 29 March.
Daily white gas-and-steam plumes rose 25-300 m above the summit and drifted in multiple directions during April and May. White-and-gray and black plumes rose 50-300 m above the summit on 2 and 9 April. On 11 May at 1241 a gray ash plume rose 1-3 km above the summit and drifted SW. On 12 May at 0920 a gray ash plume rose 2.5 km above the summit and drifted SW and at 2320 an ash plume rose 1.5 km above the summit and drifted SW. An accompanying webcam image showed incandescent ejecta. On 13 May at 0710 a gray ash plume rose 2 km above the summit and drifted SW (figure 137).
The MIROVA (Middle InfraRed Observation of Volcanic Activity) graph of MODIS thermal anomaly data showed intermittent low-to-moderate power thermal anomalies during November 2022 through April 2023 (figure 138). Some of this thermal activity was also visible in infrared satellite imagery at the crater, accompanied by gas-and-steam and ash plumes that drifted in different directions (figure 139).
Geologic Background. The renowned Krakatau (frequently mis-named as Krakatoa) volcano lies in the Sunda Strait between Java and Sumatra. Collapse of an older edifice, perhaps in 416 or 535 CE, formed a 7-km-wide caldera. Remnants of that volcano are preserved in Verlaten and Lang Islands; subsequently the Rakata, Danan, and Perbuwatan cones were formed, coalescing to create the pre-1883 Krakatau Island. Caldera collapse during the catastrophic 1883 eruption destroyed Danan and Perbuwatan, and left only a remnant of Rakata. This eruption caused more than 36,000 fatalities, most as a result of tsunamis that swept the adjacent coastlines of Sumatra and Java. Pyroclastic surges traveled 40 km across the Sunda Strait and reached the Sumatra coast. After a quiescence of less than a half century, the post-collapse cone of Anak Krakatau (Child of Krakatau) was constructed within the 1883 caldera at a point between the former Danan and Perbuwatan cones. Anak Krakatau has been the site of frequent eruptions since 1927.
Information Contacts: Pusat Vulkanologi dan Mitigasi Bencana Geologi (PVMBG, also known as Indonesian Center for Volcanology and Geological Hazard Mitigation, CVGHM), Jalan Diponegoro 57, Bandung 40122, Indonesia (URL: http://www.vsi.esdm.go.id/); MAGMA Indonesia, Kementerian Energi dan Sumber Daya Mineral (URL: https://magma.esdm.go.id/v1); Darwin Volcanic Ash Advisory Centre (VAAC), Bureau of Meteorology, Northern Territory Regional Office, PO Box 40050, Casuarina, NT 0811, Australia (URL: http://www.bom.gov.au/info/vaac/); MIROVA (Middle InfraRed Observation of Volcanic Activity), a collaborative project between the Universities of Turin and Florence (Italy) supported by the Centre for Volcanic Risk of the Italian Civil Protection Department (URL: http://www.mirovaweb.it/); Copernicus Browser, Copernicus Data Space Ecosystem, European Space Agency (URL: https://dataspace.copernicus.eu/browser/).
Stromboli
Italy
38.789°N, 15.213°E; summit elev. 924 m
All times are local (unless otherwise noted)
Strombolian explosions and lava flows continue during January-April 2023
Stromboli, located in Italy, has exhibited nearly constant lava fountains for the past 2,000 years; recorded eruptions date back to 350 BCE. Eruptive activity occurs at the summit from multiple vents, which include a north crater area (N area) and a central-southern crater (CS area) on a terrace known as the ‘terrazza craterica’ at the head of the Sciara del Fuoco, a large scarp that runs from the summit down the NW side of the volcano-island. Activity typically consists of Strombolian explosions, incandescent ejecta, lava flows, and pyroclastic flows. Thermal and visual monitoring cameras are located on the nearby Pizzo Sopra La Fossa, above the terrazza craterica, and at multiple flank locations. The current eruption period has been ongoing since 1934 and recent activity has consisted of frequent Strombolian explosions and lava flows (BGVN 48:02). This report updates activity during January through April 2023 primarily characterized by Strombolian explosions and lava flows based on reports from Italy's Istituto Nazionale di Geofisica e Vulcanologia (INGV) and various satellite data.
Frequent explosive activity continued throughout the reporting period, generally in the low-to-medium range, based on the number of hourly explosions in the summit crater (figure 253, table 16). Intermittent thermal activity was recorded by the MIROVA (Middle InfraRed Observation of Volcanic Activity) analysis of MODIS satellite data (figure 254). According to data collected by the MODVOLC thermal algorithm, a total of 9 thermal alerts were detected: one on 2 January 2023, one on 1 February, five on 24 March, and two on 26 March. The stronger pulses of thermal activity likely reflected lava flow events. Infrared satellite imagery captured relatively strong thermal hotspots at the two active summit craters on clear weather days, showing an especially strong event on 8 March (figure 255).
Table 16. Summary of type, frequency, and intensity of explosive activity at Stromboli by month during January-April 2023; information from webcam observations. Courtesy of INGV weekly reports.
| Month |
Explosive Activity |
| Jan 2023 |
Typical Strombolian activity with spattering and lava overflows in the N crater area. Explosions were reported from 4 vents in the N area and 1-2 vents in the CS area. The average hourly frequency of explosions was low-to-medium (1-12 events/hour). The intensity of the explosions varied from low (less than 80 m high) to medium (less than 150 m high) in the N crater area and up to high (greater than 150 m high) in the CS crater area. |
| Feb 2023 |
Typical Strombolian activity with spattering in the N crater area. Explosions were reported from 2-3 vents in the N area and 1-4 vents in the CS area. The average hourly frequency of explosions was low-to-medium (1-14 events/hour). The intensity of the explosions varied from low (less than 80 m high) to medium (less than 150 m high) in the N crater area and up to high (greater than 150 m high) in the CS crater area. |
| Mar 2023 |
Typical Strombolian activity with spattering and lava overflows in the N crater area. Explosions were reported from 2-3 vents in the N area and 2-4 vents in the CS area. The average hourly frequency of explosions was low-to-medium (1-18 events/hour). The intensity of the explosions varied from low (less than 80 m high) to medium (less than 150 m high) in the N crater area and up to high (greater than 150 m high) in the CS crater area. |
| Apr 2023 |
Typical Strombolian activity. Explosions were reported from 2 vents in the N area and 2-3 vents in the CS area. The average hourly frequency of explosions was low-to-high (1-16 events/hour). The intensity of the explosions varied from low (less than 80 m high) to medium (less than 150 m high) in both the N and CS crater areas. |
Activity during January-February 2023. Strombolian explosions were reported in the N crater area, as well as lava effusion. Explosive activity in the N crater area ejected coarse material (bombs and lapilli). Intense spattering was observed in both the N1 and N2 craters. In the CS crater area, explosions generally ejected fine material (ash), sometimes to heights greater than 250 m. The intensity of the explosions was characterized as low-to-medium in the N crater and medium-to-high in the CS crater. After intense spattering activity from the N crater area, a lava overflow began at 2136 on 2 January that flowed part way down the Sciara del Fuoco, possibly moving down the drainage that formed in October, out of view from webcams. The flow remained active for a couple of hours before stopping and beginning to cool. A second lava flow was reported at 0224 on 4 January that similarly remained active for a few hours before stopping and cooling. Intense spattering was observed on 11 and 13 January from the N1 crater. After intense spattering activity at the N2 crater at 1052 on 17 January another lava flow started to flow into the upper part of the Sciara del Fuoco (figure 256), dividing into two: one that traveled in the direction of the drainage formed in October, and the other one moving parallel to the point of emission. By the afternoon, the rate of the flow began to decrease, and at 1900 it started to cool. A lava flow was reported at 1519 on 24 January following intense spattering in the N2 area, which began to flow into the upper part of the Sciara del Fuoco. By the morning of 25 January, the lava flow had begun to cool. During 27 January the frequency of eruption in the CS crater area increased to 6-7 events/hour compared to the typical 1-7 events/hour; the following two days showed a decrease in frequency to less than 1 event/hour. Starting at 1007 on 30 January a high-energy explosive sequence was produced by vents in the CS crater area. The sequence began with an initial energetic pulse that lasted 45 seconds, ejecting predominantly coarse products 300 m above the crater that fell in an ESE direction. Subsequent and less intense explosions ejected material 100 m above the crater. The total duration of this event lasted approximately two minutes. During 31 January through 6, 13, and 24 February spattering activity was particularly intense for short periods in the N2 crater.
An explosive sequence was reported on 16 February that was characterized by a major explosion in the CS crater area (figure 257). The sequence began at 1817 near the S2 crater that ejected material radially. A few seconds later, lava fountains were observed in the central part of the crater. Three explosions of medium intensity (material was ejected less than 150 m high) were recorded at the S2 crater. The first part of this sequence lasted approximately one minute, according to INGV, and material rose 300 m above the crater and then was deposited along the Sciara del Fuoco. The second phase began at 1818 at the S1 crater; it lasted seven seconds and material was ejected 150 m above the crater. Another event 20 seconds later lasted 12 seconds, also ejecting material 150 m above the crater. The sequence ended with at least three explosions of mostly fine material from the S1 crater. The total duration of this sequence was about two minutes.
Short, intense spattering activity was noted above the N1 crater on 27 and 28 February. A lava overflow was first reported at 0657 from the N2 crater on 27 February that flowed into the October 2022 drainage. By 1900 the flow had stopped. A second lava overflow also in the N crater area occurred at 2149, which overlapped the first flow and then stopped by 0150 on 28 February. Material detached from both the lava overflows rolled down the Sciara del Fuoco, some of which was visible in webcam images.
Activity during March-April 2023. Strombolian activity continued with spattering activity and lava overflows in the N crater area during March. Explosive activity at the N crater area varied from low (less than 80 m high) to medium (less than 150 m high) and ejected coarse material, such as bombs and lapilli. Spattering was observed above the N1 crater, while explosive activity at the CS crater area varied from medium to high (greater than 150 m high) and ejected coarse material. Intense spattering activity was observed for short periods on 6 March above the N1 crater. At approximately 0610 a lava overflow was reported around the N2 crater on 8 March, which then flowed into the October 2022 drainage. By 1700 the flow started to cool. A second overflow began at 1712 on 9 March and overlapped the previous flow. It had stopped by 2100. Material from both flows was deposited along the Sciara del Fuoco, though much of the activity was not visible in webcam images. On 11 March a lava overflow was observed at 0215 that overlapped the two previous flows in the October 2022 drainage. By late afternoon on 12 March, it had stopped.
During a field excursion on 16 March, scientists noted that a vent in the central crater area was degassing. Another vent showed occasional Strombolian activity that emitted ash and lapilli. During 1200-1430 low-to-medium intense activity was reported; the N1 crater emitted ash emissions and the N2 crater emitted both ash and coarse material. Some explosions also occurred in the CS crater area that ejected coarse material. The C crater in the CS crater area occasionally showed gas jetting and low intensity explosions on 17 and 22 March; no activity was observed at the S1 crater. Intense, longer periods of spattering were reported in the N1 crater on 19, 24, and 25 March. Around 2242 on 23 March a lava overflow began from the N1 crater that, after about an hour, began moving down the October 2022 drainage and flow along the Sciara del Fuoco (figure 258). Between 0200 and 0400 on 26 March the flow rate increased, which generated avalanches of material from collapses at the advancing flow front. By early afternoon, the flow began to cool. On 25 March at 1548 an explosive sequence began from one of the vents at S2 in the CS crater area (figure 258). Fine ash mixed with coarse material was ejected 300 m above the crater rim and drifted SSE. Some modest explosions around Vent C were detected at 1549 on 25 March, which included an explosion at 1551 that ejected coarse material. The entire explosive sequence lasted approximately three minutes.
During April explosions persisted in both the N and CS crater areas. Fine material was ejected less than 80 m above the N crater rim until 6 April, followed by ejection of coarser material. Fine material was also ejected less than 80 m above the CS crater rim. The C and S2 crater did not show significant eruptive activity. On 7 April an explosive sequence was detected in the CS crater area at 1203 (figure 259). The first explosion lasted approximately 18 seconds and ejected material 400 m above the crater rim, depositing pyroclastic material in the upper part of the Sciara del Fuoco. At 1204 a second, less intense explosion lasted approximately four seconds and deposited pyroclastic products outside the crater area and near Pizzo Sopra La Fossa. A third explosion at 1205 was mainly composed of ash that rose about 150 m above the crater and lasted roughly 20 seconds. A fourth explosion occurred at 1205 about 28 seconds after the third explosion and ejected a mixture of coarse and fine material about 200 m above the crater; the explosion lasted roughly seven seconds. Overall, the entire explosive sequence lasted about two minutes and 20 seconds. After the explosive sequence on 7 April, explosions in both the N and CS crater areas ejected material as high as 150 m above the crater.
On 21 April research scientists from INGV made field observations in the summit area of Stromboli, and some lapilli samples were collected. In the N crater area near the N1 crater, a small cone was observed with at least two active vents, one of which was characterized by Strombolian explosions. The other vent produced explosions that ejected ash and chunks of cooled lava. At the N2 crater at least one vent was active and frequently emitted ash. In the CS crater area, a small cone contained 2-3 degassing vents and a smaller, possible fissure area also showed signs of degassing close to the Pizzo Sopra La Fossa. In the S part of the crater, three vents were active: a small hornito was characterized by modest and rare explosions, a vent that intermittently produced weak Strombolian explosions, and a vent at the end of the terrace that produced frequent ash emissions. Near the S1 crater there was a hornito that generally emitted weak gas-and-steam emissions, sometimes associated with “gas rings”. On 22 April another field inspection was carried out that reported two large sliding surfaces on the Sciara del Fuoco that showed where blocks frequently descended toward the sea. A thermal anomaly was detected at 0150 on 29 April.
Geologic Background. Spectacular incandescent nighttime explosions at Stromboli have long attracted visitors to the "Lighthouse of the Mediterranean" in the NE Aeolian Islands. This volcano has lent its name to the frequent mild explosive activity that has characterized its eruptions throughout much of historical time. The small island is the emergent summit of a volcano that grew in two main eruptive cycles, the last of which formed the western portion of the island. The Neostromboli eruptive period took place between about 13,000 and 5,000 years ago. The active summit vents are located at the head of the Sciara del Fuoco, a prominent scarp that formed about 5,000 years ago due to a series of slope failures which extends to below sea level. The modern volcano has been constructed within this scarp, which funnels pyroclastic ejecta and lava flows to the NW. Essentially continuous mild Strombolian explosions, sometimes accompanied by lava flows, have been recorded for more than a millennium.
Information Contacts: Istituto Nazionale di Geofisica e Vulcanologia (INGV), Sezione di Catania, Piazza Roma 2, 95123 Catania, Italy, (URL: http://www.ct.ingv.it/en/); MIROVA (Middle InfraRed Observation of Volcanic Activity), a collaborative project between the Universities of Turin and Florence (Italy) supported by the Centre for Volcanic Risk of the Italian Civil Protection Department (URL: http://www.mirovaweb.it/); Hawai'i Institute of Geophysics and Planetology (HIGP) - MODVOLC Thermal Alerts System, School of Ocean and Earth Science and Technology (SOEST), Univ. of Hawai'i, 2525 Correa Road, Honolulu, HI 96822, USA (URL: http://modis.higp.hawaii.edu/); Copernicus Browser, Copernicus Data Space Ecosystem, European Space Agency (URL: https://dataspace.copernicus.eu/browser/).
Nishinoshima (Japan) — July 2023 Cite this Report
Nishinoshima
Japan
27.247°N, 140.874°E; summit elev. 100 m
All times are local (unless otherwise noted)
Small ash plumes and fumarolic activity during November 2022 through April 2023
Nishinoshima is a small island located about 1,000 km S of Tokyo in the Ogasawara Arc in Japan. The island is the summit of a massive submarine volcano that has prominent peaks to the S, W, and NE. Eruptions date back to 1973; the most recent eruption period began in October 2022 and was characterized by ash plumes and fumarolic activity (BGVN 47:12). This report describes ash plumes and fumarolic activity during November 2022 through April 2023 based on monthly reports from the Japan Meteorological Agency (JMA) monthly reports and satellite data.
The most recent eruptive activity prior to the reporting internal occurred on 12 October 2022, when an ash plume rose 3.5 km above the crater rim. An aerial observation conducted by the Japan Coast Guard (JCG) on 25 November reported that white fumaroles rose approximately 200 m above the central crater of a pyroclastic cone (figure 119), and multiple plumes were observed on the ESE flank of the cone. Discolored water ranging from reddish-brown to brown and yellowish-green were visible around the perimeter of the island (figure 119). No significant activity was reported in December.
During an overflight conducted by JCG on 25 January 2023 intermittent activity and small, blackish-gray plumes rose 900 m above the central part of the crater were observed (figure 120). The fumarolic zone of the E flank and base of the cone had expanded and emissions had intensified. Dark brown discolored water was visible around the perimeter of the island.
No significant activity was reported during February through March. Ash plumes at 1050 and 1420 on 11 April rose 1.9 km above the crater rim and drifted NW and N. These were the first ash plumes observed since 12 October 2022. On 14 April JCG carried out an overflight and reported that no further eruptive activity was visible, although white gas-and-steam plumes were visible from the central crater and rose 900 m high (figure 121). Brownish and yellow-green discolored water surrounded the island.
Intermittent low-to-moderate power thermal anomalies were recorded in the MIROVA graph (Middle InfraRed Observation of Volcanic Activity) during November 2022 through April 2023 (figure 123). A cluster of six to eight anomalies were detected during November while a smaller number were detected during the following months: two to three during December, one during mid-January 2023, one during February, five during March, and two during April. Thermal activity was also reflected in infrared satellite data at the summit crater, accompanied by occasional gas-and-steam plumes (figure 124).
Geologic Background. The small island of Nishinoshima was enlarged when several new islands coalesced during an eruption in 1973-74. Multiple eruptions that began in 2013 completely covered the previous exposed surface and continued to enlarge the island. The island is the summit of a massive submarine volcano that has prominent peaks to the S, W, and NE. The summit of the southern cone rises to within 214 m of the ocean surface 9 km SSE.
Information Contacts: Japan Meteorological Agency (JMA), 1-3-4 Otemachi, Chiyoda-ku, Tokyo 100-8122, Japan (URL: http://www.jma.go.jp/jma/indexe.html); MIROVA (Middle InfraRed Observation of Volcanic Activity), a collaborative project between the Universities of Turin and Florence (Italy) supported by the Centre for Volcanic Risk of the Italian Civil Protection Department (URL: http://www.mirovaweb.it/); Copernicus Browser, Copernicus Data Space Ecosystem, European Space Agency (URL: https://dataspace.copernicus.eu/browser/).
Karangetang (Indonesia) — July 2023 Cite this Report
Karangetang
Indonesia
2.781°N, 125.407°E; summit elev. 1797 m
All times are local (unless otherwise noted)
Lava flows, incandescent avalanches, and ash plumes during January-June 2023
Karangetang (also known as Api Siau), at the northern end of the island of Siau, Indonesia, contains five summit craters along a N-S line. More than 40 eruptions have been recorded since 1675; recent eruptions have included frequent explosive activity, sometimes accompanied by pyroclastic flows and lahars. Lava dome growth has occurred in the summit craters and collapses of lava flow fronts have produced pyroclastic flows. The two active summit craters are Kawah Dua (the N crater) and Kawah Utama (the S crater, also referred to as the “Main Crater”). The most recent eruption began in late November 2018 and has more recently consisted of weak thermal activity and gas-and-steam emissions (BGVN 48:01). This report updates activity characterized by lava flows, incandescent avalanches, and ash plumes during January through June 2023 using reports from Pusat Vulkanologi dan Mitigasi Bencana Geologi (PVMBG, also known as CVGHM, or the Center of Volcanology and Geological Hazard Mitigation), MAGMA Indonesia, the Darwin VAAC (Volcano Ash Advisory Center), and satellite data.
Activity during January was relatively low and mainly consisted of white gas-and-steam emissions that rose 25-150 m above Main Crater (S crater) and drifted in different directions. Incandescence was visible from the lava dome in Kawah Dua (the N crater). Weather conditions often prevented clear views of the summit. On 18 January the number of seismic signals that indicated avalanches of material began to increase. In addition, there were a total of 71 earthquakes detected during the month.
Activity continued to increase during the first week of February. Material from Main Crater traveled as far as 800 m down the Batuawang (S) and Batang (W) drainages and as far as 1 km W down the Beha (W) drainage on 4 February. On 6 February 43 earthquake events were recorded, and on 7 February, 62 events were recorded. White gas-and-steam emissions rose 25-250 m above both summit craters throughout the month. PVMBG reported an eruption began during the evening of 8 February around 1700. Photos showed incandescent material at Main Crater. Incandescent material had also descended the flank in at least two unconfirmed directions as far as 2 km from Main Crater, accompanied by ash plumes (figure 60). As a result, PVMBG increased the Volcano Alert Level (VAL) to 3 (the second highest level on a 1-4 scale).
Occasional nighttime webcam images showed three main incandescent lava flows of differing lengths traveling down the S, SW, and W flanks (figure 61). Incandescent rocks were visible on the upper flanks, possibly from ejected or collapsed material from the crater, and incandescence was the most intense at the summit. Based on analyses of satellite imagery and weather models, the Darwin VAAC reported that daily ash plumes during 16-20 February rose to 2.1-3 km altitude and drifted NNE, E, and SE. BNPB reported on 16 February that as many as 77 people were evacuated and relocated to the East Siau Museum. A webcam image taken at 2156 on 17 February possibly showed incandescent material descending the SE flank. Ash plumes rose to 2.1 km altitude and drifted SE during 22-23 February, according to the Darwin VAAC.
Incandescent avalanches of material and summit incandescence at Main Crater continued during March. White gas-and-steam emissions during March generally rose 25-150 m above the summit crater; on 31 March gas-and-steam emissions rose 200-400 m high. An ash plume rose to 2.4 km altitude and drifted S at 1710 on 9 March and a large thermal anomaly was visible in images taken at 0550 and 0930 on 10 March. Incandescent material was visible at the summit and on the flanks based on webcam images taken at 0007 and 2345 on 16 March, at 1828 on 17 March, at 1940 on 18 March, at 2311 on 19 March, and at 2351 on 20 March. Incandescence was most intense on 18 and 20 March and webcam images showed possible Strombolian explosions (figure 62). An ash plume rose to 2.4 km altitude and drifted SW on 18 March, accompanied by a thermal anomaly.
Summit crater incandescence at Main Crater and on the flanks persisted during April. Incandescent material at the S crater and on the flanks was reported at 0016 on 1 April. The lava flows had stopped by 1 April according to PVMBG, although incandescence was still visible up to 10 m high. Seismic signals indicating effusion decreased and by 6 April they were no longer detected. Incandescence was visible from both summit craters. On 26 April the VAL was lowered to 2 (the second lowest level on a 1-4 scale). White gas-and-steam emissions rose 25-200 m above the summit crater.
During May white gas-and-steam emissions generally rose 50-250 m above the summit, though it was often cloudy, which prevented clear views; on 21 May gas-and-steam emissions rose 50-400 m high. Nighttime N summit crater incandescence rose 10-25 m above the lava dome, and less intense incandescence was noted above Main Crater, which reached about 10 m above the dome. Sounds of falling rocks at Main Crater were heard on 15 May and the seismic network recorded 32 rockfall events in the crater on 17 May. Avalanches traveled as far as 1.5 km down the SW and S flanks, accompanied by rumbling sounds on 18 May. Incandescent material descending the flanks was captured in a webcam image at 2025 on 19 May (figure 63) and on 29 May; summit crater incandescence was observed in webcam images at 2332 on 26 May and at 2304 on 29 May. On 19 May the VAL was again raised to 3.
Occasional Main Crater incandescence was reported during June, as well as incandescent material on the flanks. White gas-and-steam emissions rose 10-200 m above the summit crater. Ash plumes rose to 2.1 km altitude and drifted SE and E during 2-4 June, according to the Darwin VAAC. Material on the flanks of Main Crater were observed at 2225 on 7 June, at 2051 on 9 June, at 0007 on 17 June, and at 0440 on 18 June. Webcam images taken on 21, 25, and 27 June showed incandescence at Main Crater and from material on the flanks.
MIROVA (Middle InfraRed Observation of Volcanic Activity) analysis of MODIS satellite data showed strong thermal activity during mid-February through March and mid-May through June, which represented incandescent avalanches and lava flows (figure 64). During April through mid-May the power of the anomalies decreased but frequent anomalies were still detected. Brief gaps in activity occurred during late March through early April and during mid-June. Infrared satellite images showed strong lava flows mainly affecting the SW and S flanks, accompanied by gas-and-steam emissions (figure 65). According to data recorded by the MODVOLC thermal algorithm, there were a total of 79 thermal hotspots detected: 28 during February, 24 during March, one during April, five during May, and 21 during June.
Geologic Background. Karangetang (Api Siau) volcano lies at the northern end of the island of Siau, about 125 km NNE of the NE-most point of Sulawesi. The stratovolcano contains five summit craters along a N-S line. It is one of Indonesia's most active volcanoes, with more than 40 eruptions recorded since 1675 and many additional small eruptions that were not documented (Neumann van Padang, 1951). Twentieth-century eruptions have included frequent explosive activity sometimes accompanied by pyroclastic flows and lahars. Lava dome growth has occurred in the summit craters; collapse of lava flow fronts have produced pyroclastic flows.
Information Contacts: Pusat Vulkanologi dan Mitigasi Bencana Geologi (PVMBG, also known as Indonesian Center for Volcanology and Geological Hazard Mitigation, CVGHM), Jalan Diponegoro 57, Bandung 40122, Indonesia (URL: http://www.vsi.esdm.go.id/); MAGMA Indonesia, Kementerian Energi dan Sumber Daya Mineral (URL: https://magma.esdm.go.id/v1); Badan Nasional Penanggulangan Bencana (BNPB), National Disaster Management Agency, Graha BNPB - Jl. Scout Kav.38, East Jakarta 13120, Indonesia (URL: http://www.bnpb.go.id/); Darwin Volcanic Ash Advisory Centre (VAAC), Bureau of Meteorology, Northern Territory Regional Office, PO Box 40050, Casuarina, NT 0811, Australia (URL: http://www.bom.gov.au/info/vaac/); MIROVA (Middle InfraRed Observation of Volcanic Activity), a collaborative project between the Universities of Turin and Florence (Italy) supported by the Centre for Volcanic Risk of the Italian Civil Protection Department (URL: http://www.mirovaweb.it/); Hawai'i Institute of Geophysics and Planetology (HIGP) - MODVOLC Thermal Alerts System, School of Ocean and Earth Science and Technology (SOEST), Univ. of Hawai'i, 2525 Correa Road, Honolulu, HI 96822, USA (URL: http://modis.higp.hawaii.edu/); Copernicus Browser, Copernicus Data Space Ecosystem, European Space Agency (URL: https://dataspace.copernicus.eu/browser/); IDN Times, Jl. Jend. Gatot Subroto Kav. 27 3rd Floor Kuningan, Jakarta, Indonesia 12950, Status of Karangetang Volcano in Sitaro Islands Increases (URL: https://sulsel.idntimes.com/news/indonesia/savi/status-gunung-api-karangetang-di-kepulauan-sitaro-meningkat?page=all).
Ahyi (United States) — July 2023 Cite this Report
Ahyi
United States
20.42°N, 145.03°E; summit elev. -75 m
All times are local (unless otherwise noted)
Intermittent hydroacoustic signals and discolored plumes during November 2022-June 2023
Ahyi seamount is a large, conical submarine volcano that rises to within 75 m of the ocean surface about 18 km SE of the island of Farallon de Pajaros in the Northern Marianas. The remote location of the seamount has made eruptions difficult to document, but seismic stations installed in the region confirmed an eruption in the vicinity in 2001. No new activity was detected until April-May 2014 when an eruption was detected by NOAA (National Oceanic and Atmospheric Administration) divers, hydroacoustic sensors, and seismic stations (BGVN 42:04). New activity was first detected on 15 November by hydroacoustic sensors that were consistent with submarine volcanic activity. This report covers activity during November 2022 through June 2023 based on daily and weekly reports from the US Geological Survey.
Starting in mid-October, hydroacoustic sensors at Wake Island (2.2 km E) recorded signals consistent with submarine volcanic activity, according to a report from the USGS issued on 15 November 2022. A combined analysis of the hydroacoustic signals and seismic stations located at Guam and Chichijima Island, Japan, suggested that the source of this activity was at or near the Ahyi seamount. After a re-analysis of a satellite image of the area that was captured on 6 November, USGS confirmed that there was no evidence of discoloration at the ocean surface. Few hydroacoustic and seismic signals continued through November, including on 18 November, which USGS suggested signified a decline or pause in unrest. A VONA (Volcano Observatory Notice for Aviation) reported that a discolored water plume was persistently visible in satellite data starting on 18 November (figure 6). Though clouds often obscured clear views of the volcano, another discolored water plume was captured in a satellite image on 26 November. The Aviation Color Code (ACC) was raised to Yellow (the second lowest level on a four-color scale) and the Volcano Alert Level (VAL) was raised to Advisory (the second lowest level on a four-level scale) on 29 November.
During December, occasional detections were recorded on the Wake Island hydrophone sensors and discolored water over the seamount remained visible. During 2-7, 10-12, and 16-31 December possible explosion signals were detected. A small area of discolored water was observed in high-resolution Sentinel-2 satellite images during 1-6 December (figure 7). High-resolution satellite images recorded discolored water plumes on 13 December that originated from the summit region; no observations indicated that activity breached the ocean surface. A possible underwater plume was visible in satellite images on 18 December, and during 19-20 December a definite but diffuse underwater plume located SSE from the main vent was reported. An underwater plume was visible in a satellite image taken on 26 December (figure 7).
Hydrophone sensors continued to detect signals consistent with possible explosions during 1-8 January 2023. USGS reported that the number of detections decreased during 4-5 January. The hydrophone sensors experienced a data outage that started at 0118 on 8 January and continued through 10 January, though according to USGS, possible explosions were recorded prior to the data outage and likely continued during the outage. A discolored water plume originating from the summit region was detected in a partly cloudy satellite image on 8 January. On 11-12 and 15-17 January possible explosion signals were recorded again. One small signal was detected during 22-23 January and several signals were recorded on 25 and 31 January. During 27-31 January a plume of discolored water was observed above the seamount in satellite imagery (figure 8).
Low levels of activity continued during February and March, based on data from pressure sensors on Wake Island. During 1 and 4-6 February activity was reported, and a submarine plume was observed on 4 February (figure 8). Possible explosion signals were detected during 7-8, 10, 13-14, and 24 February. During 1-2 and 3-5 March a plume of discolored water was observed in satellite imagery (figure 8). Almost continuous hydroacoustic signals were detected in remote pressure sensor data on Wake Island 2,270 km E from the volcano during 7-13 March. During 12-13 March water discoloration around the seamount was observed in satellite imagery, despite cloudy weather. By 14 March discolored water extended about 35 km, but no direction was noted. USGS reported that the continuous hydroacoustic signals detected during 13-14 March stopped abruptly on 14 March and no new detections were observed. Three 30 second hydroacoustic detections were reported during 17-19 March, but no activity was visible due to cloudy weather. A data outage was reported during 21-22 March, making pressure sensor data unavailable; a discolored water plume was, however, visible in satellite data. A possible underwater explosion signal was detected by pressure sensors at Wake Island on 26, 29, and 31 March, though the cause and origin of these events were unclear.
Similar low activity continued during April, May, and June. Several signals were detected during 1-3 April in pressure sensors at Wake Island. USGS suggested that these may be related to underwater explosions or earthquakes at the volcano, but no underwater plumes were visible in clear satellite images. The pressure sensors had data outages during 12-13 April and no data were recorded; no underwater plumes were visible in satellite images, although cloudy weather obscured most clear views. Eruptive activity was reported starting at 2210 on 21 May. On 22 May a discolored water plume that extended 4 km was visible in satellite images, though no direction was recorded. During 23-24 May some signals were detected by the underwater pressure sensors. Possible hydroacoustic signals were detected during 2-3 and 6-8 June. Multiple hydroacoustic signals were detected during 9-11 and 16-17 June, although no activity was visible in satellite images. One hydroacoustic signal was detected during 23-24 June, but there was some uncertainty about its association with volcanic activity. A single possible hydroacoustic signal was detected during 30 June to 1 July.
Geologic Background. Ahyi seamount is a large conical submarine volcano that rises to within 75 m of the ocean surface ~18 km SE of the island of Farallon de Pajaros in the northern Marianas. Water discoloration has been observed there, and in 1979 the crew of a fishing boat felt shocks over the summit area, followed by upwelling of sulfur-bearing water. On 24-25 April 2001 an explosive eruption was detected seismically by a station on Rangiroa Atoll, Tuamotu Archipelago. The event was well constrained (+/- 15 km) at a location near the southern base of Ahyi. An eruption in April-May 2014 was detected by NOAA divers, hydroacoustic sensors, and seismic stations.
Information Contacts: US Geological Survey, Volcano Hazards Program (USGS-VHP), 12201 Sunrise Valley Drive, Reston, VA, USA, https://volcanoes.usgs.gov/index.html; Copernicus Browser, Copernicus Data Space Ecosystem, European Space Agency (URL: https://dataspace.copernicus.eu/browser/).
Kadovar (Papua New Guinea) — June 2023 Cite this Report
Kadovar
Papua New Guinea
3.608°S, 144.588°E; summit elev. 365 m
All times are local (unless otherwise noted)
An ash plume and weak thermal anomaly during May 2023
Kadovar is a 2-km-wide island that is the emergent summit of a Bismarck Sea stratovolcano. It lies off the coast of New Guinea, about 25 km N of the mouth of the Sepik River. Prior to an eruption that began in 2018, a lava dome formed the high point of the volcano, filling an arcuate landslide scarp open to the S. Submarine debris-avalanche deposits occur to the S of the island. The current eruption began in January 2018 and has comprised lava effusion from vents at the summit and at the E coast; more recent activity has consisted of ash plumes, weak thermal activity, and gas-and-steam plumes (BGVN 48:02). This report covers activity during February through May 2023 using information from the Darwin Volcanic Ash Advisory Center (VAAC) and satellite data.
Activity during the reporting period was relatively low and mainly consisted of white gas-and-steam plumes that were visible in natural color satellite images on clear weather days (figure 67). According to a Darwin VAAC report, at 2040 on 6 May an ash plume rose to 4.6 km altitude and drifted W; by 2300 the plume had dissipated. MODIS satellite instruments using the MODVOLC thermal algorithm detected a single thermal hotspot on the SE side of the island on 7 May. Weak thermal activity was also detected in a satellite image on the E side of the island on 14 May, accompanied by a white gas-and-steam plume that drifted SE (figure 68).
Geologic Background. The 2-km-wide island of Kadovar is the emergent summit of a Bismarck Sea stratovolcano of Holocene age. It is part of the Schouten Islands, and lies off the coast of New Guinea, about 25 km N of the mouth of the Sepik River. Prior to an eruption that began in 2018, a lava dome formed the high point of the andesitic volcano, filling an arcuate landslide scarp open to the south; submarine debris-avalanche deposits occur in that direction. Thick lava flows with columnar jointing forms low cliffs along the coast. The youthful island lacks fringing or offshore reefs. A period of heightened thermal phenomena took place in 1976. An eruption began in January 2018 that included lava effusion from vents at the summit and at the E coast.
Information Contacts: Darwin Volcanic Ash Advisory Centre (VAAC), Bureau of Meteorology, Northern Territory Regional Office, PO Box 40050, Casuarina, NT 0811, Australia (URL: http://www.bom.gov.au/info/vaac/); Hawai'i Institute of Geophysics and Planetology (HIGP) - MODVOLC Thermal Alerts System, School of Ocean and Earth Science and Technology (SOEST), Univ. of Hawai'i, 2525 Correa Road, Honolulu, HI 96822, USA (URL: http://modis.higp.hawaii.edu/); Copernicus Browser, Copernicus Data Space Ecosystem, European Space Agency (URL: https://dataspace.copernicus.eu/browser/).
San Miguel (El Salvador) — June 2023 Cite this Report
San Miguel
El Salvador
13.434°N, 88.269°W; summit elev. 2130 m
All times are local (unless otherwise noted)
Small gas-and-ash explosions during March and May 2023
San Miguel in El Salvador is a broad, deep crater complex that has been frequently modified by eruptions recorded since the early 16th century and consists of the summit known locally as Chaparrastique. Flank eruptions have produced lava flows that extended to the N, NE, and SE during the 17-19th centuries. The most recent activity has consisted of minor ash eruptions from the summit crater. The current eruption period began in November 2022 and has been characterized by frequent phreatic explosions, gas-and-ash emissions, and sulfur dioxide plumes (BGVN 47:12). This report describes small gas-and-ash explosions during December 2022 through May 2023 based on special reports from the Ministero de Medio Ambiente y Recursos Naturales (MARN).
Activity has been relatively low since the last recorded explosions on 29 November 2022. Seismicity recorded by the San Miguel Volcano Station (VSM) located on the N flank at 1.7 km elevation had decreased by 7 December. Sulfur dioxide gas measurements taken with DOAS (Differential Optical Absorption Spectroscopy) mobile equipment were below typical previously recorded values: 300 tons per day (t/d). During December, small explosions were recorded by the seismic network and manifested as gas-and-steam emissions.
Gas-and-ash explosions in the crater occurred during January 2023, which were recorded by the seismic network. Sulfur dioxide values remained low, between 300-400 t/d through 10 March. At 0817 on 14 January a gas-and-ash emission was visible in webcam images, rising just above the crater rim. Some mornings during February, small gas-and-steam plumes were visible in the crater. On 7 March at 2252 MARN noted an increase in degassing from the central crater; gas emissions were constantly observed through the early morning hours on 8 March. During the early morning of 8 March through the afternoon on 9 March, 12 emissions were registered, some accompanied by ash. The last gas-and-ash emission was recorded at 1210 on 9 March; very fine ashfall was reported in El Tránsito (10 km S), La Morita (6 km W), and La Piedrita (3 km W). The smell of sulfur was reported in Piedra Azul (5 km SW). On 16 March MARN reported that gas-and-steam emissions decreased.
Low degassing and very low seismicity were reported during April; no explosions have been detected between 9 March and 27 May. The sulfur dioxide emissions remained between 350-400 t/d; during 13-20 April sulfur dioxide values fluctuated between 30-300 t/d. Activity remained low through most of May; on 23 May seismicity increased. An explosion was detected at 1647 on 27 May generated a gas-and-ash plume that rose 700 m high (figure 32); a decrease in seismicity and gas emissions followed. The DOAS station installed on the W flank recorded sulfur dioxide values that reached 400 t/d on 27 May; subsequent measurements showed a decrease to 268 t/d on 28 May and 100 t/d on 29 May.
Geologic Background. The symmetrical cone of San Miguel, one of the most active volcanoes in El Salvador, rises from near sea level to form one of the country's most prominent landmarks. A broad, deep, crater complex that has been frequently modified by eruptions recorded since the early 16th century caps the truncated unvegetated summit, also known locally as Chaparrastique. Flanks eruptions of the basaltic-andesitic volcano have produced many lava flows, including several during the 17th-19th centuries that extended to the N, NE, and SE. The SE-flank flows are the largest and form broad, sparsely vegetated lava fields crossed by highways and a railroad skirting the base of the volcano. Flank vent locations have migrated higher on the edifice during historical time, and the most recent activity has consisted of minor ash eruptions from the summit crater.
Information Contacts: Ministero de Medio Ambiente y Recursos Naturales (MARN), Km. 5½ Carretera a Nueva San Salvador, Avenida las Mercedes, San Salvador, El Salvador (URL: http://www.snet.gob.sv/ver/vulcanologia).
Semisopochnoi (United States) — June 2023 Cite this Report
Semisopochnoi
United States
51.93°N, 179.58°E; summit elev. 1221 m
All times are local (unless otherwise noted)
Occasional explosions, ash deposits, and gas-and-steam plumes during December 2022-May 2023
Semisopochnoi is located in the western Aleutians, is 20-km-wide at sea level, and contains an 8-km-wide caldera. The three-peaked Mount Young (formerly Cerberus) was constructed within the caldera during the Holocene. Each of these peaks contains a summit crater; the lava flows on the N flank appear younger than those on the S side. The current eruption period began in early February 2021 and has more recently consisted of intermittent explosions and ash emissions (BGVN 47:12). This report updates activity during December 2022 through May 2023 using daily, weekly, and special reports from the Alaska Volcano Observatory (AVO). AVO monitors the volcano using local seismic and infrasound sensors, satellite data, web cameras, and remote infrasound and lightning networks.
Activity during most of December 2022 was relatively quiet; according to AVO no eruptive or explosive activity was observed since 7 November 2022. Intermittent tremor and occasional small earthquakes were observed in geophysical data. Continuous gas-and-steam emissions were observed from the N crater of Mount Young in webcam images on clear weather days (figure 25). On 24 December, there was a slight increase in earthquake activity and several small possible explosion signals were detected in infrasound data. Eruptive activity resumed on 27 December at the N crater of Mount Young; AVO issued a Volcano Activity Notice (VAN) that reported minor ash deposits on the flanks of Mount Young that extended as far as 1 km from the vent, according to webcam images taken during 27-28 December (figure 26). No ash plumes were observed in webcam or satellite imagery, but a persistent gas-and-steam plume that might have contained some ash rose to 1.5 km altitude. As a result, AVO raised the Aviation Color Code (ACC) to Orange (the second highest level on a four-color scale) and the Volcano Alert Level (VAL) to Watch (the second highest level on a four-level scale). Possible explosions were detected during 21 December 2022 through 1 January 2023 and seismic tremor was recorded during 30-31 December.
During January 2023 eruptive activity continued at the active N crater of Mount Young. Minor ash deposits were observed on the flanks, extending about 2 km SSW, based on webcam images from 1 and 3 January. A possible explosion occurred during 1-2 January based on elevated seismicity recorded on local seismometers and an infrasound signal recorded minutes later by an array at Adak. Though no ash plumes were observed in webcam or satellite imagery, a persistent gas-and-steam plume rose to 1.5 km altitude that might have carried minor traces of ash. Ash deposits were accompanied by periods of elevated seismicity and infrasound signals from the local geophysical network, which AVO reported were likely due to weak explosive activity. Low-level explosive activity was also detected during 2-3 January, with minor gas-and-steam emissions and a new ash deposit that was visible in webcam images. Low-level explosive activity was detected in geophysical data during 4-5 January, with elevated seismicity and infrasound signals observed on local stations. Volcanic tremor was detected during 7-9 January and very weak explosive activity was detected in seismic and infrasound data on 9 January. Weak seismic and infrasound signals were recorded on 17 January, which indicated minor explosive activity, but no ash emissions were observed in clear webcam images; a gas-and-steam plume continued to rise to 1.5 km altitude. During 29-30 January, ash deposits near the summit were observed on fresh snow, according to webcam images.
The active N cone at Mount Young continued to produce a gas-and-steam plume during February, but no ash emissions or explosive events were detected. Seismicity remained elevated with faint tremor during early February. Gas-and-steam emissions from the N crater were observed in clear webcam images on 11-13 and 16 February; no explosive activity was detected in seismic, infrasound, or satellite data. Seismicity has also decreased, with no significant seismic tremor observed since 25 January. Therefore, the ACC was lowered to Yellow (the second lowest level on a four-color scale) and the VAL was lowered to Advisory (the second lowest level on a four-color scale) on 22 February.
Gas-and-steam emissions persisted during March from the N cone of Mount Young, based on clear webcam images. A few brief episodes of weak tremor were detected in seismic data, although seismicity decreased over the month. A gas-and-steam plume detected in satellite data extended 150 km on 18 March. Low-level ash emissions from the N cone at Mount Young were observed in several webcam images during 18-19 March, in addition to small explosions and volcanic tremor. The ACC was raised to Orange and the VAL increased to Watch on 19 March. A small explosion was detected in seismic and infrasound data on 21 March.
Low-level unrest continued during April, although cloudy weather often obscured views of the summit; periods of seismic tremor and local earthquakes were recorded. During 3-4 April a gas-and-steam plume was visible traveling more than 200 km overnight; no ash was evident in the plume, according to AVO. A gas-and-steam plume was observed during 4-6 April that extended 400 km but did not seem to contain ash. Small explosions were detected in seismic and infrasound data on 5 April. Occasional clear webcam images showed continuing gas-and-steam emissions rose from Mount Young, but no ash deposits were observed on the snow. On 19 April small explosions and tremor were detected in seismic and infrasound data. A period of seismic tremor was detected during 22-25 April, with possible weak explosions on 25 April. Ash deposits were visible near the crater rim, but it was unclear if these deposits were recent or due to older deposits.
Occasional small earthquakes were recorded during May, but there were no signs of explosive activity seen in geophysical data. Gas-and-steam emissions continued from the N crater of Mount Young, based on webcam images, and seismicity remained slightly elevated. A new, light ash deposit was visible during the morning of 5 May on fresh snow on the NW flank of Mount Young. During 10 May periods of volcanic tremor were observed. The ACC was lowered to Yellow and the VAL to Advisory on 17 May due to no additional evidence of activity.
Geologic Background. Semisopochnoi, the largest subaerial volcano of the western Aleutians, is 20 km wide at sea level and contains an 8-km-wide caldera. It formed as a result of collapse of a low-angle, dominantly basaltic volcano following the eruption of a large volume of dacitic pumice. The high point of the island is Anvil Peak, a double-peaked late-Pleistocene cone that forms much of the island's northern part. The three-peaked Mount Cerberus (renamed Mount Young in 2023) was constructed within the caldera during the Holocene. Each of the peaks contains a summit crater; lava flows on the N flank appear younger than those on the south side. Other post-caldera volcanoes include the symmetrical Sugarloaf Peak SSE of the caldera and Lakeshore Cone, a small cinder cone at the edge of Fenner Lake in the NE part of the caldera. Most documented eruptions have originated from Young, although Coats (1950) considered that both Sugarloaf and Lakeshore Cone could have been recently active.
Information Contacts: Alaska Volcano Observatory (AVO), a cooperative program of a) U.S. Geological Survey, 4200 University Drive, Anchorage, AK 99508-4667 USA (URL: https://avo.alaska.edu/), b) Geophysical Institute, University of Alaska, PO Box 757320, Fairbanks, AK 99775-7320, USA, and c) Alaska Division of Geological & Geophysical Surveys, 794 University Ave., Suite 200, Fairbanks, AK 99709, USA (URL: http://dggs.alaska.gov/).
Search Bulletin Archive by Publication Date
Select a month and year from the drop-downs and click "Show Issue" to have that issue displayed in this tab.
The default month and year is the latest issue available.
Bulletin of the Global Volcanism Network - Volume 37, Number 01 (January 2012)
Managing Editor: Richard Wunderman
Chiginagak (United States)
Acidic crater-lake water escaped in 2005 perturbing regional hydrosphere
Cleveland (United States)
Amendments to BGVN reports 2001-2011
Fourpeaked (United States)
Syn- and post-eruptive seismicity and emissions; magma intrusion model
Lengai, Ol Doinyo (Tanzania)
Update on observations; new reports on 2007-2008 eruptions
Martin (United States)
Seismic swarm in January 2006
Negro, Cerro (Nicaragua)
Non-eruptive activity; fumarole and seismic monitoring; new crater morphology
Spurr (United States)
Summit ice cauldron, debris flows through 2006; fumarolic activity continues
Chiginagak (United States) — January 2012 Cite this Report
Chiginagak
United States
57.135°N, 156.99°W; summit elev. 2221 m
All times are local (unless otherwise noted)
Acidic crater-lake water escaped in 2005 perturbing regional hydrosphere
We previously reported fumarolic activity from November 1997 to August 1998, but issued no subsequent Bulletin reports for Chiginagak. This report covers the formation of a summit ice cauldron and crater lake and subsequent draining of the lake resulting in the acidification of Mother Goose Lake during 2000-2010. Records of Chiginagak's past activity are poor. It is not seismically monitored and, because of its remote location, much of the information is limited to observations of nearby residents. The primary source of information for this report has been Alaska Volcano Observatory (AVO) annual reports (McGimsey and others, 1999; McGimsey and others, 2004; Neal and others, 2004; and McGimsey and others, 2008).
Increased fumarolic activity occurred from November 1997-August 1998. AVO reports that the activity during that time was a result of formation of new fumaroles on the N flank of the volcano. In November of 1997 an increase in steam emission led to increased snowmelt (BGVN 22:11). The steam was accompanied by the smell of sulfur. Through January 1998 a robust steam plume was observed by AVO several times. In March 1998 vigorous fumarolic activity continued, characterized by gray clouds and a strong sulfur smell that was reported up to 49 km away. In August 1998 a plume of black ash and greenish-yellow gas rose from the volcano's fumaroles. In late July-early August 2000 Chiginagak again released a larger than normal plume.
Glacial Outburst Flooding. Between November 2004 and May 2005 non-explosive geothermal activity melted the snow and ice filling Chiginagak's summit crater, forming an ice cauldron ~400 m wide and ~105 m deep. The melt waters formed an acidic lake within the cauldron. The water from the lake melted a tunnel through the summit ice, draining the cauldron. The resulting lahar flowed down the SW flank of the volcano probably in May 2005, photographed August 20, 2005 (figure 1).
The water from the cauldron continued downstream into Mother Goose Lake, ~27 km downstream to the NW of Chiginagak (figure 2) and in August 2005 Mother Goose Lake became acidic, with pH dropping to 2.9. This killed the majority of aquatic life in the lake and damaged flora surrounding both the lake and the rivers (Indecision Creek and Volcano Creek which transport water from Chiginagak to Mother Goose Lake and King Salmon River that flows from the lake). Below a pH of 4.5, essentially no large fish are able to survive (figure 3). It is not just the acidity that kills aquatic fauna but also high levels of metals such as Al and Fe. At a pH of 5, Al3+ becomes insoluble and has a toxic effect on fauna. The acidic water was accompanied by sulfurous, clay-rich debris and acidic aerosols. The high acidity of the lake prevented the annual salmon run that typically ascends into Mother Goose Lake.
The pH at Mother Goose Lake has been monitored since 2005 and the pH has slowly returned to normal. By 2010 the lake water returned towards normal conditions; pH reached 5.2 and a variety of fish have returned to the lake. By August 2011 the pH had reached 6.9.
In 2005, Kassel (2009) studied the slurry pH deposited at Mother Goose Lake. Slurry pH is the standard method for estimating pH of soils; it is similar to pore water measurements. The details of the process used can be found in Kassel (2009, p.27-30). The slurry pH of Mother Goose Lake in 2005 was approximately the same as the pH of the lake at that time. The assumption can be made that slurry pH reflects lake pH at the time of deposition. Based on slurry pH seen in core samples, at least 7 similar events have occurred at Mother Goose Lake in the last ~3,800 years, including the 2005 event. Only one of these events was associated with tephra deposits, therefore the majority of the events were seemingly triggered by non-explosive geothermal activity, similar to the event in 2005.
According to McGimsey and others (2008), "The area is remote, and the active fumaroles frequently produce visible steam plumes, which have been mistaken for eruptive activity. Unverified reports of minor activity are attributed to 1852, 1929, and 1971. An event similar to the outburst flooding in 2005 may have occurred in the early 1970s according to third-person accounts from a cabin owner on Mother Goose Lake, who reported flooding from the volcano, discoloration of the lakeshore, vegetation damage, and interruption of the annual salmon run (Jon Kent, local lodge owner, oral commun., 2004)."
References. US Environmental Protection Agency, 2008, Effects of Acid Rain - Surface Waters and Aquatic Animals, Updated 1 December 2008, Accessed 15 Febuary 2012 (URL: epa.gov/acidrain/effects/surface_water.html).
Kassel, CM, 2009, Lacustrine Evidence from Mother Goose Lake of Holocene Geothermal Activity at Mount Chiginagak, Alaska Peninsula, Northern Arizona University, 276 p.
McGimsey, RG, and Wallace, KL, 1999, 1997 Volcanic Activity in Alaska and Kamchatka: Summary of Events and Response of the Alaska Volcano Observatory, Open-File Report 99-448, U.S. Department of the Interior, U.S. Geological Survey, 42 p.
McGimsey, RG, Neal, CA, and Girina, O, 2004, 1998 Volcanic Activity in Alaska and Kamchatka: Summary of Events and Response of the Alaska Volcano Observatory, Open-File Report 03-423, U.S. Department of the Interior, U.S. Geological Survey.
McGimsey, RG, Neal, CA, Dixon, JP and Ushakov, S, 2008, 2005 Volcanic Activity in Alaska, Kamchatka, and the Kurile Islands: Summary of Events and Response of the Alaska Volcano Observatory, Scientific Investigations Report 2007-5269, U.S. Department of the Interior, U.S. Geological Survey.
Neal, CA, McGimsey, RG, and Chubarova, O, 2004, 2000 Volcanic Activity in Alaska and Kamchatka: Summary of Events and Response of the Alaska Volcano Observatory, Open-File Report 2004-1034, U.S. Department of the Interior, U.S. Geological Survey.
Schaefer, JR, Scott, WE, Evans, WC, Wang, B and McGimsey, RG, 2011, Summit Crater Lake Observations, and the Location, Chemistry, and pH of Water Samples Near Mount Chiginagak Volcano, Alaska: 2004-2011, Report of Investigations 2011-6, State of Alaska Department of Natural Resources, Division of Geological & Geophysical Surveys.
Geologic Background. The symmetrical, calc-alkaline Chiginagak stratovolcano located about 15 km NW of Chiginagak Bay contains a small summit crater, which is breached to the south, and one or more summit lava domes. Satellitic lava domes occur high on the NW and SE flanks of the glacier-mantled volcano. An unglaciated lava flow and an overlying pyroclastic-flow deposit extending east from the summit are the most recent products of Chiginagak. They most likely originated from a lava dome at 1687 m on the SE flank, 1 km from the summit of the volcano, which has variably been estimated to be from 2075 to 2221 m high. Brief ash eruptions were reported in July 1971 and August 1998. Fumarolic activity occurs at 1600 m elevation on the NE flank of the volcano, and two areas of hot-spring travertine deposition are located at the NW base of the volcano near Volcano Creek.
Information Contacts: Alaska Volcano Observatory (AVO), a cooperative program of a) U.S. Geological Survey, 4200 University Drive, Anchorage, AK 99508-4667, USA (URL: http://www.avo.alaska.edu/), b) Geophysical Institute, University of Alaska, PO Box 757320, Fairbanks, AK 99775-7320, USA, and c) Alaska Division of Geological & Geophysical Surveys, 794 University Ave., Suite 200, Fairbanks, AK 99709, USA; State of Alaska Department of Natural Resources, Division of Geological & Geophysical Surveys, 3354 College Rd., Fairbanks, Alaska 99709-3707, USA.
Cleveland (United States) — January 2012 Cite this Report
Cleveland
United States
52.825°N, 169.944°W; summit elev. 1730 m
All times are local (unless otherwise noted)
Amendments to BGVN reports 2001-2011
Our last report on Cleveland volcano, August 2011 (BGVN 36:08), described lava dome growth in August-September 2011. This report first addresses late 2011 to early 2012 observations, and then presents some amendments to Bulletin reports over the last decade.
Late 2011-early 2012. According to the Alaska Volcano Observatory (AVO), by the first week of October 2011 satellite images showed the lava dome was within 10 m of the crater rim on the SW and ENE sides of the crater. On 23 October, a TerraSAR-X satellite radar image of Cleveland showed no discernable growth in the lava dome over the course of the past several weeks. Instead, the 23 October image showed deflation or collapse of the dome.
On 3 November 2011, citing lack of dome growth evident in satellite images, AVO lowered both the Aviation Color Code to YELLOW and the Alert Level to ADVISORY. Throughout November, weather permitting, AVO continued to observe thermal anomalies and steam plumes in satellite imagery, consistent with cooling of the emplaced hot dome. Observations in early December 2011 showed continued deflation and cooling of the lava dome, which was about 1x10⁶ m3 in volume.
On 29 December 2011, AVO observed in satellite imagery a detached, drifting ash cloud at an altitude of ~4.6 km and ~80 km ESE of Cleveland. Ground-coupled airwaves from an explosion were also detected at the distant Okmok seismic network, placing the time of explosion at 1312 (UTC) on 29 December 29.
Based on the presence of an ash cloud, on 29 December AVO raised the aviation color code to ORANGE and the alert level to WATCH. On 30 December, with no new explosive activity, AVO lowered the aviation color code to YELLOW and the alert level to ADVISORY. Subsequent satellite images showed that the 25 December (recognized in retrospective data analysis) and 29 December explosions had largely removed the dome.
On 30 January 2012, satellite data showed another small dome within the summit crater, which measured ~ 40 m in diameter by 30 January. On 31 January, AVO raised the aviation color code to ORANGE and the volcano alert level to WATCH. No observations of elevated surface temperatures or ash emissions from Cleveland were noted during 15-21 February. On 17 February, AVO reported that partly-cloudy satellite observations over the past week revealed that the current lava dome had grown to about 60 m in diameter and occupied a small portion of the approximately 200-m diameter summit crater. On 19 February an elevated surface temperature was detected in satellite images. As of this date, there is no real-time seismic monitoring network on Mount Cleveland.
Amendments to Bulletin. According to Diefenbach, Guffanti, and Ewert, (2009), "During the past 29 years, 43 volcanoes within the United States have produced 95 eruptions and 32 episodes of unrest. More than half of the 30 eruptive volcanoes have erupted two or more times. The majority (77 percent) of U.S. eruptions has occurred in Alaska. Akutan volcano in Alaska has produced the most eruptions (11) in the past 29 years, followed by Veniaminof (10), Cleveland (9), and Pavlof (8)."
Because of the relative importance of Cleveland in the Aleutian chain as a source of active volcanism along a busy commercial airline route, we revisited the AVO web site recently to compare information available with that which we used to prepare the Bulletin in the past. As a prelude to this section, table 4 lists Cleveland eruptions reported by the AVO during 2001-2012 and the issues of the Bulletin covering a particular event.
Table 4. Dates of significant eruptions as reported by the AVO web site for Cleveland from January 2001 through January 2012, and related BGVN reports covering the respective eruptions. These data were accessed 9 February 2012; as of that date, the latest eruption reported by AVO was the one of 19 July 2011. From the AVO web site.
| Item |
Eruption dates (start-stop; ? = questionable event) |
BGVN issue(s) |
| a |
02 Feb-15 Apr 2001 |
26:01, 26:04 |
| b |
27 Apr-27 Sep 2005 |
30:09 |
| c |
06 Feb-06 Feb 2006 |
31:01, 31:06 |
| d |
23 May-23 May 2006 |
31:06, 31:07 |
| e |
24 Aug-28 Oct 2006 |
31:09 |
| f |
Jun 2007-28 Oct 2008 |
33:02, 33:07 |
| g |
02 Jan-21 Jan 2009 |
33:11 |
| h |
26 Jun-26 Jun 2009 |
34:10 |
| i |
02 Oct-02 Oct 2009 |
34:10 |
| j |
30 May-02 Jun 2010 |
35:06 |
| k |
12 Sep-12 Sep 2010 (?) |
36:05 |
| l |
19 Jul 2011 ± 7 days |
36:08 |
We amend some of our previous Bulletin reports with the following excerpts from USGS reports of Cleveland eruptions since 2001, ending with the last Bulletin containing a report on Cleveland (BGVN 36:08). The dates for the eruptions are the start and stop dates from the USGS reports.
Item a, Table 4 - BGVN 26:01: On 19 February 2001, Cleveland volcano erupted explosively at ~1430 UTC and AVO established the eruption termination date as 15 April 2001. However, after the eruption, AVO received reports indicating that precursory emission activity had taken place. Most graphic was a photograph taken on 2 February 2001 by a pilot flying by the volcano showing a dark, lobate deposit on the snow-covered SW flank and robust steaming from the summit crater.
Item a, Table 4 - BGVN 26:04: According to AVO, in 2001, ash fall from the February 2001 eruption of Cleveland was observed only at Nikolski over a ~5 hr on 19 February 2001. A sample from Nikolski showed that the ash was composed of glass shards, crystals, and lithics. The glass was dacitic and had a magmatic morphology rather than phreatomagmatic.
Item b, Table 4 - BGVN 30:09: On 27 April 2005, the Federal Aviation Association (FAA) alerted AVO of a pilot report of eruptive activity (ash cloud 4.6-5.5 km altitude) in the vicinity of Cleveland (based on coordinates from the pilots). Although satellite images and nearby seismic stations showed no evidence of activity, a one-time Urgent Pilot Report and a one-time SIGMET were issued.
Item c, Table 4 - BGVN 31:01: AVO noted that by the end of 6 January 2006 there were no further reports or images of ash production at Cleveland.
Item f, Table 4 - BGVN 33:02: Satellite data from February 2007 revealed evidence of recent activity involving ejection of bombs and debris on the upper flanks and generation of water-rich flows that traveled halfway to the coast. No ash emissions or ash fall deposits were observed. This level of activity -accompanied by persistent thermal anomalies - occurred throughout the spring and early summer. On 4 March 2008, a pilot reported minor ash to 1.5 km above sea level in the vicinity of Cleveland, and a weak thermal anomaly was observed the following day.
Item g, Table 4 - BGVN 33:11: The volcano was relatively quiet until 28 October 2008, when an ash cloud rising to ~4.6 km and drifting E was spotted in satellite imagery. On 29 October, another cloud, 160 km long and drifting NE at an altitude of 3.0 km with little or no ash was observed. A strong thermal anomaly over the summit of the volcano was noted on 30 October 2008, but given the low-level nature of the recent activity, AVO did not elevate the Color Code or Alert Level.
Item k, Table 4 - BGVN 36:05: AVO continued to detect thermal anomalies on 14, 15, 25, and 26 September 2010, and 1 October. During the other days, clouds prevented satellite observation of Cleveland. Although the weather usually prevented observations of Cleveland, weak thermal anomalies were also detected on 14, 19, 25, and 29 October 2010. Clouds completely obscured observations for the week of 1-6 November 2010, but thermal anomalies were again detected on 7 November. The weather then remained cloudy until 16,17, 25, 28, and 30 November 2010, when thermal anomalies were again visible. Thermal anomalies were also recorded on 6, 13, 14, 23, and 27 December 2010, and weak thermal anomalies were visible on 1, 11, and 16 January 2011. A weak thermal anomaly was observed on 1 February 2011, and on 9 February a pilot overflew Cleveland and reported minor, repetitive steam emissions rising hundreds of meters above the summit. The snow on the flanks was pristine, with no indication of recent ash emissions. Steam emissions are common at Cleveland and do not indicate an increased level of unrest.
References. Cervelli, P. F., and Cameron, C. E., 2008, Causation or coincidence? The correlations in time and space of the 2008 eruptions of Cleveland, Kasatochi, and Okmok Volcanoes, Alaska, EOS, Transactions of the American Geophysical Union, Fall Meeting 2008, abstract ##A53B-0278.
Diefenbach, A.K., Guffanti, M., and Ewert, J.W., 2009, Chronology and References of Volcanic Eruptions and Selected Unrest in the United States, 1980-2008, U.S. Geological Survey Open-File Report 2009-1118, 85 p (http://pubs.usgs.gov/of/2009/1118/).
Geologic Background. The beautifully symmetrical Mount Cleveland stratovolcano is situated at the western end of the uninhabited Chuginadak Island. It lies SE across Carlisle Pass strait from Carlisle volcano and NE across Chuginadak Pass strait from Herbert volcano. Joined to the rest of Chuginadak Island by a low isthmus, Cleveland is the highest of the Islands of the Four Mountains group and is one of the most active of the Aleutian Islands. The native name, Chuginadak, refers to the Aleut goddess of fire, who was thought to reside on the volcano. Numerous large lava flows descend the steep-sided flanks. It is possible that some 18th-to-19th century eruptions attributed to Carlisle should be ascribed to Cleveland (Miller et al., 1998). In 1944 it produced the only known fatality from an Aleutian eruption. Recent eruptions have been characterized by short-lived explosive ash emissions, at times accompanied by lava fountaining and lava flows down the flanks.
Information Contacts: Alaska Volcano Observatory (AVO), a cooperative program of a) U.S. Geological Survey, 4200 University Drive, Anchorage, AK 99508-4667, USA (URL: http://www.avo.alaska.edu/), b) Geophysical Institute, University of Alaska, PO Box 757320, Fairbanks, AK 99775-7320, USA, and c) Alaska Division of Geological & Geophysical Surveys, 794 University Ave., Suite 200, Fairbanks, AK 99709, USA; USAToday (URL: http://www.usatoday.com).
Fourpeaked (United States) — January 2012 Cite this Report
Fourpeaked
United States
58.77°N, 153.672°W; summit elev. 2105 m
All times are local (unless otherwise noted)
Syn- and post-eruptive seismicity and emissions; magma intrusion model
Following the 17 September 2006 phreatic eruption of Fourpeaked volcano and subsequent non-juvenile ash emissions and debris flows (Cervelli and West, 2007; BGVN 31:09), low level seismicity (up to M 1.8) and emissions (S02 fluxes up to almost 3,000 tons/day) continued during late 2006 and the first half of 2007. Small explosions occurred during February-April 2007 amidst declining gas emissions. The Alaska Volcano Observatory (AVO) lowered the Aviation Color Code and Volcano Alert Level from Yellow/Advisory to Green/Normal on 6 June 2007 (on a scale from Green/Normal to Red/Warning).
Seismic monitoring network. Prior to the 2006-2007 eruption and unrest, Fourpeaked lacked a monitoring network (BGVN 31:09). A network of monitoring instruments was deployed in stages following the onset of unrest in 2006 (figure 8). The network consisted of 4 short-period seismometers (3 newly-deployed and 1 pre-existing), 2 co-located pressure sensors, and a web camera. As a result of the stepwise deployment of the instruments, the precision and number of earthquakes successfully located by AVO increased during the active period. Following the network's successful operation through the winter of 2006-2007, Fourpeaked was formally recognized as the 31st seismically monitored Alaskan volcano on 3 May 2007.
November 2006-June 2007 activity. AVO reported that low level seismicity and persistent steaming (reaching up to several hundred meters above the summit) continued through the end of 2006. McGimsey and others (2011) reported that an airborne gas survey on 6 November 2006 showed continued elevated S02 emissions (~1,000 tons/day). The measured S02 flux measured soon after the 17 September eruption (figure 9) was more than 2,000 tons/day (McGimsey and others, 2011). In January 2007, AVO reported an earthquake swarm (swarm IV, figure 9), but stated that it was not considered unusual. Until 8 February, activity was typical of the past few months.
Beginning on 8 February 2007, AVO reported small explosive events that were registered on seismic and acoustic instruments, and a possible large steam plume that was noticed in a partly cloudy satellite view. A swarm of 13 locatable earthquakes occurred on 18 February, the largest of which was an M 1.8 event at ~4 km deep; this was the largest seismic event of the 2006-2007 Fourpeaked activity (McGimsey and others, 2011). A gas overflight on 22 February recorded S02 flux values below those measured in November.
Occasional small eruptions continued through March 2007, while seismicity gradually decreased (McGimsey and others 2011). In the last week of March, AVO reported decreased steam emissions from the vents at the summit. Explosive activity and declining gas emissions continued throughout April, and on 18 May, an aerial gas measurement revealed that the S02 flux had decreased to less than 90% of the measured values in September 2006 (Cervelli and West, 2007).
On 6 June 2007, citing declining seismicity and gas emissions, AVO lowered the Aviation Color Code from Yellow to Green, and the Volcanic Activity Alert Level from Advisory to Normal. They noted that "local hazards still [existed] near the summit, including jetting steam and/or very small explosions, unstable snow and ice, hot water and rock, and the possibility for high concentrations of dangerous volcanic gas."
Magma intrusion. Gardine and others (2011) analyzed seismic and gas emission data from the 2006-2007 Fourpeaked eruption and unrest (figure 9) in order to constrain the origin of the eruptive activity. Their findings suggested that the high levels of seismicity and gas emissions during the initial unrest indicated the intrusion of new magma into the upper 10 km of crust. They suggested that the intrusion reactivated fractures, allowing gases exsolved from the magma to be released at the surface. They argued that continued exsolution provided the gases released during the period of unrest, while local stress accumulation led to earthquake swarms (figure 9). They also suggested that the activity ceased only after the magma had cooled and degassed to a point where it became trapped and could no longer overcome the overburden pressure.
References. Cervelli, P.F. and West, M., 2007, The 2006 Eruption of Fourpeaked Volcano, Katmai National Park, Alaska, American Geophysical Union, Fall Meeting 2007, abstract ##V31E-0719.
Gardine, M., West, M., Werner, C., and Doukas, M., 2011, Evidence of magma intrusion at Fourpeaked volcano, Alaska in 2006-2007 from a rapid-response seismic network and volcanic gases, Journal of Volcanology and Geothermal Research, v. 200, issues 3-4, p. 192-200 (DOI: 10.1016/j.jvolgeores.2010.11.018).
McGimsey, R.G., Neal, C.A., Dixon, J.P., Malik, N., and Chibisova, M., 2011, 2007 Volcanic Activity in Alaska, Kamchatka, and the Kurile Islands: Summary of Events and Response of the Alaska Volcano Observatory, US Geological Society Scientific Investigations Report 2010-5242, 103 p.
Geologic Background. Poorly known Fourpeaked volcano in NE Katmai National Park consists of isolated outcrops surrounded by the Fourpeaked Glacier, which descends eastward almost to the Shelikof Strait. The orientation of andesitic lava flows and extensive hydrothermal alteration of rocks near the present summit suggest that it probably marks the vent area. Eruptive activity during the Holocene had not been confirmed prior to the first historical eruption in September 2006. A N-trending fissure extending 1 km from the summit produced minor ashfall.
Information Contacts: Alaska Volcano Observatory (AVO), a cooperative program of a) U.S. Geological Survey (USGS), 4200 University Drive, Anchorage, AK 99508-4667 USA (URL: http://www.avo.alaska.edu/), b) Geophysical Institute, University of Alaska, PO Box 757320, Fairbanks, AK 99775-7320, USA, and c) Alaska Division of Geological & Geophysical Surveys (ADGGS), 794 University Ave., Suite 200, Fairbanks, AK 99709, USA (URL: http://www.dggs.alaska.gov/).
Ol Doinyo Lengai (Tanzania) — January 2012 Cite this Report
Ol Doinyo Lengai
Tanzania
2.764°S, 35.914°E; summit elev. 2962 m
All times are local (unless otherwise noted)
Update on observations; new reports on 2007-2008 eruptions
This report on Ol Doinyo Lengai (hereafter, Lengai) is a continuation of previous Bulletin reports that were based in part on those found on Frederick Belton's Lengai web site (Belton, 2012). Our last report was in September 2010 (BGVN 35:09). Figures 149 and 150 show aerial photographs of Lengai in late 2010.
On 22 June 2011, Hans Schabel took a group of 8 conservation biologists to the Lengai summit up the regular approach along the NNW trail through the Pearly Gates (PG). During the ascent, the weather was cold, worsened by strong, increasingly sulfurous gusts from above. Minor fumaroles produced small clouds just above the PG. At the summit, conditions were relatively clear, making details of the crater rim and the pit visible. The slump on the E crater that Schabel first saw on his previous climb (16 January 2010, BGVN 35:05) had not expanded significantly, but some of the walls of the crater below had obviously slumped into big piles of rubble below. The group heard a 'whoosh' from two boiling, rolling, lava pools that spilled pitch-black lava into a growing lake flowing E in the crater floor (figure 151).
New Reports. Two recent research papers have been published concerning the 2007-2008 explosive eruptions of Lengai (BGVN 32:11, 33:02, 33:06, 33:08, 34:02, and 34:05). Kervyn and others (2010) and Keller and others (2010) summarize the first relatively closely documented 'cycle' from natrocarbonatite to carbonated nephelinite at Lengai. According to Kervyn and others (2010), on 4 September 2007, after 25 years of effusive natrocarbonatite eruptions, the eruptive activity of Lengai changed abruptly to episodic explosive eruptions. This transition was preceded by a voluminous lava eruption in March 2006, a year of quiescence, resumption of natrocarbonatite eruptions in June 2007, and a volcano-tectonic earthquake swarm in July 2007.
Keller and others (2010) noted that, with its paroxysmal ash eruption on 4 September 2007 and the highly explosive activity continuing in 2008, Lengai dramatically changed its behavior, crater morphology (figure 152), and magma composition after 25 years of quiet extrusion of fluid natrocarbonatite lava. This explosive activity resembled the explosive phases of 1917, 1940-1941, and 1966-1967, which were characterized by mixed ashes with dominantly nephelinitic and natrocarbonatitic components. Chemical analyses of the erupted products showed that the 2007-2008 explosive eruptions were associated with an undersaturated carbonated silicate melt. This new phase of explosive eruptions provided constraints on the factors causing the transition from natrocarbonatite effusive eruptions to explosive eruptions of carbonated nephelinite magma, variations observed repetitively in the last 100 years at Lengai.
Table 25 gives the summary of historical activity of Lengai from Keller and others (2010). The table shows the repeated occurrence of explosive paroxysms with documented or inferred natrocarbonatite activity in between the explosive eruptions.
Table 25. Synopis of the historical activity of Lengai, with observations covering about 100 years (since 1904 to 2008). References cited in the table are listed in the 'References to Table 25' section at the end of this Bulletin report. From Keller and others (2010).
| Date(s) |
Observations (references) |
| ca. 1880 |
First reports by early explorers: "Snow on the summit, Smoke at the summit." Volcanic activity reported by local people (Fischer, 1885; Neumann, 1894). |
| 1904 |
First ascent by F. Jaeger (Uhlig, 1905) |
| 1913 |
"Sodaschlammströme" (Reck and Schulze, 1921), from this inferred, effusive natrocarbonatite activity. Hornito morphology changed between photographs taken 1904 and 1915. Geological record: carbonatite platform below 1917 nephelinites (Keller and Krafft, 1990; Zaitsev and others, 2008a). |
| 1917 |
Major explosive eruption. Ash eruptions, nephelinite lavas, and agglomerates. Geological record: nephelinite lavas and agglomerates above carbonatite platform forming the western and eastern crater rim before the 2007/2008 events. |
| 1921, 1926 |
Eruption reports for 1921, 1926 classified as "minor" (Barns, 1921; Richard, 1942). |
| 1940-41 |
Explosive eruption. "Soda-rich ashes" (Richard, 1942). Geological record: "Surge-series" bracketed between 1917 and 1966/1967 pyroclastics in the summit area. Ashes, spherical lapilli, bomb field. Ashes mixed of silicate and carbonatite components. |
| 1954/1955 |
Explosive eruption classified as "minor" (Guest, 1956). |
| 1960 |
Effusive activity. First recognition and analysis of natrocarbonatites (Dawson, 1962). |
| 1966-67 |
Explosive eruptions (Dawson and others, 1968, 1992). "Mixed ashes." Geological record: "Grey series" ashes with spherical CWN lapilli on all slopes of the cone. Re-interpretation of the "Footprint Tuff" of Hay, 1983. |
| mid-1967 to 1983 |
Reported quiescence. |
| 1983-88 |
Minor explosive eruption, probably natrocarbonatitic (Nyamweru, 1997). |
| 1988-2007 |
Regularly documented effusive natrocarbonatite activity (Nyamweru, 1990; Keller and Krafft, 1990; Dawson and others, 1990, 1995; Keller and others, 2007; Kervyn and others, 2008). |
| 04 Sep 2007 |
Explosive paroxysm. |
| 2007-08 |
Since 4 Sep 2007 through early 2008, explosive eruptions with plumes over 10 km. Geological record: ashes, lapilli and scoriae of carbonated combeite-wollastonite-melilite nephelinite. |
References. Belton, F., 2012, Mountain of God (URL: http://oldoinyolengai.pbworks.com/w/page/33191422/Ol Doinyo Lengai2C The Mountain of God).
Keller, J., Klaudius, J., Kervyn, M., Ernst, G.G.J., and Mattsson, H.B., 2010, Fundamental changes in the activity of the natrocarbonatite volcano Oldoinyo Lengai, Tanzania: I. New magma composition during the 2007-2008 explosive eruptions, Bulletin of Volcanology, v. 72, no. 8, pp. 893-912. DOI 10.1007/s00445-010-0371-x.
Kervyn, M., Ernst, G.G.J., Keller, J., Vaughan, R.G., Klaudius, J., Pradal, E., Belton, F., Mattsson, H.B., Mbede, E., and Jacobs, P., 2010, Fundamental changes in the activity of the natrocarbonatite volcano Oldoinyo Lengai, Tanzania: II. Eruptive behaviour during the 2007-2008 explosive eruptions, Bulletin of Volcanology, v. 72, no. 8, pp. 913-931. DOI 10.1007/s00445-010-0360-0.
Klaudius, J., and Keller, J., 2006, Peralkaline silica lavas at Oldoinyo Lengai, Tanzania, Lithos, v. 91, no. 1-4, pp. 173-190.
Mattsson, H.B., and Reusser, E., 2010, Mineralogical and geochemical characterization of ashes from an early phase of the explosive September 2007 eruption of Oldoinyo Lengai (Tanzania), Journal of African Earth Sciences, v. 58, no. 5, pp. 752-763.
Wiedenmann, D., Keller, J., and Zaitsev, A.N., 2010, Melilite-group minerals at Oldoinyo Lengai, Tanzania, Lithos, v. 118, no. 1-2, pp. 112-118.
References to Table 25. Barns, T.A., 1921, The highlands of the Great Craters, Tanganyika Territory, Geographic Journal, v. 58, pp. 401-416.
Dawson, J.B., 1962, The geology of Oldoinyo Lengai, Bulletin of Volcanology, v. 24, pp. 348-387.
Dawson, J.B., Bowden, P., and Clark, G.C., 1968, Activity of the carbonatite volcano Oldoinyo Lengai, 1966, Geol Rundsch, v. 57, pp. 865-879.
Dawson, J.B., Pinkerton, H., Norton, G.E., and Pyle, D., 1990, Physicochemical properties of alkali carbonatite lavas: data from the 1988 eruption of Oldoinyo Lengai, Tanzania, Geology, v. 18, pp. 260-263.
Dawson, J.B., Smith, J.V., and Steele, I.M., 1992, 1966 ash eruption of the carbonatite volcano Oldoinyo Lengai: mineralogy of lapilli and mixing of silicate and carbonate magmas, Mineralogical Magazine, v. 56, pp. 1-16.
Dawson, J.B., Keller, J., and Nyamweru, C., 1995, Historic and recent eruptive activity of Oldoinyo Lengai. In: Bell K, Keller J (eds) Carbonatite volcanism: Oldoinyo Lengai and the petrogenesis of natrocarbonatites, IAVCEI Proceedings on Volcanology, v. 4. Springer, Berlin, pp. 4-22.
Fischer, G.A., 1885, Bericht über die im Auftrage der Geographischen Gesellschaft in Hamburg unternommene Reise in das Masai-Land 1882-1883. II: Begleitworte zur Original-Routenkarte, Mitt Geogr Ges Hamburg 1885, pp. 189-237.
Guest, N.J., 1956, The volcanic activity of Oldoinyo L'Engai, 1954, Rec Geol Surv Tanganyika, v. 4, pp. 56-59.
Hay, R.L., 1983, Natrocarbonatite tephra of Kerimasi volcano, Tanzania, Geology, v. 11, pp. 599-602.
Keller, J., and Krafft, M., 1990, Effusive natrocarbonatite activity of Oldoinyo Lengai, June 1988, Bulletin of Volcanology, v. 52, pp. 629-645.
Keller, J., Zaitsev, A.N., and Klaudius, J., 2007, Geochemistry and petrogenetic significance of natrocarbonatites at Oldoinyo Lengai, Tanzania: composition of lavas from 1988 to 2007, Goldschmidt Conference 2007, Cologne, Abstracts.
Kervyn, M., Klaudius, J., Keller, J., Kervyn, F., Mattsson, H., Belton, F., Mbede, E., Jacobs, P., and Ernst,G.G.J., 2008, Voluminous lava floods at Oldoinyo Lengai in 2006: chronology of events and insights into the shallow magmatic system. Bulletin of Volcanology, v. 70, pp. 1069-1086.
Neumann, O., 1894, In: Matschie, P., Nachrichten aus den deutschen Schutzgebieten. Deutsch-Ostafrika. Von der wissenschaftlichen Expedition Oskar Neumanns, Deutsches Kolonialblatt, v. 21, pp 421-424.
Nyamweru, C. 1990, Observations on changes in the active crater of Oldoinyo Lengai from 1960 to1988, Journal of African Earth Sciences, v. 11, pp. 385-390.
Nyamweru, C., 1997, Changes in the crater of Oldoinyo Lengai, Journal of African Earth Sciences, v. 25, pp. 43-53.
Reck, H., and Schulze, G., 1921, Ein Beitrag zur Kenntnis des Baues und der jüngsten Veränderung des L'Engai Vulkans im nördlichen Deutsch-Ostafrika, Z Vulk, v. 6, pp. 47-71.
Richard, J.J., 1942, Volcanological observations in East Africa. I Oldoinyo Lengai. The 1940-1 eruption, Journal of East Africa Uganda Natural Historical Society, v. 16, pp. 89-108.
Uhlig, C., 1905, Bericht über die Expedition der Otto-Winter-Stiftung nach den Umgebungen des Meru. Zeitschrift der Gesellschaft für Erdkunde zu Berlin, Jg 1905, pp. 120-123.
Zaitsev, A.N., Keller, J., Spratt, J., Perova, E.N., and Kearsley, A., 2008a, Nyerereite-pirssonite-calcite-shortite relationships in altered natrocarbonatites, Oldoinyo Lengai, Tanzania, Canadian Mineralogy, v. 46, pp. 1077-1094.
Zaitsev, A.N., Keller, J., Spratt, J., Jeffries, T.E., and Sharigin, V.V., 2008b, Chemical composition of nyerereite and gregoryite in natrocarbonatites of Oldoinyo Lengai Volcano, Tanzania, Procedings of the Russian Mineralogical Society, v. 137, pp. 101-111.
Geologic Background. The symmetrical Ol Doinyo Lengai is the only volcano known to have erupted carbonatite tephras and lavas in historical time. The prominent stratovolcano, known to the Maasai as "The Mountain of God," rises abruptly above the broad plain south of Lake Natron in the Gregory Rift Valley. The cone-building stage ended about 15,000 years ago and was followed by periodic ejection of natrocarbonatitic and nephelinite tephra during the Holocene. Historical eruptions have consisted of smaller tephra ejections and emission of numerous natrocarbonatitic lava flows on the floor of the summit crater and occasionally down the upper flanks. The depth and morphology of the northern crater have changed dramatically during the course of historical eruptions, ranging from steep crater walls about 200 m deep in the mid-20th century to shallow platforms mostly filling the crater. Long-term lava effusion in the summit crater beginning in 1983 had by the turn of the century mostly filled the northern crater; by late 1998 lava had begun overflowing the crater rim.
Information Contacts: Frederick Belton, Developmental Studies Department, PO Box 16, Middle Tennessee State University, Murfreesboro, TN 37132, USA (URL: http://oldoinyolengai.pbworks.com/); Laura Carmody, Department of Earth Science, University College London, Gower Street, London, WC1E 6BT, United Kingdom; Michael Dalton-Smith, Digital Crossing Productions (URL: http://digitalcrossing.ca/); Adrian P. Jones, Department of Earth Science, University College London, Gower Street, London, WC1E 6BT, United Kingdom; Sonja Joplin, One Heart Source (URL: http://www.oneheartsource.org); Matthew J. Genge, Department of Earth Science and Engineering, Royal School of Mines, Prince Consort Road, Imperial College London, SW7 2BP United Kingdom; Wendy Nelson, Department of Terrestrial Magnetism, Carnegie Institution of Washington, 5241 Broad Branch Rd, NW Washington, DC 20015, USA; Hans Schabel, retired forestry professor; Dave Simpson, Dave Simpson, professional guide, Kenya, East Africa (URL: http://www.davesimpsonsafaris.com); Ben Wilhelmi, commercial pilot (URL: http://benwilhelmi.typepad.com/benwilhelmi/).
Martin (United States) — January 2012 Cite this Report
Martin
United States
58.172°N, 155.361°W; summit elev. 1863 m
All times are local (unless otherwise noted)
Seismic swarm in January 2006
Activity at Mount Martin volcano since our last report (March 1995, BGVN 20:03) was marked by typical activity (summit fumarolic activity, often generating thick steam plumes reaching up to 1 km above the summit; Neal and others, 2009), occasionally interrupted by increased seismicity. The most notable event was a seismic swarm in January 2006.
Outstanding activity. An increase in seismicity during October 1996 was attributed to an actively degassing intrusion at the neighboring Mount Mageik volcano, ~7 km ENE of Martin (Jolly and McNutt, 1999). Other increases in seismicity occurred in December 1998, May-July 1999, January 2006 (the largest swarm at Martin since it has been monitored, discussed below), and May-June 2007 (figure 1).
January 2006 seismic swarm. The January 2006 Mount Martin seismic swarm included 860 locatable earthquakes (figures 1 and 2), more than four times the number of earthquakes seen during other periods of increased seismicity or seismic swarms since the region has been monitored. No recorded earthquakes during the swarm were much greater than M 2 (figure 2d), and a significant number of earthquakes were of magnitudes below the magnitude of completeness, Mc (figure 2a-c). Mc is the minimum magnitude needed to reliably locate an earthquake, reported by Dixon and Power (2009) to be Mc = 0.2 for Mount Martin.
Dixon and Power (2009) concluded that the pattern of the seismicity of the January 2006 swarm was characteristic of a volcanic earthquake sequence (as opposed to a tectonic earthquake sequence, which begins with a large mainshock) since the located hypocenters of the swarm occurred in the same space as those during previous background periods (figure 3). However, citing the short duration of the swarm, similar focal mechanisms compared to background periods, and the lack of long-period earthquakes, Dixon and Power (2009) stated that the data was not suggestive of a large intrusion of magma beneath Martin.
References. Dixon, J.P., and Power, J.A., 2009, The January 2006 Volcanic-tectonic earthquake swarm at Mount Martin, Alaska, in Haeussler, P.J., and Galloway, J.P., eds, Studies by the U.S. Geological Survey in Alaska, 2007: U.S. Geological Survey Professional Paper 1760-D, 17 p.
Jolly, A.D., McNutt, S.R., 1999, Seismicity at the volcanoes of Katmai National Park, Alaska; July 1995-December 1997, Journal of Volcanology and Geothermal Research, vol. 93, issues 3-4, pg. 173-190 (DOI: 10.1016/S0377-0273(99)00115-8).
Neal, C.A., McGimsey, R.G., Dixon, J.P., Manevich, A., and Rybin, A., 2009, 2006 Volcanic Activity in Alaska, Kamchatka, and the Kurile Islands: Summary of Events and Response of the Alaska Volcano Observatory, U.S. Geological Survey Scientific Investigations Report 2008-5214, 102 p.
Geologic Background. The mostly ice-covered Mount Martin stratovolcano lies at the SW end of the Katmai volcano cluster in Katmai National Park. The volcano was named for George C. Martin, the first person to visit and describe the area after the 1912 eruption. It is capped by a 300-m-wide summit crater, which is ice-free because of an almost-constant steam plume; it also contains a shallow acidic lake. The edifice was constructed entirely during the Holocene, and overlies glaciated lava flows of the adjacent mid- to late-Pleistocene Alagoshak volcano to the WSW. Martin consists of a small fragmental cone that was the source of ten thick overlapping blocky dacitic lava flows, largely uneroded by glaciers, that descend 10 km to the NW, cover 31 km2, and form about 95% of the eruptive volume of the volcano. Two reports of historical eruptions that originated from uncertain sources were attributed by Muller et al. (1954) to Martin.
Information Contacts: Alaska Volcano Observatory (AVO), a cooperative program of a) U.S. Geological Survey (USGS), 4200 University Drive, Anchorage, AK 99508-4667 USA (URL: http://www.avo.alaska.edu/), b) Geophysical Institute, University of Alaska, PO Box 757320, Fairbanks, AK 99775-7320, USA, and c) Alaska Division of Geological & Geophysical Surveys (ADGGS), 794 University Ave., Suite 200, Fairbanks, AK 99709, USA (URL: http://www.dggs.alaska.gov/).
Cerro Negro (Nicaragua) — January 2012 Cite this Report
Cerro Negro
Nicaragua
12.506°N, 86.702°W; summit elev. 728 m
All times are local (unless otherwise noted)
Non-eruptive activity; fumarole and seismic monitoring; new crater morphology
Cerro Negro remained non-eruptive from 2003 to 2011; explosive activity was last recorded in December 1999 (BGVN 24:11). Our last report reviewed Cerro Negro's fumarolic field observations, including descriptions of passive degassing and measurements of temperatures from June 2002 through May 2003, provided courtesy of Instituto Nicaragüense de Estudios Territoriales (INETER) and international collaborators (BGVN 28:07). No volcanic ash advisory reports for the area of Cerro Negro were released by the Washington VAAC office during 2003-2011. The following report reviews seismicity from 2003 to 2011, field observations, and emission measurements provided by INETER. The primary physical features of Cerro Negro highlighted in this report include the 1992 and 1995 central craters as well as the three 1999 craters, which continued to steam in 2007 (figure 15).
Figure 15 consists of a false-color image made from visible, near- and mid-infrared bands (3,7,2) to enhance geological features. Cerro Negro appears dark-red in the center of the image. The central cone, which was the source of many lava flows, lies immediately to the left of "1960" (the label dating the eruption associated with one of the lava flows). The tiny, arcuate pink and green zones at the central cone represent the rim of the nested craters there. Those craters are the scene of the highest fumarolic activity.
On the cone's S flanks, the three small cones created during the 1999 eruption appear as bright pink points. In figure 15 these appear immediately right of "1999".
Several volcanoes of the NW trending Marrabios range of Western Nicaragua are labeled on figure 15. Along the range to the SE is the historically active El Hoyo (Las Pilas) volcanic complex, which in figure 15 is partly cloud-covered. The complex includes Las Pilas, Cerro Grande, and Cerro Ojo de Agua eruptive centers. To the N and NW of Cerro Negro lie the volcanic centers Cerro la Mula and Rota.
Post-eruptive seismicity from 1999 to 2003. The INETER December 2003 report discussed seismicity after the small-scale, cone-forming events in 1999. INETER described Cerro Negro as relatively quiet since the 1999 episode; minor ash and gas explosions occurred as late as 25 December 1999. Earthquake counts from August 1999 to December 2003 ranged from 40 to 100 earthquakes per month, typically volcanic-tectonic (VT) events. Low amplitude tremor (frequency ranges of 8-19 Hz) was detected throughout 2003.
Figure 16 depicts multi-year seismicity and illustrates comparitive highs during 2003, particularly in January, September, and December when the the number of monthly earthquakes rose to over 100. These swarms led to counts roughly 10-fold higher than the 18-month interval of quiet from middle to late 2001. The later seismic swarm, occurring from 30 to 31 December, comprised 37 events too small to locate.
During 2003, INETER visited the volcano and found the scene without visible sign of change, without felt earthquakes, and lacking anomalous gas emissions. Fumarole temperatures from eight sites were in the range ~100-400°C. The only anomalous temperature increase in 2003 appeared at two fumaroles measuring ~550°C on 27 August. That was an increase of more than 200°C since July 2003.
2004 banded tremor and elevated seismicity. Although not ploted on figure 16, elevated seismicity continued through January, February, and March 2004. Banded tremor was recorded until 20 January, when it began to diminish. In January, RSAM was not greater than 50 units, but several cautionary public announcements were made regarding persistent tremor and its typical association with explosive activity.
Although INETER reported decreased tremor toward the end of January 2004, a seismic swarm occurred from 23 to 27 January. On 26 January the highest number of earthquakes registered (203 earthquakes, ~50 more than high of December 2003).
Of the ~1,200 earthquakes registered during January 2004, only three were located. During 3-29 February, ~400 events were registered and 33 were located. In March, 23 earthquakes were located and during the following months, significant events became rare averaging ~3 events located per month for the rest of the year. In March, tremor reached only 5 RSAM units.
Field visits by INETER determined that fumarole temperatures in March, May, June, and July 2004, ~50-350°C, spanned a wider range than those from the previous year. INETER had been measuring temperatures from several fumaroles (three to eight sites) within the crater since 1999 (figure 12 in BGVN 24:06 shows two primary fumarole locations in a map developed after major crater changes in 1995).
Press accounts regarding the seismic swarms. Officials interviewed by the newspaper La Prensa on 17 January 2004 included the mayor of León, who stated that the municipality's Emergency Committee was activated and on standby. The director of INETER's Volcanology program, Martha Navarro, also explained that caution was merited due to experience from Cerro Negro's 1999 escalation. Similar seismic tremor was recorded recently from the volcano, but conditions had clearly changed since 1999 and no explosions had occurred. The director also noted that on 11 January 2004 visiting scientists had looked for substantial sulfur-dioxide emissions but found them absent.
On 22 January 2004, a Civil Defense representative told La Prensa that recent reports of plumes from the crater were false and that no physical changes had occurred at Cerro Negro during the December-January seismic unrest. Passive degassing had been occurring at the summit and from fumaroles since the 1999 events but may have appeared anomalous to local observers. Regular monitoring by INETER had shown elevated temperatures from the fumaroles and steam frequently escaped from the three 1999 cinder cones (figure 15). According to La Prensa, the Civil Defense representative also shared details regarding new installations of seismic stations and gas-monitoring sites. A collaborative effort between Civil Defense and INETER made this possible.
2005-2011 rockfalls and altered crater morphology. Routine monitoring by INETER from 2005 through 2011 has been recorded in monthly reports available online in Spanish with English abstracts, works that chiefly documented passive degassing through this time period. Fumarole temperatures ranged from 13°C to ~400°C. In May 2003, seven fumaroles had elevated temperatures (BGVN 28:07), but in April 2008, six of these sites had ceased discharging measurable emissions. By July 2008, four fumarole sites were emitting gas and elevated temperatures ranging from 96 to 285°C that month and appeared stable through 2011.
INETER began reporting significant rockfalls along Cerro Negro's S and SW interior crater walls in 2009. These rockfalls continued through 2011 and released meter-sized blocks of coherent rock as well as highly altered material that collected within the crater (figure 17). INETER suggested that some of the large rockfalls may have been caused by large rainfalls, particularly those events during July 2009 and May-July 2010.
A significant geomorphic change at Cerro Negro was noted by INETER investigators on 11 January 2011. A N-trending fault had appeared since the last field visit (10 November 2010) on the SE interior crater wall (figure 18). Offset along the fault measured ~30 cm. Based on field relations INETER suggested this feature appeared gradually. The fault intersected fumarole ##1, a reliable site for thermal measurements. A major system of normal faults had already been documented to the NW of Cerro Negro, and the new fault on the cone appeared to trend parallel to it.
Seismicity at Cerro Negro remained generally low from 2005 through 2011 although tremor was detected regularly. At times, tremor was as low as 5 RSAM units (July 2009) and as high as 30 (December 2010 and September 2011). Numerous VT events were recorded in 2006 (~347) and in 2011 (~240) and accordingly, the number of significant located events was higher for those years as well, 25 and 32, respectively (table 4).
Table 4. Significant earthquakes located near Cerro Negro from 2003 through 2011. For each year, the table lists the number of located earthquakes, range of local magnitudes (ML), range of focal depths, and most frequently-occurring focal depth. Courtesy of INETER.
| Year |
# EQs |
ML |
Depth1 (km) |
Depth2 (km) |
| 2003 |
13 |
1.5-3.3 |
0-8 |
2 |
| 2004 |
86 |
0.6-2.7 |
0-13 |
0 |
| 2005 |
23 |
1.0-2.6 |
1-61 |
2 |
| 2006 |
25 |
0.8-3.3 |
1-157 |
2 |
| 2007 |
6 |
1.9-2.8 |
2-6 |
6 |
| 2008 |
5 |
0.5-3.1 |
1-194 |
2 |
| 2009 |
1 |
3.1 |
4 |
4 |
| 2010 |
6 |
1.5-2.8 |
2-88 |
3 |
| 2011 |
32 |
0.5-3.5 |
0-140 |
3 |
The range of focal depths was relatively large in 2006 and 2011. The deepest earthquake during 2003-2011 struck on 23 December 2008 with local magnitude (ML) 3.1 and located ~190 km below sea level. The most frequently occurring focal depth during 2005-2011 was very shallow, 2 km below sea level, under ML 3.5.
During field campaigns on 21-27 February 2011, a collaborative effort between Spain's Instituto Tecnológico y de Energías Renovables (ITER) and INETER mapped the spatial CO2-flux pattern. The team was able to map CO2 fluxes from multiple diffuse sources over the cone and within Cerro Negro's 1992 and 1995 craters (figure 19). An overall total CO2 flux of 43 tons per day was determined; a similar measurement was obtained in 2010 (44 tons per day). Collaborative efforts between ITER and INETER have applied this mapping technique since 1999 in order to locate anomalous areas of emissions from the cone and to calculate total flux (Dionis, S. and others 2010). These investigators noted that the years following the 1999 explosion were marked by decreasing levels of CO2 however, an increasing trend appeared from December 2008 to March 2009; values ranged from 12 tons per day to 38 tons per day.
References. Dionis, S., Melián, G., Barrancos, J., Padilla, G., Calvo, D., Rodríguez, F., Padrón, E., Nolasco, D., Hernández, Pedro A., Pérez, N. M., Ibarra, M., and Muñoz, A., 2010. Dynamics of diffuse CO2 emission and eruptive cycle at Cerro Negro volcano, Nicaragua, Cities on Volcanoes 6, Puerto de la Cruz, Tenerife, 31 May-4 June, 2010, Abs, p 103.
Hill, B. E., Connor, C.B, Jarzemba, M.S., La Femina, P.C., Navarro, M., and Strauch, W., 1998, 1995 eruptions of Cerro Negro volcano, Nicaragua, and risk assessment for future eruptions, Geological Society of America Bulletin, 110, no. 10;1231-1241.
NASA Landsat Program, 2003, Landsat ETM+ scene 7dt19991115, SLC-Off, USGS, Sioux Falls, Nov. 15, 1999.
McKnight, S.B. and Williams, S.N., 1997, Old cinder cone or young composite volcano?: The nature of Cerro Negro, Nicaragua, Geology, 25, 339-342.
Geologic Background. Nicaragua's youngest volcano, Cerro Negro, was created following an eruption that began in April 1850 about 2 km NW of the summit of Las Pilas volcano. It is the largest, southernmost, and most recent of a group of four youthful cinder cones constructed along a NNW-SSE-trending line in the central Marrabios Range. Strombolian-to-subplinian eruptions at intervals of a few years to several decades have constructed a roughly 250-m-high basaltic cone and an associated lava field constrained by topography to extend primarily NE and SW. Cone and crater morphology have varied significantly during its short eruptive history. Although it lies in a relatively unpopulated area, occasional heavy ashfalls have damaged crops and buildings.
Information Contacts: Instituto Nicaragüense de Estudios Territoriales (INETER), Apartado Postal 2110, Managua, Nicaragua (URL: http://www.ineter.gob.ni/); Global Land Cover Facility ( URL: http:// http://www.glcf.umiacs.umd.edu/); Instituto Tecnológico y de Energías Renovables (ITER), 38611 Granadilla, Tenerife, Canary Islands, Spain (URL: http://www.iter.es/); Washington Volcanic Ash Advisory Center (VAAC), Satellite Analysis Branch (SAB), NOAA/NESDIS E/SP23, NOAA Science Center Room 401, 5200 Auth Rd, Camp Springs, MD 20746, USA (URL: http://www.ospo.noaa.gov/Products/atmosphere/vaac/); La Prensa de Nicaragua, Managua, Nicaragua (URL: http://www.laprensa.com.ni/).
Spurr (United States) — January 2012 Cite this Report
Spurr
United States
61.299°N, 152.251°W; summit elev. 3374 m
All times are local (unless otherwise noted)
Summit ice cauldron, debris flows through 2006; fumarolic activity continues
The 2004 unrest at Mount Spurr (BGVN 29:10) continued for nearly two years before the Alaska Volcano Observatory (AVO) lowered the Level of Concern Color Code from Yellow to Green (on a scale from Green to Yellow to Orange to Red) on 21 February 2006. During those two years, hydrothermal and fumarolic activity within the ice-filled summit crater resulted in the formation of a summit ice cauldron and emplacement of debris-flow deposits on the upper slopes of Spurr. The summit crater and cauldron remained active after most other signs of unrest had declined. This report discusses observations of the development of the unrest following November 2004 (activity prior to that time covered in BGVN 29:10).
A depression in the summit ice was observed in its early stages in June 2004 (figures 12 and 13). The subsidence became more pronounced, and was recognized as an ice cauldron on 2 August, following debris flows emplaced in late July (figure 14). The cauldron housed a lake, whose water was described by Neal and others (2005) and McGimsey and others (2008) as "dark battleship gray" and turquoise in color, respectively, likely due to dissolved sulfur compounds (figure 15).
Ice cauldron widens. Neal and others (2005) reported that measurements made on 10 August and 30 October 2004 revealed enlargement of the ice cauldron from ~65 m x 95 m to ~130 m x 130 m in two and a half months' time. Gas measurements during the same time revealed that CO2 emissions had more than doubled (figure 16).
Forward Looking Infrared Radiometer (FLIR) measurements on 24 September showed that the crater lake was ~0 °C (substantially warmer than the surrounding ice and snow), and the surrounding exposed bedrock (and main fumarolic emission area) was as hot as ~39 °C (figure 15).
By the end of 2004, seismicity remained elevated, and most located earthquakes were within 0-5 km depth below sea level (figure 17; Neal and others 2005).
During 2005, growth of the summit ice cauldron continued (figures 18 and 19), and areas of exposed bedrock increased along the N and NW walls of the crater. According to McGimsey and others (2008), FLIR measurements on 25 April 2005 showed similar temperatures to those measured in September 2004 (figure 15).
May 2005 debris flow. A small debris flow was captured on webcam views of the summit on 2 May 2005 (figure 20). Observations a week later revealed that the cauldron lake level had dropped by ~15 m, and fumaroles on the N shore of the lake had been exposed (McGimsey and others, 2008). The fumaroles were described as vigorous by McGimsey and others (2008). FLIR measurements during an observation flight on 21 June indicated increasing temperatures of exposed bedrock within the crater (up to 60 °C; orange areas within the ice cauldron outline, figure 20) and observers noted strong upwelling within the N half of the cauldron lake.
The likely (or at least nearly) contemporaneous lake level drop and debris flow on 2 May were not associated with any significant ice collapse into the cauldron lake; Coombs and others (2006) thus concluded that the debris flows were the result of widening of englacial or subglacial pathways by erosion, heating, or glacial flow (cross-section, figure 20). They also interpreted the main source of the debris carried in the debris flows to be melted glacial ice containing layers of tephra and ash. The primary source of the tephra and ash layers was likely the 1992 eruptions of Crater Peak (Spurr's satellite cone and youngest vent) and possibly the 1989-90 eruptions of Mount Redoubt (Coombs and others, 2006). Some component of the debris was also likely sourced from the summit crater floor and wall rocks.
Snow/ice melts from summit crater. By 1 August 2005, the ice cauldron had reached its largest size (i.e. the snow/ice had melted from within the perimeter of the summit crater; figures 18 and 19), and was thus no longer termed the "ice cauldron", but simply the summit crater (McGimsey, personal communication, 2012). In September, the crater lake was observed to be completely ice-free, and most likely remained as such through mid January 2006. McGimsey and others (2008) reported that, as of 3 November 2005, ~5.4 x 10⁶ m3 of ice and snow had been melted and consumed by the summit lake.
Decreasing seismicity prompted the AVO to lower the Level of Concern Color Code from Yellow to Green on 21 February 2006. With the exception of an earthquake swarm during 11-12 April, seismicity continued to decrease, and reached background levels by May 2006. During the earthquake swarm, Neal and others (2009) reported 157 volcano-tectonic earthquakes (reaching M ~2.3) that occurred at less than 5 km depth below sea level and ~1-3 km W of the summit. FLIR measurements two days after the earthquake swarm revealed that fumaroles within the summit crater were as hot as 150 °C (Neal and others, 2009). By mid July, however, snow and ice had started accumulating on the lake's surface, and by 17 November 2006, a rise in the level of the lake was observed. As fumarolic activity continued, yellow, sulfur stained ice and snow, as well as a strong sulfur smell, was often reported by pilots passing the summit.
Since 2006, most of the sides and bottom of the summit crater have been covered by snow, with the exception of the fumarole field in the N part of the crater floor. As of the last observation flight, the fumarole field maintained a small patch of snow/ice free bedrock on the summit crater's floor, an area still active as of 28 August 2011 (figure 21). Later satellite imagery suggested that the fumarole field had been covered as the summit crater filled with snow and ice during the first part of the 2011-2012 winter (figure 22), but there have been no observation flights to confirm this as of 24 February 2012.
Coombs and others (2006) stated that the overall effect of the hydrothermal activity (including water/debris flow releases from the summit) on the glacial system of Spurr were likely minimal, pointing out that the volume of water released was relatively small and probably easily accommodated "without significant modification of the icemass."
References. Coombs, M.L., Neal, C.A., Wessels, R.L., and McGimsey, R.G., 2006, Geothermal disruption of summit glaciers at Mount Spurr Volcano, 2004-6: An unusual manifestation of volcanic unrest: U.S. Geological Survey Professional Paper 1732-B, 33 p.
Doukas, M.P., and McGee, K.A., 2007, A compilation of gas emission-rate data from volcanoes of Cook Inlet (Spurr, Crater Peak, Redoubt, Iliamna, and Augustine) and Alaska Peninsula (Douglas, Fourpeaked, Griggs, Mageik, Martin, Peulik, Ukinrek, and Veniaminof), Alaska, from 1995-2006: U.S. Geological Survey Open-File Report 2007-1400, 16 p.
McGimsey, R.G., Neal, C.A., Dixon, J.P., and Ushakov, S., 2008, 2005 Volcanic activity in Alaska, Kamchatka, and the Kurile Islands: Summary of events and response of the Alaska Volcano Observatory: U.S. Geological Survey Scientific Investigations Report 2007-5269, 94 p.
Neal, C.A., McGimsey, R.G., Dixon, J.P., Manevich, A., and Rybin, A., 2009, 2006 Volcanic activity in Alaska, Kamchatka, and the Kurile Islands: Summary of events and response of the Alaska Volcano Observatory: U.S. Geological Survey Scientific Investigations Report 2008-5214, 102 p.
Neal, C.A., McGimsey, R.G., Dixon, J., and Melnikov, D., 2005, 2004 Volcanic activity in Alaska and Kamchatka: Summary of events and response of the Alaska Volcano Observatory: U.S. Geological Survey Open-File Report 2005-1308, 71 p.
Geologic Background. Mount Spurr is the closest volcano to Anchorage, Alaska (130 km W) and just NE of Chakachamna Lake. The summit is a large lava dome at the center of a roughly 5-km-wide amphitheater open to the south formed by a late-Pleistocene or early Holocene debris avalanche and associated pyroclastic flows that destroyed an older edifice. The debris avalanche traveled more than 25 km SE, and the resulting deposit contains blocks as large as 100 m in diameter. Several ice-carved post-collapse cones or lava domes are present. The youngest vent, Crater Peak, formed at the southern end of the amphitheater and has been the source of about 40 identified Holocene tephra layers. Eruptions from Crater Peak in 1953 and 1992 deposited ash in Anchorage.
Information Contacts: Bruce Hopper, Game McGimsey, and Christina Neal, Alaska Volcano Observatory (AVO), a cooperative program of a) U.S. Geological Survey (USGS), 4200 University Drive, Anchorage, AK 99508-4667 USA (URL: http://www.avo.alaska.edu/), b) Geophysical Institute, University of Alaska, PO Box 757320, Fairbanks, AK 99775-7320, USA, and c) Alaska Division of Geological & Geophysical Surveys (ADGGS), 794 University Ave., Suite 200, Fairbanks, AK 99709, USA (URL: http://www.dggs.alaska.gov/); Digital Globe, Inc. (URL: http://www.digitalglobe.com/).