Recently Published Bulletin Reports
Erebus (Antarctica) Lava lake remains active; most thermal alerts recorded since 2019
Rincon de la Vieja (Costa Rica) Frequent phreatic explosions during July-December 2023
Bezymianny (Russia) Explosion on 18 October 2023 sends ash plume 8 km high; lava flows and incandescent avalanches
Kilauea (United States) Low-level lava effusions in the lava lake at Halema’uma’u during July-December 2022
Nyamulagira (DR Congo) Lava flows and thermal activity during May-October 2023
Bagana (Papua New Guinea) Explosions, ash plumes, ashfall, and lava flows during April-September 2023
Mayon (Philippines) Lava flows, pyroclastic flows, ash emissions, and seismicity during April-September 2023
Nishinoshima (Japan) Eruption plumes and gas-and-steam plumes during May-August 2023
Krakatau (Indonesia) White gas-and-steam plumes and occasional ash plumes during May-August 2023
Villarrica (Chile) Strombolian activity, gas-and-ash emissions, and crater incandescence during April-September 2023
Merapi (Indonesia) Frequent incandescent avalanches during April-September 2023
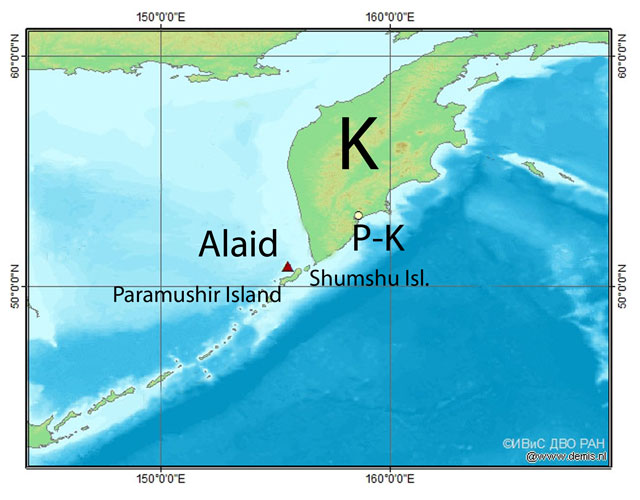
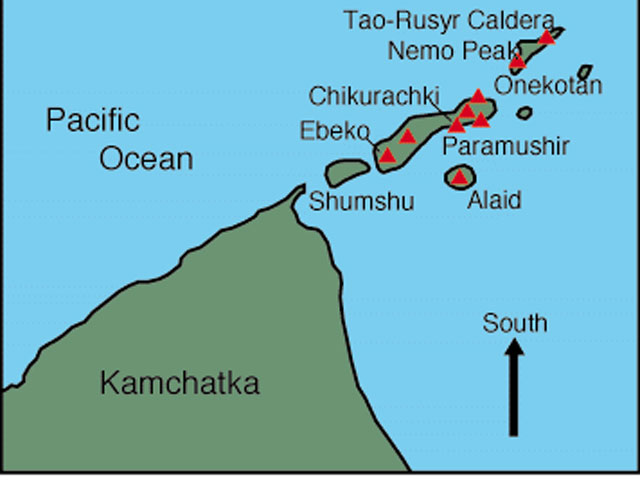
Ebeko (Russia) Moderate explosive activity with ash plumes continued during June-November 2023
Erebus (Antarctica) — January 2024  Cite this Report
Erebus
Antarctica
77.53°S, 167.17°E; summit elev. 3794 m
All times are local (unless otherwise noted)
Lava lake remains active; most thermal alerts recorded since 2019
The lava lake in the summit crater of Erebus has been active since at least 1972. Located in Antarctica overlooking the McMurdo Station on Ross Island, it is the southernmost active volcano on the planet. Because of the remote location, activity is primarily monitored by satellites. This report covers activity during 2023.
The number of thermal alerts recorded by the Hawai'i Institute of Geophysics and Planetology’s MODVOLC Thermal Alerts System increased considerably in 2023 compared to the years 2020-2022 (table 9). In contrast to previous years, the MODIS instruments aboard the Aqua and Terra satellites captured data from Erebus every month during 2023. Consistent with previous years, the lowest number of anomalous pixels were recorded in January, November, and December.
Table 9. Number of monthly MODIS-MODVOLC thermal alert pixels recorded at Erebus during 2017-2023. See BGVN 42:06 for data from 2000 through 2016. The table was compiled using data provided by the HIGP – MODVOLC Thermal Alerts System.
| Year |
Jan |
Feb |
Mar |
Apr |
May |
Jun |
Jul |
Aug |
Sep |
Oct |
Nov |
Dec |
SUM |
| 2017 |
0 |
21 |
9 |
0 |
0 |
1 |
11 |
61 |
76 |
52 |
0 |
3 |
234 |
| 2018 |
0 |
21 |
58 |
182 |
55 |
17 |
137 |
172 |
103 |
29 |
0 |
0 |
774 |
| 2019 |
2 |
21 |
162 |
151 |
55 |
56 |
75 |
53 |
29 |
19 |
1 |
0 |
624 |
| 2020 |
0 |
2 |
16 |
18 |
4 |
4 |
1 |
3 |
18 |
3 |
1 |
6 |
76 |
| 2021 |
0 |
9 |
1 |
0 |
2 |
56 |
46 |
47 |
35 |
52 |
5 |
3 |
256 |
| 2022 |
1 |
13 |
55 |
22 |
15 |
32 |
39 |
19 |
31 |
11 |
0 |
0 |
238 |
| 2023 |
2 |
33 |
49 |
82 |
41 |
32 |
70 |
64 |
42 |
17 |
5 |
11 |
448 |
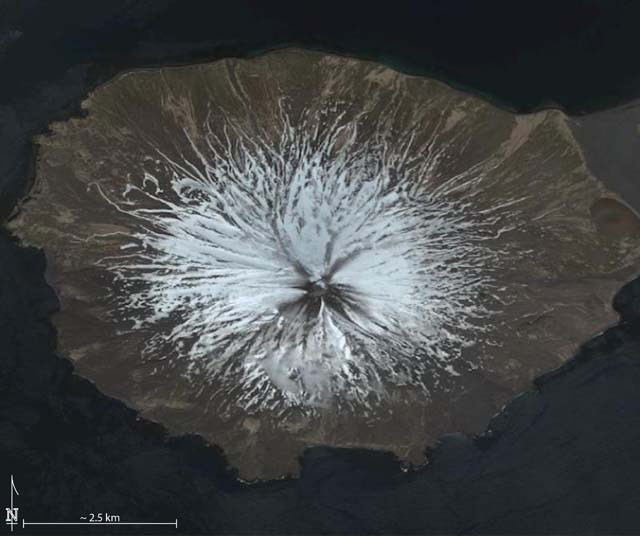
Sentinel-2 infrared images showed one or two prominent heat sources within the summit crater, accompanied by adjacent smaller sources, similar to recent years (see BGVN 46:01, 47:02, and 48:01). A unique image was obtained on 25 November 2023 by the OLI-2 (Operational Land Imager-2) on Landsat 9, showing the upper part of the volcano surrounded by clouds (figure 32).
Geologic Background. Mount Erebus, the world's southernmost historically active volcano, overlooks the McMurdo research station on Ross Island. It is the largest of three major volcanoes forming the crudely triangular Ross Island. The summit of the dominantly phonolitic volcano has been modified by one or two generations of caldera formation. A summit plateau at about 3,200 m elevation marks the rim of the youngest caldera, which formed during the late-Pleistocene and within which the modern cone was constructed. An elliptical 500 x 600 m wide, 110-m-deep crater truncates the summit and contains an active lava lake within a 250-m-wide, 100-m-deep inner crater; other lava lakes are sometimes present. The glacier-covered volcano was erupting when first sighted by Captain James Ross in 1841. Continuous lava-lake activity with minor explosions, punctuated by occasional larger Strombolian explosions that eject bombs onto the crater rim, has been documented since 1972, but has probably been occurring for much of the volcano's recent history.
Information Contacts: Hawai'i Institute of Geophysics and Planetology (HIGP) - MODVOLC Thermal Alerts System, School of Ocean and Earth Science and Technology (SOEST), Univ. of Hawai'i, 2525 Correa Road, Honolulu, HI 96822, USA (URL: http://modis.higp.hawaii.edu/); Copernicus Browser, Copernicus Data Space Ecosystem, European Space Agency (URL: https://dataspace.copernicus.eu/browser/); NASA Earth Observatory, EOS Project Science Office, NASA Goddard Space Flight Center, Goddard, Maryland, USA (URL: https://earthobservatory.nasa.gov/images/152134/erebus-breaks-through).
Rincon de la Vieja (Costa Rica) — January 2024 Cite this Report
Rincon de la Vieja
Costa Rica
10.83°N, 85.324°W; summit elev. 1916 m
All times are local (unless otherwise noted)
Frequent phreatic explosions during July-December 2023
Rincón de la Vieja is a volcanic complex in Costa Rica with a hot convecting acid lake that exhibits frequent weak phreatic explosions, gas-and-steam emissions, and occasional elevated sulfur dioxide levels (BGVN 45:10, 46:03, 46:11). The current eruption period began June 2021. This report covers activity during July-December 2023 and is based on weekly bulletins and occasional daily reports from the Observatorio Vulcanologico Sismologica de Costa Rica-Universidad Nacional (OVSICORI-UNA).
Numerous weak phreatic explosions continued during July-December 2023, along with gas-and-steam emissions and plumes that rose as high as 3 km above the crater rim. Many weekly OVSICORI-UNA bulletins included the previous week's number of explosions and emissions (table 9). For many explosions, the time of explosion was given (table 10). Frequent seismic activity (long-period earthquakes, volcano-tectonic earthquakes, and tremor) accompanied the phreatic activity.
Table 9. Number of reported weekly phreatic explosions and gas-and-steam emissions at Rincón de la Vieja, July-December 2023. Counts are reported for the week before the Weekly Bulletin date; not all reports included these data. Courtesy of OVSICORI-UNA.
| OVSICORI Weekly Bulletin |
Number of explosions |
Number of emissions |
| 28 Jul 2023 |
6 |
14 |
| 4 Aug 2023 |
10 |
12 |
| 1 Sep 2023 |
13 |
11 |
| 22 Sep 2023 |
12 |
13 |
| 29 Sep 2023 |
6 |
11 |
| 6 Oct 2023 |
12 |
5 |
| 13 Oct 2023 |
7 |
9 |
| 20 Oct 2023 |
1 |
15 |
| 27 Oct 2023 |
3 |
23 |
| 3 Nov 2023 |
3 |
10 |
| 17 Nov 2023 |
0 |
Some |
| 24 Nov 2023 |
0 |
14 |
| 8 Dec 2023 |
4 |
16 |
| 22 Dec 2023 |
8 |
18 |
Table 10. Summary of activity at Rincón de la Vieja during July-December 2023. Weak phreatic explosions and gas emissions are noted where the time of explosion was indicated in the weekly or daily bulletins. Height of plumes or emissions are distance above the crater rim. Courtesy of OVSICORI-UNA.
| Date |
Time |
Description of Activity |
| 1 Jul 2023 |
0156 |
Explosion. |
| 2 Jul 2023 |
0305 |
Explosion. |
| 4 Jul 2023 |
0229, 0635 |
Event at 0635 produced a gas-and-steam plume that rose 700 m and drifted W; seen by residents in Liberia (21 km SW). |
| 9 Jul 2023 |
1843 |
Explosion. |
| 21 Jul 2023 |
0705 |
Explosion. |
| 26 Jul 2023 |
1807 |
Explosion. |
| 28 Jul 2023 |
0802 |
Explosion generated a gas-and-steam plume that rose 500 m. |
| 30 Jul 2023 |
1250 |
Explosion. |
| 31 Jul 2023 |
2136 |
Explosion. |
| 11 Aug 2023 |
0828 |
Explosion. |
| 18 Aug 2023 |
1304 |
Explosion. |
| 21 Aug 2023 |
1224 |
Explosion generated gas-and-steam plumes rose 500-600 m. |
| 22 Aug 2023 |
0749 |
Explosion generated gas-and-steam plumes rose 500-600 m. |
| 24 Aug 2023 |
1900 |
Explosion. |
| 25 Aug 2023 |
0828 |
Event produced a steam-and-gas plume that rose 3 km and drifted NW. |
| 27-28 Aug 2023 |
0813 |
Four small events; the event at 0813 on 28 August lasted two minutes and generated a steam-and-gas plume that rose 2.5 km. |
| 1 Sep 2023 |
1526 |
Explosion generated plume that rose 2 km and ejected material onto the flanks. |
| 2-3 Sep 2023 |
- |
Small explosions detected in infrasound data. |
| 4 Sep 2023 |
1251 |
Gas-and-steam plume rose 1 km and drifted W. |
| 7 Nov 2023 |
1113 |
Explosion. |
| 8 Nov 2023 |
0722 |
Explosion. |
| 12 Nov 2023 |
0136 |
Small gas emissions. |
| 14 Nov 2023 |
0415 |
Small gas emissions. |
According to OVSICORI-UNA, during July-October the average weekly sulfur dioxide (SO2) flux ranged from 68 to 240 tonnes/day. However, in mid-November the flux increased to as high as 334 tonnes/day, the highest value measured in recent years. The high SO2 flux in mid-November was also detected by the TROPOMI instrument on the Sentinel-5P satellite (figure 43).
Geologic Background. Rincón de la Vieja, the largest volcano in NW Costa Rica, is a remote volcanic complex in the Guanacaste Range. The volcano consists of an elongated, arcuate NW-SE-trending ridge constructed within the 15-km-wide early Pleistocene Guachipelín caldera, whose rim is exposed on the south side. Sometimes known as the "Colossus of Guanacaste," it has an estimated volume of 130 km3 and contains at least nine major eruptive centers. Activity has migrated to the SE, where the youngest-looking craters are located. The twin cone of Santa María volcano, the highest peak of the complex, is located at the eastern end of a smaller, 5-km-wide caldera and has a 500-m-wide crater. A Plinian eruption producing the 0.25 km3 Río Blanca tephra about 3,500 years ago was the last major magmatic eruption. All subsequent eruptions, including numerous historical eruptions possibly dating back to the 16th century, have been from the prominent active crater containing a 500-m-wide acid lake located ENE of Von Seebach crater.
Information Contacts: Observatorio Vulcanológico Sismológica de Costa Rica-Universidad Nacional (OVSICORI-UNA), Apartado 86-3000, Heredia, Costa Rica (URL: http://www.ovsicori.una.ac.cr/); NASA Global Sulfur Dioxide Monitoring Page, Atmospheric Chemistry and Dynamics Laboratory, NASA Goddard Space Flight Center (NASA/GSFC), 8800 Greenbelt Road, Goddard MD 20771, USA (URL: https://so2.gsfc.nasa.gov/).
Bezymianny (Russia) — November 2023 Cite this Report
Bezymianny
Russia
55.972°N, 160.595°E; summit elev. 2882 m
All times are local (unless otherwise noted)
Explosion on 18 October 2023 sends ash plume 8 km high; lava flows and incandescent avalanches
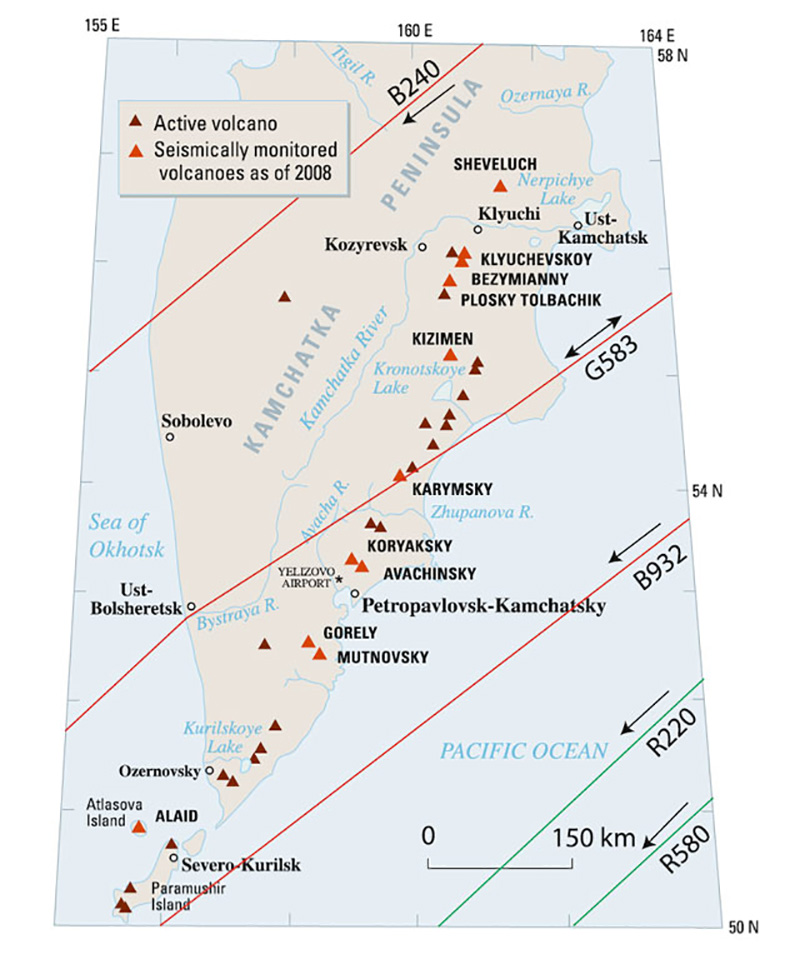
Bezymianny, located on Russia’s Kamchatka Peninsula, has had eruptions since 1955 characterized by dome growth, explosions, pyroclastic flows, ash plumes, and ashfall. Activity during November 2022-April 2023 included gas-and-steam emissions, lava dome collapses generating avalanches, and persistent thermal activity. Similar eruptive activity continued from May through October 2023, described here based on information from weekly and daily reports of the Kamchatka Volcano Eruptions Response Team (KVERT), notices from Tokyo VAAC (Volcanic Ash Advisory Center), and from satellite data.
Overall activity decreased after the strong period of activity in late March through April 2023, which included ash explosions during 29 March and 7-8 April 2023 that sent plumes as high as 10-12 km altitude, along with dome growth and lava flows (BGVN 48:05). This reduced activity can be seen in the MIROVA thermal detection system graph (figure 56), which was consistent with data from the MODVOLC thermal detection system and with Sentinel-2 satellite images that showed persistent hotspots in the summit crater when conditions allowed observations. A renewed period of strong activity began in mid-October 2023.
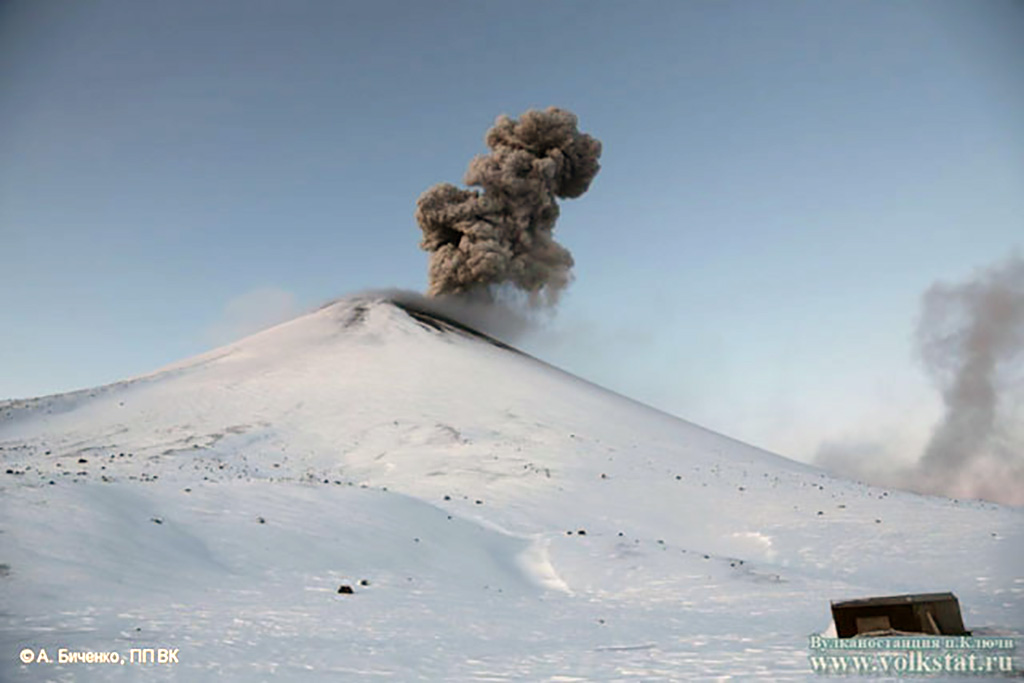
Activity increased significantly on 17 October 2023 when large collapses began during 0700-0830 on the E flanks of the lava dome and continued to after 0930 the next day (figure 57). Ash plumes rose to an altitude of 4.5-5 km, extending 220 km NNE by 18 October. A large explosion at 1630 on 18 October produced an ash plume that rose to an altitude of 11 km (8 km above the summit) and drifted NNE and then NW, extending 900 km NW within two days at an altitude of 8 km. Minor ashfall was noted in Kozyrevsk (45 km WNW). At 0820 on 20 October an ash plume was identified in satellite images drifting 100 km ENE at altitudes of 4-4.5 km.
Lava flows and hot avalanches from the dome down the SE flank continued over the next few days, including 23 October when clear conditions allowed good observations (figures 58 and 59). A large thermal anomaly was observed over the volcano through 24 October, and in the summit crater on 30 October (figure 60). Strong fumarolic activity continued, with numerous avalanches and occasional incandescence. By the last week of October, volcanic activity had decreased to a level consistent with that earlier in the reporting period.
Aviation warnings were frequently updated during 17-20 October. KVERT issued a Volcano Observatory Notice for Aviation (VONA) on 17 October at 1419 and 1727 (0219 and 0527 UTC) raising the Aviation Color Code (ACC) from Yellow to Orange (second highest level). The next day, KVERT issued a VONA at 1705 (0505 UTC) raising the ACC to Red (highest level) but lowered it back to Orange at 2117 (0917 UTC). After another decrease to Yellow and back to Orange, the ACC was reduced to Yellow on 20 October at 1204 (0004 UTC). In addition, the Tokyo VAAC issued a series of Volcanic Ash Advisories beginning on 16 October and continuing through 30 October.
Geologic Background. The modern Bezymianny, much smaller than its massive neighbors Kamen and Kliuchevskoi on the Kamchatka Peninsula, was formed about 4,700 years ago over a late-Pleistocene lava-dome complex and an edifice built about 11,000-7,000 years ago. Three periods of intensified activity have occurred during the past 3,000 years. The latest period, which was preceded by a 1,000-year quiescence, began with the dramatic 1955-56 eruption. This eruption, similar to that of St. Helens in 1980, produced a large open crater that was formed by collapse of the summit and an associated lateral blast. Subsequent episodic but ongoing lava-dome growth, accompanied by intermittent explosive activity and pyroclastic flows, has largely filled the 1956 crater.
Information Contacts: Kamchatka Volcanic Eruptions Response Team (KVERT), Far Eastern Branch, Russian Academy of Sciences, 9 Piip Blvd., Petropavlovsk-Kamchatsky, 683006, Russia (URL: http://www.kscnet.ru/ivs/kvert/); Kamchatka Volcanological Station, Kamchatka Branch of Geophysical Survey, (KB GS RAS), Klyuchi, Kamchatka Krai, Russia (URL: http://volkstat.ru/); Tokyo Volcanic Ash Advisory Center (VAAC), 1-3-4 Otemachi, Chiyoda-ku, Tokyo 100-8122, Japan (URL: http://ds.data.jma.go.jp/svd/vaac/data/); Hawai'i Institute of Geophysics and Planetology (HIGP) - MODVOLC Thermal Alerts System, School of Ocean and Earth Science and Technology (SOEST), Univ. of Hawai'i, 2525 Correa Road, Honolulu, HI 96822, USA (URL: http://modis.higp.hawaii.edu/); MIROVA (Middle InfraRed Observation of Volcanic Activity), a collaborative project between the Universities of Turin and Florence (Italy) supported by the Centre for Volcanic Risk of the Italian Civil Protection Department (URL: http://www.mirovaweb.it/); Copernicus Browser, Copernicus Data Space Ecosystem, European Space Agency (URL: https://dataspace.copernicus.eu/browser/).chr
Kilauea (United States) — January 2023 Cite this Report
Kilauea
United States
19.421°N, 155.287°W; summit elev. 1222 m
All times are local (unless otherwise noted)
Low-level lava effusions in the lava lake at Halema’uma’u during July-December 2022
Kīlauea is the southeastern-most volcano in Hawaii and overlaps the E flank of the Mauna Loa volcano. Its East Rift Zone (ERZ) has been intermittently active for at least 2,000 years. An extended eruption period began in January 1983 and was characterized by open lava lakes and lava flows from the summit caldera and the East Rift Zone. During May 2018 magma migrated into the Lower East Rift Zone (LERZ) and opened 24 fissures along a 6-km-long NE-trending fracture zone that produced lava flows traveling in multiple directions. As lava emerged from the fissures, the lava lake at Halema'uma'u drained and explosions sent ash plumes to several kilometers altitude (BGVN 43:10).
The current eruption period started during September 2021 and has recently been characterized by lava effusions, spatter, and sulfur dioxide emissions in the active Halema’uma’u lava lake (BGVN 47:08). Lava effusions, some spatter, and sulfur dioxide emissions have continued during this reporting period of July through December 2022 using daily reports, volcanic activity notices, and abundant photo, map, and video data from the US Geological Survey's (USGS) Hawaiian Volcano Observatory (HVO).
Summary of activity during July-December 2022. Low-level effusions have continued at the western vent of the Halema’uma’u crater during July through early December 2022. Occasional weak ooze-outs (also called lava break outs) would occur along the margins of the crater floor. The overall level of the active lava lake throughout the reporting period gradually increased due to infilling, however it stagnated in mid-September (table 13). During September through November, activity began to decline, though lava effusions persisted at the western vent. By 9 December, the active part of the lava lake had completely crusted over, and incandescence was no longer visible.
Table 13. Summary of measurements taken during overflights at Kīlauea that show a gradual increase in the active lava lake level and the volume of lava effused since 29 September 2021. Lower activity was reported during September-October. Data collected during July-December 2022. Courtesy of HVO.
| Date: |
Level of the active lava lake (m): |
Cumulative volume of lava effused (million cubic meters): |
| 7 Jul 2022 |
130 |
95 |
| 19 Jul 2022 |
133 |
98 |
| 4 Aug 2022 |
136 |
102 |
| 16 Aug 2022 |
137 |
104 |
| 12 Sep 2022 |
143 |
111 |
| 5 Oct 2022 |
143 |
111 |
| 28 Oct 2022 |
143 |
111 |
Activity during July 2022. Lava effusions were reported from the western vent in the Halema’uma’u crater, along with occasional weak ooze-outs along the margins of the crater floor. The height of the lava lake was variable due to deflation-inflation tilt events; for example, the lake level dropped approximately 3-4 m during a summit deflation-inflation event reported on 1 July. Webcam images taken during the night of 6-12 July showed intermittent low-level spattering at the western vent that rose less than 10 m above the vent (figure 519). Measurements made during an overflight on 7 July indicated that the crater floor was infilled about 130 m and that 95 million cubic meters of lava had been effused since 29 September 2021. A single, relatively small lava ooze-out was active to the S of the lava lake. Around midnight on 8 July there were two brief periods of lava overflow onto the lake margins. On 9 July lava ooze-outs were reported near the SE and NE edges of the crater floor and during 10-11 July they occurred near the E, NE, and NW edges. On 16 July crater incandescence was reported, though the ooze-outs and spattering were not visible. On 18 July overnight webcam images showed incandescence in the western vent complex and two ooze-outs were reported around 0000 and 0200 on 19 July. By 0900 there were active ooze-outs along the SW edge of the crater floor. Measurements made from an overflight on 19 July indicated that the crater floor was infilled about 133 m and 98 million cubic meters of lava had erupted since 29 September 2021 (figure 520). On 20 July around 1600 active ooze-outs were visible along the N edge of the crater, which continued through the next day. Extensive ooze-outs occurred along the W margin during 24 July until 1900; on 26 July minor ooze-outs were noted along the N margin. Minor spattering was visible on 29 July along the E margin of the lake. The sulfur dioxide emission rates ranged 650-2,800 tons per day (t/d), the higher of which was measured on 8 July (figure 519).
Activity during August 2022. The eruption continued in the Halema’uma’u crater at the western vent. According to HVO the lava in the active lake remained at the level of the bounding levees. Occasional minor ooze-outs were observed along the margins of the crater floor. Strong nighttime crater incandescence was visible after midnight on 6 August over the western vent cone. During 6-7 August scattered small lava lobes were active along the crater floor and incandescence persisted above the western vent through 9 August. During 7-9 August HVO reported a single lava effusion source was active along the NW margin of the crater floor. Measurements from an overflight on 4 August indicated that the crater floor was infilled about 136 m total and that 102 million cubic meters of lava had been erupted since the start of the eruption. Lava breakouts were reported along the N, NE, E, S, and W margins of the crater during 10-16 August. Another overflight survey conducted on 16 August indicated that the crater floor infilled about 137 m and 104 million cubic meters of lava had been erupted since September 2021. Measured sulfur dioxide emissions rates ranged 1,150-2,450 t/d, the higher of which occurred on 8 August.
Activity during September 2022. During September, lava effusion continued from the western vent into the active lava lake and onto the crater floor. Intermittent minor ooze-outs were reported through the month. A small ooze-out was visible on the W crater floor margin at 0220 on 2 September, which showed decreasing surface activity throughout the day, but remained active through 3 September. On 3 September around 1900 a lava outbreak occurred along the NW margin of the crater floor but had stopped by the evening of 4 September. Field crews monitoring the summit lava lake on 9 September observed spattering on the NE margin of the lake that rose no higher than 10 m, before falling back onto the lava lake crust (figure 521). Overflight measurements on 12 September indicated that the crater floor was infilled a total of 143 m and 111 million cubic meters of lava had been erupted since September 2021. Extensive breakouts in the W and N part of the crater floor were reported at 1600 on 20 September and continued into 26 September. The active part of the lava lake dropped by 10 m while other parts of the crater floor dropped by several meters. Summit tiltmeters recorded a summit seismic swarm of more than 80 earthquakes during 1500-1800 on 21 September, which occurred about 1.5 km below Halema’uma’u; a majority of these were less than Mw 2. By 22 September the active part of the lava lake was infilled about 2 m. On 23 September the western vent areas exhibited several small spatter cones with incandescent openings, along with weak, sporadic spattering (figure 522). The sulfur dioxide emission rate ranged from 930 t/d to 2,000 t/d, the higher of which was measured on 6 September.
Activity during October 2022. Activity during October declined slightly compared to previous months, though lava effusions persisted from the western vent into the active lava lake and onto the crater floor during October (figure 523). Slight variations in the lava lake were noted throughout the month. HVO reported that around 0600 on 3 October the level of the lava lake has lowered slightly. Overflight measurements taken on 5 October indicated that the crater floor was infilled a total of about 143 m and that 111 million cubic meters of lava had been effused since September 2021. During 6-7 October the lake gradually rose 0.5 m. Sulfur dioxide measurements made on 22 October had an emission rate of 700 t/d. Another overflight taken on 28 October showed that there was little to no change in the elevation of the crater floor: the crater floor was infilled a total of 143 m and 111 million cubic meters of lava had erupted since the start of the eruption.
Activity during November 2022. Activity remained low during November, though HVO reported that lava from the western vent continued to effuse into the active lava lake and onto the crater floor throughout the month. The rate of sulfur dioxide emissions during November ranged from 300-600 t/d, the higher amount of which occurred on 9 November.
Activity during December 2022. Similar low activity was reported during December, with lava effusing from the western vent into the active lava lake and onto the crater floor. During 4-5 December the active part of the lava lake was slightly variable in elevation and fluctuated within 1 m. On 9 December HVO reported that lava was no longer erupting from the western vent in the Halema’uma’u crater and that sulfur dioxide emissions had returned to near pre-eruption background levels; during 10-11 December, the lava lake had completely crusted over, and no incandescence was visible (figure 524). Time lapse camera images covering the 4-10 December showed that the crater floor showed weak deflation and no inflation. Some passive events of crustal overturning were reported during 14-15 December, which brought fresh incandescent lava to the lake surface. The sulfur dioxide emission rate was approximately 200 t/d on 14 December. A smaller overturn event on 17 December and another that occurred around 0000 and into the morning of 20 December were also detected. A small seismic swarm was later detected on 30 December.
Geologic Background. Kilauea overlaps the E flank of the massive Mauna Loa shield volcano in the island of Hawaii. Eruptions are prominent in Polynesian legends; written documentation since 1820 records frequent summit and flank lava flow eruptions interspersed with periods of long-term lava lake activity at Halemaumau crater in the summit caldera until 1924. The 3 x 5 km caldera was formed in several stages about 1,500 years ago and during the 18th century; eruptions have also originated from the lengthy East and Southwest rift zones, which extend to the ocean in both directions. About 90% of the surface of the basaltic shield volcano is formed of lava flows less than about 1,100 years old; 70% of the surface is younger than 600 years. The long-term eruption from the East rift zone between 1983 and 2018 produced lava flows covering more than 100 km2, destroyed hundreds of houses, and added new coastline.
Information Contacts: Hawaiian Volcano Observatory (HVO), U.S. Geological Survey, PO Box 51, Hawai'i National Park, HI 96718, USA (URL: http://hvo.wr.usgs.gov/).
Nyamulagira (DR Congo) — November 2023 Cite this Report
Nyamulagira
DR Congo
1.408°S, 29.2°E; summit elev. 3058 m
All times are local (unless otherwise noted)
Lava flows and thermal activity during May-October 2023
Nyamulagira (also known as Nyamuragira) is a shield volcano in the Democratic Republic of Congo with the summit truncated by a small 2 x 2.3 km caldera with walls up to about 100 m high. Documented eruptions have occurred within the summit caldera, as well as from numerous flank fissures and cinder cones. The current eruption period began in April 2018 and has more recently been characterized by summit crater lava flows and thermal activity (BGVN 48:05). This report describes lava flows and variable thermal activity during May through October 2023, based on information from the Observatoire Volcanologique de Goma (OVG) and various satellite data.
Lava lake activity continued during May. The MIROVA (Middle InfraRed Observation of Volcanic Activity) system recorded moderate-to-strong thermal activity throughout the reporting period; activity was more intense during May and October and relatively weaker from June through September (figure 95). The MODVOLC thermal algorithm, detected a total of 209 thermal alerts. There were 143 hotspots detected during May, eight during June, nine during September, and 49 during October. This activity was also reflected in infrared satellite images, where a lava flow was visible in the NW part of the crater on 7 May and strong activity was seen in the center of the crater on 4 October (figure 96). Another infrared satellite image taken on 12 May showed still active lava flows along the NW margin of the crater. According to OVG lava effusions were active during 7-29 May and moved to the N and NW parts of the crater beginning on 9 May. Strong summit crater incandescence was visible from Goma (27 km S) during the nights of 17, 19, and 20 May (figure 97). On 17 May there was an increase in eruptive activity, which peaked at 0100 on 20 May. Notable sulfur dioxide plumes drifted NW and W during 19-20 May (figure 98). Drone footage acquired in partnership with the USGS (United States Geological Survey) on 20 May captured images of narrow lava flows that traveled about 100 m down the W flank (figure 99). Data from the Rumangabo seismic station indicated a decreasing trend in activity during 17-21 May. Although weather clouds prevented clear views of the summit, a strong thermal signature on the NW flank was visible in an infrared satellite image on 22 May, based on an infrared satellite image. On 28 May the lava flows on the upper W flank began to cool and solidify. By 29 May seismicity returned to levels similar to those recorded before the 17 May increase. Lava effusion continued but was confined to the summit crater; periodic crater incandescence was observed.
Low-level activity was noted during June through October. On 1 June OVG reported that seismicity remained at lower levels and that crater incandescence had been absent for three days, though infrared satellite imagery showed continued lava effusion in the summit crater. The lava flows on the flanks covered an estimated 0.6 km2. Satellite imagery continued to show thermal activity confined to the lava lake through October (figure 96), although no lava flows or significant sulfur dioxide emissions were reported.
Geologic Background. Africa's most active volcano, Nyamulagira (also known as Nyamuragira), is a massive high-potassium basaltic shield about 25 km N of Lake Kivu and 13 km NNW of the steep-sided Nyiragongo volcano. The summit is truncated by a small 2 x 2.3 km caldera that has walls up to about 100 m high. Documented eruptions have occurred within the summit caldera, as well as from the numerous flank fissures and cinder cones. A lava lake in the summit crater, active since at least 1921, drained in 1938, at the time of a major flank eruption. Recent lava flows extend down the flanks more than 30 km from the summit as far as Lake Kivu; extensive lava flows from this volcano have covered 1,500 km2 of the western branch of the East African Rift.
Information Contacts: Observatoire Volcanologique de Goma (OVG), Departement de Geophysique, Centre de Recherche en Sciences Naturelles, Lwiro, D.S. Bukavu, DR Congo; Hawai'i Institute of Geophysics and Planetology (HIGP) - MODVOLC Thermal Alerts System, School of Ocean and Earth Science and Technology (SOEST), Univ. of Hawai'i, 2525 Correa Road, Honolulu, HI 96822, USA (URL: http://modis.higp.hawaii.edu/); MIROVA (Middle InfraRed Observation of Volcanic Activity), a collaborative project between the Universities of Turin and Florence (Italy) supported by the Centre for Volcanic Risk of the Italian Civil Protection Department (URL: http://www.mirovaweb.it/); NASA Global Sulfur Dioxide Monitoring Page, Atmospheric Chemistry and Dynamics Laboratory, NASA Goddard Space Flight Center (NASA/GSFC), 8800 Greenbelt Road, Goddard, Maryland, USA (URL: https://so2.gsfc.nasa.gov/); Copernicus Browser, Copernicus Data Space Ecosystem, European Space Agency (URL: https://dataspace.copernicus.eu/browser/); Charles Balagizi, Goma Volcano Observatory, Departement de Geophysique, Centre de Recherche en Sciences Naturelles, Lwiro, D.S. Bukavu, DR Congo.
Bagana (Papua New Guinea) — October 2023 Cite this Report
Bagana
Papua New Guinea
6.137°S, 155.196°E; summit elev. 1855 m
All times are local (unless otherwise noted)
Explosions, ash plumes, ashfall, and lava flows during April-September 2023
The remote volcano of Bagana is located in central Bougainville Island, Papua New Guinea. Recorded eruptions date back to 1842 and activity has consisted of effusive activity that has built a small lava dome in the summit crater and occasional explosions that produced pyroclastic flows. The most recent eruption has been ongoing since February 2000 and has produced occasional explosions, ash plumes, and lava flows. More recently, activity has been characterized by ongoing effusive activity and ash emissions (BGVN 48:04). This report updates activity from April through September 2023 that has consisted of explosions, ash plumes, ashfall, and lava flows, using information from the Darwin Volcanic Ash Advisory Center (VAAC) and satellite data.
An explosive eruption was reported on 7 July that generated a large gas-and-ash plume to high altitudes and caused significant ashfall in local communities; the eruption plume had reached upper tropospheric (16-18 km altitude) altitudes by 2200, according to satellite images. Sulfur dioxide plumes were detected in satellite images on 8 July and indicated that the plume was likely a mixture of gas, ice, and ash. A report issued by the Autonomous Bougainville Government (ABG) (Torokina District, Education Section) on 10 July noted that significant ash began falling during 2000-2100 on 7 July and covered most areas in the Vuakovi, Gotana (9 km SW), Koromaketo, Laruma (25 km W) and Atsilima (27 km NW) villages. Pyroclastic flows also occurred, according to ground-based reports; small deposits confined to one drainage were inspected by RVO during an overflight on 17 July and were confirmed to be from the 7 July event. Ashfall continued until 10 July and covered vegetation, which destroyed bushes and gardens and contaminated rivers and streams.
RVO reported another eruption on 14 July. The Darwin VAAC stated that an explosive event started around 0830 on 15 July and produced an ash plume that rose to 16.5 km altitude by 1000 and drifted N, according to satellite images. The plume continued to drift N and remained visible through 1900, and by 2150 it had dissipated.
Ashfall likely from both the 7 and 15 July events impacted about 8,111 people in Torokina (20 km SW), including Tsito/Vuakovi, Gotana, Koromaketo, Kenaia, Longkogari, Kenbaki, Piva (13 km SW), and Atsinima, and in the Tsitovi district, according to ABG. Significant ashfall was also reported in Ruruvu (22 km N) in the Wakunai District of Central Bougainville, though the thickness of these deposits could not be confirmed. An evacuation was called for the villages in Wakunai, where heavy ashfall had contaminated water sources; the communities of Ruruvu, Togarau, Kakarapaia, Karauturi, Atao, and Kuritaturi were asked to evacuate to a disaster center at the Wakunai District Station, and communities in Torokina were asked to evacuate to the Piva District station. According to a news article, more than 7,000 people needed temporary accommodations, with about 1,000 people in evacuation shelters. Ashfall had deposited over a broad area, contaminating water supplies, affecting crops, and collapsing some roofs and houses in rural areas. Schools were temporarily shut down. Intermittent ash emissions continued through the end of July and drifted NNW, NW, and SW. Fine ashfall was reported on the coast of Torokina, and ash plumes also drifted toward Laruma and Atsilima.
A small explosive eruption occurred at 2130 on 28 July that ejected material from the crater vents, according to reports from Torokina, in addition to a lava flow that contained two lobes. A second explosion was detected at 2157. Incandescence from the lava flow was visible from Piva as it descended the W flank around 2000 on 29 July (figure 47). The Darwin VAAC reported that a strong thermal anomaly was visible in satellite images during 30-31 July and that ash emissions rose to 2.4 km altitude and drifted WSW on 30 July. A ground report from RVO described localized emissions at 0900 on 31 July.
The Darwin VAAC reported that ash plumes were identified in satellite imagery at 0800 and 1220 on 12 August and rose to 2.1 km and 3 km altitude and drifted NW and W, respectively. A news report stated that aid was sent to more than 6,300 people that were adversely affected by the eruption. Photos taken during 17-19 August showed ash emissions rising no higher than 1 km above the summit and drifting SE. A small explosion generated an ash plume during the morning of 19 August. Deposits from small pyroclastic flows were also captured in the photos. Satellite images captured lava flows and pyroclastic flow deposits. Two temporary seismic stations were installed near Bagana on 17 August at distances of 7 km WSW (Vakovi station) and 11 km SW (Kepox station). The Kepox station immediately started to record continuous, low-frequency background seismicity.
Satellite data. Little to no thermal activity was detected during April through mid-July 2023; only one anomaly was recorded during early April and one during early June, according to MIROVA (Middle InfraRed Observation of Volcanic Activity) data (figure 48). Thermal activity increased in both power and frequency during mid-July through September, although there were still some short gaps in detected activity. MODVOLC also detected increased thermal activity during August; thermal hotspots were detected a total of five times on 19, 20, and 27 August. Weak thermal anomalies were also captured in infrared satellite images on clear weather days throughout the reporting period on 7, 12, and 17 April, 27 May, 1, 6, 16, and 31 July, and 19 September (figure 48); a strong thermal anomaly was visible on 31 July. Distinct sulfur dioxide plumes that drifted generally NW were intermittently captured by the TROPOMI instrument on the Sentinel-5P satellite and sometimes exceeded two Dobson Units (DUs) (figure 49).
Geologic Background. Bagana volcano, in a remote portion of central Bougainville Island, is frequently active. This massive symmetrical cone was largely constructed by an accumulation of viscous andesitic lava flows. The entire edifice could have been constructed in about 300 years at its present rate of lava production. Eruptive activity is characterized by non-explosive effusion of viscous lava that maintains a small lava dome in the summit crater, although occasional explosive activity produces pyroclastic flows. Lava flows with tongue-shaped lobes up to 50 m thick and prominent levees descend the flanks on all sides.
Information Contacts: Rabaul Volcano Observatory (RVO), Geohazards Management Division, Department of Mineral Policy and Geohazards Management (DMPGM), PO Box 3386, Kokopo, East New Britain Province, Papua New Guinea; Darwin Volcanic Ash Advisory Centre (VAAC), Bureau of Meteorology, Northern Territory Regional Office, PO Box 40050, Casuarina, NT 0811, Australia (URL: http://www.bom.gov.au/info/vaac/); MIROVA (Middle InfraRed Observation of Volcanic Activity), a collaborative project between the Universities of Turin and Florence (Italy) supported by the Centre for Volcanic Risk of the Italian Civil Protection Department (URL: http://www.mirovaweb.it/); Hawai'i Institute of Geophysics and Planetology (HIGP) - MODVOLC Thermal Alerts System, School of Ocean and Earth Science and Technology (SOEST), Univ. of Hawai'i, 2525 Correa Road, Honolulu, HI 96822, USA (URL: http://modis.higp.hawaii.edu/); NASA Global Sulfur Dioxide Monitoring Page, Atmospheric Chemistry and Dynamics Laboratory, NASA Goddard Space Flight Center (NASA/GSFC), 8800 Greenbelt Road, Goddard, Maryland, USA (URL: https://so2.gsfc.nasa.gov/); Copernicus Browser, Copernicus Data Space Ecosystem, European Space Agency (URL: https://dataspace.copernicus.eu/browser/); Autonomous Bougainville Government, P.O Box 322, Buka, AROB, PNG (URL: https://abg.gov.pg/); Andrew Tupper (Twitter: @andrewcraigtupp); Simon Carn, Geological and Mining Engineering and Sciences, Michigan Technological University, 1400 Townsend Drive, Houghton, MI 49931, USA (URL: http://www.volcarno.com/, Twitter: @simoncarn); Radio NZ (URL: https://www.rnz.co.nz/news/pacific/494464/more-than-7-000-people-in-bougainville-need-temporary-accommodation-after-eruption); USAID, 1300 Pennsylvania Ave, NW, Washington DC 20004, USA (URL: https://www.usaid.gov/pacific-islands/press-releases/aug-08-2023-united-states-provides-immediate-emergency-assistance-support-communities-affected-mount-bagana-volcanic-eruptions).
Mayon (Philippines) — October 2023 Cite this Report
Mayon
Philippines
13.257°N, 123.685°E; summit elev. 2462 m
All times are local (unless otherwise noted)
Lava flows, pyroclastic flows, ash emissions, and seismicity during April-September 2023
Mayon is located in the Philippines and has steep upper slopes capped by a small summit crater. Historical eruptions date back to 1616 CE that have been characterized by Strombolian eruptions, lava flows, pyroclastic flows, and mudflows. Eruptions mostly originated from a central conduit. Pyroclastic flows and mudflows have commonly descended many of the approximately 40 drainages that surround the volcano. The most recent eruption occurred during June through October 2022 and consisted of lava dome growth and gas-and-steam emissions (BGVN 47:12). A new eruption was reported during late April 2023 and has included lava flows, pyroclastic density currents, ash emissions, and seismicity. This report covers activity during April through September 2023 based on daily bulletins from the Philippine Institute of Volcanology and Seismology (PHIVOLCS).
During April through September 2023, PHIVOLCS reported near-daily rockfall events, frequent volcanic earthquakes, and sulfur dioxide measurements. Gas-and-steam emissions rose 100-900 m above the crater and drifted in different directions. Nighttime crater incandescence was often visible during clear weather and was accompanied by incandescent avalanches of material. Activity notably increased during June when lava flows were reported on the S, SE, and E flanks (figure 52). The MIROVA graph (Middle InfraRed Observation of Volcanic Activity) showed strong thermal activity coincident with these lava flows, which remained active through September (figure 53). According to the MODVOLC thermal algorithm, a total of 110 thermal alerts were detected during the reporting period: 17 during June, 40 during July, 27 during August, and 26 during September. During early June, pyroclastic density currents (PDCs) started to occur more frequently.
Low activity was reported during much of April and May; gas-and-steam emissions rose 100-900 m above the crater and generally drifted in different directions. A total of 52 rockfall events and 18 volcanic earthquakes were detected during April and 147 rockfall events and 13 volcanic events during May. Sulfur dioxide flux measurements ranged between 400-576 tons per day (t/d) during April, the latter of which was measured on 29 April and between 162-343 t/d during May, the latter of which was measured on 13 May.
Activity during June increased, characterized by lava flows, pyroclastic density currents (PDCs), crater incandescence and incandescent rockfall events, gas-and-steam emissions, and continued seismicity. Weather clouds often prevented clear views of the summit, but during clear days, moderate gas-and-steam emissions rose 100-2,500 m above the crater and drifted in multiple directions. A total of 6,237 rockfall events and 288 volcanic earthquakes were detected. The rockfall events often deposited material on the S and SE flanks within 700-1,500 m of the summit crater and ash from the events drifted SW, S, SE, NE, and E. Sulfur dioxide emissions ranged between 149-1,205 t/d, the latter of which was measured on 10 June. Short-term observations from EDM and electronic tiltmeter monitoring indicated that the upper slopes were inflating since February 2023. Longer-term ground deformation parameters based on EDM, precise leveling, continuous GPS, and electronic tilt monitoring indicated that the volcano remained inflated, especially on the NW and SE flanks. At 1000 on 5 June the Volcano Alert Level (VAL) was raised to 2 (on a 0-5 scale). PHIVOLCS noted that although low-level volcanic earthquakes, ground deformation, and volcanic gas emissions indicated unrest, the steep increase in rockfall frequency may indicate increased dome activity.
A total of 151 dome-collapse PDCs occurred during 8-9 and 11-30 June, traveled 500-2,000 m, and deposited material on the S flank within 2 km of the summit crater. During 8-9 June the VAL was raised to 3. At approximately 1947 on 11 June lava flow activity was reported; two lobes traveled within 500 m from the crater and deposited material on the S (Mi-isi), SE (Bonga), and E (Basud) flanks. Weak seismicity accompanied the lava flow and slight inflation on the upper flanks. This lava flow remained active through 30 June, moving down the S and SE flank as far as 2.5 km and 1.8 km, respectively and depositing material up to 3.3 km from the crater. During 15-16 June traces of ashfall from the PDCs were reported in Sitio Buga, Nabonton, City of Ligao and Purok, and San Francisco, Municipality of Guinobatan. During 28-29 June there were two PDCs generated by the collapse of the lava flow front, which generated a light-brown ash plume 1 km high. Satellite monitors detected significant concentrations of sulfur dioxide beginning on 29 June. On 30 June PDCs primarily affected the Basud Gully on the E flank, the largest of which occurred at 1301 and lasted eight minutes, based on the seismic record. Four PDCs generated between 1800 and 2000 that lasted approximately four minutes each traveled 3-4 km on the E flank and generated an ash plume that rose 1 km above the crater and drifted N and NW. Ashfall was recorded in Tabaco City.
Similar strong activity continued during July; slow lava effusion remained active on the S and SE flanks and traveled as far as 2.8 km and 2.8 km, respectively and material was deposited as far as 4 km from the crater. There was a total of 6,983 rockfall events and 189 PDCs that affected the S, SE, and E flanks. The volcano network detected a total of 2,124 volcanic earthquakes. Continuous gas-and-steam emissions rose 200-2,000 m above the crater and drifted in multiple directions. Sulfur dioxide emissions averaged 792-4,113 t/d, the latter of which was measured on 28 July. During 2-4 July three PDCs were generated from the collapse of the lava flow and resulting light brown plumes rose 200-300 m above the crater. Continuous tremor pulses were reported beginning at 1547 on 3 July through 7 July at 1200, at 2300 on 8 July and going through 0300 on 10 July, and at 2300 on 16 July, as recorded by the seismic network. During 6-9 July there were 10 lava flow-collapse-related PDCs that generated light brown plumes 300-500 m above the crater. During 10-11 July light ashfall was reported in some areas of Mabinit, Legazpi City, Budiao and Salvacion, Daraga, and Camalig, Albay. By 18 July the lava flow advanced 600 m on the E flank as well.
During 1733 on 18 July and 0434 on 19 July PHIVOLCS reported 30 “ashing” events, which are degassing events accompanied by audible thunder-like sounds and entrained ash at the crater, which produced short, dark plumes that drifted SW. These events each lasted 20-40 seconds, and plume heights ranged from 150-300 m above the crater, as recorded by seismic, infrasound, visual, and thermal monitors. Three more ashing events occurred during 19-20 July. Short-term observations from electronic tilt and GPS monitoring indicate deflation on the E lower flanks in early July and inflation on the NW middle flanks during the third week of July. Longer-term ground deformation parameters from EDM, precise leveling, continuous GPS, and electronic tilt monitoring indicated that the volcano was still generally inflated relative to baseline levels. A short-lived lava pulse lasted 28 seconds at 1956 on 21 July, which was accompanied by seismic and infrasound signals. By 22 July, the only lava flow that remained active was on the SE flank, and continued to extend 3.4 km, while those on the S and E flanks weakened markedly. One ashing event was detected during 30-31 July, whereas there were 57 detected during 31 July-1 August; according to PHIVOLCS beginning at approximately 1800 on 31 July eruptive activity was dominated by phases of intermittent ashing, as well as increased in the apparent rates of lava effusion from the summit crater. The ashing phases consisted of discrete events recorded as low-frequency volcanic earthquakes (LFVQ) typically 30 seconds in duration, based on seismic and infrasound signals. Gray ash plume rose 100 m above the crater and generally drifted NE. Shortly after these ashing events began, new lava began to effuse rapidly from the crater, feeding the established flowed on the SE, E, and E flanks and generating frequent rockfall events.
Intensified unrest persisted during August. There was a total of 4,141 rockfall events, 2,881 volcanic earthquakes, which included volcanic tremor events, 32 ashing events, and 101 PDCs detected throughout the month. On clear weather days, gas-and-steam emissions rose 300-1,500 m above the crater and drifted in different directions (figure 54). Sulfur dioxide emissions averaged 735-4,756 t/d, the higher value of which was measured on 16 August. During 1-2 August the rate of lava effusion decreased, but continued to feed the flows on the SE, S, and E flanks, maintaining their advances to 3.4 km, 2.8 km, and 1.1 km from the crater, respectively (figure 55). Rockfall and PDCs generated by collapses at the lava flow margins and from the summit dome deposited material within 4 km of the crater. During 3-4 August there were 10 tremor events detected that lasted 1-4 minutes. Short-lived lava pulse lasted 35 seconds and was accompanied by seismic and infrasound signals at 0442 on 6 August. Seven collapses were recorded at the front of the lava flow during 12-14 August.
During September, similar activity of slow lava effusion, PDCs, gas-and-steam emissions, and seismicity continued. There was a total of 4,452 rockfall events, 329 volcanic earthquakes, which included volcanic tremor events, two ashing events, and 85 PDCs recorded throughout the month. On clear weather days, gas-and-steam emissions rose 100-1,500 m above the crater and drifted in multiple directions. Sulfur dioxide emissions averaged 609-2,252 t/d, the higher average of which was measured on 6 September. Slow lava effusion continued advancing on the SE, S, and E flanks, maintaining lengths of 3.4 km, 2.8 km, and 1.1 km, respectively. Rockfall and PDC events generated by collapses along the lava flow margins and at the summit dome deposited material within 4 km of the crater.
Geologic Background. Symmetrical Mayon, which rises above the Albay Gulf NW of Legazpi City, is the most active volcano of the Philippines. The steep upper slopes are capped by a small summit crater. Recorded eruptions since 1616 CE range from Strombolian to basaltic Plinian, with cyclical activity beginning with basaltic eruptions, followed by longer periods of andesitic lava flows. Eruptions occur predominately from the central conduit and have also produced lava flows that travel far down the flanks. Pyroclastic density currents and mudflows have commonly swept down many of the approximately 40 ravines that radiate from the summit and have often damaged populated lowland areas. A violent eruption in 1814 killed more than 1,200 people and devastated several towns.
Information Contacts: Philippine Institute of Volcanology and Seismology (PHIVOLCS), Department of Science and Technology, University of the Philippines Campus, Diliman, Quezon City, Philippines (URL: http://www.phivolcs.dost.gov.ph/); MIROVA (Middle InfraRed Observation of Volcanic Activity), a collaborative project between the Universities of Turin and Florence (Italy) supported by the Centre for Volcanic Risk of the Italian Civil Protection Department (URL: http://www.mirovaweb.it/); Hawai'i Institute of Geophysics and Planetology (HIGP) - MODVOLC Thermal Alerts System, School of Ocean and Earth Science and Technology (SOEST), Univ. of Hawai'i, 2525 Correa Road, Honolulu, HI 96822, USA (URL: http://modis.higp.hawaii.edu/); Copernicus Browser, Copernicus Data Space Ecosystem, European Space Agency (URL: https://dataspace.copernicus.eu/browser/); William Rogers, Legazpi City, Albay Province, Philippines.
Nishinoshima (Japan) — October 2023 Cite this Report
Nishinoshima
Japan
27.247°N, 140.874°E; summit elev. 100 m
All times are local (unless otherwise noted)
Eruption plumes and gas-and-steam plumes during May-August 2023
Nishinoshima, located about 1,000 km S of Tokyo, is a small island in the Ogasawara Arc in Japan. The island is the summit of a massive submarine volcano that has prominent submarine peaks to the S, W, and NE. Eruptions date back to 1973 and the current eruption period began in October 2022. Recent activity has consisted of small ash plumes and fumarolic activity (BGVN 48:07). This report covers activity during May through August 2023, using information from monthly reports of the Japan Meteorological Agency (JMA) monthly reports and satellite data.
Activity during May through June was relatively low. The Japan Coast Guard (JCG) did overflights on 14 and 22 June and reported white gas-and-steam emissions rising 600 m and 1,200 m from the central crater of the pyroclastic cone, respectively (figure 125). In addition, multiple white gas-and-steam emissions rose from the inner rim of the W side of the crater and from the SE flank of the pyroclastic cone. Discolored brown-to-green water was observed around almost the entire perimeter of the island; on 22 June light green discolored water was observed off the S coast of the island.
Observations from the Himawari meteorological satellite confirmed an eruption on 9 and 10 July. An eruption plume rose 1.6 km above the crater and drifted N around 1300 on 9 July. Satellite images acquired at 1420 and 2020 on 9 July and at 0220 on 10 July showed continuing emissions that rose 1.3-1.6 km above the crater and drifted NE and N. The Tokyo VAAC reported that an ash plume seen by a pilot and identified in a satellite image at 0630 on 21 July rose to 3 km altitude and drifted S.
Aerial observations conducted by JCG on 8 August showed a white-and-gray plume rising from the central crater of the pyroclastic cone, and multiple white gas-and-steam emissions were rising from the inner edge of the western crater and along the NW-SE flanks of the island (figure 126). Brown-to-green discolored water was also noted around the perimeter of the island.
Intermittent low-to-moderate power thermal anomalies were recorded in the MIROVA graph (Middle InfraRed Observation of Volcanic Activity), showing an increase in both frequency and power beginning in July (figure 127). This increase in activity coincides with eruptive activity on 9 and 10 July, characterized by eruption plumes. According to the MODVOLC thermal alert algorithm, one thermal hotspot was recorded on 20 July. Weak thermal anomalies were also detected in infrared satellite imagery, accompanied by strong gas-and-steam plumes (figure 128).
Geologic Background. The small island of Nishinoshima was enlarged when several new islands coalesced during an eruption in 1973-74. Multiple eruptions that began in 2013 completely covered the previous exposed surface and continued to enlarge the island. The island is the summit of a massive submarine volcano that has prominent peaks to the S, W, and NE. The summit of the southern cone rises to within 214 m of the ocean surface 9 km SSE.
Information Contacts: Japan Meteorological Agency (JMA), 1-3-4 Otemachi, Chiyoda-ku, Tokyo 100-8122, Japan (URL: http://www.jma.go.jp/jma/indexe.html); Tokyo Volcanic Ash Advisory Center (VAAC), 1-3-4 Otemachi, Chiyoda-ku, Tokyo 100-8122, Japan (URL: http://ds.data.jma.go.jp/svd/vaac/data/); MIROVA (Middle InfraRed Observation of Volcanic Activity), a collaborative project between the Universities of Turin and Florence (Italy) supported by the Centre for Volcanic Risk of the Italian Civil Protection Department (URL: http://www.mirovaweb.it/); Copernicus Browser, Copernicus Data Space Ecosystem, European Space Agency (URL: https://dataspace.copernicus.eu/browser/).
Krakatau (Indonesia) — October 2023 Cite this Report
Krakatau
Indonesia
6.1009°S, 105.4233°E; summit elev. 285 m
All times are local (unless otherwise noted)
White gas-and-steam plumes and occasional ash plumes during May-August 2023
Krakatau is located in the Sunda Strait between Java and Sumatra, Indonesia. Caldera collapse during the catastrophic 1883 eruption destroyed Danan and Perbuwatan cones and left only a remnant of Rakata. The post-collapse cone of Anak Krakatau (Child of Krakatau) was constructed within the 1883 caldera at a point between the former Danan and Perbuwatan cones; it has been the site of frequent eruptions since 1927. The current eruption period began in May 2021 and has recently consisted of Strombolian eruptions and ash plumes (BGVN 48:07). This report describes lower levels of activity consisting of ash and white gas-and-steam plumes during May through August 2023, based on information provided by the Indonesian Center for Volcanology and Geological Hazard Mitigation, referred to as Pusat Vulkanologi dan Mitigasi Bencana Geologi (PVMBG), MAGMA Indonesia, and satellite data.
Activity was relatively low during May and June. Daily white gas-and-steam emissions rose 25-200 m above the crater and drifted in different directions. Five ash plumes were detected at 0519 on 10 May, 1241 on 11 May, 0920 on 12 May, 2320 on 12 May, and at 0710 on 13 May, and rose 1-2.5 km above the crater and drifted SW. A webcam image taken on 12 May showed ejection of incandescent material above the vent. A total of nine ash plumes were detected during 6-11 June: at 1434 and 00220 on 6 and 7 June the ash plumes rose 500 m above the crater and drifted NW, at 1537 on 8 June the ash plume rose 1 km above the crater and drifted SW, at 0746 and at 0846 on 9 June the ash plumes rose 800 m and 3 km above the crater and drifted SW, respectively, at 0423, 1431, and 1750 on 10 June the ash plumes rose 2 km, 1.5 km, and 3.5 km above the crater and drifted NW, respectively, and at 0030 on 11 June an ash plume rose 2 km above the crater and drifted NW. Webcam images taken on 10 and 11 June at 0455 and 0102, respectively, showed incandescent material ejected above the vent. On 19 June an ash plume at 0822 rose 1.5 km above the crater and drifted SE.
Similar low activity of white gas-and-steam emissions and few ash plumes were reported during July and August. Daily white gas-and-steam emissions rose 25-300 m above the crater and drifted in multiple directions. Three ash plumes were reported at 0843, 0851, and 0852 on 20 July that rose 500-2,000 m above the crater and drifted NW.
The MIROVA (Middle InfraRed Observation of Volcanic Activity) graph of MODIS thermal anomaly data showed intermittent low-to-moderate power thermal anomalies during May through August 2023 (figure 140). Although activity was often obscured by weather clouds, a thermal anomaly was visible in an infrared satellite image of the crater on 12 May, accompanied by an eruption plume that drifted SW (figure 141).
Geologic Background. The renowned Krakatau (frequently mis-named as Krakatoa) volcano lies in the Sunda Strait between Java and Sumatra. Collapse of an older edifice, perhaps in 416 or 535 CE, formed a 7-km-wide caldera. Remnants of that volcano are preserved in Verlaten and Lang Islands; subsequently the Rakata, Danan, and Perbuwatan cones were formed, coalescing to create the pre-1883 Krakatau Island. Caldera collapse during the catastrophic 1883 eruption destroyed Danan and Perbuwatan, and left only a remnant of Rakata. This eruption caused more than 36,000 fatalities, most as a result of tsunamis that swept the adjacent coastlines of Sumatra and Java. Pyroclastic surges traveled 40 km across the Sunda Strait and reached the Sumatra coast. After a quiescence of less than a half century, the post-collapse cone of Anak Krakatau (Child of Krakatau) was constructed within the 1883 caldera at a point between the former Danan and Perbuwatan cones. Anak Krakatau has been the site of frequent eruptions since 1927.
Information Contacts: Pusat Vulkanologi dan Mitigasi Bencana Geologi (PVMBG, also known as Indonesian Center for Volcanology and Geological Hazard Mitigation, CVGHM), Jalan Diponegoro 57, Bandung 40122, Indonesia (URL: http://www.vsi.esdm.go.id/); MAGMA Indonesia, Kementerian Energi dan Sumber Daya Mineral (URL: https://magma.esdm.go.id/v1); MIROVA (Middle InfraRed Observation of Volcanic Activity), a collaborative project between the Universities of Turin and Florence (Italy) supported by the Centre for Volcanic Risk of the Italian Civil Protection Department (URL: http://www.mirovaweb.it/); Copernicus Browser, Copernicus Data Space Ecosystem, European Space Agency (URL: https://dataspace.copernicus.eu/browser/).
Villarrica (Chile) — October 2023 Cite this Report
Villarrica
Chile
39.42°S, 71.93°W; summit elev. 2847 m
All times are local (unless otherwise noted)
Strombolian activity, gas-and-ash emissions, and crater incandescence during April-September 2023
Villarrica, in central Chile, consists of a 2-km-wide caldera that formed about 3,500 years ago and is located at the base of the presently active cone at the NW margin of a 6-km-wide caldera. Historical eruptions eruptions date back to 1558 and have been characterized by mild-to-moderate explosive activity with occasional lava effusions. The current eruption period began in December 2014 and has recently consisted of nighttime crater incandescence, ash emissions, and seismicity (BGVN 48:04). This report covers activity during April through September 2023 and describes occasional Strombolian activity, gas-and-ash emissions, and nighttime crater incandescence. Information for this report primarily comes from the Southern Andes Volcano Observatory (Observatorio Volcanológico de Los Andes del Sur, OVDAS), part of Chile's National Service of Geology and Mining (Servicio Nacional de Geología y Minería, SERNAGEOMIN) and satellite data.
Seismicity during April consisted of long period (LP) events and tremor (TRE); a total of 9,413 LP-type events and 759 TR-type events were detected throughout the month. Nighttime crater incandescence persisted and was visible in the degassing column. Sulfur dioxide data was obtained using Differential Absorption Optical Spectroscopy Equipment (DOAS) that showed an average value of 1,450 ± 198 tons per day (t/d) during 1-15 April and 1,129 ± 201 t/d during 16-30 April, with a maximum daily value of 2,784 t/d on 9 April. Gas-and-steam emissions of variable intensities rose above the active crater as high as 1.3 km above the crater on 13 April. Strombolian explosions were not observed and there was a slight decrease in the lava lake level.
There were 14,123 LP-type events and 727 TR-type events detected during May. According to sulfur dioxide measurements taken with DOAS equipment, the active crater emitted an average value of 1,826 ± 482 t/d during 1-15 May and 912 ± 41 t/d during 16-30 May, with a daily maximum value of 5,155 t/d on 13 May. Surveillance cameras showed continuous white gas-and-steam emissions that rose as high as 430 m above the crater on 27 May. Nighttime incandescence illuminated the gas column less than 300 m above the crater rim was and no pyroclastic emissions were reported. A landslide was identified on 13 May on the E flank of the volcano 50 m from the crater rim and extending 300 m away; SERNAGEOMIN noted that this event may have occurred on 12 May. During the morning of 27 and 28 May minor Strombolian explosions characterized by incandescent ejecta were recorded at the crater rim; the last reported Strombolian explosions had occurred at the end of March.
Seismic activity during June consisted of five volcano-tectonic (VT)-type events, 21,606 LP-type events, and 2,085 TR-type events. The average value of sulfur dioxide flux obtained by DOAS equipment was 1,420 ± 217 t/d during 1-15 June and 2,562 ± 804 t/d, with a maximum daily value of 4,810 t/d on 17 June. White gas-and-steam emissions rose less than 480 m above the crater; frequent nighttime crater incandescence was reflected in the degassing plume. On 12 June an emission rose 100 m above the crater and drifted NNW. On 15 June one or several emissions resulted in ashfall to the NE as far as 5.5 km from the crater, based on a Skysat satellite image. Several Strombolian explosions occurred within the crater; activity on 15 June was higher energy and ejected blocks 200-300 m on the NE slope. Surveillance cameras showed white gas-and-steam emissions rising 480 m above the crater on 16 June. On 19 and 24 June low-intensity Strombolian activity was observed, ejecting material as far as 200 m from the center of the crater to the E.
During July, seismicity included 29,319 LP-type events, 3,736 TR-type events, and two VT-type events. DOAS equipment recorded two days of sulfur dioxide emissions of 4,220 t/d and 1,009 t/d on 1 and 13 July, respectively. Constant nighttime incandescence was also recorded and was particularly noticeable when accompanied by eruptive columns on 12 and 16 July. Minor explosive events were detected in the crater. According to Skysat satellite images taken on 12, 13, and 16 July, ashfall deposits were identified 155 m S of the crater. According to POVI, incandescence was visible from two vents on the crater floor around 0336 on 12 July. Gas-and-ash emissions rose as high as 1.2 km above the crater on 13 July and drifted E and NW. A series of gas-and-steam pulses containing some ash deposited material on the upper E flank around 1551 on 13 July. During 16-31 July, average sulfur dioxide emissions of 1,679 ± 406 t/d were recorded, with a maximum daily value of 2,343 t/d on 28 July. Fine ash emissions were also reported on 16, 17, and 23 July.
Seismicity persisted during August, characterized by 27,011 LP-type events, 3,323 TR-type events, and three VT-type events. The average value of sulfur dioxide measurements taken during 1-15 August was 1,642 ± 270 t/d and 2,207 ± 4,549 t/d during 16-31 August, with a maximum daily value of 3,294 t/d on 27 August. Nighttime crater incandescence remained visible in degassing columns. White gas-and-steam emissions rose 480 m above the crater on 6 August. According to a Skysat satellite image from 6 August, ash accumulation was observed proximal to the crater and was mainly distributed toward the E slope. White gas-and-steam emissions rose 320 m above the crater on 26 August. Nighttime incandescence and Strombolian activity that generated ash emissions were reported on 27 August.
Seismicity during September was characterized by five VT-type events, 12,057 LP-type events, and 2,058 TR-type events. Nighttime incandescence persisted. On 2 September an ash emission rose 180 m above the crater and drifted SE at 1643 (figure 125) and a white gas-and-steam plume rose 320 m above the crater. According to the Buenos Aires VAAC, periods of continuous gas-and-ash emissions were visible in webcam images from 1830 on 2 September to 0110 on 3 September. Strombolian activity was observed on 2 September and during the early morning of 3 September, the latter event of which generated an ash emission that rose 60 m above the crater and drifted 100 m from the center of the crater to the NE and SW. Ashfall was reported to the SE and S as far as 750 m from the crater. The lava lake was active during 3-4 September and lava fountaining was visible for the first time since 26 March 2023, according to POVI. Fountains captured in webcam images at 2133 on 3 September and at 0054 on 4 September rose as high as 60 m above the crater rim and ejected material onto the upper W flank. Sulfur dioxide flux of 1,730 t/d and 1,281 t/d was measured on 3 and 4 September, respectively, according to data obtained by DOAS equipment.
Strong Strombolian activity and larger gas-and-ash plumes were reported during 18-20 September. On 18 September activity was also associated with energetic LP-type events and notable sulfur dioxide fluxes (as high as 4,277 t/d). On 19 September Strombolian activity and incandescence were observed. On 20 September at 0914 ash emissions rose 50 m above the crater and drifted SSE, accompanied by Strombolian activity that ejected material less than 100 m SSE, causing fall deposits on that respective flank. SERNAGEOMIN reported that a Planet Scope satellite image taken on 20 September showed the lava lake in the crater, measuring 32 m x 35 m and an area of 0.001 km2. Several ash emissions were recorded at 0841, 0910, 1251, 1306, 1312, 1315, and 1324 on 23 September and rose less than 150 m above the crater. The sulfur dioxide flux value was 698 t/d on 23 September and 1,097 t/d on 24 September. On 24 September the Volcanic Alert Level (VAL) was raised to Orange (the third level on a four-color scale). SENAPRED maintained the Alert Level at Yellow (the middle level on a three-color scale) for the communities of Villarrica, Pucón (16 km N), Curarrehue, and Panguipulli.
During 24-25 September there was an increase in seismic energy (observed at TR-events) and acoustic signals, characterized by 1 VT-type event, 213 LP-type events, and 124 TR-type events. Mainly white gas-and-steam emissions, in addition to occasional fine ash emissions were recorded. During the early morning of 25 September Strombolian explosions were reported and ejected material 250 m in all directions, though dominantly toward the NW. On 25 September the average value of sulfur dioxide flux was 760 t/d. Seismicity during 25-30 September consisted of five VT-type events, 1,937 LP-type events, and 456 TR-type events.
During 25-29 September moderate Strombolian activity was observed and ejected material as far as the crater rim. In addition, ash pulses lasting roughly 50 minutes were observed around 0700 and dispersed ENE. During 26-27 September a TR episode lasted 6.5 hours and was accompanied by discrete acoustic signals. Satellite images from 26 September showed a spatter cone on the crater floor with one vent that measured 10 x 14 m and a smaller vent about 35 m NE of the cone. SERNAGEOMIN reported an abundant number of bomb-sized blocks up to 150 m from the crater, as well as impact marks on the snow, which indicated explosive activity. A low-altitude ash emission was observed drifting NW around 1140 on 28 September, based on webcam images. Between 0620 and 0850 on 29 September an ash emission rose 60 m above the crater and drifted NW. During an overflight taken around 1000 on 29 September scientists observed molten material in the vent, a large accumulation of pyroclasts inside the crater, and energetic degassing, some of which contained a small amount of ash. Block-sized pyroclasts were deposited on the internal walls and near the crater, and a distal ash deposit was also visible. The average sulfur dioxide flux measured on 28 September was 344 t/d. Satellite images taken on 29 September ashfall was deposited roughly 3 km WNW from the crater and nighttime crater incandescence remained visible. The average sulfur dioxide flux value from 29 September was 199 t/d. On 30 September at 0740 a pulsating ash emission rose 1.1 km above the crater and drifted NNW (figure 126). Deposits on the S flank extended as far as 4.5 km from the crater rim, based on satellite images from 30 September.
Infrared MODIS satellite data processed by MIROVA (Middle InfraRed Observation of Volcanic Activity) showed intermittent thermal activity during April through September, with slightly stronger activity detected during late September (figure 127). Small clusters of thermal activity were detected during mid-June, early July, early August, and late September. According to the MODVOLC thermal alert system, a total of four thermal hotspots were detected on 7 July and 3 and 23 September. This activity was also intermittently captured in infrared satellite imagery on clear weather days (figure 128).
Geologic Background. The glacier-covered Villarrica stratovolcano, in the northern Lakes District of central Chile, is ~15 km south of the city of Pucon. A 2-km-wide caldera that formed about 3,500 years ago is located at the base of the presently active, dominantly basaltic to basaltic andesite cone at the NW margin of a 6-km-wide Pleistocene caldera. More than 30 scoria cones and fissure vents are present on the flanks. Plinian eruptions and pyroclastic flows that have extended up to 20 km from the volcano were produced during the Holocene. Lava flows up to 18 km long have issued from summit and flank vents. Eruptions documented since 1558 CE have consisted largely of mild-to-moderate explosive activity with occasional lava effusion. Glaciers cover 40 km2 of the volcano, and lahars have damaged towns on its flanks.
Information Contacts: Servicio Nacional de Geología y Minería (SERNAGEOMIN), Observatorio Volcanológico de Los Andes del Sur (OVDAS), Avda Sta María No. 0104, Santiago, Chile (URL: http://www.sernageomin.cl/); Proyecto Observación Villarrica Internet (POVI) (URL: http://www.povi.cl/); Sistema y Servicio Nacional de Prevención y Repuesta Ante Desastres (SENAPRED), Av. Beauchef 1671, Santiago, Chile (URL: https://web.senapred.cl/); Buenos Aires Volcanic Ash Advisory Center (VAAC), Servicio Meteorológico Nacional-Fuerza Aérea Argentina, 25 de mayo 658, Buenos Aires, Argentina (URL: http://www.smn.gov.ar/vaac/buenosaires/inicio.php); MIROVA (Middle InfraRed Observation of Volcanic Activity), a collaborative project between the Universities of Turin and Florence (Italy) supported by the Centre for Volcanic Risk of the Italian Civil Protection Department (URL: http://www.mirovaweb.it/); Hawai'i Institute of Geophysics and Planetology (HIGP) - MODVOLC Thermal Alerts System, School of Ocean and Earth Science and Technology (SOEST), Univ. of Hawai'i, 2525 Correa Road, Honolulu, HI 96822, USA (URL: http://modis.higp.hawaii.edu/); Copernicus Browser, Copernicus Data Space Ecosystem, European Space Agency (URL: https://dataspace.copernicus.eu/browser/).
Merapi (Indonesia) — October 2023 Cite this Report
Merapi
Indonesia
7.54°S, 110.446°E; summit elev. 2910 m
All times are local (unless otherwise noted)
Frequent incandescent avalanches during April-September 2023
Merapi, located just north of the major city of Yogyakarta in central Java, Indonesia, has had activity within the last 20 years characterized by pyroclastic flows and lahars accompanying growth and collapse of the steep-sided active summit lava dome. The current eruption period began in late December 2020 and has more recently consisted of ash plumes, intermittent incandescent avalanches of material, and pyroclastic flows (BGVN 48:04). This report covers activity during April through September 2023, based on information from Balai Penyelidikan dan Pengembangan Teknologi Kebencanaan Geologi (BPPTKG), the Center for Research and Development of Geological Disaster Technology, a branch of PVMBG which specifically monitors Merapi. Additional information comes from the Pusat Vulkanologi dan Mitigasi Bencana Geologi (PVMBG, also known as Indonesian Center for Volcanology and Geological Hazard Mitigation, CVGHM), MAGMA Indonesia, the Darwin Volcanic Ash Advisory Centre (VAAC), and various satellite data.
Activity during April through September 2023 primarily consisted of incandescent avalanches of material that mainly affected the SW and W flanks and traveled as far as 2.3 km from the summit (table 25) and white gas-and-steam emissions that rose 10-1,000 m above the crater.
Table 25. Monthly summary of avalanches and avalanche distances recorded at Merapi during April through September 2023. The number of reported avalanches does not include instances where possible avalanches were heard but could not be visually confirmed as a result of inclement weather. Data courtesy of BPPTKG (April-September 2023 daily reports).
| Month |
Average number of avalanches per day |
Distance avalanches traveled (m) |
| Apr 2023 |
19 |
1,200-2,000 |
| May 2023 |
22 |
500-2,000 |
| Jun 2023 |
18 |
1,200-2,000 |
| Jul 2023 |
30 |
300-2,000 |
| Aug 2023 |
25 |
400-2,300 |
| Sep 2023 |
23 |
600-2,000 |
BPPTKG reported that during April and May white gas-and-steam emissions rose 10-750 m above the crater, incandescent avalanches descended 500-2,000 m on the SW and W flanks (figure 135). Cloudy weather often prevented clear views of the summit, and sometimes avalanches could not be confirmed. According to a webcam image, a pyroclastic flow was visible on 17 April at 0531. During the week of 28 April and 4 May a pyroclastic flow was reported on the SW flank, traveling up to 2.5 km. According to a drone overflight taken on 17 May the SW lava dome volume was an estimated 2,372,800 cubic meters and the dome in the main crater was an estimated 2,337,300 cubic meters.
During June and July similar activity persisted with white gas-and-steam emissions rising 10-350 m above the crater and frequent incandescent avalanches that traveled 300-2,000 m down the SW, W, and S flanks (figure 136). Based on an analysis of aerial photos taken on 24 June the volume of the SW lava dome was approximately 2.5 million cubic meters. A pyroclastic flow was observed on 5 July that traveled 2.7 km on the SW flank. According to the Darwin VAAC multiple minor ash plumes were identified in satellite images on 19 July that rose to 3.7 km altitude and drifted S and SW. During 22, 25, and 26 July a total of 17 avalanches descended as far as 1.8 km on the S flank.
Frequent white gas-and-steam emissions continued during August and September, rising 10-450 m above the crater. Incandescent avalanches mainly affected the SW and W flanks and traveled 400-2,300 m from the vent (figure 137). An aerial survey conducted on 10 August was analyzed and reported that estimates of the SW dome volume was 2,764,300 cubic meters and the dome in the main crater was 2,369,800 cubic meters.
Frequent and moderate-power thermal activity continued throughout the reporting period, according to a MIROVA (Middle InfraRed Observation of Volcanic Activity) analysis of MODIS satellite data (figure 138). There was an increase in the number of detected anomalies during mid-May. The MODVOLC thermal algorithm recorded a total of 47 thermal hotspots: six during April, nine during May, eight during June, 15 during July, four during August, and five during September. Some of this activity was captured in infrared satellite imagery on clear weather days, sometimes accompanied by incandescent material on the SW flank (figure 139).
Geologic Background. Merapi, one of Indonesia's most active volcanoes, lies in one of the world's most densely populated areas and dominates the landscape immediately north of the major city of Yogyakarta. It is the youngest and southernmost of a volcanic chain extending NNW to Ungaran volcano. Growth of Old Merapi during the Pleistocene ended with major edifice collapse perhaps about 2,000 years ago, leaving a large arcuate scarp cutting the eroded older Batulawang volcano. Subsequent growth of the steep-sided Young Merapi edifice, its upper part unvegetated due to frequent activity, began SW of the earlier collapse scarp. Pyroclastic flows and lahars accompanying growth and collapse of the steep-sided active summit lava dome have devastated cultivated lands on the western-to-southern flanks and caused many fatalities.
Information Contacts: Balai Penyelidikan dan Pengembangan Teknologi Kebencanaan Geologi (BPPTKG), Center for Research and Development of Geological Disaster Technology (URL: http://merapi.bgl.esdm.go.id/, Twitter: @BPPTKG); MAGMA Indonesia, Kementerian Energi dan Sumber Daya Mineral (URL: https://magma.esdm.go.id/v1); Pusat Vulkanologi dan Mitigasi Bencana Geologi (PVMBG, also known as Indonesian Center for Volcanology and Geological Hazard Mitigation, CVGHM), Jalan Diponegoro 57, Bandung 40122, Indonesia (URL: http://www.vsi.esdm.go.id/); Darwin Volcanic Ash Advisory Centre (VAAC), Bureau of Meteorology, Northern Territory Regional Office, PO Box 40050, Casuarina, NT 0811, Australia (URL: http://www.bom.gov.au/info/vaac/); MIROVA (Middle InfraRed Observation of Volcanic Activity), a collaborative project between the Universities of Turin and Florence (Italy) supported by the Centre for Volcanic Risk of the Italian Civil Protection Department (URL: http://www.mirovaweb.it/); Hawai'i Institute of Geophysics and Planetology (HIGP) - MODVOLC Thermal Alerts System, School of Ocean and Earth Science and Technology (SOEST), Univ. of Hawai'i, 2525 Correa Road, Honolulu, HI 96822, USA (URL: http://modis.higp.hawaii.edu/); Copernicus Browser, Copernicus Data Space Ecosystem, European Space Agency (URL: https://dataspace.copernicus.eu/browser/); Øystein Lund Andersen (URL: https://www.oysteinlundandersen.com/, https://twitter.com/oysteinvolcano).
Ebeko
Russia
50.686°N, 156.014°E; summit elev. 1103 m
All times are local (unless otherwise noted)
Moderate explosive activity with ash plumes continued during June-November 2023
Ebeko, located on the N end of Paramushir Island in Russia’s Kuril Islands just S of the Kamchatka Peninsula, consists of three summit craters along a SSW-NNE line at the northern end of a complex of five volcanic cones. Observed eruptions date back to the late 18th century and have been characterized as small-to-moderate explosions from the summit crater, accompanied by intense fumarolic activity. The current eruptive period began in June 2022, consisting of frequent explosions, ash plumes, and thermal activity (BGVN 47:10, 48:06). This report covers similar activity during June-November 2023, based on information from the Kamchatka Volcanic Eruptions Response Team (KVERT) and satellite data.
Moderate explosive activity continued during June-November 2023 (figures 50 and 51). According to visual data from Severo-Kurilsk, explosions sent ash 2-3.5 km above the summit (3-4.5 km altitude) during most days during June through mid-September. Activity after mid-September was slightly weaker, with ash usually reaching less than 2 km above the summit. According to KVERT the volcano in October and November was, with a few exceptions, either quiet or obscured by clouds that prevented satellite observations. KVERT issued Volcano Observatory Notices for Aviation (VONA) on 8 and 12 June, 13 and 22 July, 3 and 21 August, and 31 October warning of potential aviation hazards from ash plumes drifting 3-15 km from the volcano. Based on satellite data, KVERT reported a persistent thermal anomaly whenever weather clouds permitted viewing.
Geologic Background. The flat-topped summit of the central cone of Ebeko volcano, one of the most active in the Kuril Islands, occupies the northern end of Paramushir Island. Three summit craters located along a SSW-NNE line form Ebeko volcano proper, at the northern end of a complex of five volcanic cones. Blocky lava flows extend west from Ebeko and SE from the neighboring Nezametnyi cone. The eastern part of the southern crater contains strong solfataras and a large boiling spring. The central crater is filled by a lake about 20 m deep whose shores are lined with steaming solfataras; the northern crater lies across a narrow, low barrier from the central crater and contains a small, cold crescentic lake. Historical activity, recorded since the late-18th century, has been restricted to small-to-moderate explosive eruptions from the summit craters. Intense fumarolic activity occurs in the summit craters, on the outer flanks of the cone, and in lateral explosion craters.
Information Contacts: Kamchatka Volcanic Eruptions Response Team (KVERT), Far Eastern Branch, Russian Academy of Sciences, 9 Piip Blvd., Petropavlovsk-Kamchatsky, 683006, Russia (URL: http://www.kscnet.ru/ivs/kvert/).
Search Bulletin Archive by Publication Date
Select a month and year from the drop-downs and click "Show Issue" to have that issue displayed in this tab.
The default month and year is the latest issue available.
Bulletin of the Global Volcanism Network - Volume 38, Number 10 (October 2013)
Managing Editor: Richard Wunderman
Alaid (Russia)
Minor ash plumes on 17 and 23 October and 8 November 2012
Apoyeque (Nicaragua)
Seismic swarms in 2009 and 2012
Barren Island (India)
Ash plume drifted up to 220 km SW in February 2013
Cleveland (United States)
Dome growth and destruction during 2012-2013
Karymsky (Russia)
Seismicity and ash plumes, September 2010-December 2013
Negro, Cerro (Nicaragua)
Seismic swarm in 2013
Rabaul (Papua New Guinea)
Variable but often modest eruptions during mid-2011 through 2013
Alaid
Russia
50.861°N, 155.565°E; summit elev. 2285 m
All times are local (unless otherwise noted)
Minor ash plumes on 17 and 23 October and 8 November 2012
Our previous report noted weak seismicity from Alaid during November 2003, although seismologists determined it was not related to volcanic activity (BGVN 28:11). This report discusses activity from December 2003 to January 2014. Emissions were observed in May 2010 and October 2012, but ash was not detected in the plumes until 23 October 2012. The last thermal anomaly was detected in December 2012.
Alaid volcano is located on Atlasova island off the southern tip of Russia's Kamchatka peninsula and represents the northernmost Holocene volcano in the Kuril Islands (figures 2 and 3). Other names for the volcano and island include Araido, Atlasova, Oyakoba, and Uyakhuzhach (Ukviggen, 2013). Despite the islands small size, its summit (2,339 m elevation) is the highest in the Kuriles. The volcano also plays a large and colorful role in the region's folklore (Ukviggen, 2013; Svalova, 1999).
On 5 October 2012, (KVERT) changed the Aviation Color Code from Green to Yellow due to "signs of elevated unrest above known background levels." A Volcano Observatory Notification to Aviation (VONA) noted that a possible explosive eruption could produce an ash column height of 10-15 km. Because Alaid is located near many flight routes, an eruption poses hazards to aviation (Girina and others, 2013).
On 23 May a gas-and-steam plume from Alaid was seen in satellite imagery drifting 11 km ESE. No other signs of possible increasing activity were seen in imagery or noted by observers on Paramushir Island during 21-28 May. During 2012, thermal anomalies were detected on 6, 12, 14-17, 19, 23, 27-28 and 30-31 October, 1, 4, 6-9, 12, 14, 20 and 24 November, and 4 and 12 December. At times, satellites could not detect thermal anomalies over Alaid volcano because of cloud cover, for example during the end of December 2012 and the beginning of January 2013. Visual observations from the adjacent Paramushir and Shumshu islands reported steam activity on 5, 11, 16, 17, 23, 26 and 27 October 2012; steam plumes rose 200 m on 5 October and 3 km on 23 October. (KVERT) and Institute of Volcanology and Seismology (IVS) FED RAS photographs showed fumarole activity on 6, 11, 12, 16, 25 and 27 October and 29 November 2012.
Several ash plumes erupting from Alaid volcano were reported in October and November 2012. (KVERT) and (IVS) FED RAS photographs from 17 and 23 October showed steam plumes containing ash rising 700 m. During this time, a small cinder cone grew in the larger summit crater. The volcano and its summit crater can be observed during an interval of inactivity on figure 4. Observers on 8 November 2012 noted that the volcanic cone was covered by ash.
Because of mechanical problems, seismicity could not be monitored for the majority of the time Alaid was at Aviation Color Code Yellow; seismic data was unavailable from January 2009 until November 2012. The seismic station was repaired on 16 November 2012, and KVERT noted moderate seismic activity. During early December, the amplitude of volcanic tremor was in the range 12.1-18.7 μm/s. After 11 December 2012, technical reasons again prevented further seismic data acquisition.
On 8 January 2013 the Aviation Color Code was reduced to Green, meaning that "volcanic activity was considered to have ceased, and the volcano reverted to its normal, non-eruptive state" (KVERT).
References: Svalova, VB, 1999, Geothermal Legends through History in Russia and the Former USSR: A Bridge to the Past, Geothermal Resources Council Transactions, v. 22 p.235-239. PDF file. (URL: http://pubs.geothermal-library.org/lib/grc/1015911.pdf)
Ukviggen, 2013, Alaid: Part 1–the Banished Beauty, Volcano Cafe, 24 April 2013. Accessed online 13 January 2014. (URL: http://volcanocafe.wordpress.com/2013/04/24/alaid-part-1-the-banished-beauty/)
Girina,O., Manevich, A., Melnikov, D., Nuzhdaev,A., Demyanchuk, Y., and Petrova, E., 2013, Explosive Eruptions of Kamchatkan Volcanoes in 2012 and Danger to Aviation, EGU General Assembly, (abstract), 2013 meeting in Vienna, Austria. (URL: http://adsabs.harvard.edu/abs/2013EGUGA..15.6760G).
Geologic Background. The highest and northernmost volcano of the Kuril Islands, Alaid is a symmetrical stratovolcano when viewed from the north, but has a 1.5-km-wide summit crater that is breached open to the south. This basaltic to basaltic andesite volcano is the northernmost of a chain constructed west of the main Kuril archipelago. Numerous pyroclastic cones are present the lower flanks, particularly on the NW and SE sides, including an offshore cone formed during the 1933-34 eruption. Strong explosive eruptions have occurred from the summit crater beginning in the 18th century. Reports of eruptions in 1770, 1789, 1821, 1829, 1843, 1848, and 1858 were considered incorrect by Gorshkov (1970). Explosive eruptions in 1790 and 1981 were among the largest reported in the Kuril Islands.
Information Contacts: Olga Girina, Kamchatka Volcanic Eruptions Response Team (KVERT), a cooperative program of the Institute of Volcanic Geology and Geochemistry, Far East Division, Russian Academy of Sciences, Piip Ave. 9, Petropavlovsk-Kamchatsky, 683006, Russia; Volcano World (URL: http://volcano.oregonstate.edu/alaid); and International Space Station, the Image Science & Analysis Laboratory at Nasa's Johnson Space Center, and William L. Stefanov (Jacobs Technology).
Apoyeque (Nicaragua) — October 2013 Cite this Report
Apoyeque
Nicaragua
12.242°N, 86.342°W; summit elev. 518 m
All times are local (unless otherwise noted)
Seismic swarms in 2009 and 2012
Within the last five years, Instituto Nicaragüense de Estudios Territoriales (INETER) reported at least two seismic swarms at Apoyeque, and between the Chiltepe Peninsula and the city of Managua (~15 km SE) (figure 1). Our last report also highlighted swarms which lasted several hours and days in 2001 and 2007 (BGVN 34:04). Intermittent seismicity was reported within the region during 2009-2012, but events were rarely larger than M 2.5.
2009 swarm. INETER reported a seismic swarm on 29 September 2009. It began at 1800 local time in an area W of Apoyeque volcano. The main event occurred at 1817 local time, with a ML 3.1 event at a depth of 5 km. The earthquake was felt by the population in Sandino City, ~5 km W of the earthquakes. The seismic swarm lasted until 2 October 2009; the total number of detected earthquakes was not disclosed.
2012 swarm. INETER reported a swarm that began at 1727 local time on 6 September 2012. The National Seismic Network detected and located the series of earthquakes between Apoyeque and the Nejapa-Miraflores fault (figure 1).
More than 20 earthquakes were detected and the two largest had magnitudes of 2.3 and 3.8, with depths of 2.8 and 6 km respectively; the largest event occurred at 1937 (figure 2). None of these earthquakes were reportedly felt by local populations and the event was assigned an Intensity II. The swarm lasted ~2 hours.
Avellán and others (2012) described the polygenetic Apoyeque volcano as belonging to the Nejapa volcanic field (figure 1), which is bound by the Nejapa fault system. There were 23 eruptions from the field within the last ~30 ka; 13 of these events were explosive (VEI 2). The most recent eruption was dated between 2,130 ± 40 and 1,245 ± 120 years BP. With respect to hazards implications, clear vent migration patterns were seemingly absent for this volcanic field. The authors concluded that there is a high probability of future, similar eruptions, particularly phreatomagmatic ones, within this area of Nicaragua.
References: Avellán, D.R., Macías, J.L., Pardo, N., Scolamacchia, T., and Rodriguez, D., 2012, Stratigraphy, geomorphology, geochemistry and hazard implications of the Nejapa Volcanic Field, western Managua, Nicaragua, Journal of Volcanology and Geothermal Research, 213-214: 51-71.
Pardo, N., Macías, J.L., Giordano, G., Cianfarra, P., Avellán, D.R., and Bellatreccia, F., 2009, The ~1245 yr BP Asososca maar eruption: The youngest event along the Nejapa-Miraflores volcanic fault, Western Managua, Nicaragua, Journal of Volcanology and Geothermal Research, 184: 292-312.
Geologic Background. The Apoyeque volcanic complex occupies the broad Chiltepe Peninsula, which extends into south-central Lake Managua. The peninsula is part of the Chiltepe pyroclastic shield volcano, one of three large ignimbrite shields on the Nicaraguan volcanic front. A 2.8-km wide, 400-m-deep, lake-filled caldera whose floor lies near sea level truncates the low Apoyeque edifice, which rises only about 500 m above the lake shore. The caldera was the source of a thick deposit of dacitic pumice that covers the surrounding area. The 2.5 x 3 km lake-filled Xiloá (Jiloá) maar is located immediately SE of Apoyeque. The Talpetatl lava dome was constructed between Laguna Xiloá and Lake Managua. Pumiceous pyroclastic flows from Laguna Xiloá were erupted about 6,100 years ago and overlie deposits of comparable age from the Masaya Plinian eruption.
Information Contacts: Instituto Nicaragüense de Estudios Territoriales (INETER), Apartado Postal 2110, Managua, Nicaragua (URL: http://www.ineter.gob.ni/).
Barren Island (India) — October 2013 Cite this Report
Barren Island
India
12.278°N, 93.858°E; summit elev. 354 m
All times are local (unless otherwise noted)
Ash plume drifted up to 220 km SW in February 2013
Our last Bulletin report (BGVN 36:06) noted that Barren Island was still erupting during 2011. This report both discusses an April 2010 ash plume that recently came to our attention and reports on activity as late as October 2013. A regional map appears in the last section.
On 19 April 2010, based on analysis of satellite imagery, the Darwin Volcanic Ash Advisory Centre (VAAC) reported that a plume from Barren Island rose to an altitude of 2.4 km and drifted 55 km N. Ash, however, could not be identified from the satellite data.
A Twitter posting included the photo in figure 20, an image apparently acquired in December 2010. The Indian Navy (via Twitter) reported seeing "smoke" and lava was also seen on the island from a surveillance plane on 16 October 2013. A large hot spot is visible on recent MODIS satellite data.
VAAC reported that on 16 February 2013 during 1430 to 2000 (UTC date and time) an ash plume from Barren Island reached an altitude of 6.1 km and drifted 220 km SW. Meteorological clouds masked the ash cloud after 2000 UTC and the VAAC warned that ash could still reside at altitude. The 16 February 2013 plume height was derived from a 1530 UTC MTSAT-2 infrared image and an atmospheric sounding at Penang made at 1200 UTC. The VAAC also created a forecast of the plume's movement based on the Hysplit model data.
Darwin VAAC found that on 17 October 2013 an ash plume rose to an altitude of 3.7 km and drifted ~30 km NW. The plume was first seen in imagery at 0732 UTC and last seen at 0932 UTC. Plume height was derived from MTSAT-2 visible wavelength image, observed ash movement, and comparison to winds from both an atmospheric model and a 0600 UTC sounding.
Regional map. A regional map brings together geography and tectonics of the region centered on Barren Island (figure 21).
At Barren Island's latitude, the convergent boundary is the subduction zone named the Andaman trench; to the S is the Sumatran trench, and to the N is the continental-collision zone marked by the Indo-Myanmar ranges (IMR) and still farther N and W, the Himalayan front. The large white arrow shows the NNE relative-motion vector of ~60 mm/yr for the Indian Plate and the Eurasian PlateW of Sumatra. The 26 December 2004 Sumatran earthquake (Mw 9.3) is marked by a white dot. Taken from Sanjeev Raghav (2011).
References: Luhr, J. F. and Haldar, D., 2006, Barren Island volcano (NE Indian Ocean): island-arc high-alumina basalts produced by troctolite contamination; J. Volcanol. Geotherm. Res., vol. 149, pp. 177-212.
Ray, J.S, Pande K., Awasthi, N. 2013, A minimum age for the active Barren Island volcano, Andaman Sea, Current Science; Special Section: Earth Sciences, Vol. 104, No. 7, 10 April 2013.
Sanjeev, R. 2011, Barren Volcano- A Pictorial Journey From Recorded Past To Observed Recent Part-I Earth Science India, Open Access e-Journal, Popular Issue, IV (III), July, 2011; (URL: www.earthscienceindia.info ).
Siebert, L. and Simkin, T.,2002, Volcanoes of the world: an illustrated catalog of Holocene volcanoes and their eruptions, Smithsonian Institution Global Volcanism Program, Digital Information Series, GVP-3.
Simkin, T., Tilling, R.I., Vogt, P.R., Kirby, S., Kimberly, P., and Stewart, D.B. This Dynamic Planet: World Map of Volcanoes, Earthquakes, Impact Craters, and Plate Tectonics U.S. Geological Survey (2005).
Geologic Background. Barren Island, a possession of India in the Andaman Sea about 135 km NE of Port Blair in the Andaman Islands, is the only historically active volcano along the N-S volcanic arc extending between Sumatra and Burma (Myanmar). It is the emergent summit of a volcano that rises from a depth of about 2250 m. The small, uninhabited 3-km-wide island contains a roughly 2-km-wide caldera with walls 250-350 m high. The caldera, which is open to the sea on the west, was created during a major explosive eruption in the late Pleistocene that produced pyroclastic-flow and -surge deposits. Historical eruptions have changed the morphology of the pyroclastic cone in the center of the caldera, and lava flows that fill much of the caldera floor have reached the sea along the western coast.
Information Contacts: Darwin Volcanic Ash Advisory Centre (VAAC), Bureau of Meteorology, Northern Territory Regional Office, PO Box 40050, Casuarina Northern Territory 0811 Australia; Twitter (URL: https://twitter.com/twitter); and VolcanoDiscovery (URL: http://www.volcanodiscovery.com/).
Cleveland (United States) — October 2013 Cite this Report
Cleveland
United States
52.825°N, 169.944°W; summit elev. 1730 m
All times are local (unless otherwise noted)
Dome growth and destruction during 2012-2013
In the previous Bulletin report (BGVN 37:01) we discussed a cycle of lava-dome growth within the summit crater from late 2011 through early 2012. That cycle of extrusion and destruction of domes continued into 2013. The lava dome observed on 30 January 2013 persisted to the end of this reporting period, September 2013. The dynamic conditions at Cleveland caused the Alaska Volcano Observatory (AVO) to report numerous changes in the Aviation Color Code and Alert Level, fluctuating between Yellow/Advisory and Orange/Watch throughout this time period (table 5).
Table 5. During 2012-2013, AVO announced changes in the Aviation Color Code and Volcano Alert Level for Cleveland. AVO and other US Observatories use a combination color code and alert level system that addresses both airborne and ground-based hazards (Gardner and Guffanti, 2006); the lowest level in this 4-step system is Normal/Green and the highest is Warning/Red. Courtesy of USGS-AVO.
| Date of Change |
Aviation Color Code/ Volcano Alert Level |
| 31 Jan 2012 |
Orange/Watch |
| 23 Mar 2012 |
Yellow/Advisory |
| 28 Mar 2012 |
Orange/Watch |
| 30 May 2012 |
Yellow/Advisory |
| 19 Jun 2012 |
Orange/Watch |
| 05 Sep 2012 |
Yellow/Advisory |
| 10 Nov 2012 |
Orange/Watch |
| 21 Nov 2012 |
Yellow/Advisory |
| 06 Feb 2013 |
Orange/Watch |
| 08 Mar 2013 |
Yellow/Advisory |
| 04 May 2013 |
Orange/Watch |
| 04 Jun 2013 |
Yellow/Advisory |
Continued explosions during 2012-2013. Cleveland has a history of frequent, minor ash emissions particularly during 2005-2009 (McGimsey and others, 2007; Neal and others, 2011) and with more frequency during 2011-2013 (Guffanti and Miller, 2013; De Angelis and others, 2012). During 2012-2013, Cleveland remained unmonitored by ground-based seismic instrumentation; volcanic unrest was primarily detected by the seismic network located on nearby Umnak Island (figure 12). Observations were also conducted with satellites that have capabilities of distinguishing ash from meteorological clouds during clear conditions: GOES (Geostationary Operational Environmental Satellite), POES (Polar Operational Environmental Satellite which carries the AVHRR scanner), and the Terra and Aqua satellites that carry MODIS sensors.
Additional assessments of explosive activity in this period were aided by (1) direct observations from mariners or pilots (PIREPS); (2) near real-time recordings of ground-coupled airwaves that characteristically arrive at seismic stations as extremely slow velocity signals, ~1 order of magnitude smaller than typical seismic velocity in the crust (De Angelis and others, 2012); (3) new infrasound detection capabilities recently expanded to include a station on Akutan (~500 km ENE of Cleveland).
De Angelis and others (2012) determined that 20 explosions were detected between December 2011 and August 2012, particularly by infrasound sensors as far away as 1,827 km from the active vent, as well as ground-coupled acoustic waves recorded at seismic stations across the Aleutian Arc. By retrospectively examining the record of airwaves from Cleveland, those authors determined that many explosions had gone unnoticed in satellite images, likely because of poor weather conditions that obscured the signal or because these explosions were brief, small, and lofted little ash.
Significant ash explosions in April-June 2012 and May 2013. During the 2012-2013reporting period, explosions from Cleveland's summit crater were most frequently detected during April and June 2012 (figure 13). Additional explosions were reported by AVO through July 2013. Relative quiescence (which included minor thermal anomalies visible in satellite images) followed and continued through September 2013.
During 2012-2013, at least two explosions were large enough to generate ash plumes that reached >4 km above the summit crater. Both were reported by the Anchorage Volcanic Ash Advisory Center (VAAC) on 7 April 2012 and 4 May 2013. The April event produced a plume that rose ~6 km a.s.l.; AVO reported that ash drifted E at 18 m/s. The 4 May 2013 event (figure 14) generated an ash plume that rose ~4.6 km a.s.l. Based on POES data and AVO observations, the ash drifted SE at ~10 m/s and dissipated within 5 hours.
During 2012-2013, AVO reported that explosions were frequently attributed to dome destruction. Those events often completely removed the new lava domes from the crater (table 6).
Table 6. Cleveland's lava dome history during 2012-2013 based on a variety of observations of the Cleveland summit crater. Note that an earlier dome was destroyed during 25-29 December 2011 and was confirmed absent by 24 January 2012. Courtesy of USGS-AVO.
| New Dome Date |
Observations |
| 30 Jan 2012 |
40 m across. Dome was gone by 11 March 2012. |
| 26 Mar 2012 |
70 m across. Dome was gone by 4 April 2012. |
| 25 Apr 2012 |
25 m across. Dome was gone some time before 29 April 2012. |
| 03 May 2012 |
25 m wide. Dome was gone by 6 May 2012. |
| 30 Jan 2013 |
100 m wide. Dome persisted through September 2013. |
More on elevated surface temperatures during 2012-2013. In addition to the case shown in figure 14A, thermal anomalies in the vicinity of Cleveland's summit crater were frequently detected during this reporting period. AVO inferred that these observations reflected a variety of volcanic activity such as fresh, hot tephra from recent explosions, the hot open conduit at the bottom of the summit crater, incandescent rock such as the above mentioned domes (table 6) at the surface, or hot volcaniclastic flow deposits on the flanks (figure 15).
AVO reported that a satellite-based thermal alarm was triggered on 12 June 2012, attributed to the formation of hot lahars or rubble flows on Cleveland's flanks. While no lava dome was present at that time (see table 6), this was a significant event that transported debris to 700 m elevation on the NW flank (note that Cleveland has a summit elevation of 1,730 m). Other deposits, likely from other lahars, were mobilized on the NNW and NNE flanks. The deposits were mainly confined to drainages; deposits extended >1.5 km in length. Flowage features on the SE and SW flanks reached >1 km in length. AVO scientists also noted that all flanks had shown signs of melted snow but cautioned that the visual effect could also be attributed to non-eruptive remobilization of existing fragmental material on the steep flanks.
Volcaniclastic deposits were also noted based in satellite images on 10 November 2012. These features were located on the E flank and extended ~1 km down the slope.
References: De Angelis, S., Fee, D., Haney, M., and Schneider, D., 2012. Detecting hidden volcanic explosions from Mt. Cleveland Volcano, Alaska with infrasound and ground-coupled airwaves, Geophysical Research Letters, 39, L21312, doi:10.1029/2012GL053635.
Gardner, C.A. and Guffanti, M.C., 2006. U.S. Geological Survey's Alert Notification System for Volcanic Activity, USGS Fact Sheet 2006-3139.
Guffanti, M., and Miller, T., 2013. A volcanic activity alert-level system for aviation: review of its development and application in Alaska: Natural Hazards, 15 p., doi:0.1007/s11069-013-0761-4.
McGimsey, R.G., Neal, C.A., Dixon, J.P., and Ushakov, Sergey, 2007. 2005 Volcanic activity in Alaska, Kamchatka, and the Kurile Islands: Summary of events and response of the Alaska Volcano Observatory: U.S. Geological Survey Scientific Investigations Report 2007-5269, 94 p., available at http://pubs.usgs.gov/sir/2007/5269/.
Neal, C.A., McGimsey, R.G., Dixon, J.P., Cameron, C.E., Nuzhaev, A.A., and Chibisova, Marina, 2011. 2008 Volcanic activity in Alaska, Kamchatka, and the Kurile Islands: Summary of events and response of the Alaska Volcano Observatory: U.S. Geological Survey Scientific Investigations Report 2010-5243, 94 p., available at http://pubs.usgs.gov/sir/2010/5243.
Geologic Background. The beautifully symmetrical Mount Cleveland stratovolcano is situated at the western end of the uninhabited Chuginadak Island. It lies SE across Carlisle Pass strait from Carlisle volcano and NE across Chuginadak Pass strait from Herbert volcano. Joined to the rest of Chuginadak Island by a low isthmus, Cleveland is the highest of the Islands of the Four Mountains group and is one of the most active of the Aleutian Islands. The native name, Chuginadak, refers to the Aleut goddess of fire, who was thought to reside on the volcano. Numerous large lava flows descend the steep-sided flanks. It is possible that some 18th-to-19th century eruptions attributed to Carlisle should be ascribed to Cleveland (Miller et al., 1998). In 1944 it produced the only known fatality from an Aleutian eruption. Recent eruptions have been characterized by short-lived explosive ash emissions, at times accompanied by lava fountaining and lava flows down the flanks.
Information Contacts: Alaska Volcano Observatory (AVO), a cooperative program of a)U.S. Geological Survey, 4200 University Drive, Anchorage, AK 99508-4667, USA (URL: http://www.avo.alaska.edu/), b)Geophysical Institute, University of Alaska, PO Box 757320, Fairbanks, AK 99775-7320, USA (URL: http://www.gi.alaska.edu/), and c)Alaska Division of Geological & Geophysical Surveys, 794 University Ave., Suite 200, Fairbanks, AK 99709, USA (URL: http://www.dggs.alaska.gov/); and Anchorage Volcanic Ash Advisory Center (VAAC), 6930 Sand Lake Road, Anchorage, AK 99502, USA (URL: http://vaac.arh.noaa.gov/list_vaas.php).
Karymsky (Russia) — October 2013 Cite this Report
Karymsky
Russia
54.049°N, 159.443°E; summit elev. 1513 m
All times are local (unless otherwise noted)
Seismicity and ash plumes, September 2010-December 2013
This report summarizes activity at Karymsky from September 2010 to 31 December 2013. This period was characterized by frequent explosions with ash plumes, and persistent thermal anomalies. During this period, explosions catapulted ash to altitudes as high as 6.5 km (and possibly higher). According to Girina and others (2013), Karymsky has been in a state of explosive eruption since 1996.
The Kamchatka Volcanic Eruptions Response Team (KVERT) monitors the volcano by seismic instruments and by satellite. Occasionally, pilots and volcanologists observe the volcano visually; however, the volcano is frequently shrouded by clouds. KVERT does not directly observe ash plumes, but infers their presence and their maximum altitudes based upon seismic data, although sometimes satellite observations are used. Occasionally, plume altitudes and directions are provided by the Tokyo Volcanic Ash Advisory Center (VAAC), based on information from Yelizovo Airport (UHPP). The Aviation Color Code was Orange (the second highest) throughout the reporting period. This report is based on weekly KVERT online reports.
Figures 27 and 28 show Kamchatka and Karymsky in the context of both geography and representative aviation flight paths. Since Karymsky sits directly below a principal flight route and close to many others, tall ash plumes from Karymsky present an acute hazard to aircraft. More than 200 flights per day occurred over the North Pacific region at the end of 2007 (Neal and others, 2007). That translated to over 10,000 passengers and millions of dollars in cargo that flew across the North Pacific every day (Neal and others, 2007).
September 2010-December 2012 activity. During September 2010-December 2010, KVERT weekly reports stated that seismic activity was at or above background levels. During January 2011-December 2012, most reports characterized the seismic activity as moderate. However, KVERT stated that activity was weak and moderate between 23 August-20 September 2012, during the week before 25 October 2012, and during all of December 2012. Activity was weak during the first week of July 2012.
According to KVERT, one or more ash explosions occurred weekly, and ash plumes rose to altitudes of 2-6.5 km, with most weekly values in the altitude range of 2.5-5 km. Explosive activity apparently weakened slightly during April and May 2012, with plume altitudes decreasing to 1.8-2.5 km, and apparently weakened further between mid-July and mid-August 2012, when KVERT did not report any ash plumes.
Figure 29 shows an image captured the MODIS instrument during May 2011. A plume is discernable to the edge of the image, ~140 km ESE. Radiating from the volcano is a pattern of recent ash fall deposits contrasting with broad snow cover.
During mid-September 2012, ash plume altitudes reached 5.5-6 km, but had decreased to a more normal 3 km in December 2012. On 11 April 2012, instruments aboard the Terra satellite detected ash deposits about 15 km long on the E flank. According to the Tokyo VAAC, an ash plume rose to an altitude of 7.3 km and drifted N on 13 March 2011, and to an altitude of 5.5-11.9 km and drifted SW on 18 April 2011; the Tokyo VAAC reported several other ash plumes during the reporting period, but the two mentioned here represent the maximum plumes heights recorded during the reporting period.
KVERT reported Stombolian activity during October 2010. A thermal anomaly was reported every week during this period, although clouds often obscured satellite data.
On 20 November 2010, volcanologists aboard a helicopter observed moderate gas-and-steam activity. Slopes near the summit were covered with ash. According to KVERT, volcanologists also visually observed weak gas-and-steam activity on 18 December 2012.
2013 activity. During January through March 2013, seismic activity fluctuated from weak to moderate. During April through mid-August, seismic activity was not recorded for technical reasons. From mid-August through the end of 2013, activity was moderate. When satellite data was included in 2013 KVERT weekly reports (6, 14 March; 11, 18 July; 5, 12, 19 September; 3 October), the volcano was either quiet or obscured by clouds.
KVERT reports from 10 October 2013 through at least 2 January 2014 stated that Strombolian and weak Vulcanian activity probably had occurred, because satellite data sometimes showed a bright thermal anomaly over the volcano along with ash plumes (figure 30). The reports did not mention this activity during earlier portions of the reporting period (September 2010-December 2013), except for mid-October 2010; however, because thermal anomalies persisted throughout the reporting period and ash plumes were common, we suspect that Strombolian and weak Vulcanian activity probably occurred often during this time.
During 2013, ash plumes seldom exceeded an altitude of 3.5 km. However, powerful ash explosions up to an altitude of 6 km were observed on 5 August by a helicopter crew and volcanologists on the flank of nearby Tolbachik volcano.
Lopez and others (2012) used "coincident measurements of infrasound, SO2, ash, and thermal radiation collected over a ten day period at Karymsky Volcano in August 2011 to characterize the observed activity and elucidate vent processes. The ultimate goal of this project is to enable different types of volcanic activity to be identified using only infrasound data, which would significantly improve our ability to continuously monitor remote volcanoes. Four types of activity were observed. Type 1 activity is characterized by discrete ash emissions occurring every 1- 5 minutes that either jet or roil out of the vent, by plumes from 500-1500 m (above vent) altitudes, and by impulsive infrasonic onsets. Type 2 activity is characterized by periodic pulses of gas emission, little or no ash, low altitude (100 - 200 m) plumes, and strong audible jetting or roaring. Type 3 activity is characterized by sustained emissions of ash and gas, with multiple pulses lasting from ~1-3 minutes, and by plumes from 300-1500 m. Type 4 activity is characterized by periods of relatively long duration (~30 minutes to >1 hour) quiescence, no visible plume and weak SO2 emissions at or near the detection limit, followed by an explosive, magmatic eruption, producing ash-rich plumes to >2,000 m, and centimeter to meter (or greater) sized pyroclastic bombs that roll down the flanks of the edifice. Eruption onset is accompanied by high-amplitude infrasound and occasionally visible shock-waves, indicating high vent overpressure."
The above meeting abstract ultimately led to the paper Lopez and others (2013). In the abstract for that work, the authors characterized the four types of activity as: (1) ash explosions, (2) pulsatory degassing, (3) gas jetting, and (4) explosive eruption.
Ongoing eruptions, often on a near daily basis, prevailed during January-March 2014, with thermal anomalies on satellite data, ash plumes hundreds of meters over the ~1.5 km summit's elevation. The plumes were visible in imagery for over 100 km downwind (often in the sector NE-E-SE).
References: Girina, O., Manevich, A., Melnikov, D., Nuzhdaev, A., Demyanchuk, Y., and Petrova, E., 2013, Explosive Eruptions of Kamchatkan Volcanoes in 2012 and Danger to Aviation, Geophysical Research Abstracts, Vol. 15, EGU General Assembly 2013 held 7-12 April, 2013 in Vienna, Austria, id. EGU2013-6760.
Lopez, T., Fee, D, and Prata, F., 2012, Characterization of volcanic activity using observations of infrasound, volcanic emissions, and thermal imagery at Karymsky Volcano, Kamchatka, Russia, Geophysical Research Abstracts, Vol. 14, EGU General Assembly 2012, held 22-27 April, 2012 in Vienna, Austria., p.13076.
Lopez, T., D. Fee, F. Prata, and J. Dehn, 2013, Characterization and interpretation of volcanic activity at Karymsky Volcano, Kamchatka, Russia, using observations of infrasound, volcanic emissions, and thermal imagery, Geochem. Geophys. Geosyst., 14, 5106-5127, doi:10.1002/2013GC004817
Neal C, Girina O, Senyukov S, Rybin A, Osiensky J, Izbekov P, Ferguson G, 2009, Russian eruption warning systems for aviation. Natural Hazards, 51(2), p. 245-262
Neal, C, Girina, O, Senyukov, S, Rybin, A, Osiensky, J, Hall, T, Nelson, K, and Izbekov, P, 2007, Eruption Warning Systems for Aviation in Russia: A 2007 Status Report, World Meteorological Organization (WMO), in close collaboration with the International Civil Aviation Organization (ICAO) and the Civil Aviation Authority Of New Zealand, paper at the Fourth International Workshop On Volcanic Ash, Rotorua, New Zealand, 26-30 March 2007 [VAWS/4 WP/03-01] (URL: http://www.caem.wmo.int/moodle/file.php?file=/1/VWS/6_VAWS4WP0301_1_.pdf)
Geologic Background. Karymsky, the most active volcano of Kamchatka's eastern volcanic zone, is a symmetrical stratovolcano constructed within a 5-km-wide caldera that formed during the early Holocene. The caldera cuts the south side of the Pleistocene Dvor volcano and is located outside the north margin of the large mid-Pleistocene Polovinka caldera, which contains the smaller Akademia Nauk and Odnoboky calderas. Most seismicity preceding Karymsky eruptions originated beneath Akademia Nauk caldera, located immediately south. The caldera enclosing Karymsky formed about 7600-7700 radiocarbon years ago; construction of the stratovolcano began about 2000 years later. The latest eruptive period began about 500 years ago, following a 2300-year quiescence. Much of the cone is mantled by lava flows less than 200 years old. Historical eruptions have been vulcanian or vulcanian-strombolian with moderate explosive activity and occasional lava flows from the summit crater.
Information Contacts: Kamchatka Volcanic Eruptions Response Team (KVERT), Far East Division, Russian Academy of Sciences, 9 Piip Blvd., Petropavlovsk-Kamchatsky, 683006, Russia (URL: http://www.kscnet.ru/ivs/); Tokyo Volcanic Ash Advisory Center (VAAC), Tokyo, Japan (URL: http://ds.data.jma.go.jp/svd/vaac/data/); Kamchatka Branch of Geophysical Survey of RAS (KB GS RAS) (URL: http://www.emsd.ru/); and Jeff Schmaltz and Robert Simmon, NASA Earth Observatory (URL: http://earthobservatory.nasa.gov).
Cerro Negro (Nicaragua) — October 2013 Cite this Report
Cerro Negro
Nicaragua
12.506°N, 86.702°W; summit elev. 728 m
All times are local (unless otherwise noted)
Seismic swarm in 2013
Since our last report (BGVN 37:01), Instituto Nicaragüense de Estudios Territoriales (INETER) continued to conduct fieldwork at Cerro Negro during 2012-2013 and reported that stable conditions prevailed except for a small seismic swarm detected in 2013.
INETER reported that from Cerro Negro's activity during 2012 was considered normal. Several significant landslides occurred that year, particularly from the S-SW interior rim of the primary crater. Seismicity was variable throughout the year with some interruptions of the signal (table 5).
Table 5. Seismicity was reported in INETER monthly reports during January-June 2012. Note that representative values are presented in the RSAM column (not mathematical averages) whereas the Max RSAM column contains the highest value recorded each month. There was a station outage during part of January. Courtesy of INETER.
| Month |
EQ Count |
RSAM |
Max RSAM |
Tremor (hours/day) |
| Jan 2012 |
43 |
~20 |
160 |
-- |
| Feb 2012 |
85 |
~20 |
80 |
3-18 |
| Mar 2012 |
76 |
~50 |
255 |
1-16 |
| Apr 2012 |
162 |
~20 |
50 |
1-15 |
| May 2012 |
111 |
12-30 |
65 |
some |
| Jun 2012 |
179 |
10-20 |
45 |
1 |
A gas measurement campaign was conducted within Cerro Negro's main crater in collaboration with the Instituto Tecnologicos de Energias Renovables (ITER) in late 2012. During the course of fieldwork, on 26 and 30 November, and 1 December, the team measured diffuse CO2 emissions from the soil at 219 points. The preliminary results showed normal levels, ~33 tons per day, compared to past results from this area.
Temperature measurements for 2012 were reported based on the four different fumarolic sites within the main crater (figure 20). The range varied between 50 and 325 degrees C.
Field investigations during March-June 2013 yielded additional observations of rockfalls and slides within the main crater. INETER also measured temperatures from the four fumarolic sites and concluded that steady conditions persisted (figure 20).
INETER reported a seismic swarm on 4 June 2013. RSAM had increased 60 units; 49 earthquakes were detected but were too small to be located. INETER maintained Alert Status Green and released informational statements to the media that described their response to the escalation and they also highlighted the potential of hazardous gas emissions for the area. The Sistema Nacional para Prevención, Mitigación y Atención de Desastres (SINAPRED) suggested that local residents and tourists in the area should be cautious around the flanks of Cerro Negro due to the possibility of rockfalls triggered by seismic events.
As a response to the increased seismicity that month, INETER conducted hot spring sampling and gas measuring campaigns in the area of Cerro Negro during 6-7 June. A team of fieldworkers focused on diffuse CO2 flux from the soil in a fault area on the W side of the Las Pilas-El Hoyo complex (SE of Cerro Negro, figure 15 in BGVN 37:01). The team took measurements 5 m apart at 91 points along a fault scarp, with depths of 11 and 40 cm within the soil; those measurements indicate an average flux of 59-80 ppm/s. No additional seismic unrest was reported during the month.
Geologic Background. Nicaragua's youngest volcano, Cerro Negro, was created following an eruption that began in April 1850 about 2 km NW of the summit of Las Pilas volcano. It is the largest, southernmost, and most recent of a group of four youthful cinder cones constructed along a NNW-SSE-trending line in the central Marrabios Range. Strombolian-to-subplinian eruptions at intervals of a few years to several decades have constructed a roughly 250-m-high basaltic cone and an associated lava field constrained by topography to extend primarily NE and SW. Cone and crater morphology have varied significantly during its short eruptive history. Although it lies in a relatively unpopulated area, occasional heavy ashfalls have damaged crops and buildings.
Information Contacts: Instituto Nicaragüense de Estudios Territoriales (INETER), Apartado Postal 2110, Managua, Nicaragua (URL: http://www.ineter.gob.ni/); Instituto Tecnológico y de Energías Renovables (ITER), 38611 Granadilla, Tenerife, Canary Islands, Spain (URL: http://www.iter.es/); Hoy: El Periodico que yo quiero, Managua, Nicaragua (URL: http://www.hoy.com.ni/2013/06/05/vigilan-al-volcán-cerro-negro/); and Sistema Nacional para Prevención, Mitigación y Atención de Desastres (SINAPRED), Managua, Nicaragua (URL: http://www.sinapred.gob.ni/).
Rabaul (Papua New Guinea) — October 2013 Cite this Report
Rabaul
Papua New Guinea
4.2459°S, 152.1937°E; summit elev. 688 m
All times are local (unless otherwise noted)
Variable but often modest eruptions during mid-2011 through 2013
The last Bulletin report on Rabaul Caldera (BGVN 36:07) recorded dozens of explosions in the first week of August 2011. The explosions produced ash-rich clouds that drifted NW and deposited ash in areas from Rabaul Town (3-5 km NW) to Nonga Village (10 km NW) (figure 57). This report covers activity from the end of August 2011 to December 2013, using data primarily compiled from the Rabaul Volcano Observatory (RVO) and the Darwin Volcanic Ash Advisory Center (VAAC). During this time, hundreds of small earthquakes were detected, almost all of which occurred congruently with ash emissions or explosions. One notable development occurred in July 2013, when a new lava dome formed on Tavurvur in the middle of a long period of eruptive activity running from April to September of the same year. Shortly after the dome's formation, strong venting of ash at Tavurvur gave way to explosions on 10 July that continued until 5 September, 2013. A second period of explosive activity began on 13 November, 2013, and terminated at the end of November.
August 2011 to November 2012. Rabaul Caldera was generally tranquil from 12 August 2011 to November 2012. During this time, only emissions of white vapor were seen rising from the cone, which became denser with the rain and humidity or periods of cool temperatures. Seismicity was low although several high frequency earthquakes NE of Tavurvur were recorded on 6 June 2012. GPS instruments recorded at least 2 cm of inflation (greater than the long-term decadal trend in inflation) and sub-continuous tremor was recorded by four local seismic stations 17-20 September 2011. Diffuse SO2 emissions recorded in late November 2012.
January and February 2013. At 2128 on 19 January 2013, Rabaul town residents and volcanologists at RVO heard loud rumbling and roaring noises from Tavurvur, marking the beginning of a period of activity that lasted until 2 February 2013 (table 12). RVO determined on the morning of 20 January that small discrete explosions had produced ash plumes during the night. Those plumes reached a maximum height of 500 m above the crater, and the prevailing winds pushed them E and SE.
Table 12.Maximum height above the crater, date, direction, and color for plumes from Tavurvur Cone from 19 January, 2013 to 7 February 2013. Seismicity during some of the events is also described. Courtesy of RVO.
| Date | Plume Height (m) | Direction | Color | Seismicity |
|---|
| 1/19 |
500 |
E, SE |
N/A |
N/A |
| 1/20 |
200 |
E, SE |
Light Gray |
N/A |
| 1/22 |
200 |
S, SSE |
Gray |
N/A |
| 1/22 (2148) |
2000 |
SE, ESE |
Gray |
N/A |
| 1/23 |
2000 |
SE |
Light Gray |
Numerous, associated with ash emissions |
| 1/24 |
1000 |
E, ESE |
Light Gray |
Numerous, associated with volcanic degassing |
| 1/25 |
700 |
E, ESE |
Light Gray |
Low, associated with ash emissions |
| 1/26 |
500 |
ESE |
Gray |
Low, associated with ash emissions |
| 1/27 |
500 |
ESE |
White and Light Gray |
Low, associated with ash emissions |
| 1/28 |
500 |
ESE |
White and Light Gray |
Low |
| 1/29 |
500 |
E, ESE |
Light Gray |
Low |
| 1/30 |
500 |
ESE |
Light Gray |
Low |
| 2/1 |
500 |
E, ESE |
Light Gray |
Low |
| 2/2 |
500 |
E, ESE |
Light Gray |
Low |
| 2/3 |
2000 |
E, NE |
Dark Gray |
Low, associated with ash emissions |
| 2/4 |
2000 |
E, SE |
Light Gray |
Low, associated with ash emissions |
| 2/5 |
2688 |
E, ENE |
Pale Gray |
Low, associated with ash emissions |
| 2/6 |
2000 |
NW |
Pale Gray |
Low, associated with ash emissions |
| 2/7 |
2000 |
NW |
Pale Gray |
Low, associated with ash emissions |
On 21 January at 0930, RVO noted an increase in emissions from Tavurvur consisting of mostly water vapor and low volumes of ash that created a plume ranging in color from white to light gray. The plume rose to a maximum height of 200 m and drifted SW. These conditions remained constant for the next 24 hours, except for a loud explosion and several minutes of roaring and rumbling at 2335 that night. The vegetation on the north side of South Daughter (also known as Turangunan, see figure 57) turned brown, suggesting the release of SO2 from the volcano.
Further increase in emissions was noted at 0930 on 22 January, and plumes rose to a maximum height of 200 m drifting to the SE. That night at 2147 a large explosion ejected both a light gray plume low in ash content and small amounts of incandescent spatter. Explosive noises were heard throughout the night and continued through 23 January. Both diffuse and dense ash plumes drifted SE. RVO remarked that calm meteorological conditions allowed the plume to ascend to a maximum altitude of 2,000 m. Activity at Tavurvur through 7 February was characterized by small-to-moderate explosions producing light-to-dark-gray ash clouds of low ash content and variable plume heights, constant white vapor, and low-to-moderate levels of roaring and rumbling. Ash affected areas downwind; ABC Australia Network News reported that the ash shut down New Britain airports until 31 January.
Ash fell on Turangunan on 3 February. On 5 February, the Darwin VAAC reported a pale gray plume that rose to 2,000 m altitude and drifted E and ENE. Very fine ash fell in Rabaul Town on 6 and 7 February due to a southeasterly wind blowing the plume NW from Tavurvur. There were no other affected areas.
March 2013. RVO recorded increased ash emissions on 3 March. Those emissions were brown and continued until 7 March. Volcanologists at RVO reported that the emissions increased over time throughout the latter part of 3 March and by 6 March were occurring nearly every minute. At the same time, many small earthquakes associated with ash emissions were detected. Four regional earthquakes were felt on 5 March at 1358, 1606, and 1621, and on 6 March at 1953. These earthquakes ranged from a magnitude of 5.1 to 5.4, originating SSE from Rabaul to the east of Wide Bay (see figure 57 for reference) at depths of 50-60 km. They were felt in Rabaul Town with intensities III - IV. RVO did not report any change in volcanic activity at this time. Earthquakes on 7 March occurred with instances of ash emissions, which had declined in frequency to once every few hours.
Tavurvur remained quiet until 12 March, when an explosion at 1108 expelled a dark gray-to-black billowing ash column for 40 minutes. Afterwards, emissions changed to billowing white ash clouds that rose 300 m and drifted SE.
April 2013 to September 2013. Activity at Tavurvur from 14 April until 9 July was characterized by ongoing roaring, rumbling, and diffuse to dense white plumes, including some occasionally laden with fine ash particles (table 13). Throughout the period, some low intensity earthquakes and some explosions were detected, which ejected ash clouds to variable heights. Many ash plumes were blown to the SE until 30 April, when the wind began blowing to the NW. As a result, downwind areas including Rabaul town experienced ashfall from 30 April to 9 September.
Table 13.Table describes the height, color, direction, and plume densities from Rabaul's Tavurvur cone as well as the areas affected by ash fall from 14 April to 5 September 2013. Note that towns referenced here can be found in figure 57. Courtesy of RVO and Darwin VAAC.
| Date |
Plume Height (m) |
Ash Color |
Direction |
Notes |
Areas affected by ash fall |
| 4/14 - 4/17 |
100 |
White |
SE |
diffuse to dense |
None |
| 4/18 |
5288 |
White |
35km E |
|
None |
| 4/19 - 4/23 |
100 |
White |
SE |
diffuse to dense |
None |
| 4/24 - 4/28 |
200 |
White |
SE |
diffuse to dense |
None |
| 4/29 - 5/16 |
200 |
White |
NW |
diffuse to dense |
Rabaul Town |
| 5/17 - 6/15 |
800 |
White |
NW to SE |
diffuse to dense |
Rabaul Town |
| 6/16 - 6/30 |
1000 |
White to Light Gray |
NW to SE |
diffuse to dense |
Rabaul Town |
| 7/1 - 7/9 |
2000 |
White to Gray |
NW |
diffuse to dense |
Rabaul Town |
| 7/10 -7/14 |
2000 |
Gray |
NW |
Moderate to dense |
Rabaul Town |
| 7/15 - 7/21 |
2000 |
Light to Pale Gray |
E, NNE, NW, W, SW, |
Energetic explosions, fine ashfall |
Between Nodup and Rapolo, Rabaul town |
| 7/22 - 7/31 |
2000 |
Light to Pale Gray |
E, NNE, NW, W, SW, |
Energetic explosions, fine ashfall |
Between Namanula and Malaguna No. 1, Rabaul Town, Malaguna No. 2, Vulcan Area |
| 8/1 - 8/24 |
1000 |
Pale Gray |
NW |
Forceful emissions |
east Old Rabaul, Namanula Hill, Nonga Area, Rabaul Town, Malaguna No. 1 |
| 8/29 |
1800 |
Pale Gray |
150 km NW |
Forceful emissions |
east Old Rabaul, Namanula Hill, Nonga Area, Rabaul Town, Malaguna No. 2 |
| 8/26 - 8/28 |
1000 |
Pale Gray |
NW |
Forceful emissions |
east Old Rabaul, Namanula Hill, Nonga Area, Rabaul Town, Malaguna No. 3 |
| 8/29 |
2100 |
Pale Gray |
40 km NW |
Forceful emissions |
east Old Rabaul, Namanula Hill, Nonga Area, Rabaul Town, Malaguna No. 4 |
| 8/30 - 8/31 |
1000 |
Pale Gray |
NW |
Forceful emissions |
east Old Rabaul, Namanula Hill, Nonga Area, Rabaul Town, Malaguna No. 5 |
| 9/1 - 9/5 |
50 |
Pale Gray |
NW |
Strong winds re-suspended old ash |
Rabaul Town, exposure low - moderate |
On 12 June 2013 a small lava dome, estimated to be 25-30 m high, began forming on the floor of Tavurvur. Photos taken that day appear as figures 58 and 59.
On 26 June, incandescence was observed at a vent on the dome and was associated with strong venting of steam and ash, which continued to 14 July.
A few discrete explosions occurred on 10 July, producing moderate to dense gray ash clouds. This low level eruptive activity persisted until 9 September, with energetic explosions producing mostly light-to-pale-gray ash clouds that drifted NW and affected areas downwind. The eruptions occurred at a varying range of intervals from ten's of seconds to hours.
From 14 April to 14 July, several small low-frequency earthquakes occurred. The majority of these were too small to be located, but time series data suggest that they originated near Tavurvur. In early July, a recently restored seismic station near Tavurvur confirmed that earthquakes were occurring beneath Tavurvur volcano. The station also detected smaller earthquakes that other seismic stations had not recorded. On 15 July, the level of seismicity increased, with events concurrent with ash emissions. On 1 August, seismicity increased and remained elevated until 9 September; seismic events continued to be associated with ash emissions.
Ground deformation during this entire period remained relatively stable, reflecting the long-term trend of uplift. On 11 May, the base station antenna broke, resulting in a loss of GPS data. Ground measurements using water tube tilt meters showed a slight inflation recorded at Matupit Island (see figure 57). Throughout the entire month of August, ground measurements showed slight deflation, but the long term inflation trend resumed beginning on 1 September.
During 1-5 September, RVO stated that "people in Rabaul town reported an odor reflective of chlorine. The substance that caused the odor is normal output of volcanic processes but an uncommon one. Its presence does not represent anything unusual or increase in volcanic activity."
September to November 2013. The Darwin VAAC observed one ash plume on 27 September 2013. The plume rose to an altitude of 2,400 m and drifted 110 km NE and NW. No other activity was recorded until mid- November.
On 13 November 2013, a moderate explosion at Tavurvur produced a dense, gray billowing plume of ash which rose 1000 m and blew NW. More explosions followed at irregular intervals, and continued until 18 November. Ash plumes from those explosions were blown E, SE, and NW at lower altitudes and rose to a maximum height of 1000 m. Between explosions, wisps of white vapor rose from the volcano. Large explosions occurred at 0738, 0851, 1308, and 1903 on 13 November, and the next day at 2044. RVO reported minor inflation at the center of the caldera. There was some roaring and rumbling, but seismicity was low with small low-frequency earthquakes occurring with explosions.
During 19-30 November, Tavurvur produced fewer explosions, accompanied by white to light gray emissions, and small traces of diffuse to dense white vapors were occasionally observed. Those plumes drifted E, SE, and NW at a maximum height of 1,000 m above the crater summit. Two small, high-frequency volcano-tectonic earthquakes were detected during 23-27 November and located NE of Tavurvur.
December 2013. Little activity occurred at Rabaul during December. Minor emissions of mainly diffuse, though occasionally dense, white vapor occurred. A blue tint to the emissions was reported on some days during the reporting periodThere were no audible noises except for two two moderate explosions at 1850 on 15 December and 0732 on 22 December. Neither explosion was ash rich. RVO noted a weak fluctuating glow visible at night on 31 December.
Geologic Background. The low-lying Rabaul caldera on the tip of the Gazelle Peninsula at the NE end of New Britain forms a broad sheltered harbor utilized by what was the island's largest city prior to a major eruption in 1994. The outer flanks of the asymmetrical shield volcano are formed by thick pyroclastic-flow deposits. The 8 x 14 km caldera is widely breached on the east, where its floor is flooded by Blanche Bay and was formed about 1,400 years ago. An earlier caldera-forming eruption about 7,100 years ago is thought to have originated from Tavui caldera, offshore to the north. Three small stratovolcanoes lie outside the N and NE caldera rims. Post-caldera eruptions built basaltic-to-dacitic pyroclastic cones on the caldera floor near the NE and W caldera walls. Several of these, including Vulcan cone, which was formed during a large eruption in 1878, have produced major explosive activity during historical time. A powerful explosive eruption in 1994 occurred simultaneously from Vulcan and Tavurvur volcanoes and forced the temporary abandonment of Rabaul city.
Information Contacts: Rabaul Volcano Observatory, Department of Mineral Policy and Geohazards Management, Volcanological Observatory Geohazards Management Division, P.O. Box 386, Kokopo, East New Britain Province, Papua New Guinea; and Darwin Volcanic Ash Advisory Centre (VAAC) (URL: http://www.bom.gov.au/info/vaac/); Nasa Earth Observatory (URL: http://earthobservatory.nasa.gov); and ABC Australia Network News (URL: http://www.abc.net.au/news-01-31/an-png-airport-reopens-after-volcano-forces-closure/4492838).