Recently Published Bulletin Reports
Erebus (Antarctica) Lava lake remains active; most thermal alerts recorded since 2019
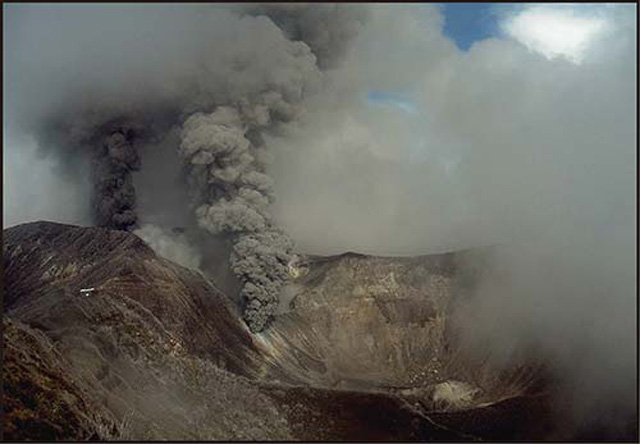
Rincon de la Vieja (Costa Rica) Frequent phreatic explosions during July-December 2023
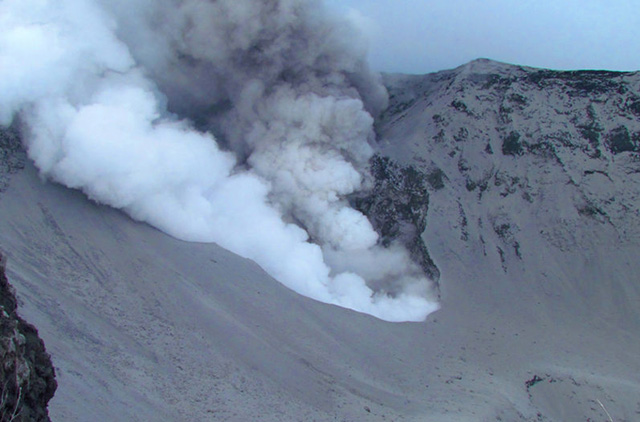
Bezymianny (Russia) Explosion on 18 October 2023 sends ash plume 8 km high; lava flows and incandescent avalanches
Kilauea (United States) Low-level lava effusions in the lava lake at Halema’uma’u during July-December 2022
Nyamulagira (DR Congo) Lava flows and thermal activity during May-October 2023
Bagana (Papua New Guinea) Explosions, ash plumes, ashfall, and lava flows during April-September 2023
Mayon (Philippines) Lava flows, pyroclastic flows, ash emissions, and seismicity during April-September 2023
Nishinoshima (Japan) Eruption plumes and gas-and-steam plumes during May-August 2023
Krakatau (Indonesia) White gas-and-steam plumes and occasional ash plumes during May-August 2023
Villarrica (Chile) Strombolian activity, gas-and-ash emissions, and crater incandescence during April-September 2023
Merapi (Indonesia) Frequent incandescent avalanches during April-September 2023
Ebeko (Russia) Moderate explosive activity with ash plumes continued during June-November 2023
Erebus (Antarctica) — January 2024  Cite this Report
Erebus
Antarctica
77.53°S, 167.17°E; summit elev. 3794 m
All times are local (unless otherwise noted)
Lava lake remains active; most thermal alerts recorded since 2019
The lava lake in the summit crater of Erebus has been active since at least 1972. Located in Antarctica overlooking the McMurdo Station on Ross Island, it is the southernmost active volcano on the planet. Because of the remote location, activity is primarily monitored by satellites. This report covers activity during 2023.
The number of thermal alerts recorded by the Hawai'i Institute of Geophysics and Planetology’s MODVOLC Thermal Alerts System increased considerably in 2023 compared to the years 2020-2022 (table 9). In contrast to previous years, the MODIS instruments aboard the Aqua and Terra satellites captured data from Erebus every month during 2023. Consistent with previous years, the lowest number of anomalous pixels were recorded in January, November, and December.
Table 9. Number of monthly MODIS-MODVOLC thermal alert pixels recorded at Erebus during 2017-2023. See BGVN 42:06 for data from 2000 through 2016. The table was compiled using data provided by the HIGP – MODVOLC Thermal Alerts System.
| Year |
Jan |
Feb |
Mar |
Apr |
May |
Jun |
Jul |
Aug |
Sep |
Oct |
Nov |
Dec |
SUM |
| 2017 |
0 |
21 |
9 |
0 |
0 |
1 |
11 |
61 |
76 |
52 |
0 |
3 |
234 |
| 2018 |
0 |
21 |
58 |
182 |
55 |
17 |
137 |
172 |
103 |
29 |
0 |
0 |
774 |
| 2019 |
2 |
21 |
162 |
151 |
55 |
56 |
75 |
53 |
29 |
19 |
1 |
0 |
624 |
| 2020 |
0 |
2 |
16 |
18 |
4 |
4 |
1 |
3 |
18 |
3 |
1 |
6 |
76 |
| 2021 |
0 |
9 |
1 |
0 |
2 |
56 |
46 |
47 |
35 |
52 |
5 |
3 |
256 |
| 2022 |
1 |
13 |
55 |
22 |
15 |
32 |
39 |
19 |
31 |
11 |
0 |
0 |
238 |
| 2023 |
2 |
33 |
49 |
82 |
41 |
32 |
70 |
64 |
42 |
17 |
5 |
11 |
448 |
Sentinel-2 infrared images showed one or two prominent heat sources within the summit crater, accompanied by adjacent smaller sources, similar to recent years (see BGVN 46:01, 47:02, and 48:01). A unique image was obtained on 25 November 2023 by the OLI-2 (Operational Land Imager-2) on Landsat 9, showing the upper part of the volcano surrounded by clouds (figure 32).
Geologic Background. Mount Erebus, the world's southernmost historically active volcano, overlooks the McMurdo research station on Ross Island. It is the largest of three major volcanoes forming the crudely triangular Ross Island. The summit of the dominantly phonolitic volcano has been modified by one or two generations of caldera formation. A summit plateau at about 3,200 m elevation marks the rim of the youngest caldera, which formed during the late-Pleistocene and within which the modern cone was constructed. An elliptical 500 x 600 m wide, 110-m-deep crater truncates the summit and contains an active lava lake within a 250-m-wide, 100-m-deep inner crater; other lava lakes are sometimes present. The glacier-covered volcano was erupting when first sighted by Captain James Ross in 1841. Continuous lava-lake activity with minor explosions, punctuated by occasional larger Strombolian explosions that eject bombs onto the crater rim, has been documented since 1972, but has probably been occurring for much of the volcano's recent history.
Information Contacts: Hawai'i Institute of Geophysics and Planetology (HIGP) - MODVOLC Thermal Alerts System, School of Ocean and Earth Science and Technology (SOEST), Univ. of Hawai'i, 2525 Correa Road, Honolulu, HI 96822, USA (URL: http://modis.higp.hawaii.edu/); Copernicus Browser, Copernicus Data Space Ecosystem, European Space Agency (URL: https://dataspace.copernicus.eu/browser/); NASA Earth Observatory, EOS Project Science Office, NASA Goddard Space Flight Center, Goddard, Maryland, USA (URL: https://earthobservatory.nasa.gov/images/152134/erebus-breaks-through).
Rincon de la Vieja (Costa Rica) — January 2024 Cite this Report
Rincon de la Vieja
Costa Rica
10.83°N, 85.324°W; summit elev. 1916 m
All times are local (unless otherwise noted)
Frequent phreatic explosions during July-December 2023
Rincón de la Vieja is a volcanic complex in Costa Rica with a hot convecting acid lake that exhibits frequent weak phreatic explosions, gas-and-steam emissions, and occasional elevated sulfur dioxide levels (BGVN 45:10, 46:03, 46:11). The current eruption period began June 2021. This report covers activity during July-December 2023 and is based on weekly bulletins and occasional daily reports from the Observatorio Vulcanologico Sismologica de Costa Rica-Universidad Nacional (OVSICORI-UNA).
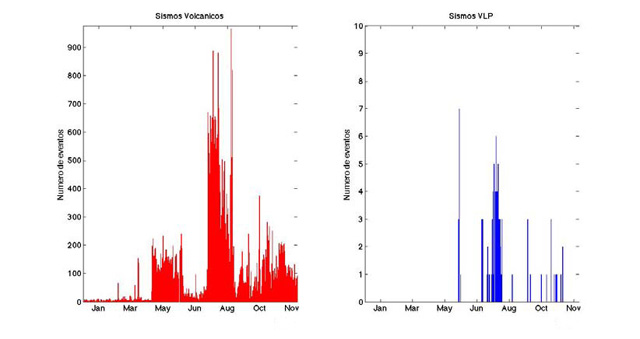
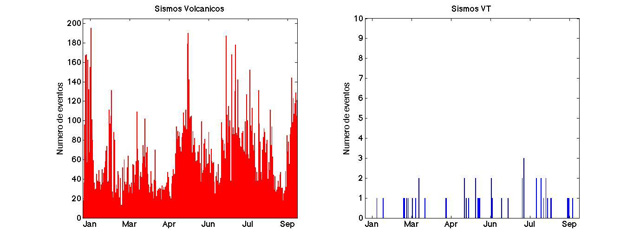
Numerous weak phreatic explosions continued during July-December 2023, along with gas-and-steam emissions and plumes that rose as high as 3 km above the crater rim. Many weekly OVSICORI-UNA bulletins included the previous week's number of explosions and emissions (table 9). For many explosions, the time of explosion was given (table 10). Frequent seismic activity (long-period earthquakes, volcano-tectonic earthquakes, and tremor) accompanied the phreatic activity.
Table 9. Number of reported weekly phreatic explosions and gas-and-steam emissions at Rincón de la Vieja, July-December 2023. Counts are reported for the week before the Weekly Bulletin date; not all reports included these data. Courtesy of OVSICORI-UNA.
| OVSICORI Weekly Bulletin |
Number of explosions |
Number of emissions |
| 28 Jul 2023 |
6 |
14 |
| 4 Aug 2023 |
10 |
12 |
| 1 Sep 2023 |
13 |
11 |
| 22 Sep 2023 |
12 |
13 |
| 29 Sep 2023 |
6 |
11 |
| 6 Oct 2023 |
12 |
5 |
| 13 Oct 2023 |
7 |
9 |
| 20 Oct 2023 |
1 |
15 |
| 27 Oct 2023 |
3 |
23 |
| 3 Nov 2023 |
3 |
10 |
| 17 Nov 2023 |
0 |
Some |
| 24 Nov 2023 |
0 |
14 |
| 8 Dec 2023 |
4 |
16 |
| 22 Dec 2023 |
8 |
18 |
Table 10. Summary of activity at Rincón de la Vieja during July-December 2023. Weak phreatic explosions and gas emissions are noted where the time of explosion was indicated in the weekly or daily bulletins. Height of plumes or emissions are distance above the crater rim. Courtesy of OVSICORI-UNA.
| Date |
Time |
Description of Activity |
| 1 Jul 2023 |
0156 |
Explosion. |
| 2 Jul 2023 |
0305 |
Explosion. |
| 4 Jul 2023 |
0229, 0635 |
Event at 0635 produced a gas-and-steam plume that rose 700 m and drifted W; seen by residents in Liberia (21 km SW). |
| 9 Jul 2023 |
1843 |
Explosion. |
| 21 Jul 2023 |
0705 |
Explosion. |
| 26 Jul 2023 |
1807 |
Explosion. |
| 28 Jul 2023 |
0802 |
Explosion generated a gas-and-steam plume that rose 500 m. |
| 30 Jul 2023 |
1250 |
Explosion. |
| 31 Jul 2023 |
2136 |
Explosion. |
| 11 Aug 2023 |
0828 |
Explosion. |
| 18 Aug 2023 |
1304 |
Explosion. |
| 21 Aug 2023 |
1224 |
Explosion generated gas-and-steam plumes rose 500-600 m. |
| 22 Aug 2023 |
0749 |
Explosion generated gas-and-steam plumes rose 500-600 m. |
| 24 Aug 2023 |
1900 |
Explosion. |
| 25 Aug 2023 |
0828 |
Event produced a steam-and-gas plume that rose 3 km and drifted NW. |
| 27-28 Aug 2023 |
0813 |
Four small events; the event at 0813 on 28 August lasted two minutes and generated a steam-and-gas plume that rose 2.5 km. |
| 1 Sep 2023 |
1526 |
Explosion generated plume that rose 2 km and ejected material onto the flanks. |
| 2-3 Sep 2023 |
- |
Small explosions detected in infrasound data. |
| 4 Sep 2023 |
1251 |
Gas-and-steam plume rose 1 km and drifted W. |
| 7 Nov 2023 |
1113 |
Explosion. |
| 8 Nov 2023 |
0722 |
Explosion. |
| 12 Nov 2023 |
0136 |
Small gas emissions. |
| 14 Nov 2023 |
0415 |
Small gas emissions. |
According to OVSICORI-UNA, during July-October the average weekly sulfur dioxide (SO2) flux ranged from 68 to 240 tonnes/day. However, in mid-November the flux increased to as high as 334 tonnes/day, the highest value measured in recent years. The high SO2 flux in mid-November was also detected by the TROPOMI instrument on the Sentinel-5P satellite (figure 43).
Geologic Background. Rincón de la Vieja, the largest volcano in NW Costa Rica, is a remote volcanic complex in the Guanacaste Range. The volcano consists of an elongated, arcuate NW-SE-trending ridge constructed within the 15-km-wide early Pleistocene Guachipelín caldera, whose rim is exposed on the south side. Sometimes known as the "Colossus of Guanacaste," it has an estimated volume of 130 km3 and contains at least nine major eruptive centers. Activity has migrated to the SE, where the youngest-looking craters are located. The twin cone of Santa María volcano, the highest peak of the complex, is located at the eastern end of a smaller, 5-km-wide caldera and has a 500-m-wide crater. A Plinian eruption producing the 0.25 km3 Río Blanca tephra about 3,500 years ago was the last major magmatic eruption. All subsequent eruptions, including numerous historical eruptions possibly dating back to the 16th century, have been from the prominent active crater containing a 500-m-wide acid lake located ENE of Von Seebach crater.
Information Contacts: Observatorio Vulcanológico Sismológica de Costa Rica-Universidad Nacional (OVSICORI-UNA), Apartado 86-3000, Heredia, Costa Rica (URL: http://www.ovsicori.una.ac.cr/); NASA Global Sulfur Dioxide Monitoring Page, Atmospheric Chemistry and Dynamics Laboratory, NASA Goddard Space Flight Center (NASA/GSFC), 8800 Greenbelt Road, Goddard MD 20771, USA (URL: https://so2.gsfc.nasa.gov/).
Bezymianny (Russia) — November 2023 Cite this Report
Bezymianny
Russia
55.972°N, 160.595°E; summit elev. 2882 m
All times are local (unless otherwise noted)
Explosion on 18 October 2023 sends ash plume 8 km high; lava flows and incandescent avalanches
Bezymianny, located on Russia’s Kamchatka Peninsula, has had eruptions since 1955 characterized by dome growth, explosions, pyroclastic flows, ash plumes, and ashfall. Activity during November 2022-April 2023 included gas-and-steam emissions, lava dome collapses generating avalanches, and persistent thermal activity. Similar eruptive activity continued from May through October 2023, described here based on information from weekly and daily reports of the Kamchatka Volcano Eruptions Response Team (KVERT), notices from Tokyo VAAC (Volcanic Ash Advisory Center), and from satellite data.
Overall activity decreased after the strong period of activity in late March through April 2023, which included ash explosions during 29 March and 7-8 April 2023 that sent plumes as high as 10-12 km altitude, along with dome growth and lava flows (BGVN 48:05). This reduced activity can be seen in the MIROVA thermal detection system graph (figure 56), which was consistent with data from the MODVOLC thermal detection system and with Sentinel-2 satellite images that showed persistent hotspots in the summit crater when conditions allowed observations. A renewed period of strong activity began in mid-October 2023.
Activity increased significantly on 17 October 2023 when large collapses began during 0700-0830 on the E flanks of the lava dome and continued to after 0930 the next day (figure 57). Ash plumes rose to an altitude of 4.5-5 km, extending 220 km NNE by 18 October. A large explosion at 1630 on 18 October produced an ash plume that rose to an altitude of 11 km (8 km above the summit) and drifted NNE and then NW, extending 900 km NW within two days at an altitude of 8 km. Minor ashfall was noted in Kozyrevsk (45 km WNW). At 0820 on 20 October an ash plume was identified in satellite images drifting 100 km ENE at altitudes of 4-4.5 km.
Lava flows and hot avalanches from the dome down the SE flank continued over the next few days, including 23 October when clear conditions allowed good observations (figures 58 and 59). A large thermal anomaly was observed over the volcano through 24 October, and in the summit crater on 30 October (figure 60). Strong fumarolic activity continued, with numerous avalanches and occasional incandescence. By the last week of October, volcanic activity had decreased to a level consistent with that earlier in the reporting period.
Aviation warnings were frequently updated during 17-20 October. KVERT issued a Volcano Observatory Notice for Aviation (VONA) on 17 October at 1419 and 1727 (0219 and 0527 UTC) raising the Aviation Color Code (ACC) from Yellow to Orange (second highest level). The next day, KVERT issued a VONA at 1705 (0505 UTC) raising the ACC to Red (highest level) but lowered it back to Orange at 2117 (0917 UTC). After another decrease to Yellow and back to Orange, the ACC was reduced to Yellow on 20 October at 1204 (0004 UTC). In addition, the Tokyo VAAC issued a series of Volcanic Ash Advisories beginning on 16 October and continuing through 30 October.
Geologic Background. The modern Bezymianny, much smaller than its massive neighbors Kamen and Kliuchevskoi on the Kamchatka Peninsula, was formed about 4,700 years ago over a late-Pleistocene lava-dome complex and an edifice built about 11,000-7,000 years ago. Three periods of intensified activity have occurred during the past 3,000 years. The latest period, which was preceded by a 1,000-year quiescence, began with the dramatic 1955-56 eruption. This eruption, similar to that of St. Helens in 1980, produced a large open crater that was formed by collapse of the summit and an associated lateral blast. Subsequent episodic but ongoing lava-dome growth, accompanied by intermittent explosive activity and pyroclastic flows, has largely filled the 1956 crater.
Information Contacts: Kamchatka Volcanic Eruptions Response Team (KVERT), Far Eastern Branch, Russian Academy of Sciences, 9 Piip Blvd., Petropavlovsk-Kamchatsky, 683006, Russia (URL: http://www.kscnet.ru/ivs/kvert/); Kamchatka Volcanological Station, Kamchatka Branch of Geophysical Survey, (KB GS RAS), Klyuchi, Kamchatka Krai, Russia (URL: http://volkstat.ru/); Tokyo Volcanic Ash Advisory Center (VAAC), 1-3-4 Otemachi, Chiyoda-ku, Tokyo 100-8122, Japan (URL: http://ds.data.jma.go.jp/svd/vaac/data/); Hawai'i Institute of Geophysics and Planetology (HIGP) - MODVOLC Thermal Alerts System, School of Ocean and Earth Science and Technology (SOEST), Univ. of Hawai'i, 2525 Correa Road, Honolulu, HI 96822, USA (URL: http://modis.higp.hawaii.edu/); MIROVA (Middle InfraRed Observation of Volcanic Activity), a collaborative project between the Universities of Turin and Florence (Italy) supported by the Centre for Volcanic Risk of the Italian Civil Protection Department (URL: http://www.mirovaweb.it/); Copernicus Browser, Copernicus Data Space Ecosystem, European Space Agency (URL: https://dataspace.copernicus.eu/browser/).chr
Kilauea (United States) — January 2023 Cite this Report
Kilauea
United States
19.421°N, 155.287°W; summit elev. 1222 m
All times are local (unless otherwise noted)
Low-level lava effusions in the lava lake at Halema’uma’u during July-December 2022
Kīlauea is the southeastern-most volcano in Hawaii and overlaps the E flank of the Mauna Loa volcano. Its East Rift Zone (ERZ) has been intermittently active for at least 2,000 years. An extended eruption period began in January 1983 and was characterized by open lava lakes and lava flows from the summit caldera and the East Rift Zone. During May 2018 magma migrated into the Lower East Rift Zone (LERZ) and opened 24 fissures along a 6-km-long NE-trending fracture zone that produced lava flows traveling in multiple directions. As lava emerged from the fissures, the lava lake at Halema'uma'u drained and explosions sent ash plumes to several kilometers altitude (BGVN 43:10).
The current eruption period started during September 2021 and has recently been characterized by lava effusions, spatter, and sulfur dioxide emissions in the active Halema’uma’u lava lake (BGVN 47:08). Lava effusions, some spatter, and sulfur dioxide emissions have continued during this reporting period of July through December 2022 using daily reports, volcanic activity notices, and abundant photo, map, and video data from the US Geological Survey's (USGS) Hawaiian Volcano Observatory (HVO).
Summary of activity during July-December 2022. Low-level effusions have continued at the western vent of the Halema’uma’u crater during July through early December 2022. Occasional weak ooze-outs (also called lava break outs) would occur along the margins of the crater floor. The overall level of the active lava lake throughout the reporting period gradually increased due to infilling, however it stagnated in mid-September (table 13). During September through November, activity began to decline, though lava effusions persisted at the western vent. By 9 December, the active part of the lava lake had completely crusted over, and incandescence was no longer visible.
Table 13. Summary of measurements taken during overflights at Kīlauea that show a gradual increase in the active lava lake level and the volume of lava effused since 29 September 2021. Lower activity was reported during September-October. Data collected during July-December 2022. Courtesy of HVO.
| Date: |
Level of the active lava lake (m): |
Cumulative volume of lava effused (million cubic meters): |
| 7 Jul 2022 |
130 |
95 |
| 19 Jul 2022 |
133 |
98 |
| 4 Aug 2022 |
136 |
102 |
| 16 Aug 2022 |
137 |
104 |
| 12 Sep 2022 |
143 |
111 |
| 5 Oct 2022 |
143 |
111 |
| 28 Oct 2022 |
143 |
111 |
Activity during July 2022. Lava effusions were reported from the western vent in the Halema’uma’u crater, along with occasional weak ooze-outs along the margins of the crater floor. The height of the lava lake was variable due to deflation-inflation tilt events; for example, the lake level dropped approximately 3-4 m during a summit deflation-inflation event reported on 1 July. Webcam images taken during the night of 6-12 July showed intermittent low-level spattering at the western vent that rose less than 10 m above the vent (figure 519). Measurements made during an overflight on 7 July indicated that the crater floor was infilled about 130 m and that 95 million cubic meters of lava had been effused since 29 September 2021. A single, relatively small lava ooze-out was active to the S of the lava lake. Around midnight on 8 July there were two brief periods of lava overflow onto the lake margins. On 9 July lava ooze-outs were reported near the SE and NE edges of the crater floor and during 10-11 July they occurred near the E, NE, and NW edges. On 16 July crater incandescence was reported, though the ooze-outs and spattering were not visible. On 18 July overnight webcam images showed incandescence in the western vent complex and two ooze-outs were reported around 0000 and 0200 on 19 July. By 0900 there were active ooze-outs along the SW edge of the crater floor. Measurements made from an overflight on 19 July indicated that the crater floor was infilled about 133 m and 98 million cubic meters of lava had erupted since 29 September 2021 (figure 520). On 20 July around 1600 active ooze-outs were visible along the N edge of the crater, which continued through the next day. Extensive ooze-outs occurred along the W margin during 24 July until 1900; on 26 July minor ooze-outs were noted along the N margin. Minor spattering was visible on 29 July along the E margin of the lake. The sulfur dioxide emission rates ranged 650-2,800 tons per day (t/d), the higher of which was measured on 8 July (figure 519).
Activity during August 2022. The eruption continued in the Halema’uma’u crater at the western vent. According to HVO the lava in the active lake remained at the level of the bounding levees. Occasional minor ooze-outs were observed along the margins of the crater floor. Strong nighttime crater incandescence was visible after midnight on 6 August over the western vent cone. During 6-7 August scattered small lava lobes were active along the crater floor and incandescence persisted above the western vent through 9 August. During 7-9 August HVO reported a single lava effusion source was active along the NW margin of the crater floor. Measurements from an overflight on 4 August indicated that the crater floor was infilled about 136 m total and that 102 million cubic meters of lava had been erupted since the start of the eruption. Lava breakouts were reported along the N, NE, E, S, and W margins of the crater during 10-16 August. Another overflight survey conducted on 16 August indicated that the crater floor infilled about 137 m and 104 million cubic meters of lava had been erupted since September 2021. Measured sulfur dioxide emissions rates ranged 1,150-2,450 t/d, the higher of which occurred on 8 August.
Activity during September 2022. During September, lava effusion continued from the western vent into the active lava lake and onto the crater floor. Intermittent minor ooze-outs were reported through the month. A small ooze-out was visible on the W crater floor margin at 0220 on 2 September, which showed decreasing surface activity throughout the day, but remained active through 3 September. On 3 September around 1900 a lava outbreak occurred along the NW margin of the crater floor but had stopped by the evening of 4 September. Field crews monitoring the summit lava lake on 9 September observed spattering on the NE margin of the lake that rose no higher than 10 m, before falling back onto the lava lake crust (figure 521). Overflight measurements on 12 September indicated that the crater floor was infilled a total of 143 m and 111 million cubic meters of lava had been erupted since September 2021. Extensive breakouts in the W and N part of the crater floor were reported at 1600 on 20 September and continued into 26 September. The active part of the lava lake dropped by 10 m while other parts of the crater floor dropped by several meters. Summit tiltmeters recorded a summit seismic swarm of more than 80 earthquakes during 1500-1800 on 21 September, which occurred about 1.5 km below Halema’uma’u; a majority of these were less than Mw 2. By 22 September the active part of the lava lake was infilled about 2 m. On 23 September the western vent areas exhibited several small spatter cones with incandescent openings, along with weak, sporadic spattering (figure 522). The sulfur dioxide emission rate ranged from 930 t/d to 2,000 t/d, the higher of which was measured on 6 September.
Activity during October 2022. Activity during October declined slightly compared to previous months, though lava effusions persisted from the western vent into the active lava lake and onto the crater floor during October (figure 523). Slight variations in the lava lake were noted throughout the month. HVO reported that around 0600 on 3 October the level of the lava lake has lowered slightly. Overflight measurements taken on 5 October indicated that the crater floor was infilled a total of about 143 m and that 111 million cubic meters of lava had been effused since September 2021. During 6-7 October the lake gradually rose 0.5 m. Sulfur dioxide measurements made on 22 October had an emission rate of 700 t/d. Another overflight taken on 28 October showed that there was little to no change in the elevation of the crater floor: the crater floor was infilled a total of 143 m and 111 million cubic meters of lava had erupted since the start of the eruption.
Activity during November 2022. Activity remained low during November, though HVO reported that lava from the western vent continued to effuse into the active lava lake and onto the crater floor throughout the month. The rate of sulfur dioxide emissions during November ranged from 300-600 t/d, the higher amount of which occurred on 9 November.
Activity during December 2022. Similar low activity was reported during December, with lava effusing from the western vent into the active lava lake and onto the crater floor. During 4-5 December the active part of the lava lake was slightly variable in elevation and fluctuated within 1 m. On 9 December HVO reported that lava was no longer erupting from the western vent in the Halema’uma’u crater and that sulfur dioxide emissions had returned to near pre-eruption background levels; during 10-11 December, the lava lake had completely crusted over, and no incandescence was visible (figure 524). Time lapse camera images covering the 4-10 December showed that the crater floor showed weak deflation and no inflation. Some passive events of crustal overturning were reported during 14-15 December, which brought fresh incandescent lava to the lake surface. The sulfur dioxide emission rate was approximately 200 t/d on 14 December. A smaller overturn event on 17 December and another that occurred around 0000 and into the morning of 20 December were also detected. A small seismic swarm was later detected on 30 December.
Geologic Background. Kilauea overlaps the E flank of the massive Mauna Loa shield volcano in the island of Hawaii. Eruptions are prominent in Polynesian legends; written documentation since 1820 records frequent summit and flank lava flow eruptions interspersed with periods of long-term lava lake activity at Halemaumau crater in the summit caldera until 1924. The 3 x 5 km caldera was formed in several stages about 1,500 years ago and during the 18th century; eruptions have also originated from the lengthy East and Southwest rift zones, which extend to the ocean in both directions. About 90% of the surface of the basaltic shield volcano is formed of lava flows less than about 1,100 years old; 70% of the surface is younger than 600 years. The long-term eruption from the East rift zone between 1983 and 2018 produced lava flows covering more than 100 km2, destroyed hundreds of houses, and added new coastline.
Information Contacts: Hawaiian Volcano Observatory (HVO), U.S. Geological Survey, PO Box 51, Hawai'i National Park, HI 96718, USA (URL: http://hvo.wr.usgs.gov/).
Nyamulagira (DR Congo) — November 2023 Cite this Report
Nyamulagira
DR Congo
1.408°S, 29.2°E; summit elev. 3058 m
All times are local (unless otherwise noted)
Lava flows and thermal activity during May-October 2023
Nyamulagira (also known as Nyamuragira) is a shield volcano in the Democratic Republic of Congo with the summit truncated by a small 2 x 2.3 km caldera with walls up to about 100 m high. Documented eruptions have occurred within the summit caldera, as well as from numerous flank fissures and cinder cones. The current eruption period began in April 2018 and has more recently been characterized by summit crater lava flows and thermal activity (BGVN 48:05). This report describes lava flows and variable thermal activity during May through October 2023, based on information from the Observatoire Volcanologique de Goma (OVG) and various satellite data.
Lava lake activity continued during May. The MIROVA (Middle InfraRed Observation of Volcanic Activity) system recorded moderate-to-strong thermal activity throughout the reporting period; activity was more intense during May and October and relatively weaker from June through September (figure 95). The MODVOLC thermal algorithm, detected a total of 209 thermal alerts. There were 143 hotspots detected during May, eight during June, nine during September, and 49 during October. This activity was also reflected in infrared satellite images, where a lava flow was visible in the NW part of the crater on 7 May and strong activity was seen in the center of the crater on 4 October (figure 96). Another infrared satellite image taken on 12 May showed still active lava flows along the NW margin of the crater. According to OVG lava effusions were active during 7-29 May and moved to the N and NW parts of the crater beginning on 9 May. Strong summit crater incandescence was visible from Goma (27 km S) during the nights of 17, 19, and 20 May (figure 97). On 17 May there was an increase in eruptive activity, which peaked at 0100 on 20 May. Notable sulfur dioxide plumes drifted NW and W during 19-20 May (figure 98). Drone footage acquired in partnership with the USGS (United States Geological Survey) on 20 May captured images of narrow lava flows that traveled about 100 m down the W flank (figure 99). Data from the Rumangabo seismic station indicated a decreasing trend in activity during 17-21 May. Although weather clouds prevented clear views of the summit, a strong thermal signature on the NW flank was visible in an infrared satellite image on 22 May, based on an infrared satellite image. On 28 May the lava flows on the upper W flank began to cool and solidify. By 29 May seismicity returned to levels similar to those recorded before the 17 May increase. Lava effusion continued but was confined to the summit crater; periodic crater incandescence was observed.
Low-level activity was noted during June through October. On 1 June OVG reported that seismicity remained at lower levels and that crater incandescence had been absent for three days, though infrared satellite imagery showed continued lava effusion in the summit crater. The lava flows on the flanks covered an estimated 0.6 km2. Satellite imagery continued to show thermal activity confined to the lava lake through October (figure 96), although no lava flows or significant sulfur dioxide emissions were reported.
Geologic Background. Africa's most active volcano, Nyamulagira (also known as Nyamuragira), is a massive high-potassium basaltic shield about 25 km N of Lake Kivu and 13 km NNW of the steep-sided Nyiragongo volcano. The summit is truncated by a small 2 x 2.3 km caldera that has walls up to about 100 m high. Documented eruptions have occurred within the summit caldera, as well as from the numerous flank fissures and cinder cones. A lava lake in the summit crater, active since at least 1921, drained in 1938, at the time of a major flank eruption. Recent lava flows extend down the flanks more than 30 km from the summit as far as Lake Kivu; extensive lava flows from this volcano have covered 1,500 km2 of the western branch of the East African Rift.
Information Contacts: Observatoire Volcanologique de Goma (OVG), Departement de Geophysique, Centre de Recherche en Sciences Naturelles, Lwiro, D.S. Bukavu, DR Congo; Hawai'i Institute of Geophysics and Planetology (HIGP) - MODVOLC Thermal Alerts System, School of Ocean and Earth Science and Technology (SOEST), Univ. of Hawai'i, 2525 Correa Road, Honolulu, HI 96822, USA (URL: http://modis.higp.hawaii.edu/); MIROVA (Middle InfraRed Observation of Volcanic Activity), a collaborative project between the Universities of Turin and Florence (Italy) supported by the Centre for Volcanic Risk of the Italian Civil Protection Department (URL: http://www.mirovaweb.it/); NASA Global Sulfur Dioxide Monitoring Page, Atmospheric Chemistry and Dynamics Laboratory, NASA Goddard Space Flight Center (NASA/GSFC), 8800 Greenbelt Road, Goddard, Maryland, USA (URL: https://so2.gsfc.nasa.gov/); Copernicus Browser, Copernicus Data Space Ecosystem, European Space Agency (URL: https://dataspace.copernicus.eu/browser/); Charles Balagizi, Goma Volcano Observatory, Departement de Geophysique, Centre de Recherche en Sciences Naturelles, Lwiro, D.S. Bukavu, DR Congo.
Bagana (Papua New Guinea) — October 2023 Cite this Report
Bagana
Papua New Guinea
6.137°S, 155.196°E; summit elev. 1855 m
All times are local (unless otherwise noted)
Explosions, ash plumes, ashfall, and lava flows during April-September 2023
The remote volcano of Bagana is located in central Bougainville Island, Papua New Guinea. Recorded eruptions date back to 1842 and activity has consisted of effusive activity that has built a small lava dome in the summit crater and occasional explosions that produced pyroclastic flows. The most recent eruption has been ongoing since February 2000 and has produced occasional explosions, ash plumes, and lava flows. More recently, activity has been characterized by ongoing effusive activity and ash emissions (BGVN 48:04). This report updates activity from April through September 2023 that has consisted of explosions, ash plumes, ashfall, and lava flows, using information from the Darwin Volcanic Ash Advisory Center (VAAC) and satellite data.
An explosive eruption was reported on 7 July that generated a large gas-and-ash plume to high altitudes and caused significant ashfall in local communities; the eruption plume had reached upper tropospheric (16-18 km altitude) altitudes by 2200, according to satellite images. Sulfur dioxide plumes were detected in satellite images on 8 July and indicated that the plume was likely a mixture of gas, ice, and ash. A report issued by the Autonomous Bougainville Government (ABG) (Torokina District, Education Section) on 10 July noted that significant ash began falling during 2000-2100 on 7 July and covered most areas in the Vuakovi, Gotana (9 km SW), Koromaketo, Laruma (25 km W) and Atsilima (27 km NW) villages. Pyroclastic flows also occurred, according to ground-based reports; small deposits confined to one drainage were inspected by RVO during an overflight on 17 July and were confirmed to be from the 7 July event. Ashfall continued until 10 July and covered vegetation, which destroyed bushes and gardens and contaminated rivers and streams.
RVO reported another eruption on 14 July. The Darwin VAAC stated that an explosive event started around 0830 on 15 July and produced an ash plume that rose to 16.5 km altitude by 1000 and drifted N, according to satellite images. The plume continued to drift N and remained visible through 1900, and by 2150 it had dissipated.
Ashfall likely from both the 7 and 15 July events impacted about 8,111 people in Torokina (20 km SW), including Tsito/Vuakovi, Gotana, Koromaketo, Kenaia, Longkogari, Kenbaki, Piva (13 km SW), and Atsinima, and in the Tsitovi district, according to ABG. Significant ashfall was also reported in Ruruvu (22 km N) in the Wakunai District of Central Bougainville, though the thickness of these deposits could not be confirmed. An evacuation was called for the villages in Wakunai, where heavy ashfall had contaminated water sources; the communities of Ruruvu, Togarau, Kakarapaia, Karauturi, Atao, and Kuritaturi were asked to evacuate to a disaster center at the Wakunai District Station, and communities in Torokina were asked to evacuate to the Piva District station. According to a news article, more than 7,000 people needed temporary accommodations, with about 1,000 people in evacuation shelters. Ashfall had deposited over a broad area, contaminating water supplies, affecting crops, and collapsing some roofs and houses in rural areas. Schools were temporarily shut down. Intermittent ash emissions continued through the end of July and drifted NNW, NW, and SW. Fine ashfall was reported on the coast of Torokina, and ash plumes also drifted toward Laruma and Atsilima.
A small explosive eruption occurred at 2130 on 28 July that ejected material from the crater vents, according to reports from Torokina, in addition to a lava flow that contained two lobes. A second explosion was detected at 2157. Incandescence from the lava flow was visible from Piva as it descended the W flank around 2000 on 29 July (figure 47). The Darwin VAAC reported that a strong thermal anomaly was visible in satellite images during 30-31 July and that ash emissions rose to 2.4 km altitude and drifted WSW on 30 July. A ground report from RVO described localized emissions at 0900 on 31 July.
The Darwin VAAC reported that ash plumes were identified in satellite imagery at 0800 and 1220 on 12 August and rose to 2.1 km and 3 km altitude and drifted NW and W, respectively. A news report stated that aid was sent to more than 6,300 people that were adversely affected by the eruption. Photos taken during 17-19 August showed ash emissions rising no higher than 1 km above the summit and drifting SE. A small explosion generated an ash plume during the morning of 19 August. Deposits from small pyroclastic flows were also captured in the photos. Satellite images captured lava flows and pyroclastic flow deposits. Two temporary seismic stations were installed near Bagana on 17 August at distances of 7 km WSW (Vakovi station) and 11 km SW (Kepox station). The Kepox station immediately started to record continuous, low-frequency background seismicity.
Satellite data. Little to no thermal activity was detected during April through mid-July 2023; only one anomaly was recorded during early April and one during early June, according to MIROVA (Middle InfraRed Observation of Volcanic Activity) data (figure 48). Thermal activity increased in both power and frequency during mid-July through September, although there were still some short gaps in detected activity. MODVOLC also detected increased thermal activity during August; thermal hotspots were detected a total of five times on 19, 20, and 27 August. Weak thermal anomalies were also captured in infrared satellite images on clear weather days throughout the reporting period on 7, 12, and 17 April, 27 May, 1, 6, 16, and 31 July, and 19 September (figure 48); a strong thermal anomaly was visible on 31 July. Distinct sulfur dioxide plumes that drifted generally NW were intermittently captured by the TROPOMI instrument on the Sentinel-5P satellite and sometimes exceeded two Dobson Units (DUs) (figure 49).
Geologic Background. Bagana volcano, in a remote portion of central Bougainville Island, is frequently active. This massive symmetrical cone was largely constructed by an accumulation of viscous andesitic lava flows. The entire edifice could have been constructed in about 300 years at its present rate of lava production. Eruptive activity is characterized by non-explosive effusion of viscous lava that maintains a small lava dome in the summit crater, although occasional explosive activity produces pyroclastic flows. Lava flows with tongue-shaped lobes up to 50 m thick and prominent levees descend the flanks on all sides.
Information Contacts: Rabaul Volcano Observatory (RVO), Geohazards Management Division, Department of Mineral Policy and Geohazards Management (DMPGM), PO Box 3386, Kokopo, East New Britain Province, Papua New Guinea; Darwin Volcanic Ash Advisory Centre (VAAC), Bureau of Meteorology, Northern Territory Regional Office, PO Box 40050, Casuarina, NT 0811, Australia (URL: http://www.bom.gov.au/info/vaac/); MIROVA (Middle InfraRed Observation of Volcanic Activity), a collaborative project between the Universities of Turin and Florence (Italy) supported by the Centre for Volcanic Risk of the Italian Civil Protection Department (URL: http://www.mirovaweb.it/); Hawai'i Institute of Geophysics and Planetology (HIGP) - MODVOLC Thermal Alerts System, School of Ocean and Earth Science and Technology (SOEST), Univ. of Hawai'i, 2525 Correa Road, Honolulu, HI 96822, USA (URL: http://modis.higp.hawaii.edu/); NASA Global Sulfur Dioxide Monitoring Page, Atmospheric Chemistry and Dynamics Laboratory, NASA Goddard Space Flight Center (NASA/GSFC), 8800 Greenbelt Road, Goddard, Maryland, USA (URL: https://so2.gsfc.nasa.gov/); Copernicus Browser, Copernicus Data Space Ecosystem, European Space Agency (URL: https://dataspace.copernicus.eu/browser/); Autonomous Bougainville Government, P.O Box 322, Buka, AROB, PNG (URL: https://abg.gov.pg/); Andrew Tupper (Twitter: @andrewcraigtupp); Simon Carn, Geological and Mining Engineering and Sciences, Michigan Technological University, 1400 Townsend Drive, Houghton, MI 49931, USA (URL: http://www.volcarno.com/, Twitter: @simoncarn); Radio NZ (URL: https://www.rnz.co.nz/news/pacific/494464/more-than-7-000-people-in-bougainville-need-temporary-accommodation-after-eruption); USAID, 1300 Pennsylvania Ave, NW, Washington DC 20004, USA (URL: https://www.usaid.gov/pacific-islands/press-releases/aug-08-2023-united-states-provides-immediate-emergency-assistance-support-communities-affected-mount-bagana-volcanic-eruptions).
Mayon (Philippines) — October 2023 Cite this Report
Mayon
Philippines
13.257°N, 123.685°E; summit elev. 2462 m
All times are local (unless otherwise noted)
Lava flows, pyroclastic flows, ash emissions, and seismicity during April-September 2023
Mayon is located in the Philippines and has steep upper slopes capped by a small summit crater. Historical eruptions date back to 1616 CE that have been characterized by Strombolian eruptions, lava flows, pyroclastic flows, and mudflows. Eruptions mostly originated from a central conduit. Pyroclastic flows and mudflows have commonly descended many of the approximately 40 drainages that surround the volcano. The most recent eruption occurred during June through October 2022 and consisted of lava dome growth and gas-and-steam emissions (BGVN 47:12). A new eruption was reported during late April 2023 and has included lava flows, pyroclastic density currents, ash emissions, and seismicity. This report covers activity during April through September 2023 based on daily bulletins from the Philippine Institute of Volcanology and Seismology (PHIVOLCS).
During April through September 2023, PHIVOLCS reported near-daily rockfall events, frequent volcanic earthquakes, and sulfur dioxide measurements. Gas-and-steam emissions rose 100-900 m above the crater and drifted in different directions. Nighttime crater incandescence was often visible during clear weather and was accompanied by incandescent avalanches of material. Activity notably increased during June when lava flows were reported on the S, SE, and E flanks (figure 52). The MIROVA graph (Middle InfraRed Observation of Volcanic Activity) showed strong thermal activity coincident with these lava flows, which remained active through September (figure 53). According to the MODVOLC thermal algorithm, a total of 110 thermal alerts were detected during the reporting period: 17 during June, 40 during July, 27 during August, and 26 during September. During early June, pyroclastic density currents (PDCs) started to occur more frequently.
Low activity was reported during much of April and May; gas-and-steam emissions rose 100-900 m above the crater and generally drifted in different directions. A total of 52 rockfall events and 18 volcanic earthquakes were detected during April and 147 rockfall events and 13 volcanic events during May. Sulfur dioxide flux measurements ranged between 400-576 tons per day (t/d) during April, the latter of which was measured on 29 April and between 162-343 t/d during May, the latter of which was measured on 13 May.
Activity during June increased, characterized by lava flows, pyroclastic density currents (PDCs), crater incandescence and incandescent rockfall events, gas-and-steam emissions, and continued seismicity. Weather clouds often prevented clear views of the summit, but during clear days, moderate gas-and-steam emissions rose 100-2,500 m above the crater and drifted in multiple directions. A total of 6,237 rockfall events and 288 volcanic earthquakes were detected. The rockfall events often deposited material on the S and SE flanks within 700-1,500 m of the summit crater and ash from the events drifted SW, S, SE, NE, and E. Sulfur dioxide emissions ranged between 149-1,205 t/d, the latter of which was measured on 10 June. Short-term observations from EDM and electronic tiltmeter monitoring indicated that the upper slopes were inflating since February 2023. Longer-term ground deformation parameters based on EDM, precise leveling, continuous GPS, and electronic tilt monitoring indicated that the volcano remained inflated, especially on the NW and SE flanks. At 1000 on 5 June the Volcano Alert Level (VAL) was raised to 2 (on a 0-5 scale). PHIVOLCS noted that although low-level volcanic earthquakes, ground deformation, and volcanic gas emissions indicated unrest, the steep increase in rockfall frequency may indicate increased dome activity.
A total of 151 dome-collapse PDCs occurred during 8-9 and 11-30 June, traveled 500-2,000 m, and deposited material on the S flank within 2 km of the summit crater. During 8-9 June the VAL was raised to 3. At approximately 1947 on 11 June lava flow activity was reported; two lobes traveled within 500 m from the crater and deposited material on the S (Mi-isi), SE (Bonga), and E (Basud) flanks. Weak seismicity accompanied the lava flow and slight inflation on the upper flanks. This lava flow remained active through 30 June, moving down the S and SE flank as far as 2.5 km and 1.8 km, respectively and depositing material up to 3.3 km from the crater. During 15-16 June traces of ashfall from the PDCs were reported in Sitio Buga, Nabonton, City of Ligao and Purok, and San Francisco, Municipality of Guinobatan. During 28-29 June there were two PDCs generated by the collapse of the lava flow front, which generated a light-brown ash plume 1 km high. Satellite monitors detected significant concentrations of sulfur dioxide beginning on 29 June. On 30 June PDCs primarily affected the Basud Gully on the E flank, the largest of which occurred at 1301 and lasted eight minutes, based on the seismic record. Four PDCs generated between 1800 and 2000 that lasted approximately four minutes each traveled 3-4 km on the E flank and generated an ash plume that rose 1 km above the crater and drifted N and NW. Ashfall was recorded in Tabaco City.
Similar strong activity continued during July; slow lava effusion remained active on the S and SE flanks and traveled as far as 2.8 km and 2.8 km, respectively and material was deposited as far as 4 km from the crater. There was a total of 6,983 rockfall events and 189 PDCs that affected the S, SE, and E flanks. The volcano network detected a total of 2,124 volcanic earthquakes. Continuous gas-and-steam emissions rose 200-2,000 m above the crater and drifted in multiple directions. Sulfur dioxide emissions averaged 792-4,113 t/d, the latter of which was measured on 28 July. During 2-4 July three PDCs were generated from the collapse of the lava flow and resulting light brown plumes rose 200-300 m above the crater. Continuous tremor pulses were reported beginning at 1547 on 3 July through 7 July at 1200, at 2300 on 8 July and going through 0300 on 10 July, and at 2300 on 16 July, as recorded by the seismic network. During 6-9 July there were 10 lava flow-collapse-related PDCs that generated light brown plumes 300-500 m above the crater. During 10-11 July light ashfall was reported in some areas of Mabinit, Legazpi City, Budiao and Salvacion, Daraga, and Camalig, Albay. By 18 July the lava flow advanced 600 m on the E flank as well.
During 1733 on 18 July and 0434 on 19 July PHIVOLCS reported 30 “ashing” events, which are degassing events accompanied by audible thunder-like sounds and entrained ash at the crater, which produced short, dark plumes that drifted SW. These events each lasted 20-40 seconds, and plume heights ranged from 150-300 m above the crater, as recorded by seismic, infrasound, visual, and thermal monitors. Three more ashing events occurred during 19-20 July. Short-term observations from electronic tilt and GPS monitoring indicate deflation on the E lower flanks in early July and inflation on the NW middle flanks during the third week of July. Longer-term ground deformation parameters from EDM, precise leveling, continuous GPS, and electronic tilt monitoring indicated that the volcano was still generally inflated relative to baseline levels. A short-lived lava pulse lasted 28 seconds at 1956 on 21 July, which was accompanied by seismic and infrasound signals. By 22 July, the only lava flow that remained active was on the SE flank, and continued to extend 3.4 km, while those on the S and E flanks weakened markedly. One ashing event was detected during 30-31 July, whereas there were 57 detected during 31 July-1 August; according to PHIVOLCS beginning at approximately 1800 on 31 July eruptive activity was dominated by phases of intermittent ashing, as well as increased in the apparent rates of lava effusion from the summit crater. The ashing phases consisted of discrete events recorded as low-frequency volcanic earthquakes (LFVQ) typically 30 seconds in duration, based on seismic and infrasound signals. Gray ash plume rose 100 m above the crater and generally drifted NE. Shortly after these ashing events began, new lava began to effuse rapidly from the crater, feeding the established flowed on the SE, E, and E flanks and generating frequent rockfall events.
Intensified unrest persisted during August. There was a total of 4,141 rockfall events, 2,881 volcanic earthquakes, which included volcanic tremor events, 32 ashing events, and 101 PDCs detected throughout the month. On clear weather days, gas-and-steam emissions rose 300-1,500 m above the crater and drifted in different directions (figure 54). Sulfur dioxide emissions averaged 735-4,756 t/d, the higher value of which was measured on 16 August. During 1-2 August the rate of lava effusion decreased, but continued to feed the flows on the SE, S, and E flanks, maintaining their advances to 3.4 km, 2.8 km, and 1.1 km from the crater, respectively (figure 55). Rockfall and PDCs generated by collapses at the lava flow margins and from the summit dome deposited material within 4 km of the crater. During 3-4 August there were 10 tremor events detected that lasted 1-4 minutes. Short-lived lava pulse lasted 35 seconds and was accompanied by seismic and infrasound signals at 0442 on 6 August. Seven collapses were recorded at the front of the lava flow during 12-14 August.
During September, similar activity of slow lava effusion, PDCs, gas-and-steam emissions, and seismicity continued. There was a total of 4,452 rockfall events, 329 volcanic earthquakes, which included volcanic tremor events, two ashing events, and 85 PDCs recorded throughout the month. On clear weather days, gas-and-steam emissions rose 100-1,500 m above the crater and drifted in multiple directions. Sulfur dioxide emissions averaged 609-2,252 t/d, the higher average of which was measured on 6 September. Slow lava effusion continued advancing on the SE, S, and E flanks, maintaining lengths of 3.4 km, 2.8 km, and 1.1 km, respectively. Rockfall and PDC events generated by collapses along the lava flow margins and at the summit dome deposited material within 4 km of the crater.
Geologic Background. Symmetrical Mayon, which rises above the Albay Gulf NW of Legazpi City, is the most active volcano of the Philippines. The steep upper slopes are capped by a small summit crater. Recorded eruptions since 1616 CE range from Strombolian to basaltic Plinian, with cyclical activity beginning with basaltic eruptions, followed by longer periods of andesitic lava flows. Eruptions occur predominately from the central conduit and have also produced lava flows that travel far down the flanks. Pyroclastic density currents and mudflows have commonly swept down many of the approximately 40 ravines that radiate from the summit and have often damaged populated lowland areas. A violent eruption in 1814 killed more than 1,200 people and devastated several towns.
Information Contacts: Philippine Institute of Volcanology and Seismology (PHIVOLCS), Department of Science and Technology, University of the Philippines Campus, Diliman, Quezon City, Philippines (URL: http://www.phivolcs.dost.gov.ph/); MIROVA (Middle InfraRed Observation of Volcanic Activity), a collaborative project between the Universities of Turin and Florence (Italy) supported by the Centre for Volcanic Risk of the Italian Civil Protection Department (URL: http://www.mirovaweb.it/); Hawai'i Institute of Geophysics and Planetology (HIGP) - MODVOLC Thermal Alerts System, School of Ocean and Earth Science and Technology (SOEST), Univ. of Hawai'i, 2525 Correa Road, Honolulu, HI 96822, USA (URL: http://modis.higp.hawaii.edu/); Copernicus Browser, Copernicus Data Space Ecosystem, European Space Agency (URL: https://dataspace.copernicus.eu/browser/); William Rogers, Legazpi City, Albay Province, Philippines.
Nishinoshima (Japan) — October 2023 Cite this Report
Nishinoshima
Japan
27.247°N, 140.874°E; summit elev. 100 m
All times are local (unless otherwise noted)
Eruption plumes and gas-and-steam plumes during May-August 2023
Nishinoshima, located about 1,000 km S of Tokyo, is a small island in the Ogasawara Arc in Japan. The island is the summit of a massive submarine volcano that has prominent submarine peaks to the S, W, and NE. Eruptions date back to 1973 and the current eruption period began in October 2022. Recent activity has consisted of small ash plumes and fumarolic activity (BGVN 48:07). This report covers activity during May through August 2023, using information from monthly reports of the Japan Meteorological Agency (JMA) monthly reports and satellite data.
Activity during May through June was relatively low. The Japan Coast Guard (JCG) did overflights on 14 and 22 June and reported white gas-and-steam emissions rising 600 m and 1,200 m from the central crater of the pyroclastic cone, respectively (figure 125). In addition, multiple white gas-and-steam emissions rose from the inner rim of the W side of the crater and from the SE flank of the pyroclastic cone. Discolored brown-to-green water was observed around almost the entire perimeter of the island; on 22 June light green discolored water was observed off the S coast of the island.
Observations from the Himawari meteorological satellite confirmed an eruption on 9 and 10 July. An eruption plume rose 1.6 km above the crater and drifted N around 1300 on 9 July. Satellite images acquired at 1420 and 2020 on 9 July and at 0220 on 10 July showed continuing emissions that rose 1.3-1.6 km above the crater and drifted NE and N. The Tokyo VAAC reported that an ash plume seen by a pilot and identified in a satellite image at 0630 on 21 July rose to 3 km altitude and drifted S.
Aerial observations conducted by JCG on 8 August showed a white-and-gray plume rising from the central crater of the pyroclastic cone, and multiple white gas-and-steam emissions were rising from the inner edge of the western crater and along the NW-SE flanks of the island (figure 126). Brown-to-green discolored water was also noted around the perimeter of the island.
Intermittent low-to-moderate power thermal anomalies were recorded in the MIROVA graph (Middle InfraRed Observation of Volcanic Activity), showing an increase in both frequency and power beginning in July (figure 127). This increase in activity coincides with eruptive activity on 9 and 10 July, characterized by eruption plumes. According to the MODVOLC thermal alert algorithm, one thermal hotspot was recorded on 20 July. Weak thermal anomalies were also detected in infrared satellite imagery, accompanied by strong gas-and-steam plumes (figure 128).
Geologic Background. The small island of Nishinoshima was enlarged when several new islands coalesced during an eruption in 1973-74. Multiple eruptions that began in 2013 completely covered the previous exposed surface and continued to enlarge the island. The island is the summit of a massive submarine volcano that has prominent peaks to the S, W, and NE. The summit of the southern cone rises to within 214 m of the ocean surface 9 km SSE.
Information Contacts: Japan Meteorological Agency (JMA), 1-3-4 Otemachi, Chiyoda-ku, Tokyo 100-8122, Japan (URL: http://www.jma.go.jp/jma/indexe.html); Tokyo Volcanic Ash Advisory Center (VAAC), 1-3-4 Otemachi, Chiyoda-ku, Tokyo 100-8122, Japan (URL: http://ds.data.jma.go.jp/svd/vaac/data/); MIROVA (Middle InfraRed Observation of Volcanic Activity), a collaborative project between the Universities of Turin and Florence (Italy) supported by the Centre for Volcanic Risk of the Italian Civil Protection Department (URL: http://www.mirovaweb.it/); Copernicus Browser, Copernicus Data Space Ecosystem, European Space Agency (URL: https://dataspace.copernicus.eu/browser/).
Krakatau (Indonesia) — October 2023 Cite this Report
Krakatau
Indonesia
6.1009°S, 105.4233°E; summit elev. 285 m
All times are local (unless otherwise noted)
White gas-and-steam plumes and occasional ash plumes during May-August 2023
Krakatau is located in the Sunda Strait between Java and Sumatra, Indonesia. Caldera collapse during the catastrophic 1883 eruption destroyed Danan and Perbuwatan cones and left only a remnant of Rakata. The post-collapse cone of Anak Krakatau (Child of Krakatau) was constructed within the 1883 caldera at a point between the former Danan and Perbuwatan cones; it has been the site of frequent eruptions since 1927. The current eruption period began in May 2021 and has recently consisted of Strombolian eruptions and ash plumes (BGVN 48:07). This report describes lower levels of activity consisting of ash and white gas-and-steam plumes during May through August 2023, based on information provided by the Indonesian Center for Volcanology and Geological Hazard Mitigation, referred to as Pusat Vulkanologi dan Mitigasi Bencana Geologi (PVMBG), MAGMA Indonesia, and satellite data.
Activity was relatively low during May and June. Daily white gas-and-steam emissions rose 25-200 m above the crater and drifted in different directions. Five ash plumes were detected at 0519 on 10 May, 1241 on 11 May, 0920 on 12 May, 2320 on 12 May, and at 0710 on 13 May, and rose 1-2.5 km above the crater and drifted SW. A webcam image taken on 12 May showed ejection of incandescent material above the vent. A total of nine ash plumes were detected during 6-11 June: at 1434 and 00220 on 6 and 7 June the ash plumes rose 500 m above the crater and drifted NW, at 1537 on 8 June the ash plume rose 1 km above the crater and drifted SW, at 0746 and at 0846 on 9 June the ash plumes rose 800 m and 3 km above the crater and drifted SW, respectively, at 0423, 1431, and 1750 on 10 June the ash plumes rose 2 km, 1.5 km, and 3.5 km above the crater and drifted NW, respectively, and at 0030 on 11 June an ash plume rose 2 km above the crater and drifted NW. Webcam images taken on 10 and 11 June at 0455 and 0102, respectively, showed incandescent material ejected above the vent. On 19 June an ash plume at 0822 rose 1.5 km above the crater and drifted SE.
Similar low activity of white gas-and-steam emissions and few ash plumes were reported during July and August. Daily white gas-and-steam emissions rose 25-300 m above the crater and drifted in multiple directions. Three ash plumes were reported at 0843, 0851, and 0852 on 20 July that rose 500-2,000 m above the crater and drifted NW.
The MIROVA (Middle InfraRed Observation of Volcanic Activity) graph of MODIS thermal anomaly data showed intermittent low-to-moderate power thermal anomalies during May through August 2023 (figure 140). Although activity was often obscured by weather clouds, a thermal anomaly was visible in an infrared satellite image of the crater on 12 May, accompanied by an eruption plume that drifted SW (figure 141).
Geologic Background. The renowned Krakatau (frequently mis-named as Krakatoa) volcano lies in the Sunda Strait between Java and Sumatra. Collapse of an older edifice, perhaps in 416 or 535 CE, formed a 7-km-wide caldera. Remnants of that volcano are preserved in Verlaten and Lang Islands; subsequently the Rakata, Danan, and Perbuwatan cones were formed, coalescing to create the pre-1883 Krakatau Island. Caldera collapse during the catastrophic 1883 eruption destroyed Danan and Perbuwatan, and left only a remnant of Rakata. This eruption caused more than 36,000 fatalities, most as a result of tsunamis that swept the adjacent coastlines of Sumatra and Java. Pyroclastic surges traveled 40 km across the Sunda Strait and reached the Sumatra coast. After a quiescence of less than a half century, the post-collapse cone of Anak Krakatau (Child of Krakatau) was constructed within the 1883 caldera at a point between the former Danan and Perbuwatan cones. Anak Krakatau has been the site of frequent eruptions since 1927.
Information Contacts: Pusat Vulkanologi dan Mitigasi Bencana Geologi (PVMBG, also known as Indonesian Center for Volcanology and Geological Hazard Mitigation, CVGHM), Jalan Diponegoro 57, Bandung 40122, Indonesia (URL: http://www.vsi.esdm.go.id/); MAGMA Indonesia, Kementerian Energi dan Sumber Daya Mineral (URL: https://magma.esdm.go.id/v1); MIROVA (Middle InfraRed Observation of Volcanic Activity), a collaborative project between the Universities of Turin and Florence (Italy) supported by the Centre for Volcanic Risk of the Italian Civil Protection Department (URL: http://www.mirovaweb.it/); Copernicus Browser, Copernicus Data Space Ecosystem, European Space Agency (URL: https://dataspace.copernicus.eu/browser/).
Villarrica (Chile) — October 2023 Cite this Report
Villarrica
Chile
39.42°S, 71.93°W; summit elev. 2847 m
All times are local (unless otherwise noted)
Strombolian activity, gas-and-ash emissions, and crater incandescence during April-September 2023
Villarrica, in central Chile, consists of a 2-km-wide caldera that formed about 3,500 years ago and is located at the base of the presently active cone at the NW margin of a 6-km-wide caldera. Historical eruptions eruptions date back to 1558 and have been characterized by mild-to-moderate explosive activity with occasional lava effusions. The current eruption period began in December 2014 and has recently consisted of nighttime crater incandescence, ash emissions, and seismicity (BGVN 48:04). This report covers activity during April through September 2023 and describes occasional Strombolian activity, gas-and-ash emissions, and nighttime crater incandescence. Information for this report primarily comes from the Southern Andes Volcano Observatory (Observatorio Volcanológico de Los Andes del Sur, OVDAS), part of Chile's National Service of Geology and Mining (Servicio Nacional de Geología y Minería, SERNAGEOMIN) and satellite data.
Seismicity during April consisted of long period (LP) events and tremor (TRE); a total of 9,413 LP-type events and 759 TR-type events were detected throughout the month. Nighttime crater incandescence persisted and was visible in the degassing column. Sulfur dioxide data was obtained using Differential Absorption Optical Spectroscopy Equipment (DOAS) that showed an average value of 1,450 ± 198 tons per day (t/d) during 1-15 April and 1,129 ± 201 t/d during 16-30 April, with a maximum daily value of 2,784 t/d on 9 April. Gas-and-steam emissions of variable intensities rose above the active crater as high as 1.3 km above the crater on 13 April. Strombolian explosions were not observed and there was a slight decrease in the lava lake level.
There were 14,123 LP-type events and 727 TR-type events detected during May. According to sulfur dioxide measurements taken with DOAS equipment, the active crater emitted an average value of 1,826 ± 482 t/d during 1-15 May and 912 ± 41 t/d during 16-30 May, with a daily maximum value of 5,155 t/d on 13 May. Surveillance cameras showed continuous white gas-and-steam emissions that rose as high as 430 m above the crater on 27 May. Nighttime incandescence illuminated the gas column less than 300 m above the crater rim was and no pyroclastic emissions were reported. A landslide was identified on 13 May on the E flank of the volcano 50 m from the crater rim and extending 300 m away; SERNAGEOMIN noted that this event may have occurred on 12 May. During the morning of 27 and 28 May minor Strombolian explosions characterized by incandescent ejecta were recorded at the crater rim; the last reported Strombolian explosions had occurred at the end of March.
Seismic activity during June consisted of five volcano-tectonic (VT)-type events, 21,606 LP-type events, and 2,085 TR-type events. The average value of sulfur dioxide flux obtained by DOAS equipment was 1,420 ± 217 t/d during 1-15 June and 2,562 ± 804 t/d, with a maximum daily value of 4,810 t/d on 17 June. White gas-and-steam emissions rose less than 480 m above the crater; frequent nighttime crater incandescence was reflected in the degassing plume. On 12 June an emission rose 100 m above the crater and drifted NNW. On 15 June one or several emissions resulted in ashfall to the NE as far as 5.5 km from the crater, based on a Skysat satellite image. Several Strombolian explosions occurred within the crater; activity on 15 June was higher energy and ejected blocks 200-300 m on the NE slope. Surveillance cameras showed white gas-and-steam emissions rising 480 m above the crater on 16 June. On 19 and 24 June low-intensity Strombolian activity was observed, ejecting material as far as 200 m from the center of the crater to the E.
During July, seismicity included 29,319 LP-type events, 3,736 TR-type events, and two VT-type events. DOAS equipment recorded two days of sulfur dioxide emissions of 4,220 t/d and 1,009 t/d on 1 and 13 July, respectively. Constant nighttime incandescence was also recorded and was particularly noticeable when accompanied by eruptive columns on 12 and 16 July. Minor explosive events were detected in the crater. According to Skysat satellite images taken on 12, 13, and 16 July, ashfall deposits were identified 155 m S of the crater. According to POVI, incandescence was visible from two vents on the crater floor around 0336 on 12 July. Gas-and-ash emissions rose as high as 1.2 km above the crater on 13 July and drifted E and NW. A series of gas-and-steam pulses containing some ash deposited material on the upper E flank around 1551 on 13 July. During 16-31 July, average sulfur dioxide emissions of 1,679 ± 406 t/d were recorded, with a maximum daily value of 2,343 t/d on 28 July. Fine ash emissions were also reported on 16, 17, and 23 July.
Seismicity persisted during August, characterized by 27,011 LP-type events, 3,323 TR-type events, and three VT-type events. The average value of sulfur dioxide measurements taken during 1-15 August was 1,642 ± 270 t/d and 2,207 ± 4,549 t/d during 16-31 August, with a maximum daily value of 3,294 t/d on 27 August. Nighttime crater incandescence remained visible in degassing columns. White gas-and-steam emissions rose 480 m above the crater on 6 August. According to a Skysat satellite image from 6 August, ash accumulation was observed proximal to the crater and was mainly distributed toward the E slope. White gas-and-steam emissions rose 320 m above the crater on 26 August. Nighttime incandescence and Strombolian activity that generated ash emissions were reported on 27 August.
Seismicity during September was characterized by five VT-type events, 12,057 LP-type events, and 2,058 TR-type events. Nighttime incandescence persisted. On 2 September an ash emission rose 180 m above the crater and drifted SE at 1643 (figure 125) and a white gas-and-steam plume rose 320 m above the crater. According to the Buenos Aires VAAC, periods of continuous gas-and-ash emissions were visible in webcam images from 1830 on 2 September to 0110 on 3 September. Strombolian activity was observed on 2 September and during the early morning of 3 September, the latter event of which generated an ash emission that rose 60 m above the crater and drifted 100 m from the center of the crater to the NE and SW. Ashfall was reported to the SE and S as far as 750 m from the crater. The lava lake was active during 3-4 September and lava fountaining was visible for the first time since 26 March 2023, according to POVI. Fountains captured in webcam images at 2133 on 3 September and at 0054 on 4 September rose as high as 60 m above the crater rim and ejected material onto the upper W flank. Sulfur dioxide flux of 1,730 t/d and 1,281 t/d was measured on 3 and 4 September, respectively, according to data obtained by DOAS equipment.
Strong Strombolian activity and larger gas-and-ash plumes were reported during 18-20 September. On 18 September activity was also associated with energetic LP-type events and notable sulfur dioxide fluxes (as high as 4,277 t/d). On 19 September Strombolian activity and incandescence were observed. On 20 September at 0914 ash emissions rose 50 m above the crater and drifted SSE, accompanied by Strombolian activity that ejected material less than 100 m SSE, causing fall deposits on that respective flank. SERNAGEOMIN reported that a Planet Scope satellite image taken on 20 September showed the lava lake in the crater, measuring 32 m x 35 m and an area of 0.001 km2. Several ash emissions were recorded at 0841, 0910, 1251, 1306, 1312, 1315, and 1324 on 23 September and rose less than 150 m above the crater. The sulfur dioxide flux value was 698 t/d on 23 September and 1,097 t/d on 24 September. On 24 September the Volcanic Alert Level (VAL) was raised to Orange (the third level on a four-color scale). SENAPRED maintained the Alert Level at Yellow (the middle level on a three-color scale) for the communities of Villarrica, Pucón (16 km N), Curarrehue, and Panguipulli.
During 24-25 September there was an increase in seismic energy (observed at TR-events) and acoustic signals, characterized by 1 VT-type event, 213 LP-type events, and 124 TR-type events. Mainly white gas-and-steam emissions, in addition to occasional fine ash emissions were recorded. During the early morning of 25 September Strombolian explosions were reported and ejected material 250 m in all directions, though dominantly toward the NW. On 25 September the average value of sulfur dioxide flux was 760 t/d. Seismicity during 25-30 September consisted of five VT-type events, 1,937 LP-type events, and 456 TR-type events.
During 25-29 September moderate Strombolian activity was observed and ejected material as far as the crater rim. In addition, ash pulses lasting roughly 50 minutes were observed around 0700 and dispersed ENE. During 26-27 September a TR episode lasted 6.5 hours and was accompanied by discrete acoustic signals. Satellite images from 26 September showed a spatter cone on the crater floor with one vent that measured 10 x 14 m and a smaller vent about 35 m NE of the cone. SERNAGEOMIN reported an abundant number of bomb-sized blocks up to 150 m from the crater, as well as impact marks on the snow, which indicated explosive activity. A low-altitude ash emission was observed drifting NW around 1140 on 28 September, based on webcam images. Between 0620 and 0850 on 29 September an ash emission rose 60 m above the crater and drifted NW. During an overflight taken around 1000 on 29 September scientists observed molten material in the vent, a large accumulation of pyroclasts inside the crater, and energetic degassing, some of which contained a small amount of ash. Block-sized pyroclasts were deposited on the internal walls and near the crater, and a distal ash deposit was also visible. The average sulfur dioxide flux measured on 28 September was 344 t/d. Satellite images taken on 29 September ashfall was deposited roughly 3 km WNW from the crater and nighttime crater incandescence remained visible. The average sulfur dioxide flux value from 29 September was 199 t/d. On 30 September at 0740 a pulsating ash emission rose 1.1 km above the crater and drifted NNW (figure 126). Deposits on the S flank extended as far as 4.5 km from the crater rim, based on satellite images from 30 September.
Infrared MODIS satellite data processed by MIROVA (Middle InfraRed Observation of Volcanic Activity) showed intermittent thermal activity during April through September, with slightly stronger activity detected during late September (figure 127). Small clusters of thermal activity were detected during mid-June, early July, early August, and late September. According to the MODVOLC thermal alert system, a total of four thermal hotspots were detected on 7 July and 3 and 23 September. This activity was also intermittently captured in infrared satellite imagery on clear weather days (figure 128).
Geologic Background. The glacier-covered Villarrica stratovolcano, in the northern Lakes District of central Chile, is ~15 km south of the city of Pucon. A 2-km-wide caldera that formed about 3,500 years ago is located at the base of the presently active, dominantly basaltic to basaltic andesite cone at the NW margin of a 6-km-wide Pleistocene caldera. More than 30 scoria cones and fissure vents are present on the flanks. Plinian eruptions and pyroclastic flows that have extended up to 20 km from the volcano were produced during the Holocene. Lava flows up to 18 km long have issued from summit and flank vents. Eruptions documented since 1558 CE have consisted largely of mild-to-moderate explosive activity with occasional lava effusion. Glaciers cover 40 km2 of the volcano, and lahars have damaged towns on its flanks.
Information Contacts: Servicio Nacional de Geología y Minería (SERNAGEOMIN), Observatorio Volcanológico de Los Andes del Sur (OVDAS), Avda Sta María No. 0104, Santiago, Chile (URL: http://www.sernageomin.cl/); Proyecto Observación Villarrica Internet (POVI) (URL: http://www.povi.cl/); Sistema y Servicio Nacional de Prevención y Repuesta Ante Desastres (SENAPRED), Av. Beauchef 1671, Santiago, Chile (URL: https://web.senapred.cl/); Buenos Aires Volcanic Ash Advisory Center (VAAC), Servicio Meteorológico Nacional-Fuerza Aérea Argentina, 25 de mayo 658, Buenos Aires, Argentina (URL: http://www.smn.gov.ar/vaac/buenosaires/inicio.php); MIROVA (Middle InfraRed Observation of Volcanic Activity), a collaborative project between the Universities of Turin and Florence (Italy) supported by the Centre for Volcanic Risk of the Italian Civil Protection Department (URL: http://www.mirovaweb.it/); Hawai'i Institute of Geophysics and Planetology (HIGP) - MODVOLC Thermal Alerts System, School of Ocean and Earth Science and Technology (SOEST), Univ. of Hawai'i, 2525 Correa Road, Honolulu, HI 96822, USA (URL: http://modis.higp.hawaii.edu/); Copernicus Browser, Copernicus Data Space Ecosystem, European Space Agency (URL: https://dataspace.copernicus.eu/browser/).
Merapi (Indonesia) — October 2023 Cite this Report
Merapi
Indonesia
7.54°S, 110.446°E; summit elev. 2910 m
All times are local (unless otherwise noted)
Frequent incandescent avalanches during April-September 2023
Merapi, located just north of the major city of Yogyakarta in central Java, Indonesia, has had activity within the last 20 years characterized by pyroclastic flows and lahars accompanying growth and collapse of the steep-sided active summit lava dome. The current eruption period began in late December 2020 and has more recently consisted of ash plumes, intermittent incandescent avalanches of material, and pyroclastic flows (BGVN 48:04). This report covers activity during April through September 2023, based on information from Balai Penyelidikan dan Pengembangan Teknologi Kebencanaan Geologi (BPPTKG), the Center for Research and Development of Geological Disaster Technology, a branch of PVMBG which specifically monitors Merapi. Additional information comes from the Pusat Vulkanologi dan Mitigasi Bencana Geologi (PVMBG, also known as Indonesian Center for Volcanology and Geological Hazard Mitigation, CVGHM), MAGMA Indonesia, the Darwin Volcanic Ash Advisory Centre (VAAC), and various satellite data.
Activity during April through September 2023 primarily consisted of incandescent avalanches of material that mainly affected the SW and W flanks and traveled as far as 2.3 km from the summit (table 25) and white gas-and-steam emissions that rose 10-1,000 m above the crater.
Table 25. Monthly summary of avalanches and avalanche distances recorded at Merapi during April through September 2023. The number of reported avalanches does not include instances where possible avalanches were heard but could not be visually confirmed as a result of inclement weather. Data courtesy of BPPTKG (April-September 2023 daily reports).
| Month |
Average number of avalanches per day |
Distance avalanches traveled (m) |
| Apr 2023 |
19 |
1,200-2,000 |
| May 2023 |
22 |
500-2,000 |
| Jun 2023 |
18 |
1,200-2,000 |
| Jul 2023 |
30 |
300-2,000 |
| Aug 2023 |
25 |
400-2,300 |
| Sep 2023 |
23 |
600-2,000 |
BPPTKG reported that during April and May white gas-and-steam emissions rose 10-750 m above the crater, incandescent avalanches descended 500-2,000 m on the SW and W flanks (figure 135). Cloudy weather often prevented clear views of the summit, and sometimes avalanches could not be confirmed. According to a webcam image, a pyroclastic flow was visible on 17 April at 0531. During the week of 28 April and 4 May a pyroclastic flow was reported on the SW flank, traveling up to 2.5 km. According to a drone overflight taken on 17 May the SW lava dome volume was an estimated 2,372,800 cubic meters and the dome in the main crater was an estimated 2,337,300 cubic meters.
During June and July similar activity persisted with white gas-and-steam emissions rising 10-350 m above the crater and frequent incandescent avalanches that traveled 300-2,000 m down the SW, W, and S flanks (figure 136). Based on an analysis of aerial photos taken on 24 June the volume of the SW lava dome was approximately 2.5 million cubic meters. A pyroclastic flow was observed on 5 July that traveled 2.7 km on the SW flank. According to the Darwin VAAC multiple minor ash plumes were identified in satellite images on 19 July that rose to 3.7 km altitude and drifted S and SW. During 22, 25, and 26 July a total of 17 avalanches descended as far as 1.8 km on the S flank.
Frequent white gas-and-steam emissions continued during August and September, rising 10-450 m above the crater. Incandescent avalanches mainly affected the SW and W flanks and traveled 400-2,300 m from the vent (figure 137). An aerial survey conducted on 10 August was analyzed and reported that estimates of the SW dome volume was 2,764,300 cubic meters and the dome in the main crater was 2,369,800 cubic meters.
Frequent and moderate-power thermal activity continued throughout the reporting period, according to a MIROVA (Middle InfraRed Observation of Volcanic Activity) analysis of MODIS satellite data (figure 138). There was an increase in the number of detected anomalies during mid-May. The MODVOLC thermal algorithm recorded a total of 47 thermal hotspots: six during April, nine during May, eight during June, 15 during July, four during August, and five during September. Some of this activity was captured in infrared satellite imagery on clear weather days, sometimes accompanied by incandescent material on the SW flank (figure 139).
Geologic Background. Merapi, one of Indonesia's most active volcanoes, lies in one of the world's most densely populated areas and dominates the landscape immediately north of the major city of Yogyakarta. It is the youngest and southernmost of a volcanic chain extending NNW to Ungaran volcano. Growth of Old Merapi during the Pleistocene ended with major edifice collapse perhaps about 2,000 years ago, leaving a large arcuate scarp cutting the eroded older Batulawang volcano. Subsequent growth of the steep-sided Young Merapi edifice, its upper part unvegetated due to frequent activity, began SW of the earlier collapse scarp. Pyroclastic flows and lahars accompanying growth and collapse of the steep-sided active summit lava dome have devastated cultivated lands on the western-to-southern flanks and caused many fatalities.
Information Contacts: Balai Penyelidikan dan Pengembangan Teknologi Kebencanaan Geologi (BPPTKG), Center for Research and Development of Geological Disaster Technology (URL: http://merapi.bgl.esdm.go.id/, Twitter: @BPPTKG); MAGMA Indonesia, Kementerian Energi dan Sumber Daya Mineral (URL: https://magma.esdm.go.id/v1); Pusat Vulkanologi dan Mitigasi Bencana Geologi (PVMBG, also known as Indonesian Center for Volcanology and Geological Hazard Mitigation, CVGHM), Jalan Diponegoro 57, Bandung 40122, Indonesia (URL: http://www.vsi.esdm.go.id/); Darwin Volcanic Ash Advisory Centre (VAAC), Bureau of Meteorology, Northern Territory Regional Office, PO Box 40050, Casuarina, NT 0811, Australia (URL: http://www.bom.gov.au/info/vaac/); MIROVA (Middle InfraRed Observation of Volcanic Activity), a collaborative project between the Universities of Turin and Florence (Italy) supported by the Centre for Volcanic Risk of the Italian Civil Protection Department (URL: http://www.mirovaweb.it/); Hawai'i Institute of Geophysics and Planetology (HIGP) - MODVOLC Thermal Alerts System, School of Ocean and Earth Science and Technology (SOEST), Univ. of Hawai'i, 2525 Correa Road, Honolulu, HI 96822, USA (URL: http://modis.higp.hawaii.edu/); Copernicus Browser, Copernicus Data Space Ecosystem, European Space Agency (URL: https://dataspace.copernicus.eu/browser/); Øystein Lund Andersen (URL: https://www.oysteinlundandersen.com/, https://twitter.com/oysteinvolcano).
Ebeko
Russia
50.686°N, 156.014°E; summit elev. 1103 m
All times are local (unless otherwise noted)
Moderate explosive activity with ash plumes continued during June-November 2023
Ebeko, located on the N end of Paramushir Island in Russia’s Kuril Islands just S of the Kamchatka Peninsula, consists of three summit craters along a SSW-NNE line at the northern end of a complex of five volcanic cones. Observed eruptions date back to the late 18th century and have been characterized as small-to-moderate explosions from the summit crater, accompanied by intense fumarolic activity. The current eruptive period began in June 2022, consisting of frequent explosions, ash plumes, and thermal activity (BGVN 47:10, 48:06). This report covers similar activity during June-November 2023, based on information from the Kamchatka Volcanic Eruptions Response Team (KVERT) and satellite data.
Moderate explosive activity continued during June-November 2023 (figures 50 and 51). According to visual data from Severo-Kurilsk, explosions sent ash 2-3.5 km above the summit (3-4.5 km altitude) during most days during June through mid-September. Activity after mid-September was slightly weaker, with ash usually reaching less than 2 km above the summit. According to KVERT the volcano in October and November was, with a few exceptions, either quiet or obscured by clouds that prevented satellite observations. KVERT issued Volcano Observatory Notices for Aviation (VONA) on 8 and 12 June, 13 and 22 July, 3 and 21 August, and 31 October warning of potential aviation hazards from ash plumes drifting 3-15 km from the volcano. Based on satellite data, KVERT reported a persistent thermal anomaly whenever weather clouds permitted viewing.
Geologic Background. The flat-topped summit of the central cone of Ebeko volcano, one of the most active in the Kuril Islands, occupies the northern end of Paramushir Island. Three summit craters located along a SSW-NNE line form Ebeko volcano proper, at the northern end of a complex of five volcanic cones. Blocky lava flows extend west from Ebeko and SE from the neighboring Nezametnyi cone. The eastern part of the southern crater contains strong solfataras and a large boiling spring. The central crater is filled by a lake about 20 m deep whose shores are lined with steaming solfataras; the northern crater lies across a narrow, low barrier from the central crater and contains a small, cold crescentic lake. Historical activity, recorded since the late-18th century, has been restricted to small-to-moderate explosive eruptions from the summit craters. Intense fumarolic activity occurs in the summit craters, on the outer flanks of the cone, and in lateral explosion craters.
Information Contacts: Kamchatka Volcanic Eruptions Response Team (KVERT), Far Eastern Branch, Russian Academy of Sciences, 9 Piip Blvd., Petropavlovsk-Kamchatsky, 683006, Russia (URL: http://www.kscnet.ru/ivs/kvert/).
Search Bulletin Archive by Publication Date
Select a month and year from the drop-downs and click "Show Issue" to have that issue displayed in this tab.
The default month and year is the latest issue available.
Bulletin of the Global Volcanism Network - Volume 40, Number 04 (April 2015)
Managing Editor: Richard Wunderman
Pavlof (United States)
Spatter-fed lava interacting with ice, spawning clastogenic lava flows, lahars, and pyroclastic flows
Tangkuban Parahu (Indonesia)
West Java volcano issues very small eruption in March 2013; months of tremor and few volcanic earthquakes
Tofua (Tonga)
Five thermal alerts detected, 28 September-30 June 2015
Turrialba (Costa Rica)
29 October 2014 magmatic eruption, the first such event in 150 years
Pavlof (United States) — April 2015 Cite this Report
Pavlof
United States
55.417°N, 161.894°W; summit elev. 2493 m
All times are local (unless otherwise noted)
Spatter-fed lava interacting with ice, spawning clastogenic lava flows, lahars, and pyroclastic flows
This report discusses Pavlof's behavior during May 2014 through 26 December 2014, a time period with two clear eruptive intervals that included lava fountaining, spatter, fragmental (agglutinate-rich, clastogenic) lava flows, lahars, pyroclastic flows, and diverse plumes. On 30 May 2014, an eruption began that continued intermittently through the first week of June. A thermal image taken from a satellite on 24 June 2014 showed warm areas ~5 km down the N flank interpreted as the signature of an earlier, still-warm lava flow. (This flow was perhaps similar to (fountain- and spatter-fed, fragmental, agglutinate-rich, clastogenic) lava flows and possible associated lahars seen during 2013; Waythomas and others, 2014; Wolf and Sumner, 2000.) Another eruption took placed during 12-16 November 2014. Besides the previously mentioned characteristics, common observations during eruptions included strombolian emissions, multiple-kilometer-long zones of incandescent lava, plumes ranging from those dominated by steam and gas to others that were rich in ash. Diagnostics from distant instruments included acoustical signals of eruption received with infrasonics and lightning from inferred ash plumes detected with a lightning detection array.
Background. In BGVN 38:05 we reported on the then most recent eruption at Pavlof, which occurred during May-June 2013. Waythomas and others (2014) summarized Pavlof's eruptive behavior during 2013. This is relevant, in part, because similar ice-spatter interactions also prevailed during 2014. "The 2013 eruption of Pavlof Volcano, Alaska began on13 May and ended 49 days later on 1 July. The eruption was characterized by persistent lava fountaining from a vent just north of the summit, intermittent strombolian explosions, and ash, gas, and aerosol plumes that reached as high as 8 km above sea level and on several occasions extended as much as 500 km downwind of the volcano. During the first several days of the eruption, accumulations of spatter near the vent periodically collapsed to form small pyroclastic avalanches that eroded and melted snow and ice to form lahars on the lower north flank of the volcano. Continued lava fountaining led to the production of clastogenic lava flows that extended to the base of the volcano, about 3–4 km beyond the vent. The generation of fountain-fed lava flows was a dominant process during the 2013 eruption; however, episodic collapse of spatter accumulations and formation of hot spatter-rich granular avalanches was a more efficient process for melting snow and ice and initiating lahars. The lahars and ash plumes generated during the eruption did not pose any serious hazards for the area. However, numerous local airline flights were cancelled or rerouted, and trace amounts of ash fall occurred at all of the local communities surrounding the volcano, including Cold Bay, Nelson Lagoon, Sand Point, and King Cove."
The reports by the AVO also announced Volcano Alert Levels and Aviation Color Codes. The four Alert Levels apply to conditions in vicinity to the volcano (of greatest concern to residents). The Levels consist of Normal, typical background or noneruptive state; Advisory, exhibiting signs of unrest or possible renewed increase; Watch, exhibiting escalating or heightened unrest; and Warning, hazardous eruption is eminent or underway. The respective Color Codes address risks to aircraft from ash plumes. The Codes consist, in increasing order of concern, Green, Yellow, Orange, and Red.
Pavlof is monitored by satellite imagery, observers, several in-situ and remote instruments, and by a Federal Aviation Administration (FAA) web camera. Figure 9 shows Pavlof as seen from the FAA web camera, which resides in Cold Bay. The photo shows conditions on a clear day when the volcano was quiet. The camera produces still images sometimes used to convey the volcano's behavior ('FAA supplementary weather products').
Eruption of 30 May to 4 June 2014. The AVO weekly report issued on 6 June 2014 summarized conditions during the 30 May-4 June eruption period as follows: "Pavlof Volcano is experiencing a typical Strombolian eruption, characterized by lava fountaining, minor explosions, and the accumulation of spatter on the upper north flank of the volcano. Accumulations of spatter have occasionally built up and collapsed, forming hot, ashy, particle-rich flows that generate high-rising steam plumes on the lower north flank of the volcano. As these flows interact with ice and snow on the volcano, they produce meltwater and steam plumes. Spatter-fed lava flows also are likely forming".
According to AVO's 6 June 2014 weekly summary, Pavlof began erupting on 30 May 2014. On the morning of 31 May 2014 elevated surface temperatures were detected at the summit of Pavlof, suggesting a low-level eruption with extruding lava. Campers near the volcano confirmed this detection, and noted lava flows originating from a vent on the NE flank. As those lava flows interacted with glacier ice, low-altitude ash clouds and plumes were created. The plumes were detected in satellite imagery, as well as by pilots and with the Cold Bay FAA web camera.
On the evening of 31 May 2014, small explosion signals were detected by a distant infrasound sensor. The eruption continued, followed by incandescence. The FAA web camera in Cold Bay detected weak incandescence glowing at the summit on the evenings of 31 May and 1 June. Clouds obscured views of the volcano by web camera although no ash clouds were detected in satellite imagery. Weak seismic activity was detected on the Pavlof network of seismometers near the volcano. An increase of seismic tremor occurred 2 June at 1500, decreasing around 2300 that evening (Alaska Standard Time = UTC - 9 hours; during May-June, Daylight Saving Time = UTC - 8 hours). The Aviation Color Code and Alert Levels on 31 May were Orange and Watch respectively.
On 2 June 2014, AVO reported a plume discharged almost continuously from the vent rising to an altitude of 6.7 km and extending over 75 km E, as seen in figure 10. The AVO daily report for this eruption stated "Hazardous conditions exist on the north flank and north side drainages heading on the volcano due to continued pyroclastic and lahar activity. Ash in the vicinity of the volcano remains a hazard to local air traffic" (figure 10).
The AVO photo archive for 2 June contained over 40 photos with captions. Some were taken from Cold Bay and others from at sea and aircraft, documenting eruptive activity that day. Chris Waythomas (AVO) noted incandescence associated with lava fountaining and low-level ash and steam plume on images caught by the FAA camera. Several photos by Rachael Kremer were captioned by AVO scientists. The caption of one image (ID #591161 written by Game McGimsey, AVO/USGS) not only described incandescence from lava fountaining at the summit vent, it also stated the presence of "spatter-fed lava flowing down the N flank." Further, "ash and steam clouds rising from lower on the north flank were likely generated by pyroclastic flows intermixing with glacier ice."
AVO daily reports issued on 2 and 3 June 2014 described a vigorous continuing eruption. Late on the 2nd, tremor increased again. During the night included observers noted intense lava fountaining and a spatter fed lava flow down the N flank. By the morning of the 3rd, and ash and steam plumes rose up to 7.3 km altitude. The AVO report issued at 1233 on the 3rd noted a wind shift and wind at the time of that report carrying the main plume SSW. Lower winds (below ~3 km altitude) carried a plume that may have contained trace ash to the WSW.
The AVO report issued at 1754 on the 3rd made these statements: "Although the eruption of Pavlof continues, seismic tremor has deceased over the past 12 hours and has remained relatively steady throughout the day at a much lower level than that of yesterday. Recent satellite data and web camera views of the eruption plume indicate that there are now two distinct parts of the plume. The part of the plume that reaches high above the volcano appears to be mainly steam and gas with minor ash present, extending south of the volcano. Additionally, pyroclastic flow activity on the north flank is producing diffuse ash emissions that result in areas of hazy air, with variable concentrations of ash below [~3 km]. Low-level winds are likely to disperse this ash to the west-southwest with no more than trace amounts accumulating. There are no reports of ash falling in nearby communities." The Aviation Color Code was reduced from Red to Orange and the Alert Level to Watch. Ash remained a hazard to local air traffic.
Similar conditions prevailed on 4 June, with plumes containing minor ash but rich in sulfur dioxide extending 30 to 100 km downwind over Cold Bay. Although incandescence was visible in early morning web cam images, seismicity had remained stable for the past 24 hours. Incandescence from lava fountaining was visible in webcam images on 4 June. According to a news article, flights in and out of Cold Bay and Unalaska were canceled on 4 June, affecting about 200 people. At 0205 and 0245 on 5 June 2014, seismic data indicated two distinct explosions. AVO inferred these represented the collapse of spatter built up around the vent, with a possible explosive component. A similar third, less energetic, event occurred at 0844. The explosions generated lightning, which was detected by the World Wide Lightning Location Network (WWLLN, a collaboration of over 50 universities) (Morton, 2014). AVO inferred that hot debris moved down the N flank, resulting in localized low-level clouds of fine ash. There was no ash above the meteorological clouds whose tops reached 8.8 km in height. As of 6 June 2014, elevated surface temperatures persisted but cited that on this morning they had observed greatly diminished ash and lava emissions. Steam or ash plumes were absent in satellite images since 4 June. A weekly summary issued on 6th noted plumes during the eruption that started on the evening of 30 May 2014 had reached about 9.1 km in altitude. Seismic data indicated lahars occurred intermittently.
Comparative quiet. During 7-23 June 2014, Pavlof was comparatively quiet. Although extreme temperatures associated with fountaining were not seen, a thermal image of Pavlof on 24 June 2014 suggested broad areas of warm temperatures from what AVO interpreted as a recent lava flow (figure 11). According to the scientist who prepared the image, David Schneider, "Composite satellite image of Pavlof Volcano showing the extent of the lava flows on the northeast flank. The base image was collected by the Worldview-2 satellite on May 9, 2014 (prior to the onset of eruptive activity) and is overlain (in color) with a Landsat-8 thermal infrared image collected early in the morning on June 24, 2014. The thermal infrared sensor measured the heat given off by the still-warm lava flow. The length of the longest branch of the lava flow is about 5 km (3 miles). Note that the lava flow appears to have traveled under the ice on the upper flank of the volcano."
An AVO Notification issued on the 25th indicated that AVO had observed no evidence of ash emission from the volcano since early June. Clear web camera and satellite images of the volcano over the past several days showed no evidence of continued lava fountaining. The Aviation Color Code was reduced to Yellow and the Volcano Alert Level was reduced to Advisory. AVO further added that small discrete seismic events continued. They suggested that the signals may have been related to several processes including, (1) degassing of unerupted magma within the volcano's conduit and (2) periodic collapse of ejecta and other debris down the steep flanks of the volcano. The latter, appears consistent with the lava flow seen on figure 11.
On 30 July 2014 the Color Code was lowered to Green and the Volcano Alert Level to Normal. Since mid-June, levels of unrest had gradually declined. Rockfalls and small avalanches of debris still occurred sporadically on the NNW flank of volcano. The next eruptive event did not occur until 12 November.
Eruption of 12-16 November 2014. As previously mentioned, an eruption occurred during 12-16 November 2014. On 12 November 2014, AVO reported a ground observer in Cold Bay sighted ash emissions from Pavlof rising to an altitude of 2.7 km, signifying a new eruption. Minor ash emissions were visible in the Cold Bay web camera beginning around 1650 Alaska Standard Time (AKST) on 12 November. AVO raised the Aviation Color Code and Volcano Alert Level at 1957 on 12 November. Tremor remained elevated on the 12th, 13th, and 14th, with lava fountaining and ash emissions. On 14 November satellite imagery revealed a narrow ash plume extending ~200 km at 4.8 km altitude.
On 15 November 2014, AVO reported the eruption of had intensified. Thus, the Aviation Color Code was raised to Red and the Volcano Alert Level to Warning. Behavior was characterized by explosive eruptions, lava fountaining from a vent just N of the summit, and flows of rock debris and ash descending the N flank of the volcano. Ash emissions were observed from the ground and in satellite images. The intensity of seismic tremor had increased significantly, and satellite data indicated the ash cloud top at 7.6 km altitude extending 200 km NW from the vent. Figure 12 shows a Landsat 8 image captured on the 15th. The top of an ash plume in the image had reached an altitude of ~9 km. Another satellite image taken the same day showed ash plume above cloud cover and extending ~300 km NW from the volcano.
Although as mentioned above, on 15 November 2014, the ash plume reached more than 9 km, tremor had abruptly decreased at about 1900 that day. This was accompanied by a large decrease in ash emissions, and the next day no evidence of an ash plume at the volcano was reported. On the 16th, the Aviation Color Code decreased to Orange and the Volcano Alert Level to Watch. During 17-18 November seismicity remained low; surface temperatures on the upper NW flank were elevated. The AVO weekly report issued on 21 November 2014 described the week's activity as still remaining low. Intermittent tremor was detected, and satellite images still showed lava flow on the volcano's NW flank. At that stage it reached ~7 km from the summit. On 25 November 2014, AVO further lowered the Aviation Color Code/Volcano Alert Level to Yellow/Advisory, citing continued low seismicity and lack of any observations to suggest ongoing lava fountaining or ash emission. According to the last AVO weekly report issued on 26 December 2014, the status of Pavlof remained unchanged. Seismicity at Pavlof continued slightly above background levels. Weather conditions continued to be cloudy during the week and no activity was observed in satellite or web camera views of the volcano.
References. Demas, A., (3 June) 2014, Volcano Warning Alert Issued for Alaska's Pavlof Volcano, U.S. Geological Survey [accessed August 2014] (URL: http://www.usgs.gov/blogs/features/usgs_top_story/volcano-warning-alert-issued-for-alaskas-pavlof-volcano/ ). [accessed August 2014]
Morton, M, (6 April) 2014, Volcanic Lightning Generated in a Bottle, Earth Magazine (URL: http://www.earthmagazine.org/article/volcanic-lightning-generated-bottle)
Schwaiger, H.F., Denlinger, R.P., and Mastin, L.G., April 2012, Ash3d: A finite-volume, conservative numerical model for ash transport and tephra deposition. Journal of Geophysical Research, v. 117, Issue B4, 20 p.[accessed August 2014] (URL: http://onlinelibrary.wiley.com/doi/10.1029/2011JB008968/pdf).
Schwartz, D., (11 August) 2013, Ash3D is Federal Answer to Ash Cloud Response, Peninsula Clarion [accessed August 2014] (URL: http://peninsulaclarion.com/news/2013-08-10).
Waythomas, C. F., Haney, M. M., Fee, D., Schneider, D. J., and Wech, A., 2014, The 2013 eruption of Pavlof Volcano, Alaska: a spatter eruption at an ice-and snow-clad volcano. Bulletin of Volcanology, 76(10), pp. 1-12.
Wolff, J. A., & Sumner, J. M. (2000). Lava fountains and their products. Encyclopedia of volcanoes, H Sigurdsson, B Houghton, S McNutt, H Rymer, J Stix (Eds.); pp. 321-329.
Geologic Background. The most active volcano of the Aleutian arc, Pavlof is a Holocene stratovolcano that was constructed along a line of vents extending NE from the Emmons Lake caldera. Pavlof and Pavlof Sister to the NE form a dramatic pair of symmetrical, glacier-covered stratovolcanoes that overlook Pavlof and Volcano bays. Little Pavlof is a smaller cone on the SW flank of Pavlof volcano, near the rim of Emmons Lake caldera. Unlike Pavlof Sister, eruptions have frequently been reported from Pavlof, typically Strombolian to Vulcanian explosive eruptions from the summit vents and occasional lava flows. The active vents lie near the summit on the north and east sides. The largest recorded eruption took place in 1911, at the end of a 5-year-long eruptive episode, when a fissure opened on the N flank, ejecting large blocks and issuing lava flows.
Information Contacts: Alaska Volcano Observatory (AVO), a cooperative program of a) U.S. Geological Survey, 4200 University Drive, Anchorage, AK 99508-4667 USA (URL: http://www.avo.alaska.edu/), b) Geophysical Institute, University of Alaska, PO Box 757320,Fairbanks, AK 99775-7320, USA, and c) Alaska Division of Geological & Geophysical Surveys,794 University Ave., Suite 200, Fairbanks, AK 99709, USA (URL: http://www.dggs.alaska.gov/); Christopher Waythomas, Game McGimsey, and Cheryl Cameron, AVO; Rachel Kremer (affiliation unknown); Federal Aviation Administration (FAA), 800 Independence Ave, SW, Washington, DC 20591, USA (URL: http://www.faa.gov/); and National Aeronautics and Space Administration (NASA) (URL: http://modis.gsfc.nasa.gov/).
Tangkuban Parahu (Indonesia) — April 2015 Cite this Report
Tangkuban Parahu
Indonesia
6.77°S, 107.6°E; summit elev. 2084 m
All times are local (unless otherwise noted)
West Java volcano issues very small eruption in March 2013; months of tremor and few volcanic earthquakes
Tangkubanparahu (Tankuban Parahu) erupted multiple times during the interval of reporting from February 2013 through December 2014. The eruptions were from Ratu crater and of quite small size (highest reported plumes only rose to 100 m tall). The vent grew in size as a result of these eruptions, reaching in early March 2013 a diameter of 20 m. The small eruptions contained minor ash but did not emit a dome or lava flows and accordingly did not lead to thermal anomalies detected via the MODVOLC satellite-based infrared detection system (and this is the case going back to at least the year 2010).
In past reports during the past few decades, Tangkubanparahu has largely been quiet but with occasional tremor and volcanic earthquakes (eg., late August-October 2002, 12-19 April 2005, and August-September 2012; BGVN 27:09, 28:08, 30:12, and 37:11). The location of the volcano in Java is shown in figure 1 of BGVN 37:11.
According to the Center of Volcanology and Geological Hazard Mitigation (CVGHM, also known as Pusat Vulkanologi dan Mitigasi Bencana Geologi, PVMBG), tremor increased on 21 February 2013 and diffuse ash emissions rose from Ratu Crater. Based on the seismicity, visual observations, and temperature increases of the land around the crater, CVGHM raised the Alert Level to 2 (on a scale of 1-4) and visitors were reminded not to approach the crater within a radius of 1.5 km.
CVGHM reported that phreatic eruptions from Tangkubanparahu's Ratu Crater occurred on 28 February and during 4-6 March 2013, and generated ash plumes that rose up to 100 m above the crater.
A news report (kompas.com) quoted CVGHM as stating that the March explosion was much stronger than the one on 21 February 2013. The news report said that the 6 March eruption lasted for ~8 minutes. The Jakarta Post also said that the 6 March eruption lasted ~8 minutes and ejected ash about 30 m above Ratu Crater. The Jakarta Post reported that on 18 March, CVGHM lowered the Alert Level to 1 (normal) because of a significant decrease in the tremor frequency. The article also quoted CVGHM as stating that deformation, using a Global Positioning System (GPS) and Electronic Distance Measurement (EDM), found at one or more stations a decline in relative elevation from 6.84 cm to a few millimeters by 18 March. Deflation was again detected from 24 February through early March 2013, but was stable during 7-14 March 2013.
According to CVGHM, sulfur dioxide emissions increased to 5.3 metric tons per day (t/d) on 24 February 2013, decreased through 3 March 2013 to 2.1 t/d, and then increased again during 5-9 March 2013 to 4.9 t/d. CVGHM speculated that the increase was due to an enlargement of the eruptive vent, which had grown to a diameter of 20 m.
Gas emissions decreased abruptly on 10 March 2013 to 2.1 t/d and emission sounds stopped. On 4 March 2013, a new solfatara vent opened, but SO2 levels could not be measured on that day because of weather conditions.
On 5 October 2013, a phreatic eruption occurred, causing CVHGM to raise the Alert Level to 2. Figure 2 is an image of Ratu Crater.
CVGHM reported that during November-December 2014 white plumes rose up to 50 m above Ratu Crater. Deformation occurred and seismicity increased. On 31 December the Alert level rose to 2 (on a scale of 1-4), cautioning people to remain at least 1.5 km from the crater.
Seismicity. The CVGHM report discussing late 2014 features a plot of seismic data during December 2012 through December 2014, which the authors termed significant, the chief observation prompting a rise in alert level (to II).
Tremor was most prominent beginning mid-2013 to early March 2014. Both low-frequency and hybrid earthquakes were nearly absent except during a short sequence in late 2014 (each with over 100 earthquakes; see table below). Type-B earthquakes were common at levels from a few to ten events per 20-day interval, and like the low-frequency and hybrid earthquakes, peaked in latest December 2014 (~50 type-B events). Type-A earthquakes showed little or no tendency to cluster and remained below 5 events per 20 day interval and on many days they were absent.
Table 3 indicates the types and frequencies of seismic activity at Tangkubanparahu during selected, mostly active periods during 2013. Shallow volcanic earthquakes predominated during many of these periods. The number of tremor was high during the first week of March 2013, but significantly declined thereafter. The 25 September 2013-5 October 2013 period contained somewhat elevated seismicity, yet apparently lacked significant eruptive activity. Note the emergence of 513 low-frequency earthquakes during 1-31 December 2014 (lower right). That data is in the same year-end report (issued in early 2014 and written in Indonesian) and is also noteworthy in terms of the plot of distance (EDM) data to various reflectors around the crater during the entire year of 2013.
Table 3. A compilation of earthquake counts and tremor durations recorded at Tangkubanparahu for selected periods during 2012-2014. Definitions: -- signifies no data (presumably no episodes); VA, volcanic type-A earthquake; VB, type B (shallow volcanic earthquake); TJ, deep tectonic earthquake; BQ, an earthquake indicative of emissions; and TL, local tectonic earthquake. Courtesy of CVGHM.
| Date (day or days) |
VA |
VB |
TJ |
BQ |
TL |
Tremor (amplitude, duration) |
Other data & kinds of earthquakes (EQs) |
| 22 Jun 2012-28 Feb 2013 |
5 |
20 |
2 |
4 |
2 |
13 (2-45 mm, 3-92 min) |
Phreatic eruption on 21 Feb |
| 1-6 Mar 2013 |
14 |
32 |
2 |
41 |
-- |
19 (2-30 mm, 3-92 min) |
4 eruptions during period (6-35 mm, 7-13 min) |
| 7-13 Mar 2013 |
2 |
25 |
4 |
6 |
-- |
2 |
No tremor 8-18 Mar |
| 14-18 Mar 2013 |
1 |
14 |
5 |
-- |
-- |
0 |
-- |
| 25-30 Sep 2013 |
6 |
26 |
8 |
-- |
1 |
1 |
-- |
| 1-5 Oct 2013 |
-- |
13 |
7 |
1 |
-- |
2 |
-- |
| 21 Oct 2013 |
-- |
4 |
1 |
-- |
-- |
Continuous (amp. 1-3 mm, 12 hr) |
-- |
| 22 Oct 2013 |
-- |
13 |
1 |
-- |
-- |
1 |
1 Low freq earthquake |
| 23 Oct 2013 |
1 |
12 |
7 |
1 |
-- |
3 |
1 Low freq earthquake |
| 24 Oct 2013 |
2 |
9 |
2 |
5 |
-- |
-- |
-- |
| 25 Oct 2013 |
-- |
6 |
4 |
1 |
-- |
2 (0.5-1 mm, less than 2 min) |
-- |
| 26 Oct 2013 |
1 |
7 |
4 |
-- |
-- |
1 (0.5-1 mm, less than 2 min) |
-- |
| 27 Oct 2013 (partial) |
-- |
1 |
1 |
-- |
-- |
-- |
-- |
| 1-31 Oct 2014 |
9 |
126 |
45 |
50 |
12 |
10 cases |
6 low-frequency EQs, |
| 1-30 Nov |
6 |
146 |
35 |
185 |
6 |
-- |
8 low-frequency EQs; 14 tornillo EQs |
| 1-31 Dec 2014 |
10 |
352 |
41 |
22 |
6 |
-- |
1 tornillo EQ; 513 low-frequency EQs |
Geologic Background. Gunung Tangkuban Parahu is a broad stratovolcano overlooking Indonesia's former capital city of Bandung. The volcano was constructed within the 6 x 8 km Pleistocene Sunda caldera, which formed about 190,000 years ago. The volcano's low profile is the subject of legends referring to the mountain of the "upturned boat." The Sunda caldera rim forms a prominent ridge on the western side; elsewhere the rim is largely buried by deposits of the current volcano. The dominantly small phreatic eruptions recorded since the 19th century have originated from several nested craters within an elliptical 1 x 1.5 km summit depression.
Information Contacts: Center of Volcanology and Geological Hazard Mitigation (CVGHM) (URL: http:proxy.vsi.esdm.go.id/index.php); kompas.com (URL: kompas.com); and The Jakarta Post (URL: http://www.thejakartapost.com/).
Tofua
Tonga
19.75°S, 175.07°W; summit elev. 515 m
All times are local (unless otherwise noted)
Five thermal alerts detected, 28 September-30 June 2015
Tofua is a remote volcano in Tonga that is not monitored. The primary sources of information about the volcano's activity are from infrequent field visits, ash advisories from the Wellington Volcanic Ash Advisory Centre, and MODIS thermal sensors aboard the Aqua and Terra satellites.
No ash advisories from the Wellington Volcanic Ash Advisory Centre were issued during the reporting period, 28 September 2013-30 June 2015. Since the last report through 27 September 2013 (BGVN 38:07), five thermal alerts were recorded through 30 June 2015 (table 3). Two of those alerts, on 14 and 23 September 2014, were located outside and NW of the caldera rim and therefore were probably not associated with volcanic activity. No thermal alerts were issued between 18 October 2014 and 30 June 2015.
Table 3. Thermal alerts between 28 September 2013 and 30 June 2015. Thermal alerts are derived from data collected by the MODIS thermal sensors aboard the Aqua and Terra satellites and processed by the Hawaii Institute of Geophysics and Planetology using the MODVOLC algorithm. Courtesy of Hawaii Institute of Geophysics and Planetology.
| Date |
No. Pixels |
Satellite |
| 10 Oct 2013 |
2 |
Aqua |
| 27 Jul 2014 |
1 |
Aqua |
| 14 Sep 2014 |
1 |
Aqua |
| 23 Sep 2014 |
1 |
Terra |
| 18 Oct 2014 |
2 |
Terra |
Several articles on Tofua's volcanic geology and geochemistry published in the past few years have come to our attention (Caulfield, 2011, 2012, 2015). Caulfield and others (2011, 2012) include helpful aerial and cross-section sketches of the volcano's various geologic features.
References: Caulfield, J. T., Cronin, S.J., Turner, S.P., & Cooper, L.B., 2011, Mafic Plinian volcanism and ignimbrite emplacement at Tofua volcano, Tonga, Bull. Volcanology, v. 73, pp.1259–1277.
Caulfield, J. T., Turner, S. P., Smith, I. E. M., Cooper, L. B., & Jenner, G. A., 2012, Magma evolution in the primitive, intra-oceanic Tonga arc: petrogenesis of basaltic andesites at Tofua volcano. Journal of Petrology, v. 53(6), pp. 1197-1230.
Caulfield, J. T., Blichert-Toft, J., Albarède, F., & Turner, S. P., 2015, Corrigendum to 'Magma Evolution in the Primitive, Intra-oceanic Tonga Arc: Petrogenesis of Basaltic Andesites at Tofua Volcano'and 'Magma Evolution in the Primitive, Intra-oceanic Tonga Arc: Rapid Petrogenesis of Dacites at Fonualei Volcano, Journal of Petrology, v. 56(3), pp. 641-644.
Geologic Background. The low, forested Tofua Island in the central part of the Tonga Islands group is the emergent summit of a large stratovolcano that was seen in eruption by Captain Cook in 1774. The summit contains a 5-km-wide caldera whose walls drop steeply about 500 m. Three post-caldera cones were constructed at the northern end of a cold fresh-water caldera lake, whose surface lies only 30 m above sea level. The easternmost cone has three craters and produced young basaltic andesite lava flows, some of which traveled into the caldera lake. The largest and northernmost of the cones, Lofia, has a steep-sided crater that is 70 m wide and 120 m deep and has been the source of historical eruptions, first reported in the 18th century. The fumarolically active crater of Lofia has a flat floor formed by a ponded lava flow.
Information Contacts: Hawai'i Institute of Geophysics and Planetology (HIGP), MODVOLC Thermal Alerts System, School of Ocean and Earth Science and Technology (SOEST), Univ. of Hawai'i, 2525 Correa Road, Honolulu, HI 96822, USA (URL: http://modis.higp.hawaii.edu/).
Turrialba (Costa Rica) — April 2015 Cite this Report
Turrialba
Costa Rica
10.025°N, 83.767°W; summit elev. 3340 m
All times are local (unless otherwise noted)
29 October 2014 magmatic eruption, the first such event in 150 years
This report primarily summarizes activity during January 2013 through mid-December 2014 (although a plot of SO2 flux during 1 October 2008-30 November 2013 is also presented). That activity included frequent gas emissions, occasional increases in seismicity, intermittent gas explosions that generated ash plumes and ashfall, and strong gas explosions on 21 May 2013 and 29-31 October 2014. Material here are primarily extracted from a 2013 annual report and the suite of 2014 monthly reports, all prepared by the Observatorio Vulcanologico y Sismologico de Costa Rica-Universidad Nacional (OVSICORI-UNA).
Recent Bulletin reports (BGVN 37:06 and 38:02) indicated that the number of volcanic earthquakes and degassing events at Turrialba's W crater during 2012 were lower than those in 2010 and 2011. The three main fumaroles present in the W crater were as follows: Boca 2010 on the W wall, Boca 2011 on the N wall, and Boca 2012 on the E wall.
Gas data, 2008-early 2013. Ultraviolet spectral analysis can yield estimates of volcanogenic SO2. The methods to assess and express volcanogenic SO2 vary, with some methods looking at the atmospheric column (total column mass) and others the flux of the gas close to the volcano (mass per unit time, for example, metric tons per day).
The Ozone Monitoring Instrument (OMI) travels in space onboard NASA's Aura satellite and yields estimate of the column SO2 mass. For Turrialba during the 2008-2013 period OMI determined SO2 mass burdens generally below 1,500 metric tons and in a few cases to higher values including two cases in the range 2,500-4,000 metric tons (figure 36).
During 1 April 2013 to 27 November 2013, the ground-based differential optical absorption spectroscopy (DOAS) stations near Turrialbal recorded fluxes generally between 500-1,000 metric tons/day. Based on the DOAS observations, OVSICORI-UNA plotted the CO2 / SO2 molar ratio. After an explosion on 21 May 2013, the observatory found this ratio generally increased progressively in available data during the nearly six months that followed (figure 37). In a similar manner, the H2S / SO2 molar ratio also showed a tendancy towards progressive increase in available data (figure 38).
2013 events and monitoring. According to OVSICORI-UNA, the year 2013 began with low seismic activity (shallow hybrid earthquakes) and weak gas emissions similar to those in 2012. In March and April 2013, volcano-tectonic earthquakes originating more than 5 km below the summit began to occur, along with the first tornillo earthquakes of the year. (Tornillo-type earthquakes are long period with wave forms that, at or near the start, contain higher amplitude signals that gradually decrease with time. Their shape on seismograms resembles a woodscrew.) The number of volcanic earthquakes increased from 10/day on 18 April to more than 500/day on 13 July. This high level persisted until the end of August 2013.
On 20 May 2013, increased gas emissions produced a sky-blue plume visible from nearby areas. At 0452 on 21 May, the number of hybrid earthquakes became numerous. Continuous harmonic tremor increased at 0720. At 0830 and after 1100, explosions from both Boca 2010 and Boca 2012 vents generated ash plumes that rose more than 500 m (figure 39). Ashfall was reported in nearby communities to the N, W, and WSW. At noon on 21 May 2013, ash emissions ceased and seismicity decreased. Seismic activity declined sharply after the 21 May explosions, as did the CO2 /SO2 ratio, as measured in situ by a portable Multigas station. As previously noted (figures 37 and 38), for plotted measurements, the CO2/SO2 and H2S/SO2 ratios tended to progressively rise during the months that followed.
OVSICORI-UNA reported that a pilot flying past Turrialba about 40 km away observed a blackish plume on 29 May 2013. Officials from the Parque Nacional Volcán Turrialba observed a gas plume that was slightly darker than usual between 0730 and 0745; however, seismic records showed no abnormal activity at those times or seismic data signifying the discharge of a plume during the previous 48 hours. In addition, web camera images lacked evidence of ash emissions since 23 May. Gas plumes with temperatures more than 750°C were emitted from the two vents. The plume from Boca 2010 was whiter than the plume emitted from Boca 2012.
On 4 June 2013, light ashfall was reported in Pacayas (about 13 km W) and San Pablo in Oreamuno de Cartago (25 km SW). An observer in the previously closed National Park engulfing Turrialba noted that gas emissions that day were slightly stronger and more grayish than usual.
According to OVSICORI-UNA, seismic activity increased significantly again on 13 July 2013 with low-frequency signals (figure 40). On that day, the number of seismic events increased to more than 500/day. Seismicity remained at this level until late August when it decreased. During this period the gas temperature from Boca 2012 decreased from ~800°C to ~600°C. During 18-19 July, low-frequency tremor was detected. No morphological changes at the surface were observed.
Volcanic earthquakes with very long periods ceased in November 2013. Tornillos also became less frequent.
2014. The 29 October magmatic eruption discussed below culminated years of high gas emissions at Turrialba. The eruption was sudden and impulsive, termed an explosion by OVSICORI-UNA, but was led by ongoing ash-bearing emission and a clear multihour escalation in tremor. No human injuries were reported. Costa Rica has bolstered its hazard infrastructure in recent years. According to GFDRR (2012) the legislation called the "Emergencies and Risk Prevention Law (No. 8488) requires Government agencies and municipalities to allocate resources for disaster risk reduction activities in their programs and budgets. Presidential Decree (No.36721-MP-PLAN) enhanced the risk management competencies of the CNE [the National Risk Prevention and Emergencies Management Commission] and provides a model to assess vulnerability (compulsory in governmental planning processes)."
During January-September 2014, the number of volcanic earthquakes often remained relatively low (under 100, figure 41, left plot). Occasionally the number approached 200. The low seismicity was broadly similar to that in the last half of 2013; the majority of earthquakes were of low magnitude, including those of tornillo, volcanic-tectonic, and hybrid affinities. During January-September 2014, volcano-tectonic (VT) seismicity was generally stable (at 3 or fewer events per day)(figure 41, right plot).
On 28 July 2014, a swarm of small, low-amplitude, short-duration, and high-frequency events lasted two hours. OVSICORI-UNA attributed the swarm to movement of fluids through cracks.
Conde and others (2014a) published an article about volcanic SO2 and CO2 fluxes at Turrialba during early 2013. They discussed SO2 and CO2 measurement methodologies used at Turrialba and Telica. OVSICORI-UNA reports during January-March 2014 noted the development of significantly more accurate, continuous ground-based SO2 monitoring. In addition, OVSICORI-UNA acquired and used an additional instrument, a Flyspec (a mini-spectrometer to measure SO2 levels). According to the OVSICORI-UNA September 2014 monthly report, SO2 fluxes in 2014 through September ranged from 400 to 1,500 metric tons/day, well below the maximum ~3,500 t/d they recorded during several days in June-August 2009 (Conde and others, 2014b).
In addition, reported CO2/SO2 ratios were ~8 in May, 2-4 in June, and ~2.5 in July 2014. H2S/SO2 molar ratios were ~1.2 in May and 0.2-0.7 in June 2014. Several authors in the two cited articles by Conde and others are affiliated with the NOVAC project (Network for Observation of Volcanic and Atmospheric Change). According to its website, the main objective of NOVAC is to establish a network for the measurements of volcanic gas and aerosol emissions--in particular SO2 and BrO--and to use the data from this network for risk assessment and volcanological research, both locally and on a regional and global scale. OVSICORI-UNA is part of the NOVAC consortium.
The temperatures at the W crater vents during January-July 2014 were about 600°C or lower, similar to the values of the previous six months as measured 15-20 m from the vents. In August and September, temperatures rose slightly to ~650°C; the composition of the gases were stable and interpreted as primarily magmatic.
Deformation in the August and September 2014 OVSICORI-UNA reports was determined by using interferometric synthetic aperture radar (InSAR), Global Position System (GPS), and electronic distance meter (EDM) surveys. According to the August 2014 report, the InSAR and EDM measurements showed, in the 2013-2014 time interval, a relative contraction of several centimeters around the E and W craters. The September 2014 OVSICORI-UNA reported that a GPS survey on a 4-point transect from the base of the volcano to the summit yielded preliminary results indicating that one of the stations (VTQU, on the S flank) had sunk 2-3 cm/year since 2011. The September 2014 report did not report deformation at other stations.
According to OVSICORI-UNA, seismic activity, which had been low earlier in the year, began to increase in late September 2014. In mid-October instruments recorded a three-day swarm of volcano-tectonic earthquakes. The largest event, M 2.8, occurred at 2035 on 16 October at a depth of 5 km beneath the active crater. SO2 flux remained low to moderate ranging between 400 and 1,500 metric tons per day during through October 2014. Magmatic influenced degassing intensified during 28-29 October; the SO2 flux was ~2,000 t/d, higher than the 1,300 t/d average measured in September 2014 and the highest to date during 2014. (Recalling the previously mentioned interval 1 April-27 November 2013, the recorded fluxes also stood lower, generally in the range 500-1,000 tons/day).
The 30 October report by OVSICORI-UNA, which contains informative graphics omitted here, including photos of the plume, tephra deposited on a car, seismic instrument records and spectral information, a helicorder record for a 24-hour interval bracketing the explosion). OVSICORI-UNA described the eruption on the 29th as a moderate eruption of ash between 2310 and 2335 (25 munutes).
According to that report, tremor began at 0600 on the 29th and continued unbroken into at least early the next day. The tremor and the associated RSAM escalation was sufficiently ominous as to lead OVSICORI to notify locals of the situation (including the CNE, the National Park, as well as a nearby lodge. The same OVSICORI-UNA report added that at unstated time during this episode the lodge's chief Tony Lachner noted the plume was darker than usual, contained a yellowish tinge, and was judged to contain ash. At 1700, OVSICORI-UNA again informed local authorities on the situation. The tremor had increased in amplitude and continuity (duration) during the afternoon. Tremor became strongest around 2310-2320 on the 29th coincident with the strong explosion then. The same report noted that OVSICORI-UNA had alerted aviation authorities of the explosion around midnight.
The explosion, heard by local residents, also left a clear record on instruments in the region including those at Poas and Irazu. The explosion ended what started as an initially small eruption from the West Crater that lasted about 25 minutes. The explosion was heard by nearby villagers. An ash cloud rose to an altitude of 5.8 km and drifted WSW. Ash fell on numerous nearby communities, including parts of the capital of San José (whose outskirts are ~30 km W) and Heredia (centered less than 40 km WNW of the volcano). In more detail, settlements noted by OVSICORI-UNA included San Gerardo de Irazú, San Ramón de Tres Ríos, Coronado, Moravia, Curridabat, Desamparados, Aserrí, Escazú, Santa Ana, Belén, Guácima de Alajuela, Río Segundo de Alajuela, San Pedro Montes de Oca, Guadalupe, areas of Heredia, and the capital of San José (population ~350,000, with central downtown located~ 70 km SW of Turrialbla).
The explosion on the 29th destroyed the wall between the West and Central craters, depositing material around the Central Crater and partially burying it. According to a news report (Agence France-Presse), Turrialba National Park remained closed, and eleven people from Santa Cruz de Turrialba were evacuated to shelters. Some schools were also temporarily closed, affecting over 300 area students. OVSICORI-UNA literature (including the 30 October report discussed above) noted that magma had not previously reached the surface at Turrialba since an eruption in 1866 (~150 years ago).
The magmatic eruption continued during 30-31 October (figure 42) with growing magmatic components seen in samples. Analyses of tephra showed that the proportion of juvenile material increased during 30 and 31 October, respectively, rising from the range of 3-5% by volume to the range of 7-10% by volume. A 30 October OVSICORI-UNA report noted that the ash dispersion modeling assumed a plume height of 1.5 km, consistent with a photo they showed (time unstated), which showed much of the plume remaining comparatively low in the area of view near the volcano. According to the Washington Volcanic Ash Advisory Center (VAAC), the 30-31 October eruption produced a continuous emission of gas and light ash with an occasional burst of heavier ash, generally moving W and SW.
In their 7 November 2014 report, OVSICORI-UNA discussed how named staff collected and ran tests on leachate acidity for material deposited in the explosions during 29-31 October. Leachate reached pH 3.3 (highly acidic). In contrast, ash erupted during 4-5 January 2010 yielded leachate with pH 6.7-7.1 (near neutral). The 2014 report cautioned that such values were of considerable concern to human health, to environmental impacts (native vegetation, aquatic species, etc.), to cultivated plants, and to the well being of livestock and farm animals. The authors attributed the low pH values to the magmatic nature of the eruption and to absorption of those gases on the ash particle surfaces.
An explosion at 0520 on 1 November 2014 generated an ash plume that drifted toward the E and N parts of the Central Valley. A 3 November report stated that during the previous 24 hours seismicity had decreased significantly and no explosions had been detected; seismicity remained elevated. An phone and online (Facebook) public survey allowed residents to record if they had observed ashfall in their localities during the eruptive interval. Responses depicted a W-directed dispersal pattern that covered much of the urban area around San Jose.
OVSICORI-UNA reported a seismic signal indicating a strong emission lasting 50 minutes that started at 2320 on 6 November. The same 7 November report noted that in broad terms seismicity had decreased overall during the previous few days.
An ash-bearing explosion from Turrialba started at 1926 on 13 November and lasted about 10 minutes. Another explosion occurred at 1342 on 14 November and lasted about 15 minutes, although the strongest part was 7-minutes long. The OVSICORI-UNA report issued at 1635 on the 14th emphasized the associated explosive signal of these two emissions in terms of seismicity, for example, noting the dominant frequencies for the respective events were centered at 6.8 and 4.0 Hz. The report also said that of National Park officials reported ashfall at the top of Irazú. Volcanologists observed the 14 November explosion and collected samples at Hacienda La Central, 3 km SE of West Crater.
According to news reports (The Tico Times and crhoy.com), OVSICORI-UNA reported a strong gas emission on 13 November, accompanied by a massive outpouring of ash. A pilot reported ash plume S of the volcano at an altitude of 3.7-4.3 km.
According to OVSICORI-UNA, a strong Strombolian explosion occurred at 2128 on 8 December 2014, considered by them as one of the large explosions in the series that started with the magmatic eruption on 29 October 2014. The explosion lasted about ten minutes and had no precursory activity. The main pulse of ash emissions took place in under 100 seconds. Ashfall, 1 cm thick, and ballistics up to ~5 kg were deposited as far as 300 m W. Ashfall of 0.01 to 2 cm thickness was reported in the Central Valley and in towns to the W and SW, with 23 reports from citizens consistent with ash at distances of 45-80 km from the source. The report also noted constant inflation at Turriabla, ~10-15 mm annually, since the year 2010.
Citizen input to acquire ash thickness data. The Turriabla reporting took advantage of an OVSICORI questionare (Encuesta Alcance de Cenizas, V. Turrialba) to engage citizen observations on ash deposition. The online questionnaire (find link in "Information Contacts" section below) features a scalable map that features a positionable icon to show the location of ash-thickness observation. This position then automatically computes the resulting coordinates (latitude and longitude). The questionare includes several other questions relating to thickness, date and time of observation, rainfall, and weather conditions (which can perturb the original thickness). Entering contact information is optional.
References. Conde V., Robidoux, P., Avard, G., Galle, B. Aiuppa, A.,? Muñoz, A., and Giudice, G., 2014a, Measurements of volcanic SO2 and CO2 fluxes by combined DOAS, Multi.GAS and FTIR observations: a case study from Turrialba and Telica volcanoes, Int J Earth Sci (Geol Rundsch), 103, pp. 2335-2347, Springer-Verlag, Berlin Heidelberg. (Also Errata November 2014, 103 (8), p 2349.)
Conde, V., Bredemeyer, S., Duarte, E., Pacheco, J., Miranda, S., Galle, B., and Hansteen, T., 2014b, SO2 degassing from Turrialba Volcano linked to seismic signatures during the period 2008–2012, International Journal of Earth Sciences (Geol Rundsch) 103, pp. 1983–1998, Springer-Verlag, Berlin Heidelberg.
GFDRR, 2012, Costa Rica Country Update – GFDRR, October 2012; Global Facility for Disaster Reduction and Recovery (GFDRR). (URL: http://www.gfdrr.org/sites/gfdrr.org/files/COSTA_RICA.pdf) (Accessed 12 July 2015).
Geologic Background. Turrialba, the easternmost of Costa Rica's Holocene volcanoes, is a large vegetated basaltic-to-dacitic stratovolcano located across a broad saddle NE of Irazú volcano overlooking the city of Cartago. The massive edifice covers an area of 500 km2. Three well-defined craters occur at the upper SW end of a broad 800 x 2200 m summit depression that is breached to the NE. Most activity originated from the summit vent complex, but two pyroclastic cones are located on the SW flank. Five major explosive eruptions have occurred during the past 3500 years. A series of explosive eruptions during the 19th century were sometimes accompanied by pyroclastic flows. Fumarolic activity continues at the central and SW summit craters.
Information Contacts: Observatorio Vulcanologico y Sismologico de Costa Rica-Universidad Nacional (OVSICORI-UNA) (URL: http://www.ovsicori.una.ac.cr/); Washington Volcanic Ash Advisory Center (VAAC), Satellite Analysis Branch (SAB), NOAA/NESDIS E/SP23, NOAA Science Center Room 401, 5200 Auth Rd, Camp Springs, MD 20746, USA (URL: http://www.ospo.noaa.gov/Products/atmosphere/vaac/); Network for Observation of Volcanic and Atmospheric Change (NOVAC) (URL: http://www.novac-project.eu/); The Tico Times (URL: http://www.ticotimes.net/); Agence France-Presse (URL: http://www.afp.com/); The Costa Rica Star (URL: http://news.co.cr/); and crhoy.com (URL: http://www.crhoy.com/).