Recently Published Bulletin Reports
Erebus (Antarctica) Lava lake remains active; most thermal alerts recorded since 2019
Rincon de la Vieja (Costa Rica) Frequent phreatic explosions during July-December 2023
Bezymianny (Russia) Explosion on 18 October 2023 sends ash plume 8 km high; lava flows and incandescent avalanches
Kilauea (United States) Low-level lava effusions in the lava lake at Halema’uma’u during July-December 2022
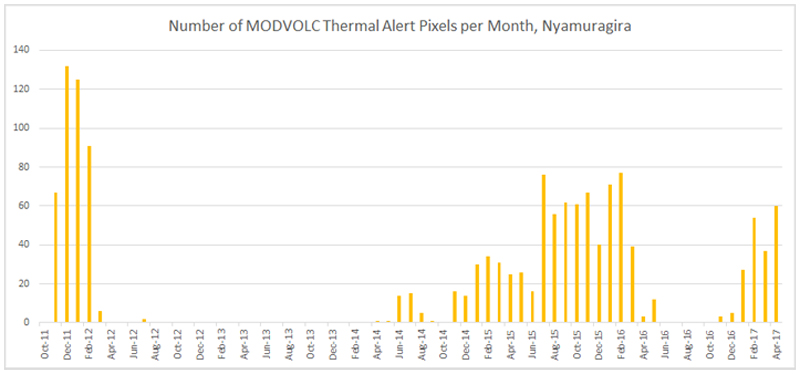
Nyamulagira (DR Congo) Lava flows and thermal activity during May-October 2023
Bagana (Papua New Guinea) Explosions, ash plumes, ashfall, and lava flows during April-September 2023
Mayon (Philippines) Lava flows, pyroclastic flows, ash emissions, and seismicity during April-September 2023
Nishinoshima (Japan) Eruption plumes and gas-and-steam plumes during May-August 2023
Krakatau (Indonesia) White gas-and-steam plumes and occasional ash plumes during May-August 2023
Villarrica (Chile) Strombolian activity, gas-and-ash emissions, and crater incandescence during April-September 2023
Merapi (Indonesia) Frequent incandescent avalanches during April-September 2023
Ebeko (Russia) Moderate explosive activity with ash plumes continued during June-November 2023
Erebus (Antarctica) — January 2024  Cite this Report
Erebus
Antarctica
77.53°S, 167.17°E; summit elev. 3794 m
All times are local (unless otherwise noted)
Lava lake remains active; most thermal alerts recorded since 2019
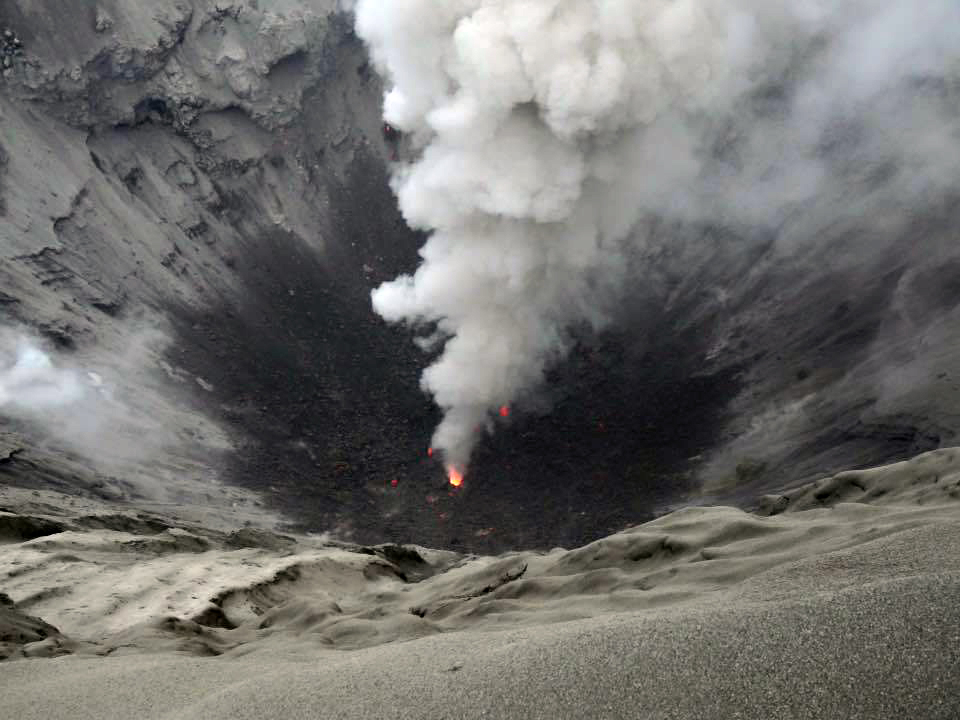
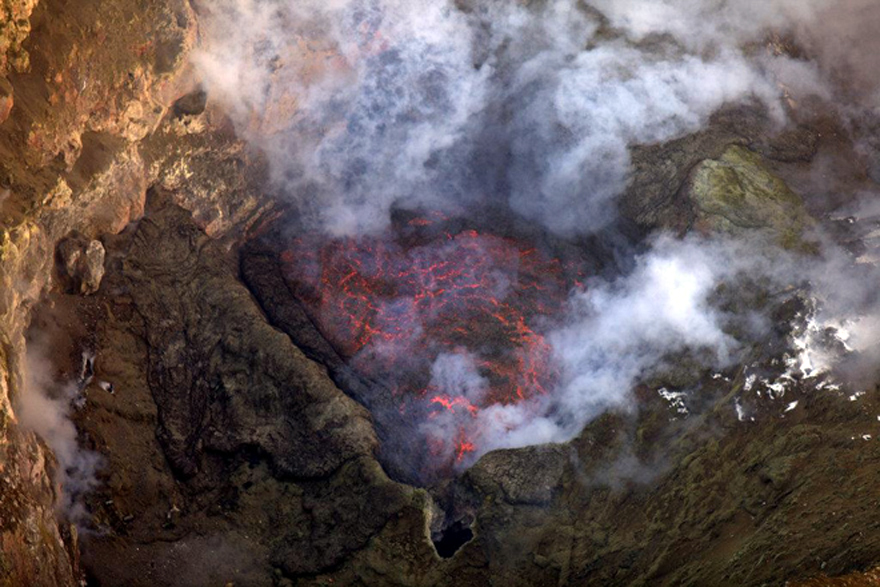
The lava lake in the summit crater of Erebus has been active since at least 1972. Located in Antarctica overlooking the McMurdo Station on Ross Island, it is the southernmost active volcano on the planet. Because of the remote location, activity is primarily monitored by satellites. This report covers activity during 2023.
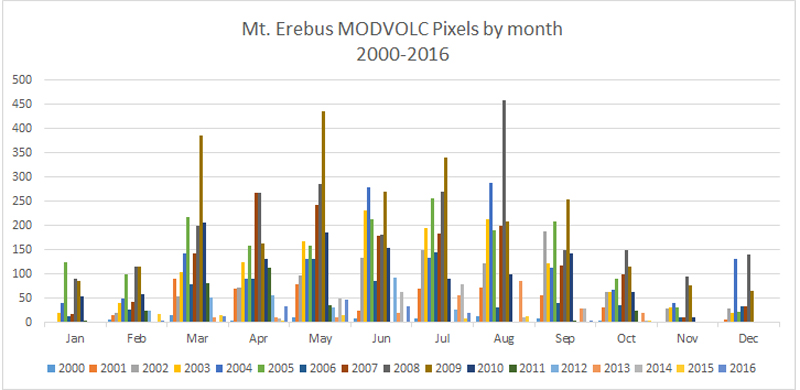
The number of thermal alerts recorded by the Hawai'i Institute of Geophysics and Planetology’s MODVOLC Thermal Alerts System increased considerably in 2023 compared to the years 2020-2022 (table 9). In contrast to previous years, the MODIS instruments aboard the Aqua and Terra satellites captured data from Erebus every month during 2023. Consistent with previous years, the lowest number of anomalous pixels were recorded in January, November, and December.
Table 9. Number of monthly MODIS-MODVOLC thermal alert pixels recorded at Erebus during 2017-2023. See BGVN 42:06 for data from 2000 through 2016. The table was compiled using data provided by the HIGP – MODVOLC Thermal Alerts System.
| Year |
Jan |
Feb |
Mar |
Apr |
May |
Jun |
Jul |
Aug |
Sep |
Oct |
Nov |
Dec |
SUM |
| 2017 |
0 |
21 |
9 |
0 |
0 |
1 |
11 |
61 |
76 |
52 |
0 |
3 |
234 |
| 2018 |
0 |
21 |
58 |
182 |
55 |
17 |
137 |
172 |
103 |
29 |
0 |
0 |
774 |
| 2019 |
2 |
21 |
162 |
151 |
55 |
56 |
75 |
53 |
29 |
19 |
1 |
0 |
624 |
| 2020 |
0 |
2 |
16 |
18 |
4 |
4 |
1 |
3 |
18 |
3 |
1 |
6 |
76 |
| 2021 |
0 |
9 |
1 |
0 |
2 |
56 |
46 |
47 |
35 |
52 |
5 |
3 |
256 |
| 2022 |
1 |
13 |
55 |
22 |
15 |
32 |
39 |
19 |
31 |
11 |
0 |
0 |
238 |
| 2023 |
2 |
33 |
49 |
82 |
41 |
32 |
70 |
64 |
42 |
17 |
5 |
11 |
448 |
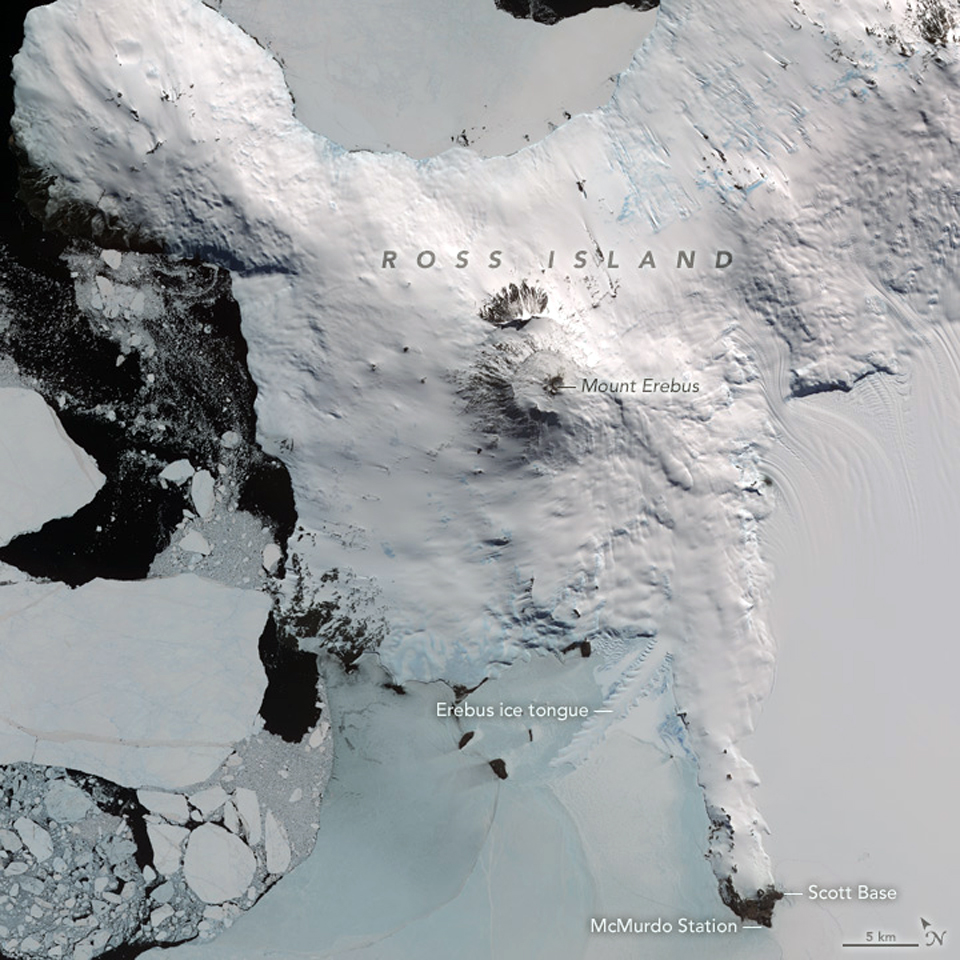
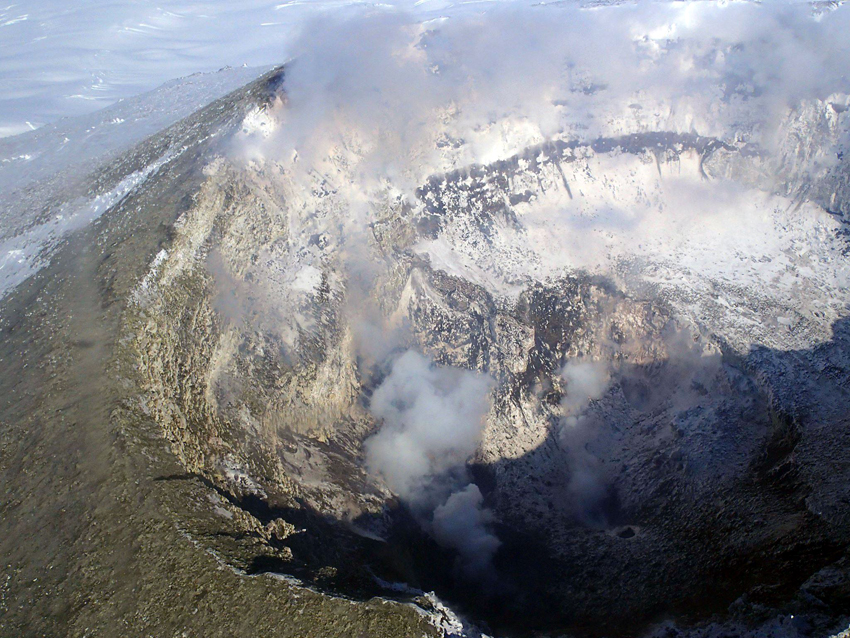
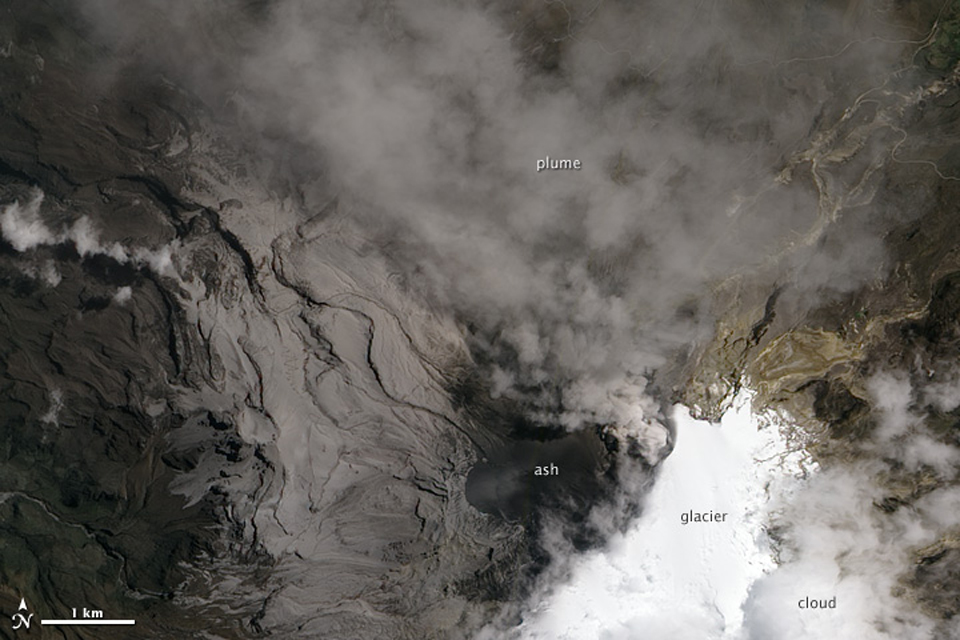
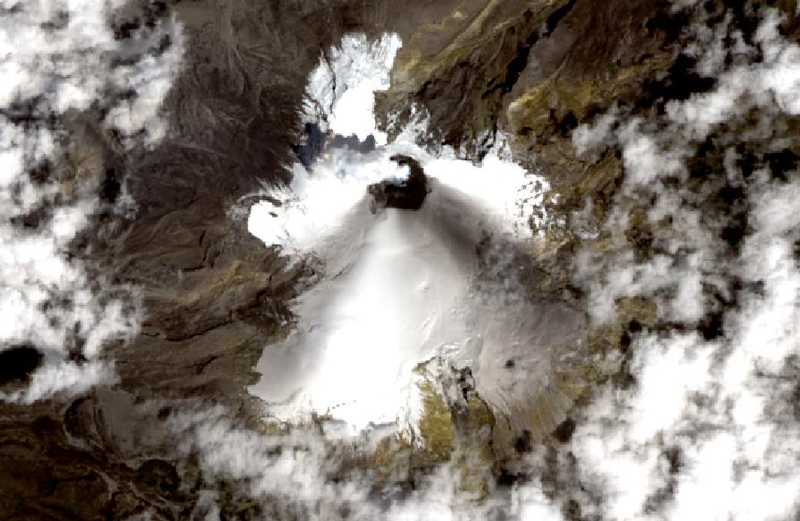
Sentinel-2 infrared images showed one or two prominent heat sources within the summit crater, accompanied by adjacent smaller sources, similar to recent years (see BGVN 46:01, 47:02, and 48:01). A unique image was obtained on 25 November 2023 by the OLI-2 (Operational Land Imager-2) on Landsat 9, showing the upper part of the volcano surrounded by clouds (figure 32).
Geologic Background. Mount Erebus, the world's southernmost historically active volcano, overlooks the McMurdo research station on Ross Island. It is the largest of three major volcanoes forming the crudely triangular Ross Island. The summit of the dominantly phonolitic volcano has been modified by one or two generations of caldera formation. A summit plateau at about 3,200 m elevation marks the rim of the youngest caldera, which formed during the late-Pleistocene and within which the modern cone was constructed. An elliptical 500 x 600 m wide, 110-m-deep crater truncates the summit and contains an active lava lake within a 250-m-wide, 100-m-deep inner crater; other lava lakes are sometimes present. The glacier-covered volcano was erupting when first sighted by Captain James Ross in 1841. Continuous lava-lake activity with minor explosions, punctuated by occasional larger Strombolian explosions that eject bombs onto the crater rim, has been documented since 1972, but has probably been occurring for much of the volcano's recent history.
Information Contacts: Hawai'i Institute of Geophysics and Planetology (HIGP) - MODVOLC Thermal Alerts System, School of Ocean and Earth Science and Technology (SOEST), Univ. of Hawai'i, 2525 Correa Road, Honolulu, HI 96822, USA (URL: http://modis.higp.hawaii.edu/); Copernicus Browser, Copernicus Data Space Ecosystem, European Space Agency (URL: https://dataspace.copernicus.eu/browser/); NASA Earth Observatory, EOS Project Science Office, NASA Goddard Space Flight Center, Goddard, Maryland, USA (URL: https://earthobservatory.nasa.gov/images/152134/erebus-breaks-through).
Rincon de la Vieja (Costa Rica) — January 2024 Cite this Report
Rincon de la Vieja
Costa Rica
10.83°N, 85.324°W; summit elev. 1916 m
All times are local (unless otherwise noted)
Frequent phreatic explosions during July-December 2023
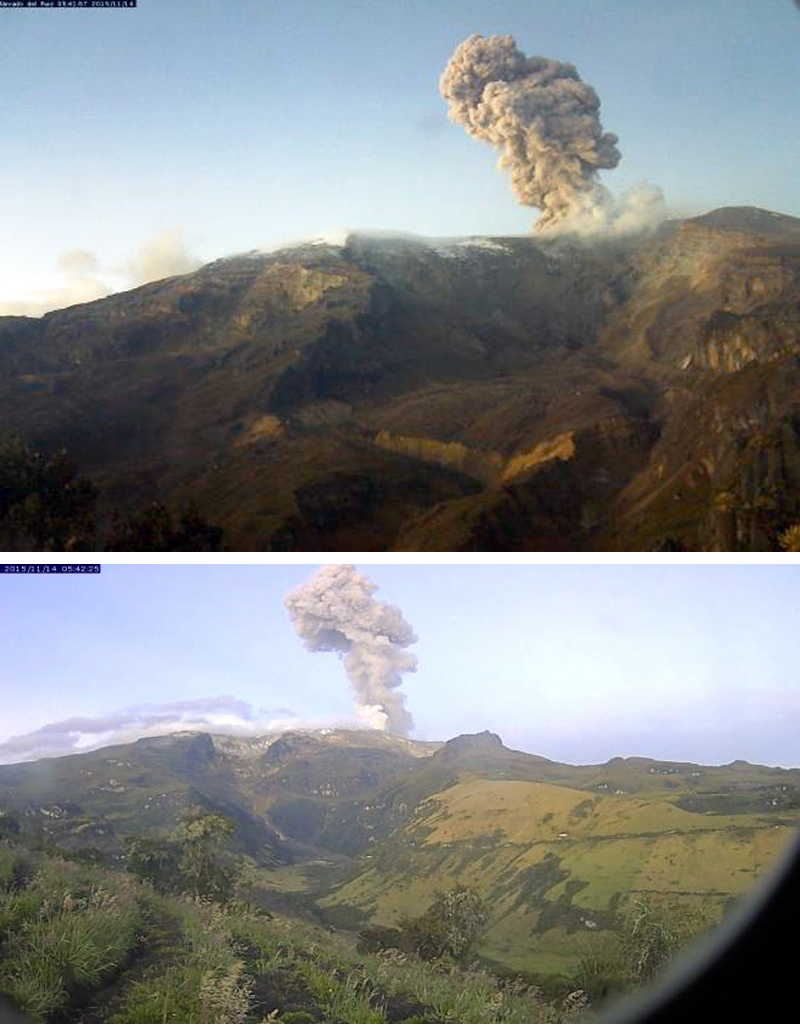
Rincón de la Vieja is a volcanic complex in Costa Rica with a hot convecting acid lake that exhibits frequent weak phreatic explosions, gas-and-steam emissions, and occasional elevated sulfur dioxide levels (BGVN 45:10, 46:03, 46:11). The current eruption period began June 2021. This report covers activity during July-December 2023 and is based on weekly bulletins and occasional daily reports from the Observatorio Vulcanologico Sismologica de Costa Rica-Universidad Nacional (OVSICORI-UNA).
Numerous weak phreatic explosions continued during July-December 2023, along with gas-and-steam emissions and plumes that rose as high as 3 km above the crater rim. Many weekly OVSICORI-UNA bulletins included the previous week's number of explosions and emissions (table 9). For many explosions, the time of explosion was given (table 10). Frequent seismic activity (long-period earthquakes, volcano-tectonic earthquakes, and tremor) accompanied the phreatic activity.
Table 9. Number of reported weekly phreatic explosions and gas-and-steam emissions at Rincón de la Vieja, July-December 2023. Counts are reported for the week before the Weekly Bulletin date; not all reports included these data. Courtesy of OVSICORI-UNA.
| OVSICORI Weekly Bulletin |
Number of explosions |
Number of emissions |
| 28 Jul 2023 |
6 |
14 |
| 4 Aug 2023 |
10 |
12 |
| 1 Sep 2023 |
13 |
11 |
| 22 Sep 2023 |
12 |
13 |
| 29 Sep 2023 |
6 |
11 |
| 6 Oct 2023 |
12 |
5 |
| 13 Oct 2023 |
7 |
9 |
| 20 Oct 2023 |
1 |
15 |
| 27 Oct 2023 |
3 |
23 |
| 3 Nov 2023 |
3 |
10 |
| 17 Nov 2023 |
0 |
Some |
| 24 Nov 2023 |
0 |
14 |
| 8 Dec 2023 |
4 |
16 |
| 22 Dec 2023 |
8 |
18 |
Table 10. Summary of activity at Rincón de la Vieja during July-December 2023. Weak phreatic explosions and gas emissions are noted where the time of explosion was indicated in the weekly or daily bulletins. Height of plumes or emissions are distance above the crater rim. Courtesy of OVSICORI-UNA.
| Date |
Time |
Description of Activity |
| 1 Jul 2023 |
0156 |
Explosion. |
| 2 Jul 2023 |
0305 |
Explosion. |
| 4 Jul 2023 |
0229, 0635 |
Event at 0635 produced a gas-and-steam plume that rose 700 m and drifted W; seen by residents in Liberia (21 km SW). |
| 9 Jul 2023 |
1843 |
Explosion. |
| 21 Jul 2023 |
0705 |
Explosion. |
| 26 Jul 2023 |
1807 |
Explosion. |
| 28 Jul 2023 |
0802 |
Explosion generated a gas-and-steam plume that rose 500 m. |
| 30 Jul 2023 |
1250 |
Explosion. |
| 31 Jul 2023 |
2136 |
Explosion. |
| 11 Aug 2023 |
0828 |
Explosion. |
| 18 Aug 2023 |
1304 |
Explosion. |
| 21 Aug 2023 |
1224 |
Explosion generated gas-and-steam plumes rose 500-600 m. |
| 22 Aug 2023 |
0749 |
Explosion generated gas-and-steam plumes rose 500-600 m. |
| 24 Aug 2023 |
1900 |
Explosion. |
| 25 Aug 2023 |
0828 |
Event produced a steam-and-gas plume that rose 3 km and drifted NW. |
| 27-28 Aug 2023 |
0813 |
Four small events; the event at 0813 on 28 August lasted two minutes and generated a steam-and-gas plume that rose 2.5 km. |
| 1 Sep 2023 |
1526 |
Explosion generated plume that rose 2 km and ejected material onto the flanks. |
| 2-3 Sep 2023 |
- |
Small explosions detected in infrasound data. |
| 4 Sep 2023 |
1251 |
Gas-and-steam plume rose 1 km and drifted W. |
| 7 Nov 2023 |
1113 |
Explosion. |
| 8 Nov 2023 |
0722 |
Explosion. |
| 12 Nov 2023 |
0136 |
Small gas emissions. |
| 14 Nov 2023 |
0415 |
Small gas emissions. |
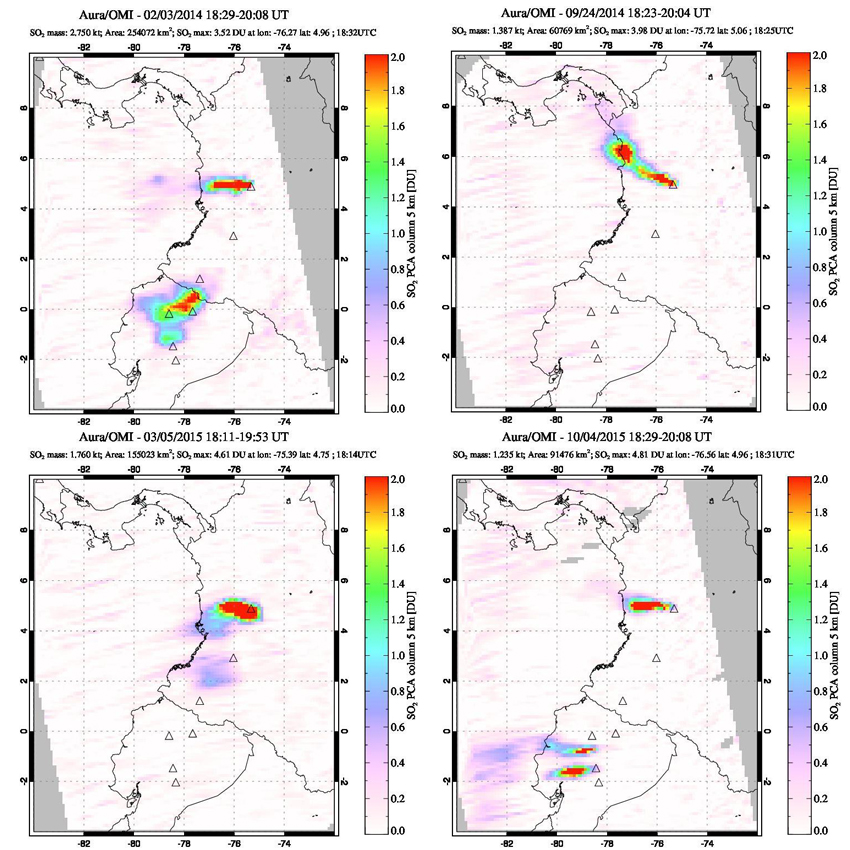
According to OVSICORI-UNA, during July-October the average weekly sulfur dioxide (SO2) flux ranged from 68 to 240 tonnes/day. However, in mid-November the flux increased to as high as 334 tonnes/day, the highest value measured in recent years. The high SO2 flux in mid-November was also detected by the TROPOMI instrument on the Sentinel-5P satellite (figure 43).
Geologic Background. Rincón de la Vieja, the largest volcano in NW Costa Rica, is a remote volcanic complex in the Guanacaste Range. The volcano consists of an elongated, arcuate NW-SE-trending ridge constructed within the 15-km-wide early Pleistocene Guachipelín caldera, whose rim is exposed on the south side. Sometimes known as the "Colossus of Guanacaste," it has an estimated volume of 130 km3 and contains at least nine major eruptive centers. Activity has migrated to the SE, where the youngest-looking craters are located. The twin cone of Santa María volcano, the highest peak of the complex, is located at the eastern end of a smaller, 5-km-wide caldera and has a 500-m-wide crater. A Plinian eruption producing the 0.25 km3 Río Blanca tephra about 3,500 years ago was the last major magmatic eruption. All subsequent eruptions, including numerous historical eruptions possibly dating back to the 16th century, have been from the prominent active crater containing a 500-m-wide acid lake located ENE of Von Seebach crater.
Information Contacts: Observatorio Vulcanológico Sismológica de Costa Rica-Universidad Nacional (OVSICORI-UNA), Apartado 86-3000, Heredia, Costa Rica (URL: http://www.ovsicori.una.ac.cr/); NASA Global Sulfur Dioxide Monitoring Page, Atmospheric Chemistry and Dynamics Laboratory, NASA Goddard Space Flight Center (NASA/GSFC), 8800 Greenbelt Road, Goddard MD 20771, USA (URL: https://so2.gsfc.nasa.gov/).
Bezymianny (Russia) — November 2023 Cite this Report
Bezymianny
Russia
55.972°N, 160.595°E; summit elev. 2882 m
All times are local (unless otherwise noted)
Explosion on 18 October 2023 sends ash plume 8 km high; lava flows and incandescent avalanches
Bezymianny, located on Russia’s Kamchatka Peninsula, has had eruptions since 1955 characterized by dome growth, explosions, pyroclastic flows, ash plumes, and ashfall. Activity during November 2022-April 2023 included gas-and-steam emissions, lava dome collapses generating avalanches, and persistent thermal activity. Similar eruptive activity continued from May through October 2023, described here based on information from weekly and daily reports of the Kamchatka Volcano Eruptions Response Team (KVERT), notices from Tokyo VAAC (Volcanic Ash Advisory Center), and from satellite data.
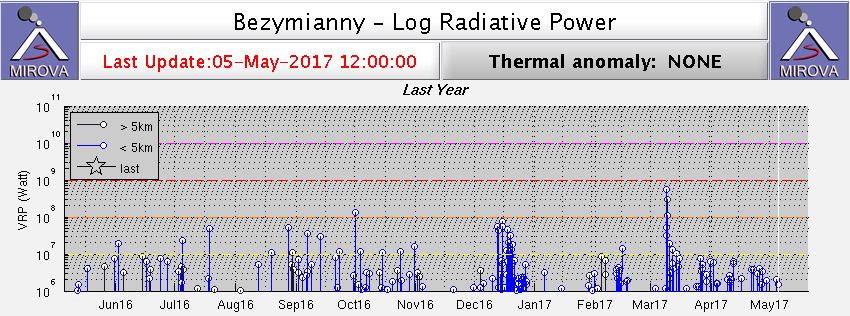
Overall activity decreased after the strong period of activity in late March through April 2023, which included ash explosions during 29 March and 7-8 April 2023 that sent plumes as high as 10-12 km altitude, along with dome growth and lava flows (BGVN 48:05). This reduced activity can be seen in the MIROVA thermal detection system graph (figure 56), which was consistent with data from the MODVOLC thermal detection system and with Sentinel-2 satellite images that showed persistent hotspots in the summit crater when conditions allowed observations. A renewed period of strong activity began in mid-October 2023.
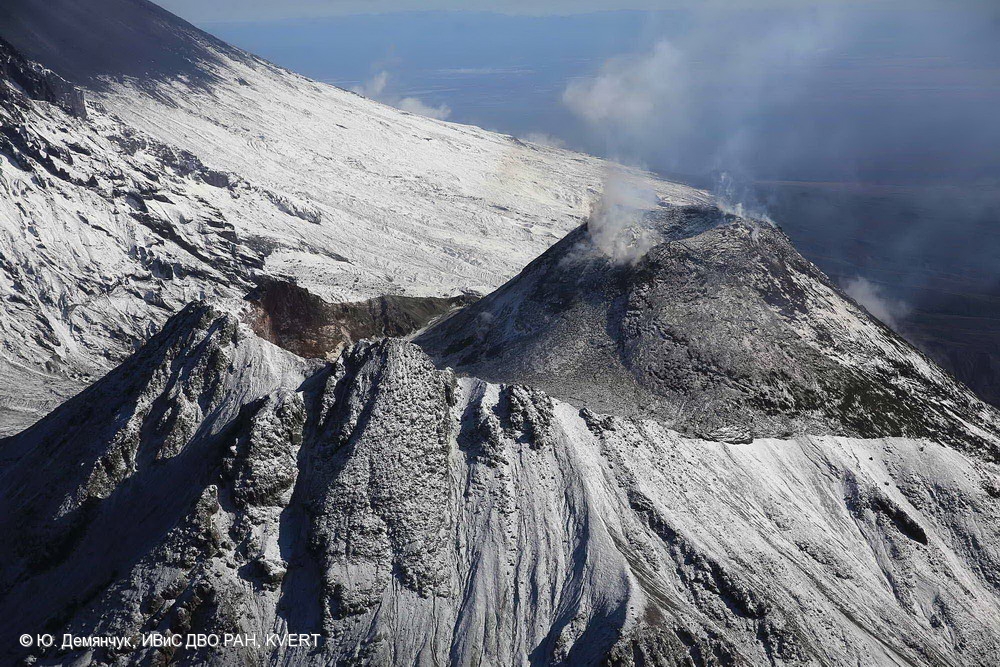
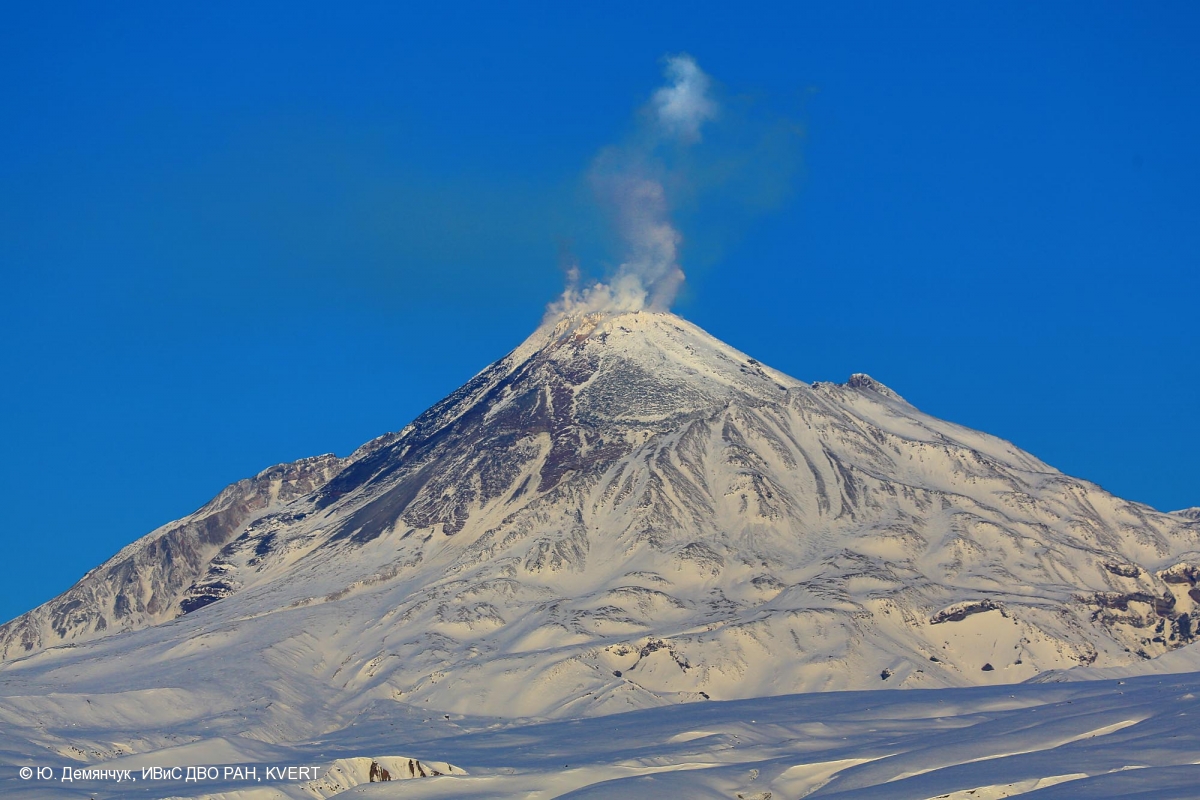
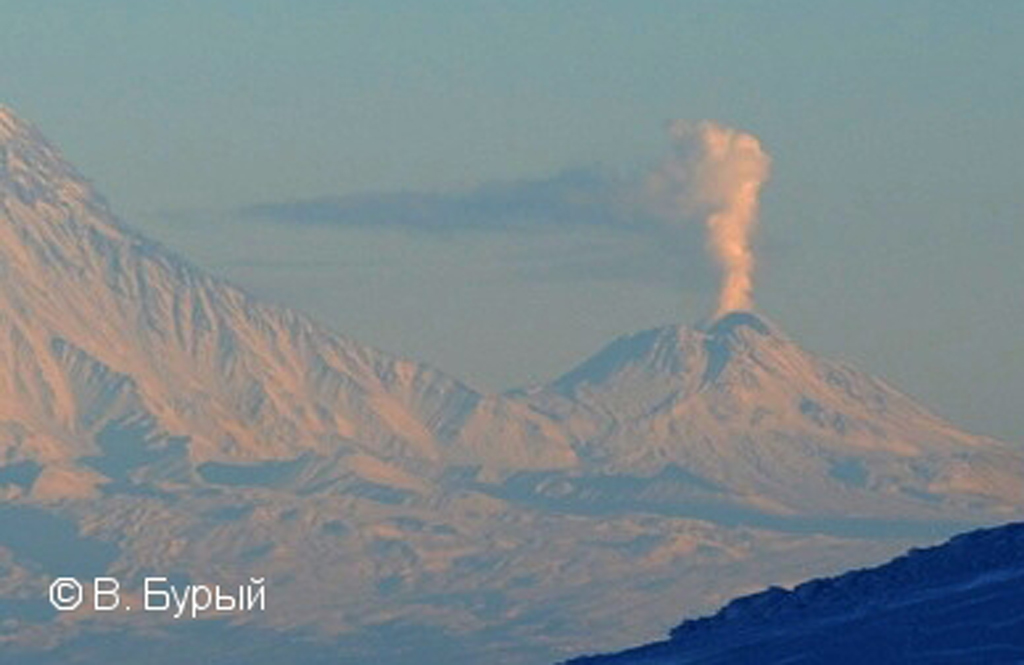
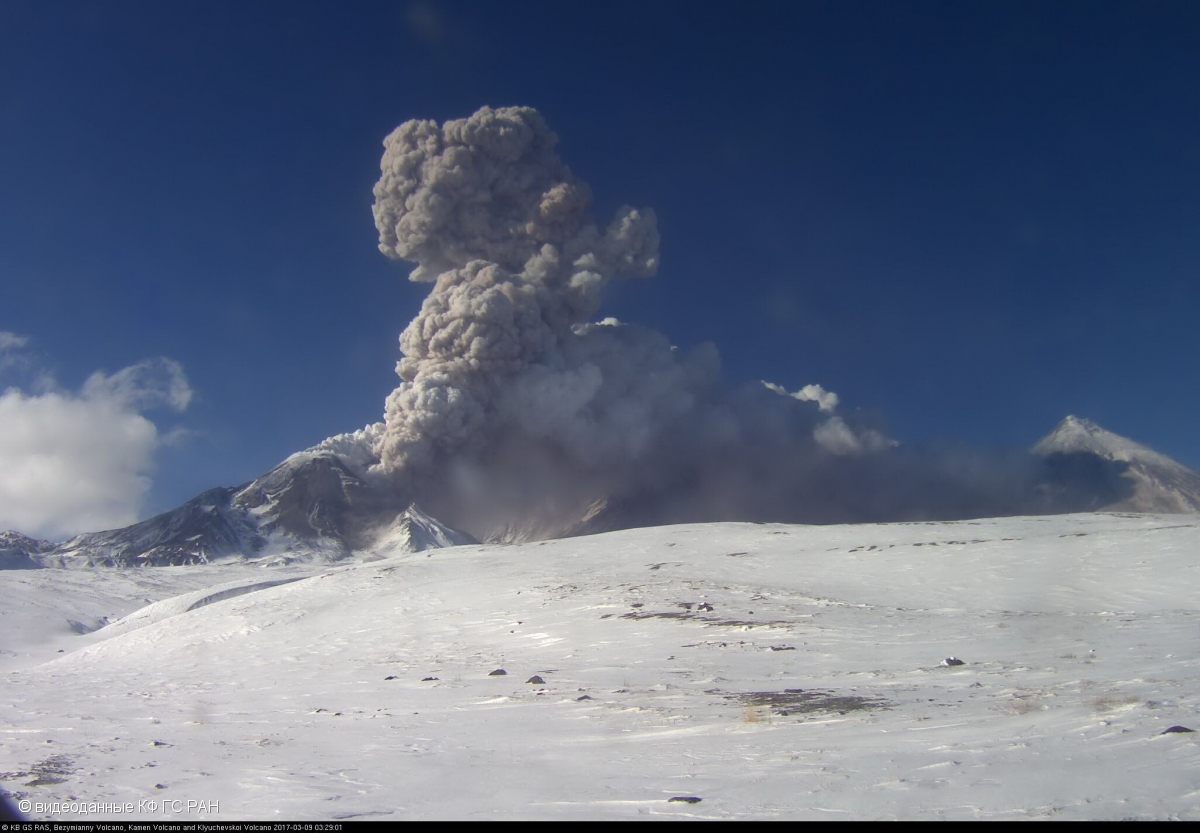
Activity increased significantly on 17 October 2023 when large collapses began during 0700-0830 on the E flanks of the lava dome and continued to after 0930 the next day (figure 57). Ash plumes rose to an altitude of 4.5-5 km, extending 220 km NNE by 18 October. A large explosion at 1630 on 18 October produced an ash plume that rose to an altitude of 11 km (8 km above the summit) and drifted NNE and then NW, extending 900 km NW within two days at an altitude of 8 km. Minor ashfall was noted in Kozyrevsk (45 km WNW). At 0820 on 20 October an ash plume was identified in satellite images drifting 100 km ENE at altitudes of 4-4.5 km.
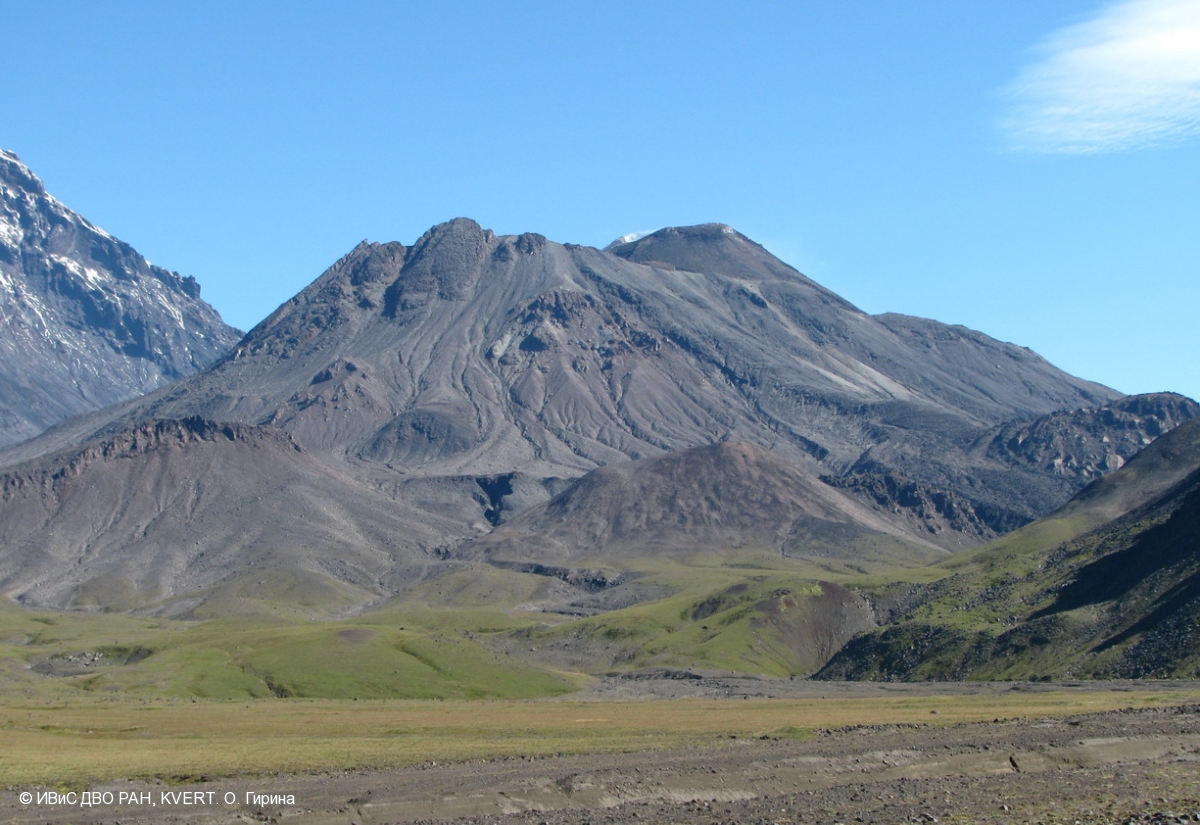
Lava flows and hot avalanches from the dome down the SE flank continued over the next few days, including 23 October when clear conditions allowed good observations (figures 58 and 59). A large thermal anomaly was observed over the volcano through 24 October, and in the summit crater on 30 October (figure 60). Strong fumarolic activity continued, with numerous avalanches and occasional incandescence. By the last week of October, volcanic activity had decreased to a level consistent with that earlier in the reporting period.
Aviation warnings were frequently updated during 17-20 October. KVERT issued a Volcano Observatory Notice for Aviation (VONA) on 17 October at 1419 and 1727 (0219 and 0527 UTC) raising the Aviation Color Code (ACC) from Yellow to Orange (second highest level). The next day, KVERT issued a VONA at 1705 (0505 UTC) raising the ACC to Red (highest level) but lowered it back to Orange at 2117 (0917 UTC). After another decrease to Yellow and back to Orange, the ACC was reduced to Yellow on 20 October at 1204 (0004 UTC). In addition, the Tokyo VAAC issued a series of Volcanic Ash Advisories beginning on 16 October and continuing through 30 October.
Geologic Background. The modern Bezymianny, much smaller than its massive neighbors Kamen and Kliuchevskoi on the Kamchatka Peninsula, was formed about 4,700 years ago over a late-Pleistocene lava-dome complex and an edifice built about 11,000-7,000 years ago. Three periods of intensified activity have occurred during the past 3,000 years. The latest period, which was preceded by a 1,000-year quiescence, began with the dramatic 1955-56 eruption. This eruption, similar to that of St. Helens in 1980, produced a large open crater that was formed by collapse of the summit and an associated lateral blast. Subsequent episodic but ongoing lava-dome growth, accompanied by intermittent explosive activity and pyroclastic flows, has largely filled the 1956 crater.
Information Contacts: Kamchatka Volcanic Eruptions Response Team (KVERT), Far Eastern Branch, Russian Academy of Sciences, 9 Piip Blvd., Petropavlovsk-Kamchatsky, 683006, Russia (URL: http://www.kscnet.ru/ivs/kvert/); Kamchatka Volcanological Station, Kamchatka Branch of Geophysical Survey, (KB GS RAS), Klyuchi, Kamchatka Krai, Russia (URL: http://volkstat.ru/); Tokyo Volcanic Ash Advisory Center (VAAC), 1-3-4 Otemachi, Chiyoda-ku, Tokyo 100-8122, Japan (URL: http://ds.data.jma.go.jp/svd/vaac/data/); Hawai'i Institute of Geophysics and Planetology (HIGP) - MODVOLC Thermal Alerts System, School of Ocean and Earth Science and Technology (SOEST), Univ. of Hawai'i, 2525 Correa Road, Honolulu, HI 96822, USA (URL: http://modis.higp.hawaii.edu/); MIROVA (Middle InfraRed Observation of Volcanic Activity), a collaborative project between the Universities of Turin and Florence (Italy) supported by the Centre for Volcanic Risk of the Italian Civil Protection Department (URL: http://www.mirovaweb.it/); Copernicus Browser, Copernicus Data Space Ecosystem, European Space Agency (URL: https://dataspace.copernicus.eu/browser/).chr
Kilauea (United States) — January 2023 Cite this Report
Kilauea
United States
19.421°N, 155.287°W; summit elev. 1222 m
All times are local (unless otherwise noted)
Low-level lava effusions in the lava lake at Halema’uma’u during July-December 2022
Kīlauea is the southeastern-most volcano in Hawaii and overlaps the E flank of the Mauna Loa volcano. Its East Rift Zone (ERZ) has been intermittently active for at least 2,000 years. An extended eruption period began in January 1983 and was characterized by open lava lakes and lava flows from the summit caldera and the East Rift Zone. During May 2018 magma migrated into the Lower East Rift Zone (LERZ) and opened 24 fissures along a 6-km-long NE-trending fracture zone that produced lava flows traveling in multiple directions. As lava emerged from the fissures, the lava lake at Halema'uma'u drained and explosions sent ash plumes to several kilometers altitude (BGVN 43:10).
The current eruption period started during September 2021 and has recently been characterized by lava effusions, spatter, and sulfur dioxide emissions in the active Halema’uma’u lava lake (BGVN 47:08). Lava effusions, some spatter, and sulfur dioxide emissions have continued during this reporting period of July through December 2022 using daily reports, volcanic activity notices, and abundant photo, map, and video data from the US Geological Survey's (USGS) Hawaiian Volcano Observatory (HVO).
Summary of activity during July-December 2022. Low-level effusions have continued at the western vent of the Halema’uma’u crater during July through early December 2022. Occasional weak ooze-outs (also called lava break outs) would occur along the margins of the crater floor. The overall level of the active lava lake throughout the reporting period gradually increased due to infilling, however it stagnated in mid-September (table 13). During September through November, activity began to decline, though lava effusions persisted at the western vent. By 9 December, the active part of the lava lake had completely crusted over, and incandescence was no longer visible.
Table 13. Summary of measurements taken during overflights at Kīlauea that show a gradual increase in the active lava lake level and the volume of lava effused since 29 September 2021. Lower activity was reported during September-October. Data collected during July-December 2022. Courtesy of HVO.
| Date: |
Level of the active lava lake (m): |
Cumulative volume of lava effused (million cubic meters): |
| 7 Jul 2022 |
130 |
95 |
| 19 Jul 2022 |
133 |
98 |
| 4 Aug 2022 |
136 |
102 |
| 16 Aug 2022 |
137 |
104 |
| 12 Sep 2022 |
143 |
111 |
| 5 Oct 2022 |
143 |
111 |
| 28 Oct 2022 |
143 |
111 |
Activity during July 2022. Lava effusions were reported from the western vent in the Halema’uma’u crater, along with occasional weak ooze-outs along the margins of the crater floor. The height of the lava lake was variable due to deflation-inflation tilt events; for example, the lake level dropped approximately 3-4 m during a summit deflation-inflation event reported on 1 July. Webcam images taken during the night of 6-12 July showed intermittent low-level spattering at the western vent that rose less than 10 m above the vent (figure 519). Measurements made during an overflight on 7 July indicated that the crater floor was infilled about 130 m and that 95 million cubic meters of lava had been effused since 29 September 2021. A single, relatively small lava ooze-out was active to the S of the lava lake. Around midnight on 8 July there were two brief periods of lava overflow onto the lake margins. On 9 July lava ooze-outs were reported near the SE and NE edges of the crater floor and during 10-11 July they occurred near the E, NE, and NW edges. On 16 July crater incandescence was reported, though the ooze-outs and spattering were not visible. On 18 July overnight webcam images showed incandescence in the western vent complex and two ooze-outs were reported around 0000 and 0200 on 19 July. By 0900 there were active ooze-outs along the SW edge of the crater floor. Measurements made from an overflight on 19 July indicated that the crater floor was infilled about 133 m and 98 million cubic meters of lava had erupted since 29 September 2021 (figure 520). On 20 July around 1600 active ooze-outs were visible along the N edge of the crater, which continued through the next day. Extensive ooze-outs occurred along the W margin during 24 July until 1900; on 26 July minor ooze-outs were noted along the N margin. Minor spattering was visible on 29 July along the E margin of the lake. The sulfur dioxide emission rates ranged 650-2,800 tons per day (t/d), the higher of which was measured on 8 July (figure 519).
Activity during August 2022. The eruption continued in the Halema’uma’u crater at the western vent. According to HVO the lava in the active lake remained at the level of the bounding levees. Occasional minor ooze-outs were observed along the margins of the crater floor. Strong nighttime crater incandescence was visible after midnight on 6 August over the western vent cone. During 6-7 August scattered small lava lobes were active along the crater floor and incandescence persisted above the western vent through 9 August. During 7-9 August HVO reported a single lava effusion source was active along the NW margin of the crater floor. Measurements from an overflight on 4 August indicated that the crater floor was infilled about 136 m total and that 102 million cubic meters of lava had been erupted since the start of the eruption. Lava breakouts were reported along the N, NE, E, S, and W margins of the crater during 10-16 August. Another overflight survey conducted on 16 August indicated that the crater floor infilled about 137 m and 104 million cubic meters of lava had been erupted since September 2021. Measured sulfur dioxide emissions rates ranged 1,150-2,450 t/d, the higher of which occurred on 8 August.
Activity during September 2022. During September, lava effusion continued from the western vent into the active lava lake and onto the crater floor. Intermittent minor ooze-outs were reported through the month. A small ooze-out was visible on the W crater floor margin at 0220 on 2 September, which showed decreasing surface activity throughout the day, but remained active through 3 September. On 3 September around 1900 a lava outbreak occurred along the NW margin of the crater floor but had stopped by the evening of 4 September. Field crews monitoring the summit lava lake on 9 September observed spattering on the NE margin of the lake that rose no higher than 10 m, before falling back onto the lava lake crust (figure 521). Overflight measurements on 12 September indicated that the crater floor was infilled a total of 143 m and 111 million cubic meters of lava had been erupted since September 2021. Extensive breakouts in the W and N part of the crater floor were reported at 1600 on 20 September and continued into 26 September. The active part of the lava lake dropped by 10 m while other parts of the crater floor dropped by several meters. Summit tiltmeters recorded a summit seismic swarm of more than 80 earthquakes during 1500-1800 on 21 September, which occurred about 1.5 km below Halema’uma’u; a majority of these were less than Mw 2. By 22 September the active part of the lava lake was infilled about 2 m. On 23 September the western vent areas exhibited several small spatter cones with incandescent openings, along with weak, sporadic spattering (figure 522). The sulfur dioxide emission rate ranged from 930 t/d to 2,000 t/d, the higher of which was measured on 6 September.
Activity during October 2022. Activity during October declined slightly compared to previous months, though lava effusions persisted from the western vent into the active lava lake and onto the crater floor during October (figure 523). Slight variations in the lava lake were noted throughout the month. HVO reported that around 0600 on 3 October the level of the lava lake has lowered slightly. Overflight measurements taken on 5 October indicated that the crater floor was infilled a total of about 143 m and that 111 million cubic meters of lava had been effused since September 2021. During 6-7 October the lake gradually rose 0.5 m. Sulfur dioxide measurements made on 22 October had an emission rate of 700 t/d. Another overflight taken on 28 October showed that there was little to no change in the elevation of the crater floor: the crater floor was infilled a total of 143 m and 111 million cubic meters of lava had erupted since the start of the eruption.
Activity during November 2022. Activity remained low during November, though HVO reported that lava from the western vent continued to effuse into the active lava lake and onto the crater floor throughout the month. The rate of sulfur dioxide emissions during November ranged from 300-600 t/d, the higher amount of which occurred on 9 November.
Activity during December 2022. Similar low activity was reported during December, with lava effusing from the western vent into the active lava lake and onto the crater floor. During 4-5 December the active part of the lava lake was slightly variable in elevation and fluctuated within 1 m. On 9 December HVO reported that lava was no longer erupting from the western vent in the Halema’uma’u crater and that sulfur dioxide emissions had returned to near pre-eruption background levels; during 10-11 December, the lava lake had completely crusted over, and no incandescence was visible (figure 524). Time lapse camera images covering the 4-10 December showed that the crater floor showed weak deflation and no inflation. Some passive events of crustal overturning were reported during 14-15 December, which brought fresh incandescent lava to the lake surface. The sulfur dioxide emission rate was approximately 200 t/d on 14 December. A smaller overturn event on 17 December and another that occurred around 0000 and into the morning of 20 December were also detected. A small seismic swarm was later detected on 30 December.
Geologic Background. Kilauea overlaps the E flank of the massive Mauna Loa shield volcano in the island of Hawaii. Eruptions are prominent in Polynesian legends; written documentation since 1820 records frequent summit and flank lava flow eruptions interspersed with periods of long-term lava lake activity at Halemaumau crater in the summit caldera until 1924. The 3 x 5 km caldera was formed in several stages about 1,500 years ago and during the 18th century; eruptions have also originated from the lengthy East and Southwest rift zones, which extend to the ocean in both directions. About 90% of the surface of the basaltic shield volcano is formed of lava flows less than about 1,100 years old; 70% of the surface is younger than 600 years. The long-term eruption from the East rift zone between 1983 and 2018 produced lava flows covering more than 100 km2, destroyed hundreds of houses, and added new coastline.
Information Contacts: Hawaiian Volcano Observatory (HVO), U.S. Geological Survey, PO Box 51, Hawai'i National Park, HI 96718, USA (URL: http://hvo.wr.usgs.gov/).
Nyamulagira (DR Congo) — November 2023 Cite this Report
Nyamulagira
DR Congo
1.408°S, 29.2°E; summit elev. 3058 m
All times are local (unless otherwise noted)
Lava flows and thermal activity during May-October 2023
Nyamulagira (also known as Nyamuragira) is a shield volcano in the Democratic Republic of Congo with the summit truncated by a small 2 x 2.3 km caldera with walls up to about 100 m high. Documented eruptions have occurred within the summit caldera, as well as from numerous flank fissures and cinder cones. The current eruption period began in April 2018 and has more recently been characterized by summit crater lava flows and thermal activity (BGVN 48:05). This report describes lava flows and variable thermal activity during May through October 2023, based on information from the Observatoire Volcanologique de Goma (OVG) and various satellite data.
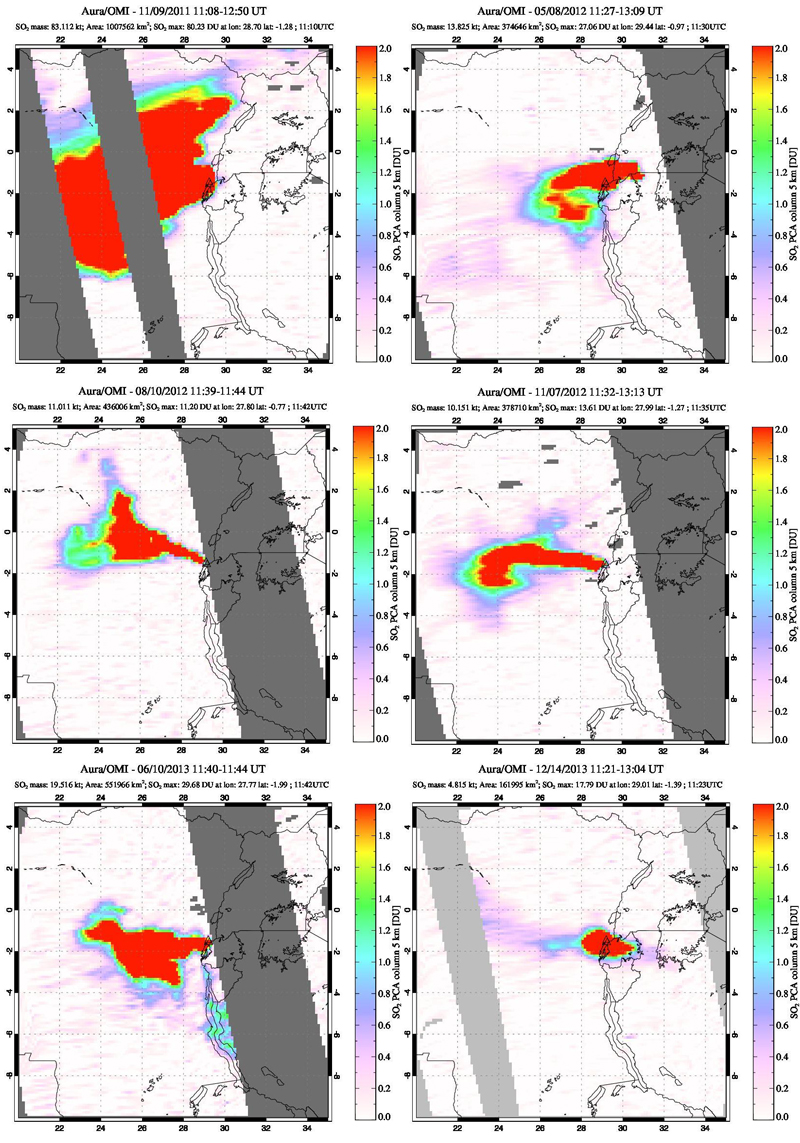
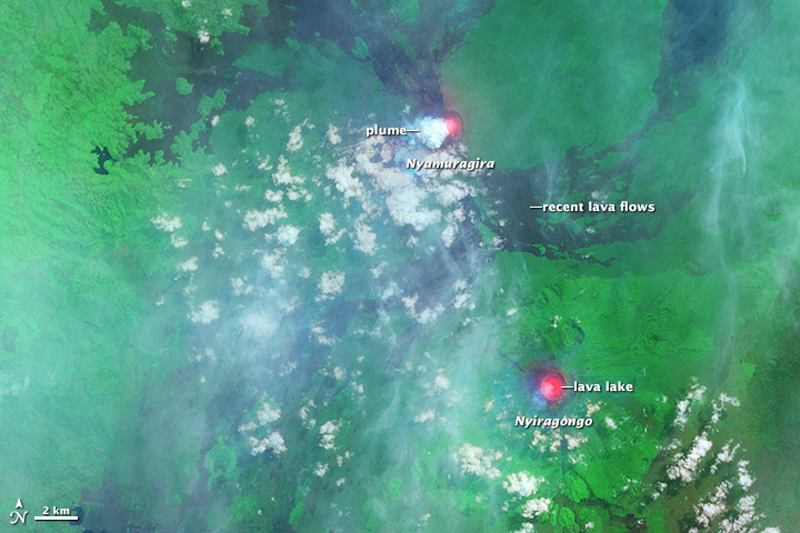
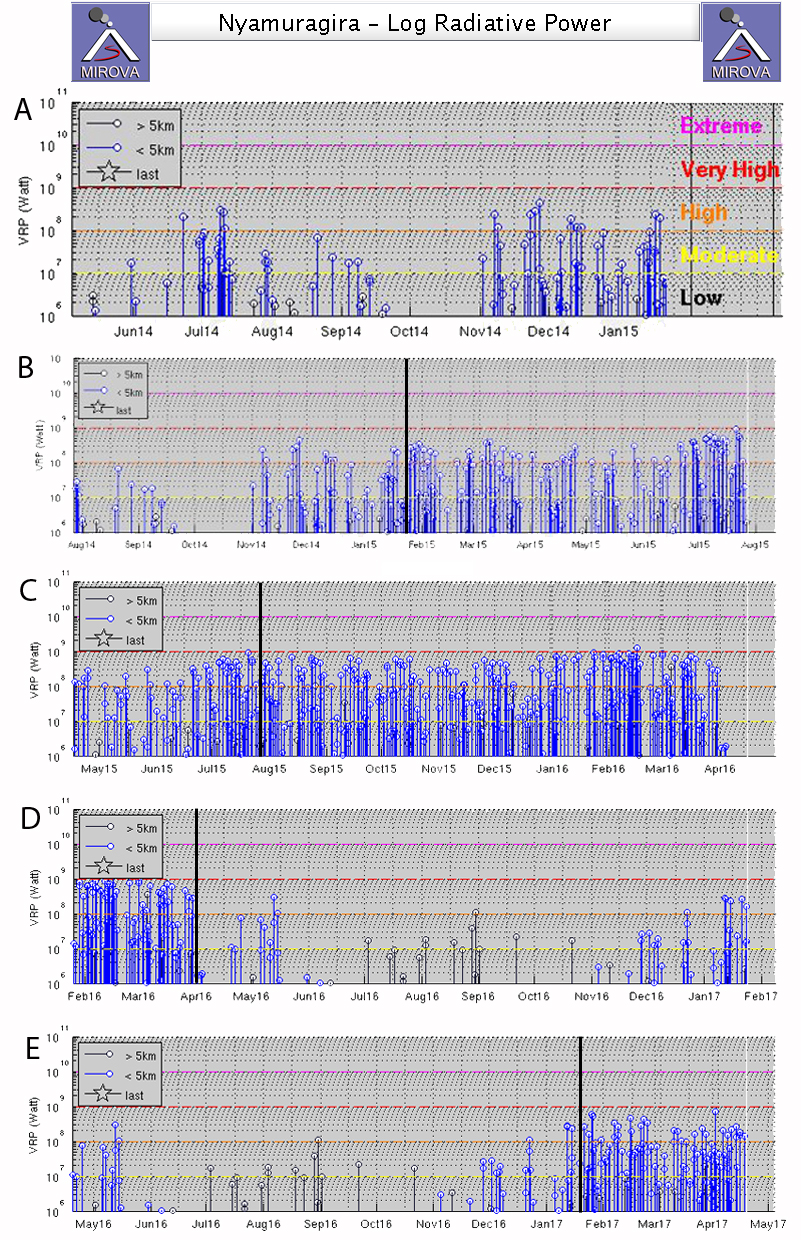
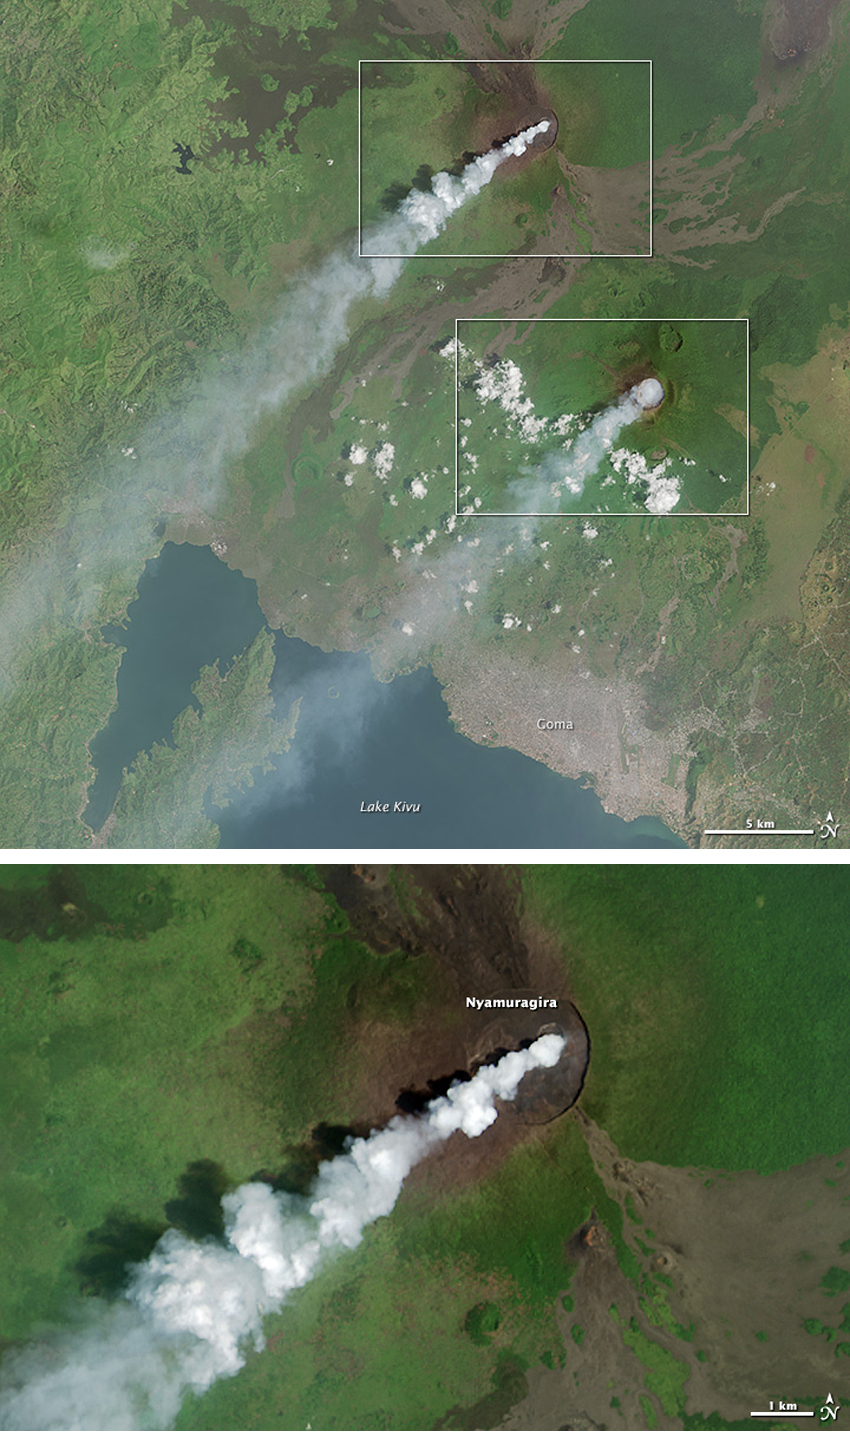
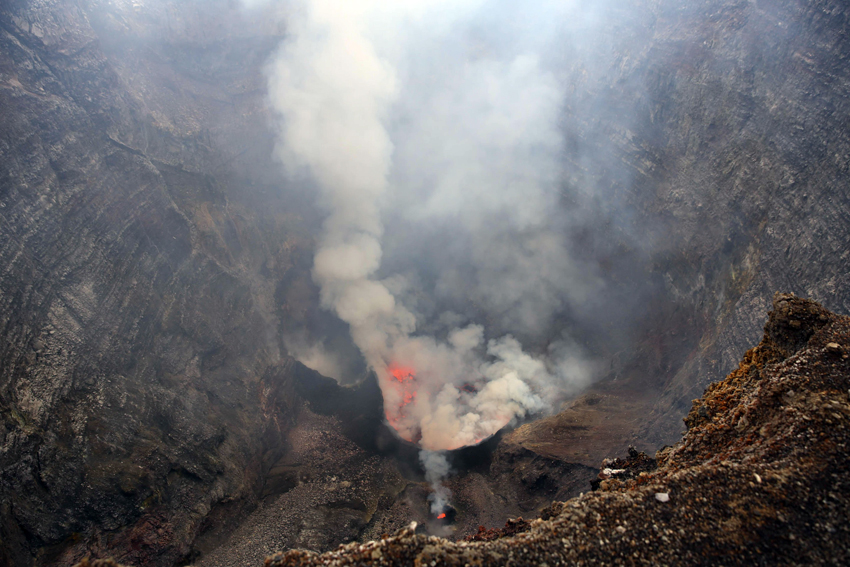
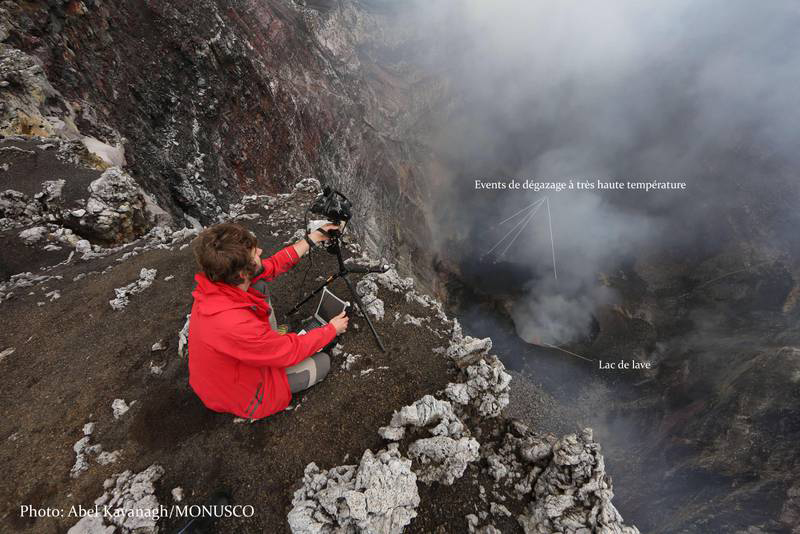
Lava lake activity continued during May. The MIROVA (Middle InfraRed Observation of Volcanic Activity) system recorded moderate-to-strong thermal activity throughout the reporting period; activity was more intense during May and October and relatively weaker from June through September (figure 95). The MODVOLC thermal algorithm, detected a total of 209 thermal alerts. There were 143 hotspots detected during May, eight during June, nine during September, and 49 during October. This activity was also reflected in infrared satellite images, where a lava flow was visible in the NW part of the crater on 7 May and strong activity was seen in the center of the crater on 4 October (figure 96). Another infrared satellite image taken on 12 May showed still active lava flows along the NW margin of the crater. According to OVG lava effusions were active during 7-29 May and moved to the N and NW parts of the crater beginning on 9 May. Strong summit crater incandescence was visible from Goma (27 km S) during the nights of 17, 19, and 20 May (figure 97). On 17 May there was an increase in eruptive activity, which peaked at 0100 on 20 May. Notable sulfur dioxide plumes drifted NW and W during 19-20 May (figure 98). Drone footage acquired in partnership with the USGS (United States Geological Survey) on 20 May captured images of narrow lava flows that traveled about 100 m down the W flank (figure 99). Data from the Rumangabo seismic station indicated a decreasing trend in activity during 17-21 May. Although weather clouds prevented clear views of the summit, a strong thermal signature on the NW flank was visible in an infrared satellite image on 22 May, based on an infrared satellite image. On 28 May the lava flows on the upper W flank began to cool and solidify. By 29 May seismicity returned to levels similar to those recorded before the 17 May increase. Lava effusion continued but was confined to the summit crater; periodic crater incandescence was observed.
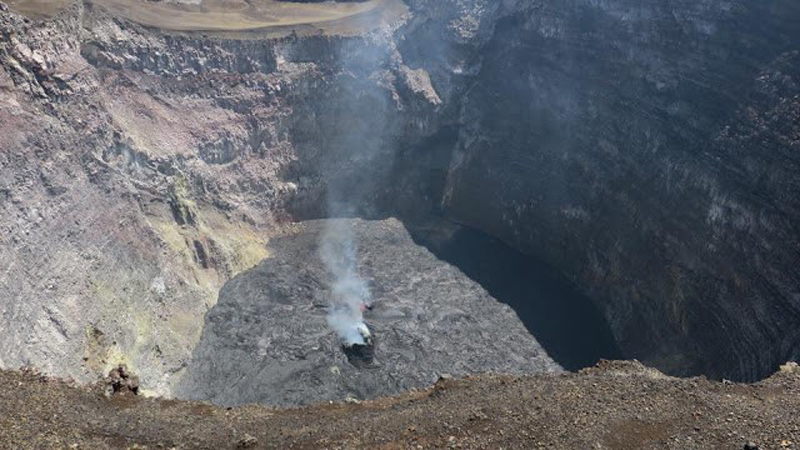
Low-level activity was noted during June through October. On 1 June OVG reported that seismicity remained at lower levels and that crater incandescence had been absent for three days, though infrared satellite imagery showed continued lava effusion in the summit crater. The lava flows on the flanks covered an estimated 0.6 km2. Satellite imagery continued to show thermal activity confined to the lava lake through October (figure 96), although no lava flows or significant sulfur dioxide emissions were reported.
Geologic Background. Africa's most active volcano, Nyamulagira (also known as Nyamuragira), is a massive high-potassium basaltic shield about 25 km N of Lake Kivu and 13 km NNW of the steep-sided Nyiragongo volcano. The summit is truncated by a small 2 x 2.3 km caldera that has walls up to about 100 m high. Documented eruptions have occurred within the summit caldera, as well as from the numerous flank fissures and cinder cones. A lava lake in the summit crater, active since at least 1921, drained in 1938, at the time of a major flank eruption. Recent lava flows extend down the flanks more than 30 km from the summit as far as Lake Kivu; extensive lava flows from this volcano have covered 1,500 km2 of the western branch of the East African Rift.
Information Contacts: Observatoire Volcanologique de Goma (OVG), Departement de Geophysique, Centre de Recherche en Sciences Naturelles, Lwiro, D.S. Bukavu, DR Congo; Hawai'i Institute of Geophysics and Planetology (HIGP) - MODVOLC Thermal Alerts System, School of Ocean and Earth Science and Technology (SOEST), Univ. of Hawai'i, 2525 Correa Road, Honolulu, HI 96822, USA (URL: http://modis.higp.hawaii.edu/); MIROVA (Middle InfraRed Observation of Volcanic Activity), a collaborative project between the Universities of Turin and Florence (Italy) supported by the Centre for Volcanic Risk of the Italian Civil Protection Department (URL: http://www.mirovaweb.it/); NASA Global Sulfur Dioxide Monitoring Page, Atmospheric Chemistry and Dynamics Laboratory, NASA Goddard Space Flight Center (NASA/GSFC), 8800 Greenbelt Road, Goddard, Maryland, USA (URL: https://so2.gsfc.nasa.gov/); Copernicus Browser, Copernicus Data Space Ecosystem, European Space Agency (URL: https://dataspace.copernicus.eu/browser/); Charles Balagizi, Goma Volcano Observatory, Departement de Geophysique, Centre de Recherche en Sciences Naturelles, Lwiro, D.S. Bukavu, DR Congo.
Bagana (Papua New Guinea) — October 2023 Cite this Report
Bagana
Papua New Guinea
6.137°S, 155.196°E; summit elev. 1855 m
All times are local (unless otherwise noted)
Explosions, ash plumes, ashfall, and lava flows during April-September 2023
The remote volcano of Bagana is located in central Bougainville Island, Papua New Guinea. Recorded eruptions date back to 1842 and activity has consisted of effusive activity that has built a small lava dome in the summit crater and occasional explosions that produced pyroclastic flows. The most recent eruption has been ongoing since February 2000 and has produced occasional explosions, ash plumes, and lava flows. More recently, activity has been characterized by ongoing effusive activity and ash emissions (BGVN 48:04). This report updates activity from April through September 2023 that has consisted of explosions, ash plumes, ashfall, and lava flows, using information from the Darwin Volcanic Ash Advisory Center (VAAC) and satellite data.
An explosive eruption was reported on 7 July that generated a large gas-and-ash plume to high altitudes and caused significant ashfall in local communities; the eruption plume had reached upper tropospheric (16-18 km altitude) altitudes by 2200, according to satellite images. Sulfur dioxide plumes were detected in satellite images on 8 July and indicated that the plume was likely a mixture of gas, ice, and ash. A report issued by the Autonomous Bougainville Government (ABG) (Torokina District, Education Section) on 10 July noted that significant ash began falling during 2000-2100 on 7 July and covered most areas in the Vuakovi, Gotana (9 km SW), Koromaketo, Laruma (25 km W) and Atsilima (27 km NW) villages. Pyroclastic flows also occurred, according to ground-based reports; small deposits confined to one drainage were inspected by RVO during an overflight on 17 July and were confirmed to be from the 7 July event. Ashfall continued until 10 July and covered vegetation, which destroyed bushes and gardens and contaminated rivers and streams.
RVO reported another eruption on 14 July. The Darwin VAAC stated that an explosive event started around 0830 on 15 July and produced an ash plume that rose to 16.5 km altitude by 1000 and drifted N, according to satellite images. The plume continued to drift N and remained visible through 1900, and by 2150 it had dissipated.
Ashfall likely from both the 7 and 15 July events impacted about 8,111 people in Torokina (20 km SW), including Tsito/Vuakovi, Gotana, Koromaketo, Kenaia, Longkogari, Kenbaki, Piva (13 km SW), and Atsinima, and in the Tsitovi district, according to ABG. Significant ashfall was also reported in Ruruvu (22 km N) in the Wakunai District of Central Bougainville, though the thickness of these deposits could not be confirmed. An evacuation was called for the villages in Wakunai, where heavy ashfall had contaminated water sources; the communities of Ruruvu, Togarau, Kakarapaia, Karauturi, Atao, and Kuritaturi were asked to evacuate to a disaster center at the Wakunai District Station, and communities in Torokina were asked to evacuate to the Piva District station. According to a news article, more than 7,000 people needed temporary accommodations, with about 1,000 people in evacuation shelters. Ashfall had deposited over a broad area, contaminating water supplies, affecting crops, and collapsing some roofs and houses in rural areas. Schools were temporarily shut down. Intermittent ash emissions continued through the end of July and drifted NNW, NW, and SW. Fine ashfall was reported on the coast of Torokina, and ash plumes also drifted toward Laruma and Atsilima.
A small explosive eruption occurred at 2130 on 28 July that ejected material from the crater vents, according to reports from Torokina, in addition to a lava flow that contained two lobes. A second explosion was detected at 2157. Incandescence from the lava flow was visible from Piva as it descended the W flank around 2000 on 29 July (figure 47). The Darwin VAAC reported that a strong thermal anomaly was visible in satellite images during 30-31 July and that ash emissions rose to 2.4 km altitude and drifted WSW on 30 July. A ground report from RVO described localized emissions at 0900 on 31 July.
The Darwin VAAC reported that ash plumes were identified in satellite imagery at 0800 and 1220 on 12 August and rose to 2.1 km and 3 km altitude and drifted NW and W, respectively. A news report stated that aid was sent to more than 6,300 people that were adversely affected by the eruption. Photos taken during 17-19 August showed ash emissions rising no higher than 1 km above the summit and drifting SE. A small explosion generated an ash plume during the morning of 19 August. Deposits from small pyroclastic flows were also captured in the photos. Satellite images captured lava flows and pyroclastic flow deposits. Two temporary seismic stations were installed near Bagana on 17 August at distances of 7 km WSW (Vakovi station) and 11 km SW (Kepox station). The Kepox station immediately started to record continuous, low-frequency background seismicity.
Satellite data. Little to no thermal activity was detected during April through mid-July 2023; only one anomaly was recorded during early April and one during early June, according to MIROVA (Middle InfraRed Observation of Volcanic Activity) data (figure 48). Thermal activity increased in both power and frequency during mid-July through September, although there were still some short gaps in detected activity. MODVOLC also detected increased thermal activity during August; thermal hotspots were detected a total of five times on 19, 20, and 27 August. Weak thermal anomalies were also captured in infrared satellite images on clear weather days throughout the reporting period on 7, 12, and 17 April, 27 May, 1, 6, 16, and 31 July, and 19 September (figure 48); a strong thermal anomaly was visible on 31 July. Distinct sulfur dioxide plumes that drifted generally NW were intermittently captured by the TROPOMI instrument on the Sentinel-5P satellite and sometimes exceeded two Dobson Units (DUs) (figure 49).
Geologic Background. Bagana volcano, in a remote portion of central Bougainville Island, is frequently active. This massive symmetrical cone was largely constructed by an accumulation of viscous andesitic lava flows. The entire edifice could have been constructed in about 300 years at its present rate of lava production. Eruptive activity is characterized by non-explosive effusion of viscous lava that maintains a small lava dome in the summit crater, although occasional explosive activity produces pyroclastic flows. Lava flows with tongue-shaped lobes up to 50 m thick and prominent levees descend the flanks on all sides.
Information Contacts: Rabaul Volcano Observatory (RVO), Geohazards Management Division, Department of Mineral Policy and Geohazards Management (DMPGM), PO Box 3386, Kokopo, East New Britain Province, Papua New Guinea; Darwin Volcanic Ash Advisory Centre (VAAC), Bureau of Meteorology, Northern Territory Regional Office, PO Box 40050, Casuarina, NT 0811, Australia (URL: http://www.bom.gov.au/info/vaac/); MIROVA (Middle InfraRed Observation of Volcanic Activity), a collaborative project between the Universities of Turin and Florence (Italy) supported by the Centre for Volcanic Risk of the Italian Civil Protection Department (URL: http://www.mirovaweb.it/); Hawai'i Institute of Geophysics and Planetology (HIGP) - MODVOLC Thermal Alerts System, School of Ocean and Earth Science and Technology (SOEST), Univ. of Hawai'i, 2525 Correa Road, Honolulu, HI 96822, USA (URL: http://modis.higp.hawaii.edu/); NASA Global Sulfur Dioxide Monitoring Page, Atmospheric Chemistry and Dynamics Laboratory, NASA Goddard Space Flight Center (NASA/GSFC), 8800 Greenbelt Road, Goddard, Maryland, USA (URL: https://so2.gsfc.nasa.gov/); Copernicus Browser, Copernicus Data Space Ecosystem, European Space Agency (URL: https://dataspace.copernicus.eu/browser/); Autonomous Bougainville Government, P.O Box 322, Buka, AROB, PNG (URL: https://abg.gov.pg/); Andrew Tupper (Twitter: @andrewcraigtupp); Simon Carn, Geological and Mining Engineering and Sciences, Michigan Technological University, 1400 Townsend Drive, Houghton, MI 49931, USA (URL: http://www.volcarno.com/, Twitter: @simoncarn); Radio NZ (URL: https://www.rnz.co.nz/news/pacific/494464/more-than-7-000-people-in-bougainville-need-temporary-accommodation-after-eruption); USAID, 1300 Pennsylvania Ave, NW, Washington DC 20004, USA (URL: https://www.usaid.gov/pacific-islands/press-releases/aug-08-2023-united-states-provides-immediate-emergency-assistance-support-communities-affected-mount-bagana-volcanic-eruptions).
Mayon (Philippines) — October 2023 Cite this Report
Mayon
Philippines
13.257°N, 123.685°E; summit elev. 2462 m
All times are local (unless otherwise noted)
Lava flows, pyroclastic flows, ash emissions, and seismicity during April-September 2023
Mayon is located in the Philippines and has steep upper slopes capped by a small summit crater. Historical eruptions date back to 1616 CE that have been characterized by Strombolian eruptions, lava flows, pyroclastic flows, and mudflows. Eruptions mostly originated from a central conduit. Pyroclastic flows and mudflows have commonly descended many of the approximately 40 drainages that surround the volcano. The most recent eruption occurred during June through October 2022 and consisted of lava dome growth and gas-and-steam emissions (BGVN 47:12). A new eruption was reported during late April 2023 and has included lava flows, pyroclastic density currents, ash emissions, and seismicity. This report covers activity during April through September 2023 based on daily bulletins from the Philippine Institute of Volcanology and Seismology (PHIVOLCS).
During April through September 2023, PHIVOLCS reported near-daily rockfall events, frequent volcanic earthquakes, and sulfur dioxide measurements. Gas-and-steam emissions rose 100-900 m above the crater and drifted in different directions. Nighttime crater incandescence was often visible during clear weather and was accompanied by incandescent avalanches of material. Activity notably increased during June when lava flows were reported on the S, SE, and E flanks (figure 52). The MIROVA graph (Middle InfraRed Observation of Volcanic Activity) showed strong thermal activity coincident with these lava flows, which remained active through September (figure 53). According to the MODVOLC thermal algorithm, a total of 110 thermal alerts were detected during the reporting period: 17 during June, 40 during July, 27 during August, and 26 during September. During early June, pyroclastic density currents (PDCs) started to occur more frequently.
Low activity was reported during much of April and May; gas-and-steam emissions rose 100-900 m above the crater and generally drifted in different directions. A total of 52 rockfall events and 18 volcanic earthquakes were detected during April and 147 rockfall events and 13 volcanic events during May. Sulfur dioxide flux measurements ranged between 400-576 tons per day (t/d) during April, the latter of which was measured on 29 April and between 162-343 t/d during May, the latter of which was measured on 13 May.
Activity during June increased, characterized by lava flows, pyroclastic density currents (PDCs), crater incandescence and incandescent rockfall events, gas-and-steam emissions, and continued seismicity. Weather clouds often prevented clear views of the summit, but during clear days, moderate gas-and-steam emissions rose 100-2,500 m above the crater and drifted in multiple directions. A total of 6,237 rockfall events and 288 volcanic earthquakes were detected. The rockfall events often deposited material on the S and SE flanks within 700-1,500 m of the summit crater and ash from the events drifted SW, S, SE, NE, and E. Sulfur dioxide emissions ranged between 149-1,205 t/d, the latter of which was measured on 10 June. Short-term observations from EDM and electronic tiltmeter monitoring indicated that the upper slopes were inflating since February 2023. Longer-term ground deformation parameters based on EDM, precise leveling, continuous GPS, and electronic tilt monitoring indicated that the volcano remained inflated, especially on the NW and SE flanks. At 1000 on 5 June the Volcano Alert Level (VAL) was raised to 2 (on a 0-5 scale). PHIVOLCS noted that although low-level volcanic earthquakes, ground deformation, and volcanic gas emissions indicated unrest, the steep increase in rockfall frequency may indicate increased dome activity.
A total of 151 dome-collapse PDCs occurred during 8-9 and 11-30 June, traveled 500-2,000 m, and deposited material on the S flank within 2 km of the summit crater. During 8-9 June the VAL was raised to 3. At approximately 1947 on 11 June lava flow activity was reported; two lobes traveled within 500 m from the crater and deposited material on the S (Mi-isi), SE (Bonga), and E (Basud) flanks. Weak seismicity accompanied the lava flow and slight inflation on the upper flanks. This lava flow remained active through 30 June, moving down the S and SE flank as far as 2.5 km and 1.8 km, respectively and depositing material up to 3.3 km from the crater. During 15-16 June traces of ashfall from the PDCs were reported in Sitio Buga, Nabonton, City of Ligao and Purok, and San Francisco, Municipality of Guinobatan. During 28-29 June there were two PDCs generated by the collapse of the lava flow front, which generated a light-brown ash plume 1 km high. Satellite monitors detected significant concentrations of sulfur dioxide beginning on 29 June. On 30 June PDCs primarily affected the Basud Gully on the E flank, the largest of which occurred at 1301 and lasted eight minutes, based on the seismic record. Four PDCs generated between 1800 and 2000 that lasted approximately four minutes each traveled 3-4 km on the E flank and generated an ash plume that rose 1 km above the crater and drifted N and NW. Ashfall was recorded in Tabaco City.
Similar strong activity continued during July; slow lava effusion remained active on the S and SE flanks and traveled as far as 2.8 km and 2.8 km, respectively and material was deposited as far as 4 km from the crater. There was a total of 6,983 rockfall events and 189 PDCs that affected the S, SE, and E flanks. The volcano network detected a total of 2,124 volcanic earthquakes. Continuous gas-and-steam emissions rose 200-2,000 m above the crater and drifted in multiple directions. Sulfur dioxide emissions averaged 792-4,113 t/d, the latter of which was measured on 28 July. During 2-4 July three PDCs were generated from the collapse of the lava flow and resulting light brown plumes rose 200-300 m above the crater. Continuous tremor pulses were reported beginning at 1547 on 3 July through 7 July at 1200, at 2300 on 8 July and going through 0300 on 10 July, and at 2300 on 16 July, as recorded by the seismic network. During 6-9 July there were 10 lava flow-collapse-related PDCs that generated light brown plumes 300-500 m above the crater. During 10-11 July light ashfall was reported in some areas of Mabinit, Legazpi City, Budiao and Salvacion, Daraga, and Camalig, Albay. By 18 July the lava flow advanced 600 m on the E flank as well.
During 1733 on 18 July and 0434 on 19 July PHIVOLCS reported 30 “ashing” events, which are degassing events accompanied by audible thunder-like sounds and entrained ash at the crater, which produced short, dark plumes that drifted SW. These events each lasted 20-40 seconds, and plume heights ranged from 150-300 m above the crater, as recorded by seismic, infrasound, visual, and thermal monitors. Three more ashing events occurred during 19-20 July. Short-term observations from electronic tilt and GPS monitoring indicate deflation on the E lower flanks in early July and inflation on the NW middle flanks during the third week of July. Longer-term ground deformation parameters from EDM, precise leveling, continuous GPS, and electronic tilt monitoring indicated that the volcano was still generally inflated relative to baseline levels. A short-lived lava pulse lasted 28 seconds at 1956 on 21 July, which was accompanied by seismic and infrasound signals. By 22 July, the only lava flow that remained active was on the SE flank, and continued to extend 3.4 km, while those on the S and E flanks weakened markedly. One ashing event was detected during 30-31 July, whereas there were 57 detected during 31 July-1 August; according to PHIVOLCS beginning at approximately 1800 on 31 July eruptive activity was dominated by phases of intermittent ashing, as well as increased in the apparent rates of lava effusion from the summit crater. The ashing phases consisted of discrete events recorded as low-frequency volcanic earthquakes (LFVQ) typically 30 seconds in duration, based on seismic and infrasound signals. Gray ash plume rose 100 m above the crater and generally drifted NE. Shortly after these ashing events began, new lava began to effuse rapidly from the crater, feeding the established flowed on the SE, E, and E flanks and generating frequent rockfall events.
Intensified unrest persisted during August. There was a total of 4,141 rockfall events, 2,881 volcanic earthquakes, which included volcanic tremor events, 32 ashing events, and 101 PDCs detected throughout the month. On clear weather days, gas-and-steam emissions rose 300-1,500 m above the crater and drifted in different directions (figure 54). Sulfur dioxide emissions averaged 735-4,756 t/d, the higher value of which was measured on 16 August. During 1-2 August the rate of lava effusion decreased, but continued to feed the flows on the SE, S, and E flanks, maintaining their advances to 3.4 km, 2.8 km, and 1.1 km from the crater, respectively (figure 55). Rockfall and PDCs generated by collapses at the lava flow margins and from the summit dome deposited material within 4 km of the crater. During 3-4 August there were 10 tremor events detected that lasted 1-4 minutes. Short-lived lava pulse lasted 35 seconds and was accompanied by seismic and infrasound signals at 0442 on 6 August. Seven collapses were recorded at the front of the lava flow during 12-14 August.
During September, similar activity of slow lava effusion, PDCs, gas-and-steam emissions, and seismicity continued. There was a total of 4,452 rockfall events, 329 volcanic earthquakes, which included volcanic tremor events, two ashing events, and 85 PDCs recorded throughout the month. On clear weather days, gas-and-steam emissions rose 100-1,500 m above the crater and drifted in multiple directions. Sulfur dioxide emissions averaged 609-2,252 t/d, the higher average of which was measured on 6 September. Slow lava effusion continued advancing on the SE, S, and E flanks, maintaining lengths of 3.4 km, 2.8 km, and 1.1 km, respectively. Rockfall and PDC events generated by collapses along the lava flow margins and at the summit dome deposited material within 4 km of the crater.
Geologic Background. Symmetrical Mayon, which rises above the Albay Gulf NW of Legazpi City, is the most active volcano of the Philippines. The steep upper slopes are capped by a small summit crater. Recorded eruptions since 1616 CE range from Strombolian to basaltic Plinian, with cyclical activity beginning with basaltic eruptions, followed by longer periods of andesitic lava flows. Eruptions occur predominately from the central conduit and have also produced lava flows that travel far down the flanks. Pyroclastic density currents and mudflows have commonly swept down many of the approximately 40 ravines that radiate from the summit and have often damaged populated lowland areas. A violent eruption in 1814 killed more than 1,200 people and devastated several towns.
Information Contacts: Philippine Institute of Volcanology and Seismology (PHIVOLCS), Department of Science and Technology, University of the Philippines Campus, Diliman, Quezon City, Philippines (URL: http://www.phivolcs.dost.gov.ph/); MIROVA (Middle InfraRed Observation of Volcanic Activity), a collaborative project between the Universities of Turin and Florence (Italy) supported by the Centre for Volcanic Risk of the Italian Civil Protection Department (URL: http://www.mirovaweb.it/); Hawai'i Institute of Geophysics and Planetology (HIGP) - MODVOLC Thermal Alerts System, School of Ocean and Earth Science and Technology (SOEST), Univ. of Hawai'i, 2525 Correa Road, Honolulu, HI 96822, USA (URL: http://modis.higp.hawaii.edu/); Copernicus Browser, Copernicus Data Space Ecosystem, European Space Agency (URL: https://dataspace.copernicus.eu/browser/); William Rogers, Legazpi City, Albay Province, Philippines.
Nishinoshima (Japan) — October 2023 Cite this Report
Nishinoshima
Japan
27.247°N, 140.874°E; summit elev. 100 m
All times are local (unless otherwise noted)
Eruption plumes and gas-and-steam plumes during May-August 2023
Nishinoshima, located about 1,000 km S of Tokyo, is a small island in the Ogasawara Arc in Japan. The island is the summit of a massive submarine volcano that has prominent submarine peaks to the S, W, and NE. Eruptions date back to 1973 and the current eruption period began in October 2022. Recent activity has consisted of small ash plumes and fumarolic activity (BGVN 48:07). This report covers activity during May through August 2023, using information from monthly reports of the Japan Meteorological Agency (JMA) monthly reports and satellite data.
Activity during May through June was relatively low. The Japan Coast Guard (JCG) did overflights on 14 and 22 June and reported white gas-and-steam emissions rising 600 m and 1,200 m from the central crater of the pyroclastic cone, respectively (figure 125). In addition, multiple white gas-and-steam emissions rose from the inner rim of the W side of the crater and from the SE flank of the pyroclastic cone. Discolored brown-to-green water was observed around almost the entire perimeter of the island; on 22 June light green discolored water was observed off the S coast of the island.
Observations from the Himawari meteorological satellite confirmed an eruption on 9 and 10 July. An eruption plume rose 1.6 km above the crater and drifted N around 1300 on 9 July. Satellite images acquired at 1420 and 2020 on 9 July and at 0220 on 10 July showed continuing emissions that rose 1.3-1.6 km above the crater and drifted NE and N. The Tokyo VAAC reported that an ash plume seen by a pilot and identified in a satellite image at 0630 on 21 July rose to 3 km altitude and drifted S.
Aerial observations conducted by JCG on 8 August showed a white-and-gray plume rising from the central crater of the pyroclastic cone, and multiple white gas-and-steam emissions were rising from the inner edge of the western crater and along the NW-SE flanks of the island (figure 126). Brown-to-green discolored water was also noted around the perimeter of the island.
Intermittent low-to-moderate power thermal anomalies were recorded in the MIROVA graph (Middle InfraRed Observation of Volcanic Activity), showing an increase in both frequency and power beginning in July (figure 127). This increase in activity coincides with eruptive activity on 9 and 10 July, characterized by eruption plumes. According to the MODVOLC thermal alert algorithm, one thermal hotspot was recorded on 20 July. Weak thermal anomalies were also detected in infrared satellite imagery, accompanied by strong gas-and-steam plumes (figure 128).
Geologic Background. The small island of Nishinoshima was enlarged when several new islands coalesced during an eruption in 1973-74. Multiple eruptions that began in 2013 completely covered the previous exposed surface and continued to enlarge the island. The island is the summit of a massive submarine volcano that has prominent peaks to the S, W, and NE. The summit of the southern cone rises to within 214 m of the ocean surface 9 km SSE.
Information Contacts: Japan Meteorological Agency (JMA), 1-3-4 Otemachi, Chiyoda-ku, Tokyo 100-8122, Japan (URL: http://www.jma.go.jp/jma/indexe.html); Tokyo Volcanic Ash Advisory Center (VAAC), 1-3-4 Otemachi, Chiyoda-ku, Tokyo 100-8122, Japan (URL: http://ds.data.jma.go.jp/svd/vaac/data/); MIROVA (Middle InfraRed Observation of Volcanic Activity), a collaborative project between the Universities of Turin and Florence (Italy) supported by the Centre for Volcanic Risk of the Italian Civil Protection Department (URL: http://www.mirovaweb.it/); Copernicus Browser, Copernicus Data Space Ecosystem, European Space Agency (URL: https://dataspace.copernicus.eu/browser/).
Krakatau (Indonesia) — October 2023 Cite this Report
Krakatau
Indonesia
6.1009°S, 105.4233°E; summit elev. 285 m
All times are local (unless otherwise noted)
White gas-and-steam plumes and occasional ash plumes during May-August 2023
Krakatau is located in the Sunda Strait between Java and Sumatra, Indonesia. Caldera collapse during the catastrophic 1883 eruption destroyed Danan and Perbuwatan cones and left only a remnant of Rakata. The post-collapse cone of Anak Krakatau (Child of Krakatau) was constructed within the 1883 caldera at a point between the former Danan and Perbuwatan cones; it has been the site of frequent eruptions since 1927. The current eruption period began in May 2021 and has recently consisted of Strombolian eruptions and ash plumes (BGVN 48:07). This report describes lower levels of activity consisting of ash and white gas-and-steam plumes during May through August 2023, based on information provided by the Indonesian Center for Volcanology and Geological Hazard Mitigation, referred to as Pusat Vulkanologi dan Mitigasi Bencana Geologi (PVMBG), MAGMA Indonesia, and satellite data.
Activity was relatively low during May and June. Daily white gas-and-steam emissions rose 25-200 m above the crater and drifted in different directions. Five ash plumes were detected at 0519 on 10 May, 1241 on 11 May, 0920 on 12 May, 2320 on 12 May, and at 0710 on 13 May, and rose 1-2.5 km above the crater and drifted SW. A webcam image taken on 12 May showed ejection of incandescent material above the vent. A total of nine ash plumes were detected during 6-11 June: at 1434 and 00220 on 6 and 7 June the ash plumes rose 500 m above the crater and drifted NW, at 1537 on 8 June the ash plume rose 1 km above the crater and drifted SW, at 0746 and at 0846 on 9 June the ash plumes rose 800 m and 3 km above the crater and drifted SW, respectively, at 0423, 1431, and 1750 on 10 June the ash plumes rose 2 km, 1.5 km, and 3.5 km above the crater and drifted NW, respectively, and at 0030 on 11 June an ash plume rose 2 km above the crater and drifted NW. Webcam images taken on 10 and 11 June at 0455 and 0102, respectively, showed incandescent material ejected above the vent. On 19 June an ash plume at 0822 rose 1.5 km above the crater and drifted SE.
Similar low activity of white gas-and-steam emissions and few ash plumes were reported during July and August. Daily white gas-and-steam emissions rose 25-300 m above the crater and drifted in multiple directions. Three ash plumes were reported at 0843, 0851, and 0852 on 20 July that rose 500-2,000 m above the crater and drifted NW.
The MIROVA (Middle InfraRed Observation of Volcanic Activity) graph of MODIS thermal anomaly data showed intermittent low-to-moderate power thermal anomalies during May through August 2023 (figure 140). Although activity was often obscured by weather clouds, a thermal anomaly was visible in an infrared satellite image of the crater on 12 May, accompanied by an eruption plume that drifted SW (figure 141).
Geologic Background. The renowned Krakatau (frequently mis-named as Krakatoa) volcano lies in the Sunda Strait between Java and Sumatra. Collapse of an older edifice, perhaps in 416 or 535 CE, formed a 7-km-wide caldera. Remnants of that volcano are preserved in Verlaten and Lang Islands; subsequently the Rakata, Danan, and Perbuwatan cones were formed, coalescing to create the pre-1883 Krakatau Island. Caldera collapse during the catastrophic 1883 eruption destroyed Danan and Perbuwatan, and left only a remnant of Rakata. This eruption caused more than 36,000 fatalities, most as a result of tsunamis that swept the adjacent coastlines of Sumatra and Java. Pyroclastic surges traveled 40 km across the Sunda Strait and reached the Sumatra coast. After a quiescence of less than a half century, the post-collapse cone of Anak Krakatau (Child of Krakatau) was constructed within the 1883 caldera at a point between the former Danan and Perbuwatan cones. Anak Krakatau has been the site of frequent eruptions since 1927.
Information Contacts: Pusat Vulkanologi dan Mitigasi Bencana Geologi (PVMBG, also known as Indonesian Center for Volcanology and Geological Hazard Mitigation, CVGHM), Jalan Diponegoro 57, Bandung 40122, Indonesia (URL: http://www.vsi.esdm.go.id/); MAGMA Indonesia, Kementerian Energi dan Sumber Daya Mineral (URL: https://magma.esdm.go.id/v1); MIROVA (Middle InfraRed Observation of Volcanic Activity), a collaborative project between the Universities of Turin and Florence (Italy) supported by the Centre for Volcanic Risk of the Italian Civil Protection Department (URL: http://www.mirovaweb.it/); Copernicus Browser, Copernicus Data Space Ecosystem, European Space Agency (URL: https://dataspace.copernicus.eu/browser/).
Villarrica (Chile) — October 2023 Cite this Report
Villarrica
Chile
39.42°S, 71.93°W; summit elev. 2847 m
All times are local (unless otherwise noted)
Strombolian activity, gas-and-ash emissions, and crater incandescence during April-September 2023
Villarrica, in central Chile, consists of a 2-km-wide caldera that formed about 3,500 years ago and is located at the base of the presently active cone at the NW margin of a 6-km-wide caldera. Historical eruptions eruptions date back to 1558 and have been characterized by mild-to-moderate explosive activity with occasional lava effusions. The current eruption period began in December 2014 and has recently consisted of nighttime crater incandescence, ash emissions, and seismicity (BGVN 48:04). This report covers activity during April through September 2023 and describes occasional Strombolian activity, gas-and-ash emissions, and nighttime crater incandescence. Information for this report primarily comes from the Southern Andes Volcano Observatory (Observatorio Volcanológico de Los Andes del Sur, OVDAS), part of Chile's National Service of Geology and Mining (Servicio Nacional de Geología y Minería, SERNAGEOMIN) and satellite data.
Seismicity during April consisted of long period (LP) events and tremor (TRE); a total of 9,413 LP-type events and 759 TR-type events were detected throughout the month. Nighttime crater incandescence persisted and was visible in the degassing column. Sulfur dioxide data was obtained using Differential Absorption Optical Spectroscopy Equipment (DOAS) that showed an average value of 1,450 ± 198 tons per day (t/d) during 1-15 April and 1,129 ± 201 t/d during 16-30 April, with a maximum daily value of 2,784 t/d on 9 April. Gas-and-steam emissions of variable intensities rose above the active crater as high as 1.3 km above the crater on 13 April. Strombolian explosions were not observed and there was a slight decrease in the lava lake level.
There were 14,123 LP-type events and 727 TR-type events detected during May. According to sulfur dioxide measurements taken with DOAS equipment, the active crater emitted an average value of 1,826 ± 482 t/d during 1-15 May and 912 ± 41 t/d during 16-30 May, with a daily maximum value of 5,155 t/d on 13 May. Surveillance cameras showed continuous white gas-and-steam emissions that rose as high as 430 m above the crater on 27 May. Nighttime incandescence illuminated the gas column less than 300 m above the crater rim was and no pyroclastic emissions were reported. A landslide was identified on 13 May on the E flank of the volcano 50 m from the crater rim and extending 300 m away; SERNAGEOMIN noted that this event may have occurred on 12 May. During the morning of 27 and 28 May minor Strombolian explosions characterized by incandescent ejecta were recorded at the crater rim; the last reported Strombolian explosions had occurred at the end of March.
Seismic activity during June consisted of five volcano-tectonic (VT)-type events, 21,606 LP-type events, and 2,085 TR-type events. The average value of sulfur dioxide flux obtained by DOAS equipment was 1,420 ± 217 t/d during 1-15 June and 2,562 ± 804 t/d, with a maximum daily value of 4,810 t/d on 17 June. White gas-and-steam emissions rose less than 480 m above the crater; frequent nighttime crater incandescence was reflected in the degassing plume. On 12 June an emission rose 100 m above the crater and drifted NNW. On 15 June one or several emissions resulted in ashfall to the NE as far as 5.5 km from the crater, based on a Skysat satellite image. Several Strombolian explosions occurred within the crater; activity on 15 June was higher energy and ejected blocks 200-300 m on the NE slope. Surveillance cameras showed white gas-and-steam emissions rising 480 m above the crater on 16 June. On 19 and 24 June low-intensity Strombolian activity was observed, ejecting material as far as 200 m from the center of the crater to the E.
During July, seismicity included 29,319 LP-type events, 3,736 TR-type events, and two VT-type events. DOAS equipment recorded two days of sulfur dioxide emissions of 4,220 t/d and 1,009 t/d on 1 and 13 July, respectively. Constant nighttime incandescence was also recorded and was particularly noticeable when accompanied by eruptive columns on 12 and 16 July. Minor explosive events were detected in the crater. According to Skysat satellite images taken on 12, 13, and 16 July, ashfall deposits were identified 155 m S of the crater. According to POVI, incandescence was visible from two vents on the crater floor around 0336 on 12 July. Gas-and-ash emissions rose as high as 1.2 km above the crater on 13 July and drifted E and NW. A series of gas-and-steam pulses containing some ash deposited material on the upper E flank around 1551 on 13 July. During 16-31 July, average sulfur dioxide emissions of 1,679 ± 406 t/d were recorded, with a maximum daily value of 2,343 t/d on 28 July. Fine ash emissions were also reported on 16, 17, and 23 July.
Seismicity persisted during August, characterized by 27,011 LP-type events, 3,323 TR-type events, and three VT-type events. The average value of sulfur dioxide measurements taken during 1-15 August was 1,642 ± 270 t/d and 2,207 ± 4,549 t/d during 16-31 August, with a maximum daily value of 3,294 t/d on 27 August. Nighttime crater incandescence remained visible in degassing columns. White gas-and-steam emissions rose 480 m above the crater on 6 August. According to a Skysat satellite image from 6 August, ash accumulation was observed proximal to the crater and was mainly distributed toward the E slope. White gas-and-steam emissions rose 320 m above the crater on 26 August. Nighttime incandescence and Strombolian activity that generated ash emissions were reported on 27 August.
Seismicity during September was characterized by five VT-type events, 12,057 LP-type events, and 2,058 TR-type events. Nighttime incandescence persisted. On 2 September an ash emission rose 180 m above the crater and drifted SE at 1643 (figure 125) and a white gas-and-steam plume rose 320 m above the crater. According to the Buenos Aires VAAC, periods of continuous gas-and-ash emissions were visible in webcam images from 1830 on 2 September to 0110 on 3 September. Strombolian activity was observed on 2 September and during the early morning of 3 September, the latter event of which generated an ash emission that rose 60 m above the crater and drifted 100 m from the center of the crater to the NE and SW. Ashfall was reported to the SE and S as far as 750 m from the crater. The lava lake was active during 3-4 September and lava fountaining was visible for the first time since 26 March 2023, according to POVI. Fountains captured in webcam images at 2133 on 3 September and at 0054 on 4 September rose as high as 60 m above the crater rim and ejected material onto the upper W flank. Sulfur dioxide flux of 1,730 t/d and 1,281 t/d was measured on 3 and 4 September, respectively, according to data obtained by DOAS equipment.
Strong Strombolian activity and larger gas-and-ash plumes were reported during 18-20 September. On 18 September activity was also associated with energetic LP-type events and notable sulfur dioxide fluxes (as high as 4,277 t/d). On 19 September Strombolian activity and incandescence were observed. On 20 September at 0914 ash emissions rose 50 m above the crater and drifted SSE, accompanied by Strombolian activity that ejected material less than 100 m SSE, causing fall deposits on that respective flank. SERNAGEOMIN reported that a Planet Scope satellite image taken on 20 September showed the lava lake in the crater, measuring 32 m x 35 m and an area of 0.001 km2. Several ash emissions were recorded at 0841, 0910, 1251, 1306, 1312, 1315, and 1324 on 23 September and rose less than 150 m above the crater. The sulfur dioxide flux value was 698 t/d on 23 September and 1,097 t/d on 24 September. On 24 September the Volcanic Alert Level (VAL) was raised to Orange (the third level on a four-color scale). SENAPRED maintained the Alert Level at Yellow (the middle level on a three-color scale) for the communities of Villarrica, Pucón (16 km N), Curarrehue, and Panguipulli.
During 24-25 September there was an increase in seismic energy (observed at TR-events) and acoustic signals, characterized by 1 VT-type event, 213 LP-type events, and 124 TR-type events. Mainly white gas-and-steam emissions, in addition to occasional fine ash emissions were recorded. During the early morning of 25 September Strombolian explosions were reported and ejected material 250 m in all directions, though dominantly toward the NW. On 25 September the average value of sulfur dioxide flux was 760 t/d. Seismicity during 25-30 September consisted of five VT-type events, 1,937 LP-type events, and 456 TR-type events.
During 25-29 September moderate Strombolian activity was observed and ejected material as far as the crater rim. In addition, ash pulses lasting roughly 50 minutes were observed around 0700 and dispersed ENE. During 26-27 September a TR episode lasted 6.5 hours and was accompanied by discrete acoustic signals. Satellite images from 26 September showed a spatter cone on the crater floor with one vent that measured 10 x 14 m and a smaller vent about 35 m NE of the cone. SERNAGEOMIN reported an abundant number of bomb-sized blocks up to 150 m from the crater, as well as impact marks on the snow, which indicated explosive activity. A low-altitude ash emission was observed drifting NW around 1140 on 28 September, based on webcam images. Between 0620 and 0850 on 29 September an ash emission rose 60 m above the crater and drifted NW. During an overflight taken around 1000 on 29 September scientists observed molten material in the vent, a large accumulation of pyroclasts inside the crater, and energetic degassing, some of which contained a small amount of ash. Block-sized pyroclasts were deposited on the internal walls and near the crater, and a distal ash deposit was also visible. The average sulfur dioxide flux measured on 28 September was 344 t/d. Satellite images taken on 29 September ashfall was deposited roughly 3 km WNW from the crater and nighttime crater incandescence remained visible. The average sulfur dioxide flux value from 29 September was 199 t/d. On 30 September at 0740 a pulsating ash emission rose 1.1 km above the crater and drifted NNW (figure 126). Deposits on the S flank extended as far as 4.5 km from the crater rim, based on satellite images from 30 September.
Infrared MODIS satellite data processed by MIROVA (Middle InfraRed Observation of Volcanic Activity) showed intermittent thermal activity during April through September, with slightly stronger activity detected during late September (figure 127). Small clusters of thermal activity were detected during mid-June, early July, early August, and late September. According to the MODVOLC thermal alert system, a total of four thermal hotspots were detected on 7 July and 3 and 23 September. This activity was also intermittently captured in infrared satellite imagery on clear weather days (figure 128).
Geologic Background. The glacier-covered Villarrica stratovolcano, in the northern Lakes District of central Chile, is ~15 km south of the city of Pucon. A 2-km-wide caldera that formed about 3,500 years ago is located at the base of the presently active, dominantly basaltic to basaltic andesite cone at the NW margin of a 6-km-wide Pleistocene caldera. More than 30 scoria cones and fissure vents are present on the flanks. Plinian eruptions and pyroclastic flows that have extended up to 20 km from the volcano were produced during the Holocene. Lava flows up to 18 km long have issued from summit and flank vents. Eruptions documented since 1558 CE have consisted largely of mild-to-moderate explosive activity with occasional lava effusion. Glaciers cover 40 km2 of the volcano, and lahars have damaged towns on its flanks.
Information Contacts: Servicio Nacional de Geología y Minería (SERNAGEOMIN), Observatorio Volcanológico de Los Andes del Sur (OVDAS), Avda Sta María No. 0104, Santiago, Chile (URL: http://www.sernageomin.cl/); Proyecto Observación Villarrica Internet (POVI) (URL: http://www.povi.cl/); Sistema y Servicio Nacional de Prevención y Repuesta Ante Desastres (SENAPRED), Av. Beauchef 1671, Santiago, Chile (URL: https://web.senapred.cl/); Buenos Aires Volcanic Ash Advisory Center (VAAC), Servicio Meteorológico Nacional-Fuerza Aérea Argentina, 25 de mayo 658, Buenos Aires, Argentina (URL: http://www.smn.gov.ar/vaac/buenosaires/inicio.php); MIROVA (Middle InfraRed Observation of Volcanic Activity), a collaborative project between the Universities of Turin and Florence (Italy) supported by the Centre for Volcanic Risk of the Italian Civil Protection Department (URL: http://www.mirovaweb.it/); Hawai'i Institute of Geophysics and Planetology (HIGP) - MODVOLC Thermal Alerts System, School of Ocean and Earth Science and Technology (SOEST), Univ. of Hawai'i, 2525 Correa Road, Honolulu, HI 96822, USA (URL: http://modis.higp.hawaii.edu/); Copernicus Browser, Copernicus Data Space Ecosystem, European Space Agency (URL: https://dataspace.copernicus.eu/browser/).
Merapi (Indonesia) — October 2023 Cite this Report
Merapi
Indonesia
7.54°S, 110.446°E; summit elev. 2910 m
All times are local (unless otherwise noted)
Frequent incandescent avalanches during April-September 2023
Merapi, located just north of the major city of Yogyakarta in central Java, Indonesia, has had activity within the last 20 years characterized by pyroclastic flows and lahars accompanying growth and collapse of the steep-sided active summit lava dome. The current eruption period began in late December 2020 and has more recently consisted of ash plumes, intermittent incandescent avalanches of material, and pyroclastic flows (BGVN 48:04). This report covers activity during April through September 2023, based on information from Balai Penyelidikan dan Pengembangan Teknologi Kebencanaan Geologi (BPPTKG), the Center for Research and Development of Geological Disaster Technology, a branch of PVMBG which specifically monitors Merapi. Additional information comes from the Pusat Vulkanologi dan Mitigasi Bencana Geologi (PVMBG, also known as Indonesian Center for Volcanology and Geological Hazard Mitigation, CVGHM), MAGMA Indonesia, the Darwin Volcanic Ash Advisory Centre (VAAC), and various satellite data.
Activity during April through September 2023 primarily consisted of incandescent avalanches of material that mainly affected the SW and W flanks and traveled as far as 2.3 km from the summit (table 25) and white gas-and-steam emissions that rose 10-1,000 m above the crater.
Table 25. Monthly summary of avalanches and avalanche distances recorded at Merapi during April through September 2023. The number of reported avalanches does not include instances where possible avalanches were heard but could not be visually confirmed as a result of inclement weather. Data courtesy of BPPTKG (April-September 2023 daily reports).
| Month |
Average number of avalanches per day |
Distance avalanches traveled (m) |
| Apr 2023 |
19 |
1,200-2,000 |
| May 2023 |
22 |
500-2,000 |
| Jun 2023 |
18 |
1,200-2,000 |
| Jul 2023 |
30 |
300-2,000 |
| Aug 2023 |
25 |
400-2,300 |
| Sep 2023 |
23 |
600-2,000 |
BPPTKG reported that during April and May white gas-and-steam emissions rose 10-750 m above the crater, incandescent avalanches descended 500-2,000 m on the SW and W flanks (figure 135). Cloudy weather often prevented clear views of the summit, and sometimes avalanches could not be confirmed. According to a webcam image, a pyroclastic flow was visible on 17 April at 0531. During the week of 28 April and 4 May a pyroclastic flow was reported on the SW flank, traveling up to 2.5 km. According to a drone overflight taken on 17 May the SW lava dome volume was an estimated 2,372,800 cubic meters and the dome in the main crater was an estimated 2,337,300 cubic meters.
During June and July similar activity persisted with white gas-and-steam emissions rising 10-350 m above the crater and frequent incandescent avalanches that traveled 300-2,000 m down the SW, W, and S flanks (figure 136). Based on an analysis of aerial photos taken on 24 June the volume of the SW lava dome was approximately 2.5 million cubic meters. A pyroclastic flow was observed on 5 July that traveled 2.7 km on the SW flank. According to the Darwin VAAC multiple minor ash plumes were identified in satellite images on 19 July that rose to 3.7 km altitude and drifted S and SW. During 22, 25, and 26 July a total of 17 avalanches descended as far as 1.8 km on the S flank.
Frequent white gas-and-steam emissions continued during August and September, rising 10-450 m above the crater. Incandescent avalanches mainly affected the SW and W flanks and traveled 400-2,300 m from the vent (figure 137). An aerial survey conducted on 10 August was analyzed and reported that estimates of the SW dome volume was 2,764,300 cubic meters and the dome in the main crater was 2,369,800 cubic meters.
Frequent and moderate-power thermal activity continued throughout the reporting period, according to a MIROVA (Middle InfraRed Observation of Volcanic Activity) analysis of MODIS satellite data (figure 138). There was an increase in the number of detected anomalies during mid-May. The MODVOLC thermal algorithm recorded a total of 47 thermal hotspots: six during April, nine during May, eight during June, 15 during July, four during August, and five during September. Some of this activity was captured in infrared satellite imagery on clear weather days, sometimes accompanied by incandescent material on the SW flank (figure 139).
Geologic Background. Merapi, one of Indonesia's most active volcanoes, lies in one of the world's most densely populated areas and dominates the landscape immediately north of the major city of Yogyakarta. It is the youngest and southernmost of a volcanic chain extending NNW to Ungaran volcano. Growth of Old Merapi during the Pleistocene ended with major edifice collapse perhaps about 2,000 years ago, leaving a large arcuate scarp cutting the eroded older Batulawang volcano. Subsequent growth of the steep-sided Young Merapi edifice, its upper part unvegetated due to frequent activity, began SW of the earlier collapse scarp. Pyroclastic flows and lahars accompanying growth and collapse of the steep-sided active summit lava dome have devastated cultivated lands on the western-to-southern flanks and caused many fatalities.
Information Contacts: Balai Penyelidikan dan Pengembangan Teknologi Kebencanaan Geologi (BPPTKG), Center for Research and Development of Geological Disaster Technology (URL: http://merapi.bgl.esdm.go.id/, Twitter: @BPPTKG); MAGMA Indonesia, Kementerian Energi dan Sumber Daya Mineral (URL: https://magma.esdm.go.id/v1); Pusat Vulkanologi dan Mitigasi Bencana Geologi (PVMBG, also known as Indonesian Center for Volcanology and Geological Hazard Mitigation, CVGHM), Jalan Diponegoro 57, Bandung 40122, Indonesia (URL: http://www.vsi.esdm.go.id/); Darwin Volcanic Ash Advisory Centre (VAAC), Bureau of Meteorology, Northern Territory Regional Office, PO Box 40050, Casuarina, NT 0811, Australia (URL: http://www.bom.gov.au/info/vaac/); MIROVA (Middle InfraRed Observation of Volcanic Activity), a collaborative project between the Universities of Turin and Florence (Italy) supported by the Centre for Volcanic Risk of the Italian Civil Protection Department (URL: http://www.mirovaweb.it/); Hawai'i Institute of Geophysics and Planetology (HIGP) - MODVOLC Thermal Alerts System, School of Ocean and Earth Science and Technology (SOEST), Univ. of Hawai'i, 2525 Correa Road, Honolulu, HI 96822, USA (URL: http://modis.higp.hawaii.edu/); Copernicus Browser, Copernicus Data Space Ecosystem, European Space Agency (URL: https://dataspace.copernicus.eu/browser/); Øystein Lund Andersen (URL: https://www.oysteinlundandersen.com/, https://twitter.com/oysteinvolcano).
Ebeko
Russia
50.686°N, 156.014°E; summit elev. 1103 m
All times are local (unless otherwise noted)
Moderate explosive activity with ash plumes continued during June-November 2023
Ebeko, located on the N end of Paramushir Island in Russia’s Kuril Islands just S of the Kamchatka Peninsula, consists of three summit craters along a SSW-NNE line at the northern end of a complex of five volcanic cones. Observed eruptions date back to the late 18th century and have been characterized as small-to-moderate explosions from the summit crater, accompanied by intense fumarolic activity. The current eruptive period began in June 2022, consisting of frequent explosions, ash plumes, and thermal activity (BGVN 47:10, 48:06). This report covers similar activity during June-November 2023, based on information from the Kamchatka Volcanic Eruptions Response Team (KVERT) and satellite data.
Moderate explosive activity continued during June-November 2023 (figures 50 and 51). According to visual data from Severo-Kurilsk, explosions sent ash 2-3.5 km above the summit (3-4.5 km altitude) during most days during June through mid-September. Activity after mid-September was slightly weaker, with ash usually reaching less than 2 km above the summit. According to KVERT the volcano in October and November was, with a few exceptions, either quiet or obscured by clouds that prevented satellite observations. KVERT issued Volcano Observatory Notices for Aviation (VONA) on 8 and 12 June, 13 and 22 July, 3 and 21 August, and 31 October warning of potential aviation hazards from ash plumes drifting 3-15 km from the volcano. Based on satellite data, KVERT reported a persistent thermal anomaly whenever weather clouds permitted viewing.
Geologic Background. The flat-topped summit of the central cone of Ebeko volcano, one of the most active in the Kuril Islands, occupies the northern end of Paramushir Island. Three summit craters located along a SSW-NNE line form Ebeko volcano proper, at the northern end of a complex of five volcanic cones. Blocky lava flows extend west from Ebeko and SE from the neighboring Nezametnyi cone. The eastern part of the southern crater contains strong solfataras and a large boiling spring. The central crater is filled by a lake about 20 m deep whose shores are lined with steaming solfataras; the northern crater lies across a narrow, low barrier from the central crater and contains a small, cold crescentic lake. Historical activity, recorded since the late-18th century, has been restricted to small-to-moderate explosive eruptions from the summit craters. Intense fumarolic activity occurs in the summit craters, on the outer flanks of the cone, and in lateral explosion craters.
Information Contacts: Kamchatka Volcanic Eruptions Response Team (KVERT), Far Eastern Branch, Russian Academy of Sciences, 9 Piip Blvd., Petropavlovsk-Kamchatsky, 683006, Russia (URL: http://www.kscnet.ru/ivs/kvert/).
Search Bulletin Archive by Publication Date
Select a month and year from the drop-downs and click "Show Issue" to have that issue displayed in this tab.
The default month and year is the latest issue available.
Bulletin of the Global Volcanism Network - Volume 42, Number 06 (June 2017)
Managing Editor: Edward Venzke
Bezymianny (Russia)
Lava dome extrusion December 2016-April 2017; large ash explosion on 9 March 2017
Chirinkotan (Russia)
Intermittent ash plumes and thermal anomalies June 2013-April 2017, site visit by Russian scientists, August 2015
Dukono (Indonesia)
Frequent explosive eruptions and ash plumes through March 2017
Erebus (Antarctica)
Phonolitic lava lakes remain active during 2011-2016
Fuego (Guatemala)
Ten eruptive episodes with lava flows, ash plumes, and pyroclastic flows during January-June 2016
Nyamulagira (DR Congo)
Large SO2 plumes and intermittent lava lake during 2013-2017
Reventador (Ecuador)
Lava flows, pyroclastic flows, and ash plumes monthly during June 2014-December 2015
Ruiz, Nevado del (Colombia)
Intermittent ash emissions July 2012-December 2015; increased thermal activity October-December 2015
Turrialba (Costa Rica)
Persistent explosions and ash emissions during 2015 and 2016
Unnamed (Tonga)
Plumes of discolored water seen in satellite imagery during 23-28 January 2017
Bezymianny
Russia
55.972°N, 160.595°E; summit elev. 2882 m
All times are local (unless otherwise noted)
Lava dome extrusion December 2016-April 2017; large ash explosion on 9 March 2017
The Kamchatka Volcanic Eruptions Response Team (KVERT) characterized Bezymianny as having weak activity from mid-June 2014 through the end of 2015, including weak or moderate gas-and-steam emissions (figures 17 and 18) and, when not obscured by clouds, weak thermal anomalies (BGVN 41:01). Observations here through May 2017 come from KVERT reports and Tokyo Volcanic Ash Advisory Center (VAAC) advisories.
Activity during 2016. KVERT reported that weak volcanic activity continued into January 2016, with moderate gas-and-steam activity through 12 December 2016. During this time, satellite data by KVERT showed a weak thermal anomaly over the volcano on most days, although on some days KVERT described the volcano as "quiet." Often the volcano was obscured by clouds.
The Tokyo VAAC reported that on 30 July an ash plume rose to an altitude of 3 km and drifted E, an observation based on information from the Yelizovo Airport (UHPP). Weak fumarolic activity continued in late August (figure 19).
Based on KB GS RAS (Kamchatka Branch of Geophysical Services, Russian Academy of Sciences) data, KVERT noted that seismicity began to increase on 18 November. The thermal anomaly temperature detected in satellite images also increased on 5 December, and then significantly increased on 13 December, probably caused by lava-dome extrusion. This activity prompted KVERT to raise the Aviation Color Code from Yellow, where it had been since 17 July 2014, to Orange (second highest level).
According to KVERT, a gas-and-steam plume containing a small amount of ash drifted about 118 km W on 15 December. The Tokyo VAAC noted that ash plumes rose as high as 6.1 km that same day. KVERT reported strong gas-and-steam emissions during 16-31 December (figure 20); a gas-and-steam plume drifted about 60 km SW on 18 December. A daily thermal anomaly was detected over the volcano.
Activity during January-May 2017. According to KVERT, lava-dome extrusion likely continued into January 2017. Strong gas-and-steam emissions continued through 19 January 2017 and a thermal anomaly was detected over the volcano during most days. On 12 January, KVERT noted that activity had gradually decreased after an intensification during 5-24 December 2016, and thus the Aviation Color Code was lowered to Yellow. Thereafter, KVERT characterized the volcano as having moderate gas-steam activity. On 23 February, KVERT reported that the effusive eruption continued and that lava was flowing on the S flank of the lava dome.
On 9 March at about 1330, an explosive eruption occurred (figure 21). Based on webcam observations, at 1454 an ash plume rose to altitudes of 6-7 km and drifted 20 km NE. The Aviation Color Code was raised to Orange. About 30 minutes later, at 1523, an ash plume rose to altitudes of 7-8 km and drifted 60 km NW. KVERT raised the Aviation Color Code to Red, the highest level. Satellite data showed a 14-km-wide ash plume drifting 112 km NW at an altitude of 7 km. Later that day a 274-km-long ash plume identified in satellite images drifted NW at altitudes of 4-4.5 km; the majority of the leading part of the plume contained a significant amount of ash. Lava flowed down the NW part of the lava dome. The Aviation Color Code was lowered to Orange. Ash plumes drifted as far as 500 km NW.
KVERT reported that lava continued to advance down the NW flank of the lava dome during 10 March-21 April, and gas-and-steam plumes rose from the crater. A thermal anomaly was visible most days in satellite images. The Aviation Color Code was lowered to Yellow on 25 May. According to a KVERT report on 26 May, the volcano became quiet after the 9 March episode, although strong gas-and-steam emissions and daily thermal anomalies continued.
Thermal anomalies. Thermal anomalies, based on MODIS satellite instruments analyzed using the MODVOLC algorithm, were almost daily events during January through 2 November 2016, except none were reported in March through 19 May 2016. On many days, multiple pixels were reported (13 pixels on 1 September). The number of events diminished in December (only six days), and except for a brief period during 9-12 March 2017, none were reported after 20 December through at least 26 May 2017.
The Mirova (Middle InfraRed Observation of Volcanic Activity) volcano hotspot detection system, also based on analysis of MODIS data, reported several hotspots each month during May-August 2016, with a significant increase in September through early November (figure 22). Numerous hotspots were again reported in December, but only a few in January and February, except for a narrow cluster during the middle of February. In contrast to the MODIS/MODVOLC data, numerous hotspots were reported in March, April, and May 2017. The vast majority of hotspots during the past 12 months were within 5 km of the volcano and were of low power.
Geologic Background. The modern Bezymianny, much smaller than its massive neighbors Kamen and Kliuchevskoi on the Kamchatka Peninsula, was formed about 4,700 years ago over a late-Pleistocene lava-dome complex and an edifice built about 11,000-7,000 years ago. Three periods of intensified activity have occurred during the past 3,000 years. The latest period, which was preceded by a 1,000-year quiescence, began with the dramatic 1955-56 eruption. This eruption, similar to that of St. Helens in 1980, produced a large open crater that was formed by collapse of the summit and an associated lateral blast. Subsequent episodic but ongoing lava-dome growth, accompanied by intermittent explosive activity and pyroclastic flows, has largely filled the 1956 crater.
Information Contacts: Kamchatka Volcanic Eruptions Response Team (KVERT), Far Eastern Branch, Russian Academy of Sciences, 9 Piip Blvd., Petropavlovsk-Kamchatsky, 683006, Russia (URL: http://www.kscnet.ru/ivs/kvert/); Institute of Volcanology and Seismology, Far Eastern Branch, Russian Academy of Sciences (IVS FEB RAS), 9 Piip Blvd., Petropavlovsk-Kamchatsky 683006, Russia (URL: http://www.kscnet.ru/ivs/eng/); Kamchatka Branch of the Geophysical Service, Russian Academy of Sciences (KB GS RAS) (URL: http://www.emsd.ru/); Tokyo Volcanic Ash Advisory Center (VAAC), 1-3-4 Otemachi, Chiyoda-ku, Tokyo, Japan (URL: http://ds.data.jma.go.jp/svd/vaac/data/); Hawai'i Institute of Geophysics and Planetology (HIGP) - MODVOLC Thermal Alerts System, School of Ocean and Earth Science and Technology (SOEST), Univ. of Hawai'i, 2525 Correa Road, Honolulu, HI 96822, USA (URL: http://modis.higp.hawaii.edu/); MIROVA (Middle InfraRed Observation of Volcanic Activity), a collaborative project between the Universities of Turin and Florence (Italy) supported by the Centre for Volcanic Risk of the Italian Civil Protection Department (URL: http://www.mirovaweb.it/).
Chirinkotan (Russia) — June 2017 Cite this Report
Chirinkotan
Russia
48.98°N, 153.48°E; summit elev. 724 m
All times are local (unless otherwise noted)
Intermittent ash plumes and thermal anomalies June 2013-April 2017, site visit by Russian scientists, August 2015
The remote island of Chirinkotan is in the Northern Kuril Islands at the southern end of the Sea of Okhotsk, about 320 km SW of the tip of Kamchatka, Russia. It is an outlier about 40 km NW of the main Kuril Islands Arc. There have been very few historical observations of activity at Chirinkotan, although there is at least one confirmed 19th century observation of lava flows. A short-lived event that resulted in a small, low-level ash plume-and-gas plume was seen in satellite imagery on 20 July 2004 (Neal et al., 2005). Volcanic activity resumed in mid-2013, with intermittent ash plumes, thermal anomalies, and block lava flows reported through April 2017. The volcano is monitored by the Sakhalin Volcanic Eruption Response Team (SVERT) of the Institute of Marine Geology and Geophysics (Far Eastern Branch, Russian Academy of Science), and aviation alerts are issued by the Tokyo Volcanic Ash Advisory Center (VAAC).
A new eruptive phase began with a likely ash emission on 11 June 2013. Intermittent thermal anomalies and gas-and-steam emissions were reported for the next 12 months, sometimes drifting up to 100 km, usually SE. Renewed thermal anomalies and gas emissions were recorded during clear weather beginning on 21 November 2014. Two ash plumes observed in late July 2015 were the likely sources of fresh ashfall and block lava flows sampled during a visit by Russian geoscientists on 9 August 2015. A gas-and-steam plume on 17 November 2015 was the last activity observed, except for low-level thermal anomalies, until a substantial ash plume was captured in satellite data at 8.8 km altitude over a year later on 29 November 2016. Additional ash plumes were observed in satellite data once in late January, and twice each in March and April 2017.
Activity during May 2013-June 2014. After no reports of activity since July 2004, SVERT observed gas-and-steam emissions in satellite imagery beginning in late May 2013. They raised the Alert Level from Green to Yellow (on the four level Green-Yellow-Orange-Red scale) sometime between 27 May and 10 June. The first likely ash emission was reported on 11 June, followed by a thermal anomaly detected on 13 June. Thermal anomalies continued to be detected by SVERT during June and July 2013. The first MODVOLC thermal alert was reported on 22 July; they were reported monthly after that through 11 December 2013, with several days of multiple-pixel alerts. SVERT also noted thermal anomalies and gas-and-steam emissions during August through December, including plumes drifting 30-60 km SE during 17-19 October, 55-100 km SE during 5-6 November, and more than 50 km SE on 25 November.
From the beginning of January 2014 through early June, persistent thermal anomalies were observed in clear imagery nearly every week by SVERT, along with intermittent steam-and-gas emissions. Several times during March, plumes were observed drifting 80-170 km SE. MODVOLC thermal alerts were reported on 8 February, 4 days in March (four pixels on 8 March), and twice on 27 May. SVERT reported that beginning on 24 May, gas emissions containing ash were detected in satellite images. A decrease in thermal anomalies observed by SVERT led them to lower the Alert Level to Green on 5 June 2014.
Activity during November 2014-July 2015. SVERT raised the Alert Level back to Yellow in late November 2014, citing new thermal anomalies beginning on 21 November followed by intermittent steam-and-gas emissions. A plume was observed drifting 40 km SE on 27 November. A new MODVOLC thermal alert appeared on 4 December. SVERT reported thermal anomalies and diffuse gas-and-steam plumes during December 2014 and January-February 2015. Emissions were detected 3 km above Chirinkotan drifting SE on 5 January 2015. MODVOLC reported two thermal alert pixels on 7 January and one on 10 January.
SVERT briefly lowered the Alert Level to Green between 4 and 20 March when no activity was detected. Thermal anomalies were reported again beginning on 19 March; they were noted weekly along with intermittent gas-and-steam emissions through mid-May when the Alert Level was lowered back to Green again on 19 May.
MODVOLC reported a three-pixel thermal alert on 20 July 2015 (local time). The Tokyo VAAC reported an eruption on 21 July (local time) with an ash plume rising to 3.7 km altitude drifting SE. The plume was observed in satellite imagery for about 2 hours before dissipating. SVERT reported a thermal anomaly and steam-and-gas emissions on 22 July, and the Alert Level was raised to Yellow. Another ash plume was reported by the Tokyo VAAC on 26 July rising to an altitude of 4.6 km and drifting NW for several hours before dissipating.
Expedition during August 2015. Scientists from the Institute of Marine Geology and Geophysics (IMGiG) of the Far Eastern Branch of the Russian Academy of Sciences visited Chirinkotan on 9 August 2015. While there, they observed steaming from a recent blocky lava flow near the coast (figure 3), hiked to the summit, and collected data about volcanic and biological activity on the island. A group of researchers climbed to the edge of the summit crater at 600 m elevation, where clouds prevented clear views of the crater (figure 4), however the strong odor of sulfur and noise from fumarolic activity was noted. The scientists sampled the fresh pyroclastic rocks. When the visibility improved, the depth of the crater was observed to be about 150 m; an extrusive dome in the center had a vent on the top emitting gas.
The upper flank of the volcano was strewn with ash and bombs (from 2-3 cm to several meters in diameter). Scientists observed recently buried and charred living vegetation, and nesting birds freshly killed by volcanic ash and bombs, indicating a very recent event (figure 5). The botanists in the research group noted that all of the vegetation on the upper and middle flanks had been killed 2-3 years ago in a major event, likely during the start of the 2013 eruptive cycle. Ash deposits ranged in thickness from a few centimeters near the coast to 8-15 cm near the summit. During a survey of a pyroclastic flow on the SW coast, scientists noted that it was still hot on the surface (40-60°?) and consisted of block lava, bombs, and volcanic ash (figure 6).
Activity during November 2015-April 2017. As a result of the direct observations of the recent eruption on the island, SVERT raised the Alert Level to Orange on 11 August 2015. There were no further reports available from SVERT until 17 November when gas-and-steam emissions were detected, and the Aviation Color Code was reported as Yellow. SVERT reported on 7 December 2015 that the ACC had been lowered to Green. Although SVERT did not report renewed activity from Chirinkotan until it issued a VONA on 29 November 2016 and raised the Alert Level to Yellow, the MIROVA thermal anomaly detection system indicated intermittent low-level anomalies between late May and early October 2016 (figure 7), indicating a heat source on the island.
The Tokyo VAAC issued a report of a volcanic ash plume from an eruption on 29 November (local time) 2016. The plume rose to 8.8 km altitude and drifted N. It was observed in satellite imagery for about 9 hours before dissipating. SVERT briefly raised the ACC to Yellow between 29 November and 2 December. They noted that the ash plume was observed drifting 39 km N. A new report of ash emissions came from the Tokyo VAAC on 26 January 2017, with an ash plume at 3.7 km drifting SE observed in the Himawari-8 satellite imagery. SVERT raised the alert level to Yellow on 27 January (UTM) 2017 and also noted ash emissions on 29 January drifting SE to a maximum distance of 105 km. They lowered the Alert Level to Green on 1 February 2017.
A new ash plume was observed by the Tokyo VAAC on 1 March (local time) 2017 at an altitude of 5.5 km. When SVERT raised the Aviation Color Code to Yellow on 2 March, they noted that the plume had drifted 165 km E. They lowered the ACC back to Green on 6 March. The Tokyo VAAC reported a new ash plume at 6.1 km extending SE early on 21 March 2017. SVERT reported the emission at 15 km E of the volcano when they raised the ACC to Yellow a short while later. They noted on 24 March, when they lowered the ACC to Green, that the maximum extent of the ash cloud had been about 50 km SE.
On 31 March 2017, the Tokyo VAAC issued an advisory for an ash plume at 6.7 km altitude drifting E, and SVERT raised the Alert Level to Yellow the next day. They reported the ash plume drifting 165 km NE before dissipating. Another plume on 7 April was observed by the Tokyo VAAC at 3.7 km altitude drifting SE. SVERT reported the plume at 5 km altitude drifting NE. SVERT lowered the ACC to Green on 24 April 2017.
Reference: Neal C A, McGimsey R G, Dixon J, Melnikov D, 2005. 2004 volcanic activity in Alaska and Kamchatka: summary of events and response of the Alaska Volcano Observatory. U S Geol Surv, Open-File Rpt, 2005-1308: 1-67.
Geologic Background. The small, mostly unvegetated 3-km-wide island of Chirinkotan occupies the far end of an E-W volcanic chain that extends nearly 50 km W of the central part of the main Kuril Islands arc. It is the emergent summit of a volcano that rises 3000 m from the floor of the Kuril Basin. A small 1-km-wide caldera about 300-400 m deep is open to the SW. Lava flows from a cone within the breached crater reached the shore of the island. Historical eruptions have been recorded since the 18th century. Lava flows were observed by the English fur trader Captain Snow in the 1880s.
Information Contacts: Sakhalin Volcanic Eruption Response Team (SVERT), Institute of Marine Geology and Geophysics, Far Eastern Branch, Russian Academy of Science, Nauki st., 1B, Yuzhno-Sakhalinsk, Russia, 693022 (URL: http://www.imgg.ru/en/, http://www.imgg.ru/ru/svert/reports); Tokyo Volcanic Ash Advisory Center (VAAC), 1-3-4 Otemachi, Chiyoda-ku, Tokyo, Japan (URL: http://ds.data.jma.go.jp/svd/vaac/data/); Institute of Marine Geology and Geophysics, Far Eastern Branch of the Russian Academy of Sciences, (FEB RAS IMGiG), 693 022 Russia, Yuzhno-Sakhalinsk, ul. Science 1B (URL: http://imgg.ru/ru); Hawai'i Institute of Geophysics and Planetology (HIGP), MODVOLC Thermal Alerts System, School of Ocean and Earth Science and Technology (SOEST), Univ. of Hawai'i, 2525 Correa Road, Honolulu, HI 96822, USA (URL: http://modis.higp.hawaii.edu/); MIROVA (Middle InfraRed Observation of Volcanic Activity), a collaborative project between the Universities of Turin and Florence (Italy) supported by the Centre for Volcanic Risk of the Italian Civil Protection Department (URL: http://www.mirovaweb.it/).
Dukono
Indonesia
1.6992°N, 127.8783°E; summit elev. 1273 m
All times are local (unless otherwise noted)
Frequent explosive eruptions and ash plumes through March 2017
Eruptive activity at Dukono has continued since 1933. As previously reported, ash explosions were frequently observed, and thermal anomalies were intermittent, from September 2011 through July 2014 (BGVN 39:06). Similar activity has continued through March 2017. Monitoring is conducted by the Indonesian Center for Volcanology and Geological Hazard (PVMBG, also known as CVGHM) from an observation post 11 km away. The Alert Level has remained at 2 (on a scale of 1-4), with residents and tourists advised to not approach the crater within a radius of 2 km.
PVMBG reported that in March-April 2015 seismicity remained high and consisted of explosion signals, volcanic earthquakes, and tremor, accompanied by roaring heard at the observation post. A powerful explosion on 23 May 2015 was followed by minor ashfall in areas to the E. During 1-5 July 2015 white-and-gray plumes rose as high as 600 m; minor ashfall was reported in northern areas on 1 July. Ashfall was reported in areas from the Galela District to Tobelo town (NNW) in August 2015 and at the observation post in September. Seismicity fluctuated at high levels, with elevated periods during 15-22 August, 28 August-5 September, and 15-25 October 2015.
As summarized by PVMBG, the period from 1 January to 19 December 2016 exhibited white-and-gray plumes rising as high as 1.2 km above the rim of the Malupang Warirang crater, accompanied by roaring heard at the observation post. The eruption plume height generally fluctuated though, was higher during periods in May and from late November into December; ashfall increased during the periods of higher plume heights, and was noted in villages within 11 km N, NE, and SW. Seismicity remained high.
Nearly daily aviation advisories from the Darwin VAAC (Volcanic Ash Advisory Centre) since July 2014 confirmed the PVMBG reports. As identified in satellite imagery, white and gray ash plumes were seen rising to altitudes of 1.5-4 km from the Malupang Warirang crater, and drifting in various directions for tens to hundreds of kilometers. Data compiled from VAAC reports and summarized by month for April 2016-March 2017 (table 15) reveal plume altitudes between 1.5 and 3.7 km with visible drift distances up to 300 km away.
Table 15. Monthly summary of reported ash plumes from Dukono for April 2016-March 2017. The direction of drift for the ash plume was highly variable. Data from Darwin VAAC and PVMBG.
| Month |
Plume Altitude (km) |
Plume Drift (km) |
| Apr 2016 |
2.1-3 |
55-250 |
| May 2016 |
2.1-2.7 |
65-185 |
| Jun 2016 |
1.9-2.4 |
55-130 |
| Jul 2016 |
1.8-2.4 |
110-225 |
| Aug 2016 |
1.5-3.3 |
130-280 |
| Sep 2016 |
1.8-3 |
160-250 |
| Oct 2016 |
2.1-2.4 |
215-225 |
| Nov 2016 |
2.1-3.7 |
-- |
| Dec 2016 |
1.7-3 |
55-305 |
| Jan 2017 |
1.8-2.7 |
120-300 |
| Feb 2017 |
1.8-2.4 |
120 |
| Mar 2017 |
1.5-2.7 |
150 |
Intermittent thermal anomalies, typically single pixels, were recorded by MODVOLC (table 16) in the months of April and June 2014, January-March 2015, December 2015, and November 2016. MODIS thermal data recorded by the MIROVA system during the year of April 2016-March 2016 (figure 6) showed intermittent low-power anomalies in May and August 2016, and then in every month from October 2016 through March 2017. It should be noted that the MODIS satellite thermal sensors cannot penetrate cloud cover, which is frequent over Dukono much of the year.
Table 16. Thermal anomalies at Dukono based on MODIS data processed by MODVOLC, August 2014-March 2017. Courtesy of Hawai'i Institute of Geophysics and Planetology (HIGP) - MODVOLC Thermal Alerts System.
| Date (UTC) |
Time (UTC) |
Pixels |
Satellite |
| 28 Apr 2014 |
1410 |
1 |
Terra |
| 01 Jun 2014 |
1655 |
1 |
Aqua |
| 13 Jun 2014 |
1715 |
1 |
Aqua |
| 14 Jan 2015 |
1725 |
1 |
Aqua |
| 18 Jan 2015 |
1700 |
1 |
Aqua |
| 20 Jan 2015 |
1645 |
2 |
Aqua |
| 21 Jan 2015 |
1730 |
2 |
Aqua |
| 22 Jan 2015 |
1340 |
1 |
Terra |
| 23 Jan 2015 |
0200 |
1 |
Terra |
| 23 Jan 2015 |
2317 |
4 |
Aqua |
| 25 Jan 2015 |
1705 |
1 |
Aqua |
| 01 Feb 2015 |
1415 |
1 |
Terra |
| 01 Feb 2015 |
1710 |
1 |
Aqua |
| 30 Mar 2015 |
1705 |
1 |
Aqua |
| 31 Dec 2015 |
1345 |
1 |
Terra |
| 04 Nov 2016 |
1700 |
1 |
Aqua |
Vistors to the crater in March 2016 photographed ash rising form an incandescent vent (figure 7). Patrick Marcel reported that "the vents at the bottom of the crater emitted a sustained, extremely noisy jet of gas, steam and ash, and ejected incandescent bombs to up to 500 m height. Some of them landed outside the crater rim." The "You&MeTraveling2" blog posted a trip journal that described a late-August 2016 visit to Dukono, including photos and a video looking down into the crater that showed activity similar to that seen by Marcel in March 2016.
Geologic Background. The Dukono complex in northern Halmahera is on an edifice with a broad, low profile containing multiple peaks and overlapping craters. Almost continuous explosive eruptions, sometimes accompanied by lava flows, have occurred since 1933. During a major eruption in 1550 CE, a lava flow filled in the strait between Halmahera and the Gunung Mamuya cone, 10 km NE. Malupang Wariang, 1 km SW of the summit crater complex, contains a 700 x 570 m crater that has also had reported eruptions.
Information Contacts: Pusat Vulkanologi dan Mitigasi Bencana Geologi (PVMBG, also known as Indonesian Center for Volcanology and Geological Hazard Mitigation, CVGHM), Jalan Diponegoro 57, Bandung 40122, Indonesia (URL: http://www.vsi.esdm.go.id/); Darwin Volcanic Ash Advisory Centre (VAAC), Bureau of Meteorology, Northern Territory Regional Office, PO Box 40050, Casuarina, NT 0811, Australia (URL: http://www.bom.gov.au/info/vaac/); Hawai'i Institute of Geophysics and Planetology (HIGP) - MODVOLC Thermal Alerts System, School of Ocean and Earth Science and Technology (SOEST), Univ. of Hawai'i, 2525 Correa Road, Honolulu, HI 96822, USA (URL: http://modis.higp.hawaii.edu/); MIROVA (Middle InfraRed Observation of Volcanic Activity), a collaborative project between the Universities of Turin and Florence (Italy) supported by the Centre for Volcanic Risk of the Italian Civil Protection Department (URL: http://www.mirovaweb.it/); Volcano Discovery (URL: http://www.volcanodiscovery.com/); You&MeTraveling2 (URL: http://youandmetraveling2.com/).
Erebus
Antarctica
77.53°S, 167.17°E; summit elev. 3794 m
All times are local (unless otherwise noted)
Phonolitic lava lakes remain active during 2011-2016
The existence of an anorthoclase phonolite lava lake in the summit crater of Mount Erebus was first reported in 1972, and it has been thought to be continuously active since that time. Antarctica's best known volcano is located on Ross Island, 90 km E of the continent, offshore of the Scott Coast. McMurdo station, run by the United States Antarctic Program, is about 40 km S on the tip of Ross Island (figure 16). During the history of observations, lava lake(s) have generally persisted, although changes in size and shape over time reflect variations in volcanic activity.
This report briefly summarizes research activity at Mount Erebus, and volcanic activity observed since 1972. Photographs from expeditions between 2010 and 2016 show more recent activity at the volcano. Observations from MODVOLC data collected from 2000 through 2016 are also discussed.
Summary of research activity. For most years since the 1970's, scientists have visited Erebus during the austral summer (November-February) and gathered samples, taken SO2 and other geochemical measurements, collected GPS data, and made observations and overflights to evaluate the condition of the volcano.
Seismometers were initially installed by a joint project of United States, New Zealand, and Japanese scientists in 1980-1981. Between 1980 and 2016 as many as 10 seismic stations were recording activity at Erebus; they were monitored by the Mount Erebus Volcano Observatory (MEVO) run by the New Mexico Institute of Mining and Technology (New Mexico Tech). During the early 2000s MEVO also used infrasonic recordings to capture data on the frequency of eruptions. Researchers from New Mexico Tech, the University of Cambridge, and University College London made yearly expeditions there between 2003 and 2016.
The Mount Erebus Volcano Observatory closed in 2016. A final report was submitted to the National Science Foundation (NSF) on the past research and ideas for future research (Mattioli and LaFemina, 2016), and includes a comprehensive list of scientific publications about Erebus. One area of ongoing volcanology research relates to studying the behavior of the lava lake with a variety of on-site monitoring equipment (figure 17).
Summary of activity, 1972-2009. During the 1970's, the lava lake was observed to be about 130 m long and oval shaped, producing occasional Strombolian explosions. Bombs up to 10 m in in diameter were ejected near the vent, and ones up to 30 cm in diameter were thrown out over the main crater. Oscillations of the lake level of up to 2 m were observed.
During a period of increased activity between September 1984 and January 1985, several large explosions were recorded by the seismic network, and there were reports of mushroom-shaped clouds rising as much as 2 km above the summit. During September 1984, numerous large explosions sent ejecta as high as 600 m above the summit, and incandescence was visible from 70 km away. Ash also covered the NW flank down to 3,400 m elevation. Observations in October 1984 indicated that much of the lava lake had solidified, and that the surface was covered with ejecta from the recent explosions. Seismicity remained above average through January 1985. During this period of increased activity, bombs averaging 2 m in diameter (but some as large as 10 m in diameter) were ejected up to 1.2 km from within the inner crater. The eruptions were witnessed from 60 km away and explosions could be heard up to 2 km from the volcano (SEAN 11:03). A small lava lake about 15 m in diameter reappeared late in 1985.
Two primary lakes of phonolitic lava, and a third transient lake, were present inside the crater during the late 1980s (see figure 9, SEAN 13:02), and infrequent Strombolian eruptions with small bombs were captured by a remote video camera mounted on the crater rim. Small ash eruptions were observed from an active vent near the lava lakes in January 1991. On 19 October 1993, two moderate phreatic eruptions created a new crater ~80 m in diameter on the main crater floor and ejected debris over the northern crater rim. These were the first known phreatic eruptions at Erebus, and probably resulted from steam build-up associated with melting snow in the crater (BGVN 20:11).
Vent and lava lake eruptions were recorded by MEVO during the late 1990s and early 2000s. The largest peaks in terms of numbers of eruptions were during 1995, 1997, 1998, 2000, and a broad peak beginning in late 2005 that continued into late 2006 (BGVN 31:12).
Activity during 2010-2016. The two primary lava lakes remained active at Erebus. The one in the NE sector of the inner crater has been persistent almost continuously since first reported in 1972. The second lake is more in the center of the main crater and is intermittently active. During a visit in 2010, only the NE sector lake was active (BGVN 36:09). During clear weather, a steady steam plume is often observed (figure 18).
Visits during 2011-2016 have confirmed the ongoing Strombolian activity and convection at the lava lakes nearly every year. During 2011 the glowing lava lake emitted steam and magmatic gases from the bottom of a vent at the main crater (figure 19). An eruption on 2 January 2012 at the lava lake was captured by the remote video cameras managed by MEVO (figure 20). Several bombs were ejected on 18 December 2013 and landed close to monitoring equipment run by MEVO. Researchers were able to open a hot bomb and see the molten interior (figure 21).
When UNAVCO (a non-profit university-governed consortium) flew over Erebus in December 2015, steam and magmatic gas plumes indicated that both lava lakes were active (figure 22). The two incandescent crater vents at were observed in greater detail during January 2016 by researchers associated with the University of Cambridge (figure 23).
MODVOLC data, 2000-2016. With the remoteness of Erebus, satellite imagery serves as one of the few year-round tools currently available to assess longer-term activity. The University of Hawaii's MODVOLC thermal alert system has been processing MODIS infrared satellite data since 2000. Mount Erebus has had a strong and nearly continuous MODVOLC signature throughout 2000-2016 (table 3), confirming its ongoing eruptive activity.
Table 3. Number of MODVOLC thermal alert pixels recorded per month from 1 January 2000 to 31 December 2016 by the University of Hawaii's thermal alert system for Erebus. Table compiled by GVP from data provided by MODVOLC. Spurious data from 25 October 2014 was omitted.
| Year |
Jan |
Feb |
Mar |
Apr |
May |
Jun |
Jul |
Aug |
Sep |
Oct |
Nov |
Dec |
SUM |
| 2000 |
0 |
6 |
16 |
3 |
10 |
7 |
8 |
12 |
7 |
4 |
1 |
0 |
74 |
| 2001 |
2 |
16 |
90 |
70 |
78 |
24 |
70 |
71 |
57 |
30 |
1 |
5 |
514 |
| 2002 |
1 |
19 |
53 |
71 |
96 |
133 |
148 |
122 |
188 |
62 |
28 |
28 |
949 |
| 2003 |
19 |
41 |
103 |
125 |
168 |
231 |
195 |
213 |
121 |
62 |
30 |
19 |
1327 |
| 2004 |
40 |
48 |
143 |
90 |
131 |
279 |
133 |
288 |
113 |
67 |
39 |
131 |
1502 |
| 2005 |
125 |
98 |
217 |
158 |
159 |
212 |
256 |
191 |
209 |
91 |
30 |
21 |
1767 |
| 2006 |
12 |
27 |
78 |
89 |
131 |
85 |
145 |
30 |
39 |
36 |
11 |
32 |
715 |
| 2007 |
18 |
42 |
142 |
268 |
243 |
178 |
184 |
199 |
118 |
98 |
10 |
33 |
1533 |
| 2008 |
91 |
116 |
199 |
267 |
286 |
180 |
269 |
458 |
149 |
148 |
95 |
141 |
2399 |
| 2009 |
86 |
114 |
386 |
162 |
436 |
270 |
341 |
208 |
253 |
116 |
76 |
66 |
2514 |
| 2010 |
53 |
58 |
207 |
132 |
185 |
154 |
89 |
100 |
142 |
62 |
10 |
2 |
1194 |
| 2011 |
3 |
23 |
81 |
112 |
36 |
1 |
1 |
0 |
4 |
25 |
0 |
0 |
286 |
| 2012 |
0 |
24 |
52 |
56 |
31 |
93 |
27 |
1 |
1 |
0 |
0 |
0 |
285 |
| 2013 |
0 |
1 |
11 |
11 |
11 |
20 |
56 |
85 |
28 |
19 |
0 |
1 |
243 |
| 2014 |
2 |
1 |
0 |
9 |
49 |
62 |
78 |
10 |
28 |
3 |
0 |
1 |
243 |
| 2015 |
1 |
17 |
14 |
4 |
15 |
2 |
7 |
12 |
2 |
3 |
0 |
0 |
77 |
| 2016 |
0 |
4 |
13 |
34 |
46 |
33 |
19 |
1 |
3 |
0 |
0 |
0 |
153 |
| SUM |
453 |
655 |
1805 |
1661 |
2111 |
1964 |
2026 |
2001 |
1462 |
826 |
331 |
480 |
The MODVOLC thermal alert data show that thermal activity at Erebus has waxed and waned several times during the 2000-2016 interval (figure 24). Activity was very low during 2000, but increased steadily through mid-2005 to more than 20 times as many annual thermal alert pixels since 2000. Activity dropped off substantially from late 2005 and remained low through early 2007, when another increase began that peaked at an even higher level (2514 pixels during 2009) in mid-2009. Another drop in activity occurred during 2010, and since 2011 there have been fewer than 300 pixels per year, with numbers below 200 for 2015 and 2016.
Another trend in the MODVOLC data is also apparent when the number of pixels are plotted by month, as opposed to year, for this time period (figure 25). From November through February, during the austral summer, the number of pixels per month never exceeds 150 (see table 3, highest value is 125). From March through October, during the Austral winter, the number of pixels recorded per month can be much higher (the highest value is 458). The average number of 'summer' pixels per month (November-February, 2000-2016) is 30. The average number of 'winter' pixels per month for the same period (March-October) is 108, more than three times greater.
References: Mattioli, G.S., and LaFemina, P.C., 2016, Final Report submitted to the National Science Foundation, Community Workshop: "Scientific Drivers and Future of Mount Erebus Volcano Observatory (MEVO)" (URL: https://www.unavco.org/community/meetings-events/2016/mevo/2016-MEVO-Final-Report.pdf)
Geologic Background. Mount Erebus, the world's southernmost historically active volcano, overlooks the McMurdo research station on Ross Island. It is the largest of three major volcanoes forming the crudely triangular Ross Island. The summit of the dominantly phonolitic volcano has been modified by one or two generations of caldera formation. A summit plateau at about 3,200 m elevation marks the rim of the youngest caldera, which formed during the late-Pleistocene and within which the modern cone was constructed. An elliptical 500 x 600 m wide, 110-m-deep crater truncates the summit and contains an active lava lake within a 250-m-wide, 100-m-deep inner crater; other lava lakes are sometimes present. The glacier-covered volcano was erupting when first sighted by Captain James Ross in 1841. Continuous lava-lake activity with minor explosions, punctuated by occasional larger Strombolian explosions that eject bombs onto the crater rim, has been documented since 1972, but has probably been occurring for much of the volcano's recent history.
Information Contacts: Mt. Erebus Volcano Observatory (MEVO), New Mexico Institute of Mining and Technology, Socorro, NM 87801, USA; Hawai'i Institute of Geophysics and Planetology (HIGP), MODVOLC Thermal Alerts System, School of Ocean and Earth Science and Technology (SOEST), Univ. of Hawai'i, 2525 Correa Road, Honolulu, HI 96822, USA (URL: http://modis.higp.hawaii.edu/); The University of Cambridge Department of Geography (URL: http://www.geog.cam.ac.uk/research/projects/lavalakes/); Erik Klemetti, Eruptions Blog, Wired (URL: https://www.wired.com/author/erikvolc/); Tom Pfeiffer, Volcano Discovery (URL: http://www.volcanodiscovery.com/); UNAVCO, 6350 Nautilus Drive, Boulder, CO 80301-5394 (URL: http://www.unavco.org/); Kayla Iacovino and Tehnuka Ilanko, The Volcanofiles (URL: http://www.volcanofiles.com/).
Fuego
Guatemala
14.4748°N, 90.8806°W; summit elev. 3799 m
All times are local (unless otherwise noted)
Ten eruptive episodes with lava flows, ash plumes, and pyroclastic flows during January-June 2016
Volcán de Fuego has been erupting continuously since 2002. Historical observations of eruptions date back to 1531, and radiocarbon dates are confirmed back to 1580 BCE. These eruptions have resulted in major ashfalls, pyroclastic flows, lava flows, and damaging lahars. Fuego was continuously active from June 2014-December 2015. Ash plumes rose to 6 km altitude, ashfall was reported in communities as far as 90 km away, pyroclastic flows descended multiple drainages at least four times, Strombolian activity rose to 800 m above the summit, lava flows descended a few kilometers down five different drainages numerous times, and three different lahars damaged roadways (BGVN 42:05). This report continues with a summary of similar activity during January-June 2016. In addition to regular reports from INSIVUMEH, the Washington Volcanic Ash Advisory Center (VAAC) provides aviation alerts. Locations of towns and drainages are listed in table 12 (BGVN 42:05).
Daily weak and moderate explosions generating ash plumes to about 800 m above the summit (4.6 km altitude) that dissipated within about 10 km were typical activity for Fuego during January-June 2016. In addition, ten eruptive episodes were recorded during this time. Each episode lasted 24-72 hours, with all but one including incandescent material rising 200-400 m above the summit feeding lava flows down the larger drainages for several kilometers. Most also included pyroclastic flows down the larger drainages. One of the episodes consisted of only large pyroclastic eruptions (with an accompanying ash plume) that issued directly from the summit crater and down the ravines; all included ash plumes rising over 5 km in altitude. Several lahars were reported during late April-June.
Activity during 30 December 2015. INSIVUMEH reported a significant increase in activity on 30 December 2015. A series of pyroclastic flows descended the Las Lajas and El Jute drainages on the SE flank, and a dense ash plume rose to 5 km altitude and drifted 20 km W. Ashfall was reported in multiple communities on the flanks, including Panimache I and II (8 km SW), Morelia (9 km SW), and Santa Sofía (12 km SW).
Activity during January 2016. Two eruptive episodes with explosions that generated ash plumes, pyroclastic flows, Strombolian activity, lava flows, and ashfall were documented by INSIVUMEH during January 2016. The first eruption began with an increase in seismicity early in the morning of 3 January. Moderate to strong explosions were accompanied by an ash plume that rose to 4.8 km altitude (about 1 km above the summit) and drifted W and SW. Two lava flows emerged from the summit crater and traveled down the Las Lajas and Trinidad ravines. Moderate to strong explosions continued during 3 January. By the afternoon, dense plumes of ash were reported at 6 km altitude drifting SW and SE more than 40 km. Ashfall was reported in the villages of Panimaché I and II, Morelia, Santa Sofia, El Porvenir, La Rochela, Osuna, El Zapote and Rodeo. Also later in the day, incandescence was observed 400 m above the crater; it fed three lava flows in the Santa Teresa, Trinidad, and Las Lajas canyons that reached 2.5 km in length. Eruptive activity diminished after about 37 hours with weak bursts of ash rising to 4.6-4.7 km altitude on 5 January that drifted S, SW, and SE.
A smaller explosive event during 15-17 January produced block avalanches and created ash plumes that rose 450-750 m above the crater and drifted up to 12 km N and NE; four to five explosions per hour were detected. The second eruptive episode began with increased activity on 19 January; incandescent material was ejected 400-500 m above the summit, generating new lava flows to the same three canyons as the earlier eruption (Santa Teresa, Trinidad and Las Lajas) (figure 36). Ash emissions rose to 4.9 km altitude and drifted NE. Pyroclastic flows also descended the Las Lajas and El Jute canyons (figure 37).
The second episode continued throughout 20 January 2016 when the largest ash plume rose to 6.7 km altitude and drifted NE more than 90 km according to the Washington VAAC. Ashfall was reported in San Miguel, Las Dueñas, Alotenango, Acatenango, and Antigua. Ash plumes from the pyroclastic flows also generated ashfall on the S and SW flanks (figure 38). By the morning of 21 January, the lava flows had ceased advancing at about 3 km length, although a hot spot was still clearly visible in satellite imagery. Weak explosions generated ash plumes that rose only a few hundred meters above the summit and drifted NNE. During January, the Observatorio del Volcan de Fuego installed a second webcam on the SE side of Fuego at the Finca La Reunión, a resort about 8 km from the summit. The first webcam is located about 10 km SW of the summit at the Observatorio del Volcan de Fuego in the community of Panimache.
Activity during February-March 2016. Explosions increased in number and energy on 5 February 2016, classified by INSIVUMEH as the 3rd episode of the year. Six moderate to strong explosions per hour were reported, sending ash emissions to 4.5 km altitude, drifting W, NW, and N more than 12 km, and avalanche blocks down the flanks to the base. The third eruptive episode of the year began with moderate explosions on 9 February 2016; it generated ash plumes which rose to 4.7 km altitude and dispersed up to 35 km NNW. Ashfall was reported in Chimaltenango, Zaragoza, Ciudad Vieja, San Pedro las Huertas, San Miguel Las Dueñas, San Juan Alotenango, Antigua Guatemala and the Capital City as far as 35 km N and NE. The explosions were accompanied by incandescent material rising to 300 m above the summit and feeding lava flows that traveled towards the Trinidad, Las Lajas, and Santa Teresa canyons, reaching lengths of 800 to 3,000 meters (figure 39).
The following day (10 February 2016), pyroclastic flows descended the El Jute and Las Lajas ravines (figure 40) while ash plumes rose to 5.2 km altitude and incandescent material was ejected 400 m above the crater. Although activity decreased throughout the day, explosions continued to generate ash plumes to 4.9 km altitude that dispersed ash up to 45 km N and NE. Minor ash emissions were reported by the Washington VAAC on 17 February at 4.6-4.9 km altitude drifting SE about 40 km, and on 24 February at 4.6 km drifting about 25 km SW.
On 29 February 2016, moderate to strong explosions at a rate of 6-10 per hour were heard more than 14 km away. They were accompanied by an ash plume that rose to 4.8 km and drifted 12 km E, and a lava flow that traveled 500 m towards Las Lajas ravine. This 4th eruptive episode (according to INSIVUMEH) lasted more than 72 hours (figure 41). On 2 March, several ash plumes rose to different altitudes and dispersed in different directions. The largest ash plume, was observed by the Washington VAAC at 7.3 km altitude; it was visible 400 km N before it dissipated into weather clouds. Lower altitude plumes rose to 4.6 km and drifted 75 km SW before dissipating. Ash fell in the communities of Morelia, Santa Sofia, La Rochela, Panimaché I and II, Sangre de Cristo, La Soledad and Yepocapa. The incandescent activity fed two lava flows; the first in the direction of Las Lajas reached 3 km, the second flowed towards El Jute ravine and reached 2 km in length. Pyroclastic flows also travelled down these two canyons and block avalanches descended the Honda Canyon. Explosive activity diminished during 3-6 March; ash emissions rose to 550 m above the summit and drifted 8-10 km W, SE, and SE.
During 10 March 2016, moderate to strong Vulcanian explosions generated an ash plume that rose to 4.4 km altitude and drifted E. The Washington VAAC observed ash emissions in multispectral satellite imagery on 15 March at 4.3 km altitude extending about 80 km SW from the summit as well as hot spots and pyroclastic flows visible in the INSIVUMEH webcam. An increase in activity on 21 March generated weak and moderate explosions that produced ash plumes that rose to 4.3-4.7 km and drifted W. This activity was recorded as an increase in RSAM tremor amplitude and duration at the FG3 seismic station, but was not considered an eruptive episode by INSIVUMEH (figure 42).
Eruptive episode 5 began on 26 March 2016 and lasted more than 24 hours (figure 42). Strombolian eruptions rose up to 500 m above the crater (figure 43), feeding three lava flows that traveled 2 km down Las Lajas, 1.3 km down the Santa Theresa, and 1 km down the Trinidad ravines. Ash plumes rose to 6.1 km altitude and drifted up to 150 km W (figure 44); ash fell on the villages of Morelia, Santa Sofia, San Predro Yepocapa, Panimaché I and II. By the end of 27 March, eruptive activity had diminished to background conditions, which included weak and moderate explosions generating ash plumes to about 800 m above the summit (4.6 km altitude) that dissipated within about 10 km WSW. On 29 March ashfall was reported Sangre de Cristo and Panimaché I and II.
Activity during April-May 2016. The Washington VAAC reported diffuse volcanic ash emissions in satellite and webcam imagery on 2 April 2016. The ash plume drifted W at 4.3 km altitude, and extended 75 km from the summit before dissipating. Increased eruptive activity during 6-7 April 2016 resulted in moderate and strong explosions which produced ash plumes rising to 4.6-4.8 km altitude that drifted W and SW 15 km. The explosions were audible more than 20 km from the volcano; roofs and windows vibrated within 12 km. INSIVUMEH received reports of ashfall from the villages of Morelia, Sangre de Cristo, and Panimche I and II.
An explosion on 8 April created an ash plume that rose to 5.8 km and drifted SSW about 35 km. Successive bursts of ash on 9 April rose to 4.9 km altitude and drifted W. Emissions on 11 April were reported at 4.3 km altitude about 15 km SW from the summit; the next day they rose to 4.9 km and drifted SW to a distance of 45 km. INSIVUMEH reported variable activity beginning on 11 April with high levels of explosive activity on 12 April marking the beginning of the sixth eruptive episode of the year, which lasted for three days. An incandescent fountain persisted 100-300 m above the crater and fed two lava flows during the event; one traveled 2 km down the Las Lajas ravine, and the other reached 1 km in length in the Santa Teresa ravine. Avalanches were constant along the flanks during this episode. Continuous ash emissions were observed as well; plumes generally rose no higher than 5.8 km (2 km above the summit). Ashfall was reported in La Rochela, Ceylon, Morelia, Hagia Sophia, Sangre de Cristo, Panimaché I and II. On 13 April the ash plume extended 185 km SW from the summit. A brilliant hotspot was observed in satellite imagery on 14 April after which no further VAAC reports were issued until early May. On 29 April, after more than a week of rain, a lahar descended the Las Lajas drainage but no damage was reported.
Activity at Fuego increased significantly during May 2016, and included three eruptive episodes that generated ash plumes, pyroclastic and lava flows, and increased rainfall that resulted in lahars. Ash plumes rose above 5.5 km altitude (more than 2 km above the summit) and dispersed to the S, SW, and SE. Seismic activity increased on 5 May in the form of internal vibrations caused by lava which flowed more than 1.2 km down the Las Lajas ravine, and moderate to strong explosions that produced ash plumes which rose to 4.8 km altitude and drifted S for 12 km. The Washington VAAC reported diffuse ash extending 65 km SE from the summit.
The 7th eruptive episode of the year began on 6 May 2016 with incandescent material rising 300 m above the summit crater, causing two lava flows. One traveled down Las Lajas ravine more than 3 km; the second descended the Trinidad ravine for 1.5 km. Block avalanches were constant around the crater rim. The episode lasted for more than 32 hours (figure 45); the moderate to strong explosions ejected ash to altitudes above 5.5 km that drifted S and SW. Ashfall was reported in Escuintla and its surroundings. There were no pyroclastic flows during this episode. The Washington VAAC reported emissions extending 65 km SE of the summit at 5 km altitude on 6 May.
The next eruptive episode (8) did not involve seismic explosive activity (figure 45). Instead, several large pyroclastic flows overflowed the crater rim on 18 and 19 May 2016 and descended the flanks towards Las Lajas and Honda ravines (figure 46) resulting in ashfall reported to the S, SW, and W, in villages more than 30 km away. A large ash plume reached more than 5.5 km altitude and drifted 15 km SSW on 19 May (figure 47). Ashfall was reported in the villages of El Rodeo, La Rochela, Osuna, Panimaché, Morelia, Sangre de Cristo and Yepocapa. By late in the day, the Washington VAAC noted that the plume was centered about 90 km SW at 5.8 km altitude.
The ninth eruptive episode of 2016 generated incandescent fountains 200-300 m above the summit; they fed a 2-km-long lava flow down the Las Lajas ravine (figure 48). Seismic activity began to increase on 21 May and lasted through 23 May (see figure 45). Moderate and strong explosions created an ash plume that rose to 5.5 km altitude and drifted SW and W. The Observatory reported ashfall in Morelia, El Porvenir, Santa Sofia, Los Yucales, Panimaché I and II. The Washington VAAC reported an ash plume visible in satellite imagery at 5.5 km altitude, drifting 75 km S beyond the coast on 23 May 2016. A lahar descended the Las Lajas ravine on 20 May and was recorded by the seismic station FG3, but no damage was reported.
Activity during June 2016. A significant rainfall combined with the plentiful ash from recent pyroclastic flows, resulted in lahars descending Las Lajas and El Jute ravines on 5 June 2016. They transported blocks, branches, and tree trunks, and a strong sulfur smell was reported by nearby residents. Another lahar was reported on 18 June that was 15 m wide and had a 1.5-m-high front. An increase in seismic activity during the afternoon of 24 June signaled the beginning of eruptive episode 10. This was followed by about 30 hours of moderate to strong explosive activity that could be heard and felt as far as 12 km away. A dense ash plume on 25 June rose to 5.5 km altitude and drifted S, SW, and W more than 40 km. Ashfall was reported in San Pedro Yepocapa, Sangre de Cristo, Morelia, Santa Sofia, Panimaché I and II. The Washington VAAC observed the ash plume in multispectral imagery on 25 June extending 120 km WSW from the summit. NASA Goddard Space Flight Center captured a small but distinct SO2 plume from Fuego on 25 June as well (figure 49). Incandescent material rose 300 m above the summit crater during this episode and fed three lava flows; the first descended Las Lajas ravine 2.5 km, the second traveled 2.3 km down El Jute ravine, and the third flowed down Taniluyá ravine for 600 meters. Seismic activity from episode 10 decreased on 26 June.
Geologic Background. Volcán Fuego, one of Central America's most active volcanoes, is also one of three large stratovolcanoes overlooking Guatemala's former capital, Antigua. The scarp of an older edifice, Meseta, lies between Fuego and Acatenango to the north. Construction of Meseta dates back to about 230,000 years and continued until the late Pleistocene or early Holocene. Collapse of Meseta may have produced the massive Escuintla debris-avalanche deposit, which extends about 50 km onto the Pacific coastal plain. Growth of the modern Fuego volcano followed, continuing the southward migration of volcanism that began at the mostly andesitic Acatenango. Eruptions at Fuego have become more mafic with time, and most historical activity has produced basaltic rocks. Frequent vigorous eruptions have been recorded since the onset of the Spanish era in 1524, and have produced major ashfalls, along with occasional pyroclastic flows and lava flows.
Information Contacts: Instituto Nacional de Sismologia, Vulcanologia, Meteorologia e Hydrologia (INSIVUMEH), Unit of Volcanology, Geologic Department of Investigation and Services, 7a Av. 14-57, Zona 13, Guatemala City, Guatemala (URL: http://www.insivumeh.gob.gt/); Washington Volcanic Ash Advisory Center (VAAC), Satellite Analysis Branch (SAB), NOAA/NESDIS OSPO, NOAA Science Center Room 401, 5200 Auth Rd, Camp Springs, MD 20746, USA (URL: http://www.ospo.noaa.gov/Products/atmosphere/vaac/, archive at: http://www.ssd.noaa.gov/VAAC/archive.html); NASA Earth Observatory, EOS Project Science Office, NASA Goddard Space Flight Center, Goddard, Maryland, USA (URL: http://earthobservatory.nasa.gov/); NASA Goddard Space Flight Center (NASA/GSFC), Global Sulfur Dioxide Monitoring Page, Atmospheric Chemistry and Dynamics Laboratory, 8800 Greenbelt Road, Goddard, Maryland, USA (URL: https://so2.gsfc.nasa.gov/).
Nyamulagira (DR Congo) — June 2017 Cite this Report
Nyamulagira
DR Congo
1.408°S, 29.2°E; summit elev. 3058 m
All times are local (unless otherwise noted)
Large SO2 plumes and intermittent lava lake during 2013-2017
The Virunga Volcanic Province (VVP) in the Democratic Republic of the Congo (DRC) is part of the western branch of the East African Rift System (EARS). Nyamuragira (or Nyamulagira), a high-potassium basaltic shield volcano on the W edge of VVP, includes a lava field that covers over 1,100 km2 and contains more than 100 flank cones in addition to a large central crater (see figure 47, BGVN 40:01). A large lava lake that had been active for many years emptied from the central crater in 1938. Numerous flank eruptions have been observed since that time, the last during November 2011-March 2012 on the NE flank. This report covers the substantial SO2 emissions from both Nyamuragira and nearby Nyiragongo (15 km SE) between November 2011 and April 2016, and the onset of eruptive activity, including a new lava lake, at the summit crater beginning in May 2014. Activity is described through April 2017.
On-the-ground information about Nyamuragira is intermittent due to the unstable political climate in the region, but some information is available from the Observatoire Volcanologique de Goma (OVG), MONUSCO (the United Nations Organization working in the area), geoscientists who study Nyamuragira, and travelers who visit the site. The most consistent data comes from satellite – thermal data from the MODIS instrument processed by the MODVOLC and MIROVA systems, SO2 data from the AURA instrument on NASA's OMI satellite, and NASA Earth Observatory images from a variety of satellites.
A substantial flank eruption took place from November 2011 through March 2012. This was followed by a period of degassing with SO2-rich plumes, but no observed thermal activity, from April 2012 through April 2014. Increased seismicity and minor thermal activity was observed at the central crater during April 2014; lava fountains first seen in early July 2014 continued through September. A lava lake in the crater was confirmed on 6 November 2014, and it produced a consistent and strengthening thermal anomaly through the first week of April 2016, when it stopped abruptly. Thermal activity suggesting reappearance of the lava lake began again in early November 2016, and strengthened in both frequency and magnitude into early January 2017, continuing with a strong signal through April 2017.
Activity during November 2011-March 2012. Nyamuragira erupted from cones and fissures on the NE flank between early November 2011 and mid-March 2012 (BGVN 39:03). The vent area, 12 km ENE of the central crater, was an E-W fissure 500-1,000 m long. Lava fountains up to 300 m high produced flows that advanced nearly 12 km N in the first 10 days. Three scoria cones formed adjacent to the fissure during the eruption, and a small lava lake appeared in the center of the largest cone. During January 2012, lava flowed from the vent area and from numerous small breakouts within 2 km of the cones (figures 51 and 52). Dario Tedesco reported that the eruptions ceased in March 2012 after a series of explosion earthquakes recorded by the OVG had ended; the last MODVOLC thermal alert in the area of the eruption was captured on 14 March 2012, and none were reported again until 2014.
Activity during April 2012-May 2014. Periodic field surveys at Nyamuragira have been carried out since 2009 by helicopter, thanks to the support of the United Nations Organization Stabilization Mission in the DR Congo (MONUSCO). Since 2013, observations of the crater have also been done once or twice a month by helicopter. The team has included researchers from the OVG, Dario Tedesco, and other international scientists. This area is a high-risk sector due to the presence of armed groups, and it is impossible, due to the lack of security, to make detailed field surveys (Coppola et al., 2016).
Dario Tedesco reported SO2-rich fumaroles in Nyamuragira's central crater beginning in early March 2012, shortly before the NE-flank fissure eruptions ended (BGVN 40:01). A progressive collapse of the 400-m-wide, 50-80 m deep pit crater located in the NE part of the caldera began as soon as the eruptions ended. They noted that during the second half of April, large SO2 plumes continuously emerged from the pit crater.
NASA's Global Sulfur Dioxide Monitoring program captured major SO2 plumes from the area for an extended period between November 2011 and February 2014. The plumes represent combined emissions from both Nyamuragira and Nyiragongo, which are too close together to distinguish the source in the satellite data. Campion (2014), however, noted that SO2 emissions from the VVG increased several fold after the end of the 2011-2012 Nyamuragira eruption; they interpreted that 60-90 % of these emissions should be attributed to Nyamuragira.
Significant areas of SO2 plumes with DU > 2 (shown as red pixels on the Aura/OMI images, figure 53) were captured by the OMI instrument at the beginning of the November 2011 eruption and continued through February 2012. Beginning in April 2012 elevated values occurred more than 20 days per month through December 2012. Values were more variable in both frequency and magnitude during 2013 with a notable surge of activity during 6-19 June 2013 that resulted in daily SO2 plumes. Details of monthly SO2 values are given in the last section of this report (see table 3).
Activity during June 2014-April 2017. Incandescence at the summit and increased seismicity was reported again in April 2014, along with increasing SO2 values. A strong MODVOLC thermal alert signal appeared on 22 June 2014, and a satellite image from 30 June showed clear hotspots at both Nyamuragira and Nyiragongo (figure 54).
An extended series of MIROVA thermal anomaly data beginning in May 2014 clearly shows the episodic periods of active heat flow at Nyamuragira from late May 2014 through April 2017 (figure 55). During the first episode, from late May to early September 2014, lava fountains were observed in early July, and reported to be active through September (BGVN 40.01). Campion (2014) and Smets and others (2014) debated whether the lava lake first appeared in April or not until November. On 6 November 2014 a small lava lake was confirmed at the base of the summit pit when sighted during an OVG helicopter survey. Both MODVOLC and MIROVA thermal anomalies appeared again in early November and persisted through the end of the year.
Thermal anomalies were persistent throughout 2015, with a noted increase in both frequency and magnitude during July (figure 55 C). A NASA Earth Observatory image from 9 February 2015 clearly shows active plumes venting from both Nyamuragira and Nyiragongo (figure 56). MONUSCO-supported summit crater visits by researchers on 2 April 2015, and photographer Oliver Grunwald on 10 July 2015, confirmed the presence of an active lava lake during both visits (figure 57, and video link in Information Contacts).
The MIROVA and MODVOLC thermal anomaly data suggest that the lava lake at Nyamuragira was active until 4 April 2016 when the signals abruptly ended (figure 55 D). This also corresponds closely in time to when the major SO2 emissions captured by NASA also ceased. Observations by Dario Tedesco at the summit on 6 April 2016, during a UNICEF and MONUSCO-sponsored helicopter overflight, showed only an incandescent vent releasing hot gases, and no active lava lake. A small lava lake was again visible in the pit crater on 27 April 2016 when observed by Sebastien Valade of the University of Florence on another MONUSCO-sponsored flight (figure 58).
Thermal anomaly data from MIROVA suggest a pulse of activity during late April through early June 2016 (figure 55 D). This was followed by a period from early June through early November 2016 with no record of activity at Nyamuragira. The MIROVA signal reappeared in early November, followed by intermittent MODVOLC thermal alerts beginning on 27 November. A new pulse of thermal activity, with values similar to those observed during July 2015-April 2016, reappeared in early January 2017 (figure 55 E) and continued through April 2017. On an OVG-sponsored visit to the summit crater on 11 March 2017, independent journalist Charly Kasereka photographed the summit crater with incandescent lava covering the crater floor (figure 59).
Sulfur dioxide and thermal anomaly data. Abundant sulfur dioxide emissions at Nyamuragira during November 2011-April 2017 show large variations in both magnitude and frequency during the period (table 3). A plot of the SO2 data (figure 60) reveals a sharp increase in both the number of days per month with DU greater than 2 and the actual maximum DU value during the active flank eruption between November 2011 and February 2012. After lower values during March 2012, they rise steadily and remain significantly elevated for all of 2013. Values drop briefly in early 2014 and then rise again during April 2014, remaining elevated through February 2016 before dropping off significantly.
A similar plot of the number of monthly MODVOLC thermal alert pixels for Nyamuragira from November 2011 through April 2017 (figure 61) shows that there were no thermal alerts for the period from April 2012-February 2014 when SO2 emissions were large and frequent. In contrast, there were frequent thermal alerts from June 2014-April 2016 when SO2 emissions were also high.
Table 3. Days per month that SO2 values over the Nyamuragira and Nyiragongo area exceeded 2 Dobson Units (DU), October 2011-April 2017, and maximum DU values for each month. Data represent minimum values due to OMI row anomaly missing data (gray stripes), and missing days. SO2 is measured over the entire earth using NASA's Ozone Monitoring Instrument (OMI) on the AURA spacecraft. The gas is measured in Dobson Units (DU), the number of molecules in a square centimeter of the atmosphere. If you were to compress all of the sulfur dioxide in a column of the atmosphere into a flat layer at standard temperature and pressure (0 C and 1013.25 hPa), one Dobson Unit would be 0.01 millimeters thick and would contain 0.0285 grams of SO2 per square meter.
| MONTH |
No. days DU > 2 |
MAX DU (>2) |
Date of Max DU |
Comments |
| Oct 2011 |
0 |
-- |
-- |
-- |
| Nov 2011 |
23 |
80.23 |
9 |
-- |
| Dec 2011 |
27 |
26.70 |
30 |
-- |
| Jan 2012 |
16 |
7.71 |
8 |
Only 21 days of data |
| Feb 2012 |
10 |
5.32 |
18 |
-- |
| Mar 2012 |
2 |
2.22 |
31 |
-- |
| April 2012 |
9 |
5.31 |
27 |
Daily >2 values begin ~ 20 April |
| May 2012 |
20 |
27.06 |
8 |
Surge, 5-10 May |
| Jun 2012 |
24 |
67.10 |
7 |
Large plumes all month |
| Jul 2012 |
25 |
15.91 |
9 |
-- |
| Aug 2012 |
17 |
14.27 |
28 |
-- |
| Sep 2012 |
24 |
12.78 |
11 |
Several days DU>10 |
| Oct 2012 |
24 |
16.86 |
31 |
Constant large plumes |
| Nov 2012 |
27 |
21.09 |
1 |
Many high DU values |
| Dec 2012 |
26 |
16.69 |
16 |
-- |
| Jan 2013 |
11 |
6.80 |
10 |
-- |
| Feb 2013 |
7 |
14.34 |
2 |
-- |
| Mar 2013 |
14 |
6.15 |
22 |
-- |
| Apr 2013 |
15 |
8.93 |
16 |
-- |
| May 2013 |
16 |
11.45 |
25 |
-- |
| Jun 2013 |
22 |
29.68 |
10 |
Big surge 6-14 |
| Jul 2013 |
18 |
11.82 |
12 |
-- |
| Aug 2013 |
14 |
6.11 |
29 |
-- |
| Sep 2013 |
20 |
9.46 |
25 |
-- |
| Oct 2013 |
16 |
4.45 |
28 |
-- |
| Nov 2013 |
12 |
6.76 |
10 |
-- |
| Dec 2013 |
18 |
17.79 |
14 |
-- |
| Jan 2014 |
3 |
4.13 |
27 |
-- |
| Feb 2014 |
2 |
5.18 |
10 |
-- |
| Mar 2014 |
3 |
4.86 |
11 |
-- |
| Apr 2014 |
10 |
6.49 |
10 |
-- |
| May 2014 |
0 |
-- |
-- |
-- |
| Jun 2014 |
14 |
18.24 |
29 |
Surge begins 24 June |
| Jul 2014 |
23 |
27.40 |
24 |
Large plumes most of the month |
| Aug 2014 |
23 |
23.65 |
25 |
-- |
| Sep 2014 |
12 |
158.92 |
10 |
Big surge begins late Aug – 13 Sep, then stops abruptly. Largest plumes of interval |
| Oct 2014 |
0 |
-- |
-- |
-- |
| Nov 2014 |
11 |
17.86 |
29 |
6-11, 23, 27-30 |
| Dec 2014 |
26 |
22.82 |
22 |
1-27 |
| Jan 2015 |
8 |
6.96 |
18 |
-- |
| Feb 2015 |
15 |
23.73 |
19 |
-- |
| Mar 2015 |
19 |
8.56 |
28 |
-- |
| Apr 2015 |
23 |
17.80 |
29 |
-- |
| May 2015 |
25 |
10.78 |
10 |
-- |
| un 2015 |
25 |
17.74 |
25 |
-- |
| Jul 2015 |
18 |
11.95 |
18 |
-- |
| Aug 2015 |
17 |
9.32 |
19 |
-- |
| Sep 2015 |
18 |
9.51 |
4 |
-- |
| Oct 2015 |
18 |
9.61 |
31 |
-- |
| Nov 2015 |
17 |
7.06 |
16 |
-- |
| Dec 2015 |
14 |
8.42 |
13 |
-- |
| Jan 2016 |
6 |
5.40 |
19 |
-- |
| Feb 2016 |
6 |
3.34 |
11 |
-- |
| Mar 2016 |
1 |
4.15 |
9 |
-- |
| Apr 2016 |
0 |
-- |
-- |
-- |
| May 2016 |
2 |
3.06 |
19 |
-- |
| Jun 2016 |
0 |
-- |
-- |
Only 18 days data |
| Jul 2016 |
0 |
-- |
-- |
-- |
| Aug 2016 |
0 |
-- |
-- |
-- |
| Sep 2016 |
0 |
-- |
-- |
-- |
| Oct 2016 |
0 |
-- |
-- |
-- |
| Nov 2016 |
2 |
3.50 |
27 |
-- |
| Dec 2016 |
0 |
-- |
-- |
-- |
| Jan 2017 |
0 |
-- |
-- |
-- |
| Feb 2017 |
No Data |
No Data |
-- |
-- |
| Mar 2017 |
0 |
1.5 |
-- |
-- |
| Apr 2017 |
0 |
1.5 |
-- |
-- |
References: Campion, R., 2014, New lava lake at Nyamuragira volcano revealed by combined ASTER and OMI SO2 measurements, 7 November 2014, Geophysical Research Letters (URL: http://onlinelibrary.wiley.com/doi/10.1002/2014GL061808/full).
Coppola, D., Campion, R., Laiolo, M., Cuoco, E., Balagizi, C., Ripepe, M., Cigolini, C., Tedesco, D., 2016, Birth of a lava lake:Nyamulagira volcano 2011-2015. Bull Volcanol (2016) 78: 20. doi:10.1007/s00445-016-1014-7.
Smets, B., d'Oreye, N., Kervyn, F., 2014, Toward Another Lava Lake in the Virunga Volcanic Field?, 21 October 2014, EOS, Transactions American Geophysical Union (URL: http://onlinelibrary.wiley.com/doi/10.1002/2014EO420001/pdf).
Smets, B., d'Oreye, N., Kervyn, F., Kervyn, M., Albino, F., Arellano, S., Bagalwa, M., Balagizi, C., Carn, S.A., Darrah, T.H., Fernández, J., Galle, B., González, P.J., Head, E., Karume, K., Kavotha, D., Lukaya, F., Mashagiro, N., Mavonga, G., Norman, P., Osodundu, E., Pallero, J.L.G., Prieto, J.F., Samsonov, S., Syauswa, M., Tedesco, D., Tiampo, K., Wauthier, C., Yalire, M.M., 2014. Detailed multidisciplinary monitoring reveals pre- and co-eruptive signals at Nyamulagira volcano (North Kivu, Democratic Republic of Congo). Bull Volcanol 76 (787): 35 pp.
Smets, B., Kervyn, M., Kervyn, F., d'Oreye, N., 2015. Spatio-temporal dynamics of eruptions in a youthful extensional setting: Insights from Nyamulagira volcano (D.R. Congo), in the western branch of the East African Rift. Earth-Science Review 150, 305-328. doi:10.1016/j.earscirev.2015.08.008
Geologic Background. Africa's most active volcano, Nyamulagira (also known as Nyamuragira), is a massive high-potassium basaltic shield about 25 km N of Lake Kivu and 13 km NNW of the steep-sided Nyiragongo volcano. The summit is truncated by a small 2 x 2.3 km caldera that has walls up to about 100 m high. Documented eruptions have occurred within the summit caldera, as well as from the numerous flank fissures and cinder cones. A lava lake in the summit crater, active since at least 1921, drained in 1938, at the time of a major flank eruption. Recent lava flows extend down the flanks more than 30 km from the summit as far as Lake Kivu; extensive lava flows from this volcano have covered 1,500 km2 of the western branch of the East African Rift.
Information Contacts: Observatoire Volcanologique de Goma (OVG), Departement de Geophysique, Centre de Recherche en Sciences Naturelles, Lwiro, D.S. Bukavu, DR Congo; NASA Goddard Space Flight Center (NASA/GSFC), Global Sulfur Dioxide Monitoring Page, Atmospheric Chemistry and Dynamics Laboratory, 8800 Greenbelt Road, Goddard, Maryland, USA (URL: https://so2.gsfc.nasa.gov/); NASA Earth Observatory, EOS Project Science Office, NASA Goddard Space Flight Center, Goddard, Maryland, USA (URL: http://earthobservatory.nasa.gov/); Hawai'i Institute of Geophysics and Planetology (HIGP), MODVOLC Thermal Alerts System, School of Ocean and Earth Science and Technology (SOEST), Univ. of Hawai'i, 2525 Correa Road, Honolulu, HI 96822, USA (URL: http://modis.higp.hawaii.edu/); MIROVA (Middle InfraRed Observation of Volcanic Activity), a collaborative project between the Universities of Turin and Florence (Italy) supported by the Centre for Volcanic Risk of the Italian Civil Protection Department (URL: http://www.mirovaweb.it/); Tom Pfeiffer, Volcano Discovery (URL: http://www.volcanodiscovery.com/); Erik Klemetti, Eruptions Blog, Wired (URL: https://www.wired.com/author/erikvolc/); Cultur Volcan, Journal d'un volcanophile (URL: https://laculturevolcan.blogspot.com/); MONUSCO, United Nations Organization Stabilization Mission in the DR Congo (URL: https://monusco.unmissions.org/en/); Oliver Grunewald, Video filmed on 10 July 2015 (URL: https://laculturevolcan.blogspot.fr/2015/07/le-lac-de-lave-du-volcan-nyamuragira.html).
Reventador (Ecuador) — June 2017 Cite this Report
Reventador
Ecuador
0.077°S, 77.656°W; summit elev. 3562 m
All times are local (unless otherwise noted)
Lava flows, pyroclastic flows, and ash plumes monthly during June 2014-December 2015
The andesitic Volcán El Reventador lies well east of the main volcanic axis of the Cordillera Real in Ecuador and has historical observations of eruptions of numerous lava flows and explosive events going back to the 16th century. The largest historical eruption took place in November 2002 and generated a 17-km-high eruption cloud, pyroclastic flows that traveled 8 km, and several lava flows. This report briefly summarizes activity between 2002 and June 2014, and covers details of activity from July 2014 through December 2015. The volcano is monitored by the Instituto Geofisico-Escuela Politecnicia Nacional (IG) of Ecuador, and the Washington Volcanic Ash Advisory Center (VAAC).
Summary of 2002-2014 activity. Intermittent activity including pyroclastic flows, ash plumes, lava flows and explosive events took place between 2003 and 2008. Since July 2008 there have been persistent gas-and-ash plumes, dome growth, and both pyroclastic and lava flows. Lahars are also very common in this high-rainfall area, and cause damage to infrastructure on a regular basis. A lava dome was first observed growing in September 2009 within the crater that formed during the 2002 eruption. By July 2011, it had reached the height of the highest part of the crater rim; by January 2013 it filled the crater and formed a new summit, 100 m above the E rim. This led to lava blocks travelling down the flanks, in addition to the lava flows and pyroclastic flows traveling down the flanks of the cone inside the crater during 2012-2014. A summary of thermal anomalies compiled from MIROVA data (figure 46) demonstrates the ongoing but intermittent nature of heat flow between 2002 and 2014.
Summary of June 2014-December 2015 activity. Activity was very consistent throughout the period of June 2014 through December 2015. The thermal webcam captured images of lava flows, pyroclastic flows and ejected incandescent blocks nearly every month. MODVOLC thermal alerts were reported every month except March 2015. Satellite imagery of hot spots were common as well. The Washington VAAC reported observations of ash plumes every month, although they generally rose only to altitudes below 5.6 km (2 km above the summit). IG reported seismicity as varying between moderate and high during the period.
Activity during June-December 2014. Activity during June 2014 was characterized by numerous explosions and small pyroclastic flows that descended the flanks of the cone. The Washington VAAC issued two series of reports on 11-12 and 19-20 June. A pilot reported an ash plume on 11 June rising 2.8 km above summit at 6.4 km altitude and drifting W, and the next day ash was observed 1.8 km above the summit. Weather generally obscured satellite views. On 19 June, multiple small emissions of volcanic ash were seen in the observatory webcam along with incandescent material on the flanks. MODVOLC thermal alerts were issued on 5, 21, and 30 June.
IG reported a new lava flow on 2 July 2014 descending 400 m on the SSW flank. A pyroclastic flow was also reported on 2 July (figure 45, BGVN 39:07) extending 1,500 m down the S flank. IG noted ash emissions on 2, 4, 9-12, 18, 22-24, and 27 July rising 800 m to 2 km above the summit. MODVOLC reported multi-pixel thermal alerts on 2, 16, and 27 July, and single pixel alerts on 10 and 25 July. In addition to the ash plumes reported by IG, the Washington VAAC reported on-going ash emissions and detected hotspots at the crater on 31 July.
The Washington VAAC issued a report of hot spots visible in satellite imagery on 1 August 2014 and a pilot report of an ash plume at 6.1 km altitude (2.5 km above the summit) on 25 August. The only MODVOLC thermal alerts were issued on 31 August. IG reported lower level plumes (300-800 m above the summit) with minor ash on 6 other days during the month.
Activity increased during September 2014. The Washington VAAC issued reports during 2-4, 18, and 23 September. On 2 September, ash plumes were observed extending about 45 km W of the summit at 5.5 km altitude. Another faint plume of volcanic ash was observed within 20 km of the summit the next day. An ongoing hotspot with possible small ash emissions was noted on 4 September. IG reported an explosion on the morning of 5 September that generated a plume and ejected blocks from the crater that fell ~500 m below the summit on the W flank. A thermal camera detected an explosion on the following day that also included ballistics. MODVOLC thermal alerts were issued on eight days during September. Steam plumes with minor ash rose to around 1 km above the summit and dispersed generally W several times during the month.
A single MODVOLC thermal alert was reported on 6 October 2014. The Washington VAAC reported short 2-3 minute bursts of minor volcanic ash on 19 October which was seen drifting WNW and dispersing within 16 km of the summit below 5.8 km altitude. An additional single pixel thermal alert was issued on 25 October, and a three-pixel alert appeared on 29 October.
IG reported steam-and-ash plumes rising up to 1 km above the summit a few times during the month, which were visible on the rare clear-weather days (figure 47). Only two days in November, 5 and 21, had MODVOLC thermal alerts. The Washington VAAC, however, issued reports during 11-12, 18-19, and 27 November of possible low-level ash-bearing plumes. The IG webcam LAVA on the SE flank captured images of pyroclastic flows on 20 and 25 November (figure 48).
On 5 December 2014 a webcam recorded a steam-and-gas emission associated with an incandescent lava flow on the E flank. MODVOLC thermal alert pixels appeared on four days in December 2014 (3, 7, 14, and 23), and VAAC reports of ash plumes were issued on 5, 13-14, 21-22, and 30 December. The largest plume, on 14 December, rose to 6.1 km (2.5 km above the summit) and drifted NE. IG reported moderate seismicity and low-level steam plumes with minor ash content on several occasions.
Activity during 2015. Moderate seismic activity continued during January 2015 with low-level steam-and-ash plumes from explosions rising a few hundred meters above the summit, according to IG. A larger explosion reported by IG on 16 January generated an ash plume that rose 2 km and drifted SE. The Washington VAAC reported activity from 14-18 January, and again on 26 January. Their reports were of small puffs of ash within a kilometer of the summit drifting for a few hours before dissipating. MODVOLC thermal alerts were issued on 15 and 29 January.
Steam plumes containing minor amounts of ash were recorded a few times during February 2015 during periods of moderate seismicity. The Washington VAAC issued several reports, during 7-9, 13-17, 19-21, 24, and 26-28 February, noting occasional plumes with ash rising to less than one km above the summit, and hot-spots seen in satellite imagery on 13-14, 17, 19, and 27 February. An aircraft reported volcanic ash on 19 February at 6.1 km altitude. A new lava flow first observed on the SW flank on 11 February had advanced 1 km by 19 February. This is consistent with the four-pixel MODVOLC thermal alert issued on 18 February. Single pixel alerts were issued on 7, 19, and 23 February as well.
No MODVOLC thermal alerts were issued during March 2015, but the Washington VAAC continued to note low-level small bursts of ash emissions several times a week within 15 km of the summit, as reported by IG. The webcam captured a hotspot at the summit on 11 March. A thermal camera image of a lava flow taken on 13 March showed the visible part of it to be over 500 m long (figure 49), and IG noted in their 13 March report that is was actually about 1.5 km long that day.
Activity during April 2015 included moderate seismicity and incandescence at the crater reported by IG. A lava flow on the SW flank was visible with the infrared camera during the first week; this agrees with the 5-pixel MODVOLC thermal alert recorded on 5 April and the bright hotspot observed in both satellite imagery and the webcam during 3-5 April. Hot spots were observed via satellite and webcam several additional times during the month. Additional thermal alerts also appeared on 10 and 21 April. Steam-and-ash plumes rising to 1 km above the summit were intermittent throughout the month, mostly observed from the webcam.
Multi-pixel MODVOLC thermal alerts appeared during 2-3, 20, and 30 May, indicating continued sources of heat from lava flows. In a special report issued on 19 May, IG noted a new lava flow during the previous week that descended the S flank, forming a fan with three lobes on the SE and SW flanks. The length was greater than 1,000 m from the summit on 19 May, although the flows remained on the flanks of the summit cone within the caldera (figure 50). IG noted an increase in emission tremor on 17 May which may have been related to the extrusion of the lava, but weather conditions prevented visual confirmation. During 17-30 May, intermittent low-level gas-and-ash plumes within 15 km of the summit were reported on most days.
MODVOLC thermal alerts diminished during June 2015, occurring only on 8 and 15 June. Nonetheless, thermal images showed lava flows down the SW and S flanks of the cone several times, and hot spots were observed in satellite images and on the webcam when the weather permitted. Steam-and-ash plumes were generally reported to rise to 1 km or less above the summit and drift usually NW or SW within 15 km of the volcano. A pilot reported volcanic ash on 30 June at 6.7 km, but no ash was seen in satellite imagery under cloudy conditions. IG issued a special report on 24 June noting increased seismicity in the form of increased tremor signal and explosions on 23 June. The thermal camera located in the area of El Copete, 5 km S of the crater, showed an increase in surface activity characterized by several lava flows on the SW, S, and SE flanks exceeding one km in length (figure 51).
Seismic activity was reported as high during July 2015 by IG, and included explosions, tremor, long-period earthquakes, harmonic tremor, and emission signals. During the first week, incandescent material was visible more than 1 km down the SE flank in thermal images. On 17 July, light gray deposits possibly from a pyroclastic flow were observed; on 21 July explosions again ejected incandescent material onto the flanks. Steam and ash emissions were intermittent and generally remained below 5.1 km altitude. MODVOLC thermal alerts appeared on 1, 3, 15, and 17 July.
High levels of seismic activity continued during August 2015. The Washington VAAC reported possible ash plumes on 14 days during the month, and MODVOLC thermal alerts were issued on six dates, including four-pixel alerts on 4 and 27 August suggestive of lava flows and/or incandescent material on the flanks of the cone. A discrete volcanic ash emission on 6 August was reported by the Washington VAAC at 7 km altitude (3.4 km above the summit) with a plume extending about 25 km NW of the summit. Other plumes that were reported by pilots (on 25 August at 8.8 km altitude moving NW, and on 26 August at 6.7 km moving W) were not observed in cloudy satellite imagery.
Ash-and-gas emissions were reported by the Washington VAAC during 14 days in September 2015, generally drifting N and W at altitudes less than 2 km above the crater (5.6 km altitude); high levels of seismicity also continued, according to IG. The Guayaquil MWO reported volcanic ash at 6.1 km on 19 September. Puffs of ash seen in the webcam were reported at 7.3 km altitude on 25 September and thought to have quickly dissipated. MODVOLC thermal alerts appeared on seven days during the month; five of them were two- or three-pixel alerts. An SO2 plume drifting WNW from Reventador was captured by NASA's OMI instrument on 22 September (figure 52).
A series of VAAC reports of low-level minor ash emissions were issued during 1-5 October 2015. After two weeks of no activity, multi-pixel MODVOLC thermal alerts and VAAC reports increased during 20-30 October. The peak MODVOLC activity included 4-6 daily pixels during 26-28 October, and the VAAC reports noted a bright hotspot on the satellite images beginning on 20 October and present for most of the rest of the month. Continuous emissions were observed in the webcam during 22-26 October, generally below 4.6 km, moving NW, and extending up to 40 km from the summit. Continuous emissions appeared again on 30 October at 5.1 km moving W.
During the last two weeks of November 2015, steam, gas, and ash emissions rose to less than 2 km above the summit and incandescent blocks rolled 500 m down the flanks of the cone. MODVOLC thermal alerts were reported for five days between 15 and 29 November. Similar activity was reported during December, although the Washington VAAC only issued reports on four different days, and MODVOLC thermal alerts were recorded only on 6 and 24 December. VAAC reports noted hotspots in satellite imagery on 7 December. The VAAC reports on 11 and 16 December indicated ash plumes at 5.5 km moving W and SW.
Geologic Background. Volcán El Reventador is the most frequently active of a chain of Ecuadorian volcanoes in the Cordillera Real, well east of the principal volcanic axis. The forested, dominantly andesitic stratovolcano has 4-km-wide avalanche scarp open to the E formed by edifice collapse. A young, unvegetated, cone rises from the amphitheater floor to a height comparable to the rim. It has been the source of numerous lava flows as well as explosive eruptions visible from Quito, about 90 km ESE. Frequent lahars in this region of heavy rainfall have left extensive deposits on the scarp slope. The largest recorded eruption took place in 2002, producing a 17-km-high eruption column, pyroclastic flows that traveled up to 8 km, and lava flows from summit and flank vents.
Information Contacts: Instituto Geofísico (IG), Escuela Politécnica Nacional, Casilla 17-01-2759, Quito, Ecuador (URL: http://www.igepn.edu.ec/); Washington Volcanic Ash Advisory Center (VAAC), Satellite Analysis Branch (SAB), NOAA/NESDIS OSPO, NOAA Science Center Room 401, 5200 Auth Rd, Camp Springs, MD 20746, USA (URL: http://www.ospo.noaa.gov/Products/atmosphere/vaac/, archive at: http://www.ssd.noaa.gov/VAAC/archive.html); MIROVA (Middle InfraRed Observation of Volcanic Activity), a collaborative project between the Universities of Turin and Florence (Italy) supported by the Centre for Volcanic Risk of the Italian Civil Protection Department (URL: http://www.mirovaweb.it/); Hawai'i Institute of Geophysics and Planetology (HIGP), MODVOLC Thermal Alerts System, School of Ocean and Earth Science and Technology (SOEST), Univ. of Hawai'i, 2525 Correa Road, Honolulu, HI 96822, USA (URL: http://modis.higp.hawaii.edu/); NASA Goddard Space Flight Center (NASA/GSFC), Global Sulfur Dioxide Monitoring Page, Atmospheric Chemistry and Dynamics Laboratory, 8800 Greenbelt Road, Goddard, Maryland, USA (URL: https://so2.gsfc.nasa.gov/); Culture Volcan, Journal d'un volcanophile (URL: https://laculturevolcan.blogspot.fr/).
Nevado del Ruiz (Colombia) — June 2017 Cite this Report
Nevado del Ruiz
Colombia
4.892°N, 75.324°W; summit elev. 5279 m
All times are local (unless otherwise noted)
Intermittent ash emissions July 2012-December 2015; increased thermal activity October-December 2015
A February 2012 ash explosion of Colombia's Nevado del Ruiz volcano was the first confirmed ash emission in over 20 years. The broad, glacier-capped volcano has an eruption history documented back 8,600 years, and historical observations since 1570. Notably, a large explosion at night in heavy rain on 13 November 1985 generated large lahars that washed down 11 flank valleys, inundating most severely the town of Armero where over 20,000 residents were killed. It remains the second deadliest volcanic eruption of the 20th century after Mt. Pelee in 1902 killed 28,000.
This report summarizes and concludes the February 2012-April 2014 eruption (BGVN 37:08, 39:07), and then describes details of new activity beginning in November 2014, through December 2015. The volcano is monitored by the Servicio Geologico Colombiano (SGC) and aviation reports are provided by the Washington Volcanic Ash Advisory Center (VAAC).
Summary of activity, November 1985-June 2012. After the large explosions and deadly lahars of November 1985, activity at Ruiz continued with intermittent ash emissions and significant seismic activity through July 1991. Seismicity, deformation, and SO2 emissions have been closely monitored since the 1985 eruption. Between 1991 and February 2012 intermittent high-frequency seismic events (earthquake swarms) were recorded, but no ash emissions were observed. In September 2010, seismicity notably increased in frequency and diversity of event type until early 2012 when fresh ashfall was observed. INGEOMINAS (Instituto Colombiano de Geología y Minería, precursor to SGC) also noted an inflationary trend in the geodetic data from October 2010 through 2011.
A March 2012 overflight by INGEOMINAS noted minor amounts of ash-covered snow on the E flank, which they surmised came from an explosion on 22 February (BGVN 37:08). During March, long-period seismicity underwent a 20-fold increase. SO2 emissions also dramatically increased between March and June 2012. Several ash emissions from the summit were observed during April-June 2012 (BGVN 37:08). An ash plume that rose to 11 km altitude on 29 May caused ashfall in over 20 communities to the NW and closures at three nearby airports. Widespread ashfall during June covered solar panels on field equipment. An EO-1 satellite image from 6 June 2012 shows a plume and significant ashfall around the summit (figure 71).
Summary of activity, July 2012-December 2015. Explosions and seismic tremor with ash emissions continued during July and August 2012. Ashfall was reported within 30 km on numerous occasions. From September 2012 through early July 2013 minor amounts of ashfall were reported a few times each month, mostly in the immediate vicinity of the volcano. After a larger explosion on 11 July 2013, sparse and intermittent ash emissions were reported between August 2013 and April 2014. Between May and October 2014 there were no reports of ash emissions or thermal anomalies.
A significant increase in seismicity occurred during the second week of November 2014, and ash was seen at the summit during an overflight on 19 November. Ash fell in communities within 30 km several times each month through December 2015. Seismic evidence suggesting possible lava dome extrusion first appeared in August 2015, and stronger signals were recorded on 22 October. Thermal anomalies around the summit crater increased in frequency and magnitude during the last three months of 2015.
Activity during July 2012-October 2014. A large ash plume on 30 June 2012 prompted evacuation warnings to several communities within 30 km and closed three nearby airports for the second time within 30 days. On 2 July the Washington VAAC reported a 7.5-km-wide ash plume at 6.1 km altitude drifting 75 km W (BGVN 37:08). Additional VAAC reports were issued on 8, 9, and 10 July for SO2 emissions containing minor volcanic ash. SGC noted that explosions and ash emissions continued throughout the month in spite of a decrease in seismicity. Ashfall was reported near the volcano, and in municipalities in the departments of Caldas (W) and Risaralda (SW), steadily throughout the month.
Tremors associated with continuing gas and ash emissions occurred throughout August 2012; ash plumes were observed rising 200-800 m above the summit crater. During 3-6 August, gas and ash emissions were seen from Manizales (30 km NW) and Chinchiná (30 km WNW). On 12 August, a gas-and-ash plume observed with a webcam rose 1 km above the crater and drifted W, and ashfall was reported in Brisas (50 km SW). A layer of ash was deposited at the Observatorio Vulcanológico y Sismológico de Manizales (OVSM) on 13 August; they also reported ash emissions associated with seismic signals the next evening. Webcams showed gas-and-ash plumes rising 400 m and drifting W and NW during 15-16 August.
Minor amounts of ashfall were reported by SGC in areas around the volcano each month during September 2012 through 11 July 2013 (table 4), when a larger ash emission occurred. A noted increase in seismicity beginning on 13 April 2013 was also reported by SGC. The ash emission on 11 July was captured by the webcam in the Parque Nacional Natural Los Nevados (PNNN) (figure 72), and fine ash fell in Manizales. The Washington VAAC reported the ash plume at 6.1 km altitude. Multispectral imagery showed the plume extending 55 km NW. After 12 July 2013 there were no further reports from the Washington VAAC until December 2014.
Table 4. Ash emission events at Ruiz during September 2012-July 2013. Data compiled from various sources as shown.
| Date |
Event |
Details |
Source |
| 06 Sep 2012 |
Small explosion |
Small ash emission. |
SGC Weekly Report, 3-9 Sep 2012 |
| 10 Oct 2012 |
Ash plume |
7.3 km altitude, drifting 35 km NW. |
Washington VAAC |
| 15-16 Nov 2012 |
Possible ash emission |
Weather clouds prevented observation, faint thermal anomaly detected. |
Washington VAAC |
| 10 Dec 2012 |
Tremor |
Early morning, gas and ash emissions. |
SGC Weekly Report, 3-9 Dec (published 11 Dec) 2012 |
| 09 Jan 2013 |
Tremor |
Ash and gas emission, ashfall reported in the Valle de las Tumbas, W of the summit crater. |
SGC Weekly Report, 7-13 Jan 2013 |
| 16 Jan 2013 |
Faint ash plume |
Drifting NE 50 km; hot spot. |
Washington VAAC |
| 11 Feb 2013 |
Gas and ash plume |
Webcam images and visual observation from Observatorio Manizales, 1,600 m above the crater. |
SGC Monthly Technical Report, February 2013 |
| 07-10 Mar 2013 |
Continuous tremor |
Gas and ash emissions reported by officials from the Parque Nacional Natural los Nevados (PNNN). |
SGC Weekly Report, 4-10 Mar 2013. |
| 11-17 Mar 2013 |
Continuous tremor |
Gas and ash emissions. |
SGC Weekly Report, 11-17 Mar 2013 |
| 10-30 Apr 2013 |
Constant tremor |
Small gas and ash emissions beginning 10 April. |
SGC Monthly Technical Report, Apr 2013 |
| 14 Apr 2013 |
Gas and ash plume |
Webcam image of gas and ash plume rose 630 m and drifted NW. |
INGEOMINAS daily report, 14 Apr 2013 |
| 15-21 Apr 2013 |
Ashfall confirmed |
Ashfall confirmed near Villahermosa (Tolima), 30 km NE. |
SGC Weekly Report, 15-21 Apr 2013 |
| 22 and 27 May 2013 |
Ash and gas emissions |
Confirmed by seismic signals as well as the webcams. |
SGC Monthly Report, May 2013 |
| Jun 2013 |
Low-energy tremors |
Associated with gas and ash emissions, pulses of low energy. |
SGC Monthly Technical Report, June 2013 |
| 11 Jul 2013 |
Small ash emission |
Confirmed by OVSM webcams, and officials at PNNN. Ashfall reported in Valle de las Tumbas and Manizales. |
SGC Monthly Technical Report, July 2013; SGC Weekly Report 8-14 July 2013; Washington VAAC |
Evidence for ash emissions between August 2013 and April 2014 is sparse and intermittent. The SGC Monthly reports during this time mention pulses of low-energy tremor associated with emissions of gases, steam, and small amounts of ash every month except November, when they reported only steam and gas, but no specific dates are given. SGC's Technical Information Monthly reports mention occasional grayish coloration, suggesting ash in the gas-and-steam plumes during August-October 2013. Tremors associated with small amounts of ash and grayish coloration in the plumes are again noted from January through April 2014 without describing specific events.
The weekly activity reports issued by SGC make no mention of ash from August through November 2013. They note in weekly reports for 2-8 and 9-15 December that gray emissions possibly associated with ash in plumes of mostly water vapor and gases were observed. During the week of 16-23 December they recorded low-energy tremors associated with the output of small amounts of ash, which were reported in trace quantities in Manizales. In their 31 December 2013-6 January 2014 and 10-16 February 2014 weekly reports they noted the occurrence of tremors associated with ash and gas. There is no mention of ash in their March or April 2014 weekly reports. There is also no mention of ash emission in SGC monthly reports during May-October 2014. The MIROVA thermal anomaly data do show minor thermal anomalies in latest August and more persistent anomalies at the beginning of October 2014 (figure 73) prior to the reports of ash emissions during November.
Activity during November 2014-December 2015. A significant change in seismicity occurred beginning in the second week of November 2014. There was an increase in the number of long-period (LP) earthquakes, pulses of volcanic tremor, and several periods of continuous tremor (lasting for hours or even days) associated with fluid movement, and with emissions of gas and ash (table 5). Several of these periods were preceded by an LP event. The first significant pulse of volcanic tremor began on the evening of 18 November following an LP event and lasted more than 12 hours.
Table 5. Periods of continuous tremor associated with ash emissions at Ruiz during November 2014. Some of the tremor episodes were preceded by long-period (LP) events. Courtesy of SGC (Informe de Actividad, November 2014).
| Date |
Time (local) |
Duration |
LP event (local time) |
| 18 Nov 2014 |
1918 |
More than 12 hours |
1918 |
| 20 Nov 2014 |
0224 |
More than 20 hours |
0223 |
| 21 Nov 2014 |
0108 |
More than 4 hours |
-- |
| 28 Nov 2014 |
1310 |
More than 4 hours |
1305 |
| 28 Nov 2014 |
1941 |
More than 8 hours |
-- |
| 29 Nov 2014 |
1307 |
More than 48 hours |
1305 |
The Unidad Nacional de Gestion de Riesgo de Desastres (UNGRD, National Disaster Risk Management Unit) coordinated an overflight during 19-21 November 2014 and observed fresh ash deposits on the S flank. Ash emissions were also verified in satellite imagery (figure 74) and by reports from nearby communities. The ash dispersed generally SE and SW during 18-21 November. Ash was again observed on the N side of the Arenas crater on 29 November in the early morning after a lengthy period of continuous tremor was recorded the previous day (see table 5).
During the second half of December 2014, SGC reported significant concentrations of ash in the emissions that were associated with continuous tremor episodes. On 15 December seismic signals indicating ash emissions were detected, and then confirmed by a local webcam and nearby residents. The Washington VAAC also noted an ash emission based on a pilot observation extending 16 km S at 7.6 km altitude. The next day they reported a narrow plume of minor volcanic ash extending 22 km SW of the summit at 6.1 km altitude. On 18 and 19 December the Washington VAAC reported ash plumes to altitudes of 7.9 and 9.1 km, respectively, that drifted SSW and dissipated within a few hours. A faint thermal anomaly was also detected. A satellite image taken on 26 December 2014 clearly shows ash deposits in nearly all directions from the Arenas crater (figure 75). Ashfall was reported during this time in the Caldas (W) and Risaralda (SW) departments.
According to the news source Prensa Latina, increased ash emissions at Ruiz prompted closure of the La Nubia airport (22 km NW) on 7 January 2015. On 14 January, the Washington VAAC reported an ash plume visible in satellite imagery extending 16 km SW of the summit at 6.7 km altitude. SGC reported seven episodes of continuous tremor on 4, 7, 14, 24, 26, 28, and 29 January, almost all of which were associated with ash emissions (figures 76). Ashfall was reported several times after these episodes in the Eje Cafetero area to the W of Ruiz.
Occasional minor ash emissions were reported during February 2015 during periods of continuous tremor, but most of the emissions were steam and gas. On 9 February, ashfall was reported in El Libano (29 km E), El Oso (10 km SE), and Murillo (17 km E). Although seismic tremors were diminished during March from the previous month, emissions associated with these tremors contained gases and minor amounts of ash from 8 March through the end of the month. Ashfall was reported after a tremor in the evening on 8 March by personnel from the Parque Nacional Natural Los Nevados (PNNN), the Observatorio Vulcanológico y Sismológico de Manizales (OVSM), and from the municipalities of Manizales and Villamaria (27 km NW).
An increase in several types of seismicity was observed by SGC during April 2015. Volcanic tremor, associated with gas and ash emissions, were confirmed through photographs taken by the webcams (figure 77), and by officials at PNNN and SGC. Ashfall was reported on 20 April in the municipalities of Manizales and Villamaría. The Washington VAAC reported a small puff of gas and minor amounts of ash visible in satellite imagery on 22 April at 7.3 km altitude drifting W about 40 km before dissipating. The MIROVA signal from the MODIS thermal anomaly data shows persistent thermal activity from late October 2014 through mid-April 2015 (figure 73).
Ash emissions were photographed by the webcams located in the Azufrado and Cerro Guali regions on at least eleven dates during May 2015. The Washington VAAC reported possible emissions on 19 and 26 May, but extensive weather clouds prevented satellite observations. Most of the frequent episodes of volcanic tremor during June were also associated with ash emissions which were photographed at least six times during the month. The Observatory at Manizales reported ash moving WNW on 6 June at about 800 m above the summit; weather clouds obscured satellite observations by the Washington VAAC.
A significant increase in ashfall was reported during July 2015 (figure 78), including in the regions of Caldas, Tolima, and Risaralda, as well as by officials in the Park (PNNN). The Observatory at Manizales (OVSM) reported an ash plume on 6 July at about 7.3 km altitude, but it was not observed in satellite data due to weather. The Washington VAAC noted ash emissions visible in satellite data and the webcam on 13 July, with a plume at 7 km altitude drifting NW a few tens of kilometers before dissipating. OVSM reported plumes at about 6 km moving S and W during 18-20 July. Seismic signals indicating emissions were reported on 23 July and observed in the webcam, according to the Washington VAAC. SGC noted seismic tremors and a plume on the morning of 26 July that rose to 3 km above the summit (8.2 km altitude) (figure 79); near summit-level emissions were also observed via the webcam on 26 and 27 July. Seismic data indicated continued occasional bursts of ash drifting W to WSW during the next few days. Ashfall was reported downwind in the municipalities of Chinchina (33 km NW), Palestina (35 km NW), Santa Rosa de Cabal (33 km W), Dosquebradas (40 km WSW), and Pereira (40 km WSW). A bright thermal anomaly was reported in satellite imagery on 31 July, but no ash was observed.
SGC reported greater instability at Ruiz compared with previous months during August 2015. Seismicity related to fracturing and fluid flow both increased during the month. Energy levels for spasmodic tremor related to gas and ash emissions were also generally higher. The Washington VAAC reported ash visible in satellite imagery on 6 August at 7.3 km altitude moving NW as far as 20 km for about 10 hours before dissipating. They noted another possible plume with minor ash on 12 August at 6.7 km drifting 55 km NW from the summit. Ashfall was reported on 23 August from officials of PNNN and residents of Pereira. A brief emission containing minor ash on 28 August, observed in a webcam, was reported by the Washington VAAC as extending about 35 km W. Ongoing emissions rising a few hundred meters above the summit with occasional small bursts of ash continued for the next two days.
The tremor event on 31 August 2015 was the largest since 18 November 2014; ashfall affected numerous cities and municipalities, including Manizales (30 km NW) (with the largest particle sizes towards the E side of the city), La Linda, La Cabaña (36 km NW), and trace amounts in Santagueda (40 km NW), Arauca (48 km NW), Kilómetro 41, Villamaría (27 km NW), Chinchiná, Palestina, and Neira (36 km NW) (figure 80). A news article reported that the La Nubia airport closed that day due to ash emissions. Most ash emissions during the month affected the regions of Caldas and Risaralda NW of the volcano.
The Washington VAAC issued advisory reports on 3, 12-15, 17, 23-24, 27, and 29-30 September 2015. Most reports were based on observations from the webcams near the volcano and/or seismic activity, but many events were not visible in satellite imagery due to weather clouds. Plume altitudes ranged from 5.5 to 7.9 km. Incandescence observed in a webcam on 4 September was followed by a high-energy tremor. The ash plumes reported by the Washington VAAC on 12 and 13 September rose to 7.9 km and drifted in several directions. Ash was moving to the NW below 5.2 km and extended for over 90 km; between 5.2 and 7.9 km altitude it extended about 80 km SW. Ongoing emissions with small bursts of ash continued through 15 September with a new emission to 7.6 km around 1600 that day.
The OVSM reported a strong seismic signal at 0728 on 17 September, but weather clouds blocked observation from satellite imagery of the potential ash plume. The largest tremor of the month occurred in the afternoon of 18 September and ash emissions were verified in the webcams as well as by SGO officials doing fieldwork in the area; ash emissions were also observed in the webcam on 19 September at 1556. SGO reported a seismic event on 22 September that produced water-vapor, gas, and ash plumes that rose 2 km above the crater and drifted mainly NW. An ash plume was confirmed by the Washington VAAC in a satellite image on 27 September extending about 70 km WNW at 6.1 km altitude. An advisory issued on 29 September noted ash to 8.5 km within 16 km of the summit. SGO noted that the 29 September emissions were observed both E and W of the volcano.
The Washington VAAC confirmed continuous ash emissions on 5 October 2015 at 7 km altitude extending about 25 km W of the summit. A gas, steam, and ash plume rose 1.7 km and drifted NW on 8 October. Another report of volcanic ash early on 9 October was not visible in satellite imagery, although a thermal anomaly persisted and seismicity was elevated. A small ash emission was spotted in imagery data drifting WNW late on 9 October. A gas, steam, and ash plume rose 1.8 km and drifted NW on 17 October. A discrete emission of ash rose to 9.1 km altitude on 22 October and drifted N. SGO reported ash emissions observed in webcams on 26 October, but weather clouds prevented satellite observation by the Washington VAAC. A gas, steam, and ash plume rose 1.7 km and drifted NW on 30 October.
SGC first noticed an unusual pattern of seismicity known as a "drumbeat" signal, for which they issued a special report on 20 August 2015. The "drumbeat" signal is characterized by discrete episodes of short duration (about 30 minutes each) that repeat at regular time intervals and show similar waveforms and energy. They are interpreted by volcanologists to represent phenomena associated with the ascent of high-viscosity magma to the surface and thus are an indicator of near-surface extrusion or dome building. SGC recorded the same signal on 8 September, and then again on 22 October (figure 81). Thermal anomalies near the Arenas crater were observed by SGO on 26, 28, and 30 September, and were again recorded on 7, 9, and 10 October 2015.
Seismic activity decreased slightly during November 2015, but there still were episodes of volcanic tremor associated with gas and ash emissions that were recorded by the webcams and personnel at PNNN. Continuous tremor signal was recorded on 1 and 4 November. The "drumbeat" signal was again briefly recorded on 13 November. Thermal anomalies increased in frequency and were observed on 4, 18, 20, 22, 26, and 27 November. SGC confirmed ash emissions on 5, 10, 14, 27, and 29 November. The Washington VAAC reported an ash plume on 14 November at 6.4 km altitude moving SW. SGC captured images of the ash plume from two different webcams (figure 82).
Thermal alerts captured by the University of Hawai'i's MODVOLC system appeared in December 2015 for the first time in several years. They were recorded on 3, 22, 26, and 31 December. Additionally, the MIROVA thermal anomaly system showed significant increases in anomalies at Ruiz during the last three months of 2015 (figure 83).
Minor episodes of volcanic tremor with ash emissions were reported by SGC during the first two weeks of December 2015. A significant volcanic tremor with ash emissions occurred on 20 December, and ashfall was reported by SGC officials, PNNN personnel, and residents near the volcano and in the city of Manizales. The Washington VAAC noted the ash plume at 6.1 km altitude with 25 km of the summit. A gas, steam and ash plume rose 1.7 km and drifted NW on 28 December.
Sulfur Dioxide emissions, June 2012-2015. Persistent, large SO2 plumes were captured from Ruiz many times during June 2012-December 2015 (figure 84 and 85). Every month during this period the OMI (Ozone Measuring Instrument) on the Aura satellite recorded days with SO2 emissions exceeding 2 DU (Dobson Units); many months had more than half of the recording days with values > 2 DU. Dobson Units are the number of molecules in a square centimeter of the atmosphere. If you were to compress all of the sulfur dioxide in a column of the atmosphere into a flat layer at standard temperature and pressure, one Dobson Unit would be 0.01 millimeters thick and contain 0.0285 grams of SO2 per square meter.
Geologic Background. Nevado del Ruiz is a broad, glacier-covered volcano in central Colombia that covers more than 200 km2. Three major edifices, composed of andesitic and dacitic lavas and andesitic pyroclastics, have been constructed since the beginning of the Pleistocene. The modern cone consists of a broad cluster of lava domes built within the caldera of an older edifice. The 1-km-wide, 240-m-deep Arenas crater occupies the summit. The prominent La Olleta pyroclastic cone located on the SW flank may also have been active in historical time. Steep headwalls of massive landslides cut the flanks. Melting of its summit icecap during historical eruptions, which date back to the 16th century, has resulted in devastating lahars, including one in 1985 that was South America's deadliest eruption.
Information Contacts: Servicio Geologico Colombiano (SGC), Observatorio Vulcanologico Y Sismologico Manizales, Diagonal 53 N0. 34 - 53 - Bogotá D.C. Colombia (URL: http://www2.sgc.gov.co/Manizales.aspx); Washington Volcanic Ash Advisory Center (VAAC), Satellite Analysis Branch (SAB), NOAA/NESDIS OSPO, NOAA Science Center Room 401, 5200 Auth Rd, Camp Springs, MD 20746, USA (URL: http://www.ospo.noaa.gov/Products/atmosphere/vaac/, archive at: http://www.ssd.noaa.gov/VAAC/archive.html); Hawai'i Institute of Geophysics and Planetology (HIGP), MODVOLC Thermal Alerts System, School of Ocean and Earth Science and Technology (SOEST), Univ. of Hawai'i, 2525 Correa Road, Honolulu, HI 96822, USA (URL: http://modis.higp.hawaii.edu/); NASA Goddard Space Flight Center (NASA/GSFC), Global Sulfur Dioxide Monitoring Page, Atmospheric Chemistry and Dynamics Laboratory, 8800 Greenbelt Road, Goddard, Maryland, USA (URL: https://so2.gsfc.nasa.gov/); NASA Earth Observatory, EOS Project Science Office, NASA Goddard Space Flight Center, Goddard, Maryland, USA (URL: http://earthobservatory.nasa.gov/); MIROVA (Middle InfraRed Observation of Volcanic Activity), a collaborative project between the Universities of Turin and Florence (Italy) supported by the Centre for Volcanic Risk of the Italian Civil Protection Department (URL: http://www.mirovaweb.it/); Prensa Latina, Agencia Informativa Latinoamericana (URL: http://www.plenglish.com/).
Turrialba (Costa Rica) — June 2017 Cite this Report
Turrialba
Costa Rica
10.025°N, 83.767°W; summit elev. 3340 m
All times are local (unless otherwise noted)
Persistent explosions and ash emissions during 2015 and 2016
Strong fumarolic activity characterized activity at Costa Rica's Turrialba for several decades before a phreatic eruption in January 2010 resulted in ashfall tens of kilometers from the volcano. Since the January-March 2010 eruption, there have been one or two brief eruptive episodes with ash emissions each year, generally lasting days to weeks. An episode from 29 October through 8 December 2014 began with an ash explosion, followed by continuous emissions on 30 and 31 October. Several additional explosions with ash emissions occurred during November, followed by a strong Strombolian explosion on 8 December that included ashfall up to 1 cm thick in places, and ballistics deposited 300 m from the vent (BGVN 40:04). This report covers the increasing ash-emission activity during 2015 and 2016. Information comes primarily from the Observatorio Vulcanologico y Sysmologico de Costa Rica-Universidad Nacional (OVSICORI-UNA). Aviation alerts are issued by the Washington Volcanic Ash Advisory Center (VAAC).
Turrialba began a new eruptive episode with an ash plume on 8 March 2015. Frequent, intermittent ash-bearing events continued through mid-May, and tapered off during June, with a final event reported on 22 June 2015. The larger plumes rose 2-2.5 km above the vent rim and drifted in many different directions, leading to ashfall throughout the region as far as 40 km from the volcano. A 'bubble of magmatic gas' dispersed accumulated ash from the vent on 15 August 2015. An eruption on 16 October 2015 was the largest in a year, and the start of a new series of emissions that persisted through the end of October, dispersing ash for tens of kilometers in most directions. A brief period of ash emissions between 2 and 8 February 2016 deposited ash within a few kilometers of the summit crater. Ash emissions and frequent small explosions between 28 April and 7 May preceded a longer series of emissions that began with a significant explosion on 16 May, included significant ashfall in regions within 30 km, and lasted until late July 2016. Strombolian activity and pyroclastic flows were also reported during late May; ashfall was reported up to 100 km SW. A new series of explosions and ash emissions began on 13 September that continued nearly uninterrupted through the end of the year, although ashfall reports were greatest in October 2016.
Activity during 2015. Little activity was reported during January and February 2015. Seismicity slowly increased from short-duration, low-amplitude, higher-frequency events in January to more lower-frequency events in February. Very-long-period earthquakes (VLP's) began to register in February and became more pronounced during March, when some were associated with explosions and ash emissions. The first, short, effusive emissions with low ash content occurred on 8 March. The largest events with prolonged ash emissions occurred on 12 (figure 43) and 15 March.
Based on webcam views, weather models, and OVSICORI-UNA updates, the Washington VAAC reported that on 8 March diffuse ash emissions rose from the Cráter Oeste (West Crater) and seismicity increased. OVSICORI-UNA reported more ash emissions on 11 and 12 March. Almost continuous ash emissions were observed in the afternoon of 12 March punctuated by two noticeable explosions. Ash plumes rose as high as 2 km above the crater and drifted NW. Ashfall also occurred in the Valle Central and in the capital of San José (30 km WSW), and caused the closure of the Juan Santamaria International Airport (48 km W), which reopened during the evening on 13 March. The local Tobias Bolanos airport (40 km WSW) closed intermittently. On 13 March three short-duration explosions were reported. According to the Washington VAAC, ash plumes that day drifted 45 km NE at an altitude of 9.1 km, and drifted over 35 km W at an altitude of 6.1 km.
On 18 March, OVSICORI-UNA reported that gas, vapor, and ash plumes rose from Cráter Oeste and seismicity remained high. Observers in Finca La Central (2 km SW) noted gas-and-steam emissions. On 19 March two gas-and-water-vapor emissions were observed; one from Cráter Central contained a small amount of ash. At 1400 the webcam recorded strong emissions of gas, vapor, and tephra from Cráter Oeste. On 23 March a gas, vapor, and ash plume rose from Cráter Oeste, causing ashfall in areas E and SE of the crater including in the Cráter Central and El Mirador. In addition, a dense and vigorous gas-and-vapor plume caused Parque Nacional Volcán Turrialba authorities to recommend masks for protection against gas inhalation.
There were 11 gas-and-ash eruptions and 10 additional smaller ash emissions during April 2015. OVSICORI-UNA reported that a small ash eruption occurred on 3 April, causing ashfall in nearby areas including Silvia and La Central. On 5 April, an eruption generated a plume that rose 500 m and caused ashfall in Curridabat (31 km WSW), Granadilla (29 km WSW), San Pedro, Desamparados (35 km WSW), Aserrí (40 km SW), San Sebastián (37 km WSW), and Escazú (42 km WSW). The eruption of 7 April was the largest of the month (figure 44), and although it occurred at night, the visible ash plume rose to about 2.5 km above the summit. Ash and sulfur odors were reported in many areas of the city of San José (30-40 km WSW). The largest quantities of ash fell in the La Picada and La Silvia communities a few kilometers NNE of the volcano, and affected several hundred cows and other animals at dairy farms. Small ash emissions occurred on 8, 16, and 18 April, and every day during 20-24 April. The ash on 20 April dispersed N and affected Guápiles (20 km N). On 23 and 24 April, ash dispersed NW and affected the inhabitants of the Valle Central, and was reported at Tobias Bolanos and San Juan Santamaria international airports.
During May 2015, OVSICORI-UNA recorded 39 eruptions with ash emissions. In general, the plumes did not rise more than 500 m above the crater, and a few were accompanied by small pyroclastic flows. The largest events were on 1 and 4 May when emissions lasted for 4 and 23 minutes, respectively. The 4 May event produced an ash plume that rose 2.5 km and drifted SW. The eruption ejected ballistics 1 km from the crater. Most of the ashfall occurred around the crater. Reports of minor ashfall and sulfur odors came from communities 30-40 km WSW around the city of San José (Moravia, Coronado, Mata de Plátano, La Uruca, Guadalupe, Tibás, Calle Blancos, San Pedro Montes de Oca, Sabanilla Montes de Oca, Pavas, Zapote, Escazú, Paso Ancho, Curridabat, Santa Ana), and a few localities in the eastern region of Heredia (40 km W). Additional ash emissions were reported on 6, 11, 14, and 18 May. Although the multiple emissions on 18 May lasted as long or longer than earlier events (23 and 25 minutes), they were lower energy, and the plumes rose only 400-500 m above the summit crater.
OVSICORI-UNA reported that ash emissions occurred on 1, 4, 7, and 22 June 2015. The eruption on 1 June was the largest, and the small ash eruption on the afternoon of 22 June deposited ash mainly in the vicinity of the volcano to the SW (figure 45). They also reported a significant decrease in the seismic activity, such that by late June, the RSAM values had returned to levels similar to October 2014, prior to the start of the most recent eruptive events. Significant rains after April 2015 led to a shallow lake forming in the Cráter Oeste. Images taken in July of the Cráter Central showed deposits of eruptive material more than 2 m thick compared with May 2014.
Seismicity continued to decrease during August 2015. However, an event on 15 August comprised nine hours of tremor associated with the ascent and escape of a bubble of magmatic gas, according to OVSICORI-UNA. The resulting ash ejection was believed to be material that had accumulated at the bottom of the crater. Seismicity remained low during September, with no reported ash emissions.
An increase in seismicity began on 1 October 2015, and until a large eruption on 16 October (figure 46). This was followed on 23 October by a lengthy sequence of ash emissions that continued until 31 October. The 16 October eruption was the largest in terms of energy since the 30 October 2014 eruption. Most of the ash fell on the summit, but a plume headed NW and minor ashfall was reported in parts of the Valle Central such as la Unión, Concepción de Tres Ríos, Montes de Oca (30 km WSW), San Rafael de Coronado (26 km WSW), and Moravia (27 km W). A strong odor of sulfur was reported in Tierra Blanca (18 km SW), Pacayas (12 km SSW), Moravia, and Guadalupe (32 km WSW).
Seismicity increased between 16 and 23 October, when new ash emissions began and were accompanied by pyroclastic flows. Between 23 and 31 October, OVSICORI-UNA reported 57 small emissions and 120 explosions of varying size and characteristics. The Washington VAAC was unable to see most of the emissions in satellite imagery due to weather clouds, however the plumes on 31 October were reported at 4.3 km altitude moving W. Both seismic and eruptive activity declined considerably during November 2015. OVSICORI-UNA reported one small eruption on 27 November and a small explosion on 30 November; they did not mention ash related to either event.
Activity during 2016. OVSICORI-UNA reported a brief emission of gases and volcanic ash to 500 m above the crater on 2 February 2016. Residents of La Silva (2 km NW) reported a sulfur odor and ashfall on 5 February, and additional emissions above Cráter Oeste on 6 February. The Washington VAAC noted gray emissions on 8 February. The next report, on 3 April, described an explosion lasting less than one minute that generated a small gas-and-ash plume. Seismicity increased on 28 April, followed by ash emissions and frequent small explosions on 30 April and 1 May from Cráter Oeste. Gas-and-tephra emissions increased on 1 May with minor amounts of ash deposited in La Central (4 km SW) and La Pastora (6 km SSE). A larger ash plume on 2 May rose 2 km above the summit, and was followed by frequent explosions producing 1-km-high ash plumes the next day. Frequent explosions were again recorded during 3-5 May with ash plumes rising up to 1 km above Cráter Oeste. Small lahars were reported on 7 May, and small, frequent ash emissions accompanied spasmodic tremor on 8 May.
A significant explosion on 16 May 2016, that caused abundant ashfall on farms 2.5 km WNW, was the start of a new episode that lasted for more than two months. Frequent ash emissions continued the next day, although seismic tremor amplitude decreased substantially from the initial explosion. Numerous gas-and-ash emissions were reported during 17-19 May. Ashfall was reported in areas of Valle Central (30-40 km W), including Coronado, Guadalupe, and Heredia (38 km W). On 20 May a Strombolian phase began, producing an ash-and-gas plume that rose 3 km and drifted W. The eruptive column collapsed, generating pyroclastic flows that reached the nearby ranches of La Silva and La Picada, and the Cráter Central. According to a news article, some airlines canceled or delayed flights into the Juan Santamaría International Airport (48 km W).
Gas-and-ash emissions continued during 21-22 May; plumes rose as high as 600 m above the summit. Villagers reported ashfall in areas of San José (40 km WSW), Cartago (25 km SW), Alajuela (49 km W), Heredia (38 km W), Puriscal (65 km WSW), and Jaco (100 km SW). Ash plumes rose as high as 1 km and drifted W and SW on 23 May, causing ashfall in areas downwind including Tapezco (Zarcero-Alfaro Ruíz, 70 km WNW), Guácima de Alajuela (55 km WSW), Barva (39 km W), Finca Lara (17 km W), Finca Laguna (23 km WNW), Grecia, and Naranjo. A strong explosion on 24 May generated new ash plumes that rose 3.5 km and drifted SW. This event ejected large rocks around the crater and led to ashfall in multiple areas including Santa Rosa de Oreamuno, Santa Cecilia de Heredia, and San Francisco de Heredia, tens of kilometers to the W. Large amounts of ash (deposits 2-7 mm thick) fell in Carthage, Heredia (38 km W), San José (40 km W), and Alajuela (49 km W) from more explosions on 25 May that also ejected incandescent material.
A small explosion on 1 June 2016 began a new sequence of ash emissions, with plumes rising 1-2 km, that lasted until 4 June. Ashfall was reported in a number of communities including San Rafael de Moravia (31 km WSW), Sabana (38 km WSW), Buenos Aires (17 km N), and Pococí (45 km N) during 2-3 June. Ash emissions and explosions on 10 June caused ashfall and/or a sulfur odor in multiple areas of Valle Central including San Luis, Santo Domingo, Moravia, San Francisco, and Coronado. OVSICORI-UNA reported increased seismic activity on 16 June; the webcam showed areas of incandescence. Morning satellite imagery showed a diffuse ash plume extending 45 km WNW of the summit that dissipated by mid-afternoon. Tremor increased on 23 June, followed by a lengthy sequence of tremor episodes and ash emissions that lasted through 26 June; ashfall was reported in several neighborhoods in San José and Heredia. Increased tremor on 28 June was likely accompanied by ash emissions, but darkness and clouds obscured views from the webcam.
Strong tremor on 7 July 2016 was followed by an ash plume that rose 1 km above the crater and likely drifted WNW and WSW. Ashfall was recorded in many neighborhoods downwind, in San José, Heredia, and Turrubares. Emissions of large amounts of ash were visible in the webcam the next day, and ashfall was reported in many of the same areas as the day before. The Washington VAAC issued daily reports from 7 to 15 July of diffuse ash emissions observed in the webcam, generally rising less than 500 m above the summit. A new series of explosions during 22-25 July were recorded seismically, but visual observations were difficult due to fog. Hot rock fragments, gas, and ash were noted as high as 500 m above the crater on 24 July. Ash plumes rose to 3 km above the crater and drifted NW, W, and SW the next day. OVSICORI-UNA reported possible volcanic ash again on 29 July and 1 August, but weather clouds prevented views in satellite imagery.
Another new series of explosions and ash emissions began on 13 September 2016. They were reported daily from 15 September to the end of the month. Most plumes rose less than 1 km above the crater, but explosions on 19 September generated ash plumes that rose as high as 4 km and resulted in ashfall in many communities in the Valle Central, including those in San José (35 km WSW), Heredia (38 km W), Alajuela, and Cartago (25 km SW). According to news articles, flights in and out of the Juan Santamaría International Airport were canceled; the airport remained closed at least through the morning of 20 September. The Pavas San José Tobías Bolaños Airport in San José was also temporarily closed. Plumes that rose as high as 2 km were reported on 22, 26, and 27 September.
During a 22-24 September field visit OVSICORI-UNA scientists observed a significant lahar in the Rio Toro Amarillo which flows NW from Turrialba, that mobilized logs and large rocks in a 1.5-m-deep flow (figure 47). They had observed 3 cm of fresh ash in the drainage prior to the start of the rainfall on 22 September.
From 26 September through 24 November 2016 multiple reports were issued by the Washington VAAC virtually every day, usually reporting minor emissions of gas and ash. OVSICORI reported intermittent steam, gas, and ash emissions rising 500-1,000 m during all of October 2016. Ashfall was reported in Guadeloupe on 11 October. On 16 October OVSICORI-UNA noted that the almost constant ash emission in the previous few days affected the operation and communication of various scientific instruments installed at the top of the volcano and surrounding areas; communication with two seismic stations located near the summit was lost. Webcams showed continuing ash emissions rising as high as 1 km during 16-18 October. During 18-25 October, passive ash emissions continued, causing ashfall in Siquirres (30 ENE), Guacimo (23 km NNE), Guapiles (21 km N), Moravia (27 km W), San José (36 km WSW), Tibás (35 km WSW), Guadalupe (32 km WSW), Curridabat (32 km WSW), Tres Ríos (27 km SW), San Pedro (32 km WSW), and various areas of the Valle Central. Ashfall was reported in Nubes de Coronado (25 km W) on 28 October.
There were fewer reports of ashfall during November, although many areas of the Valle Central reported ashfall during 9-13 November. A small quantity of ash fell in Cartago and Paraiso de Cartago (25 km SE) on 20 November. The Washington VAAC again issued near-daily reports of ash and gas plumes between 6 December and the end of 2016. The weak and sporadic emissions generally rose only a few hundred meters, drifting in multiple directions, and there were few reports of ashfall in the surrounding communities.
Geologic Background. Turrialba, the easternmost of Costa Rica's Holocene volcanoes, is a large vegetated basaltic-to-dacitic stratovolcano located across a broad saddle NE of Irazú volcano overlooking the city of Cartago. The massive edifice covers an area of 500 km2. Three well-defined craters occur at the upper SW end of a broad 800 x 2200 m summit depression that is breached to the NE. Most activity originated from the summit vent complex, but two pyroclastic cones are located on the SW flank. Five major explosive eruptions have occurred during the past 3500 years. A series of explosive eruptions during the 19th century were sometimes accompanied by pyroclastic flows. Fumarolic activity continues at the central and SW summit craters.
Information Contacts: Observatorio Vulcanologico Sismologica de Costa Rica-Universidad Nacional (OVSICORI-UNA), Apartado 86-3000, Heredia, Costa Rica (URL: http://www.ovsicori.una.ac.cr/); Washington Volcanic Ash Advisory Center (VAAC), Satellite Analysis Branch (SAB), NOAA/NESDIS OSPO, NOAA Science Center Room 401, 5200 Auth Rd, Camp Springs, MD 20746, USA (URL: http://www.ospo.noaa.gov/Products/atmosphere/vaac/).
Unnamed
Tonga
20.852°S, 175.55°W; summit elev. -296 m
All times are local (unless otherwise noted)
Plumes of discolored water seen in satellite imagery during 23-28 January 2017
Murray Ford, a coastal geomorphologist from New Zealand's Auckland University, reported in a Radio New Zealand story on 1 February 2017 that satellite imagery showed a large plume of discolored water between Tongatapu and the volcanic Hunga Tonga-Hunga Ha'apai islands. The activity seen by Murray was on a Landsat 8 OLI (Operational Land Imager) satellite image acquired on 27 January 2017 (figure 2). which showed a bright area of discolored water above the summit and a broader area of discolored water immediately NW, likely from previous events. According to volcanologist Brad Scott (GNS Science) there are additional satellite images from 23, 26, 28, and 29 January 2017, indicating that the eruption had been ongoing for over a week. His colleagues in Tonga indicated a possible associated steam plume, but cloud cover made observations uncertain.
A report prepared by Taylor (2000) noted that there had been four previous reports of activity from this location: submarine activity in August 1911, a steam plume in July 1923, discolored water in 1970, and an ephemeral island near the end of an eruptive episode during 27 December 1998-14 January 1999 (also see BGVN 24:03). In a blog post about the latest eruption, Brad Scott (GNS Science) also stated that there had been discolored water and felt earthquakes sometime in 2007.
Reference: Taylor, P., 2000, A volcanic hazards assessment following the January 1999 eruption of Submarine Volcano III, Tofua Volcanic Arc, Kingdom of Tonga, Australian Volcanological Investigations (AVI) Occasional Report No. 99/01, 5 August 2000, 7 p.
Geologic Background. An unnamed submarine volcano is located along the Tofus volcanic arc 35 km NW of the Niu Aunofo lighthouse on Tongatapu Island. The first documented eruptions took place in 1911 and 1923; an ephemeral island was formed in 1999. A submarine eruption in January 2017 produced discolored water visible in satellite imagery.
Information Contacts: NASA Earth Observatory, EOS Project Science Office, NASA Goddard Space Flight Center, Goddard, Maryland, USA (URL: http://earthobservatory.nasa.gov/, https://earthobservatory.nasa.gov/images/89565/underwater-eruption-near-tongatapu); Brad Scott, New Zealand GeoNet Project, a collaboration between the Earthquake Commission and GNS Science, Wairakei Research Centre, Private Bag 2000, Taupo 3352, New Zealand (URL: http://www.geonet.org.nz/, http://www.geonet.org.nz/news/1usjOmF4LqaI64qScMocuW); Radio New Zealand (URL: http://www.radionz.co.nz/international/pacific-news/323569/scientist-discovers-underwater-eruption-in-tonga).