Recently Published Bulletin Reports
Erebus (Antarctica) Lava lake remains active; most thermal alerts recorded since 2019
Rincon de la Vieja (Costa Rica) Frequent phreatic explosions during July-December 2023
Bezymianny (Russia) Explosion on 18 October 2023 sends ash plume 8 km high; lava flows and incandescent avalanches
Kilauea (United States) Low-level lava effusions in the lava lake at Halema’uma’u during July-December 2022
Nyamulagira (DR Congo) Lava flows and thermal activity during May-October 2023
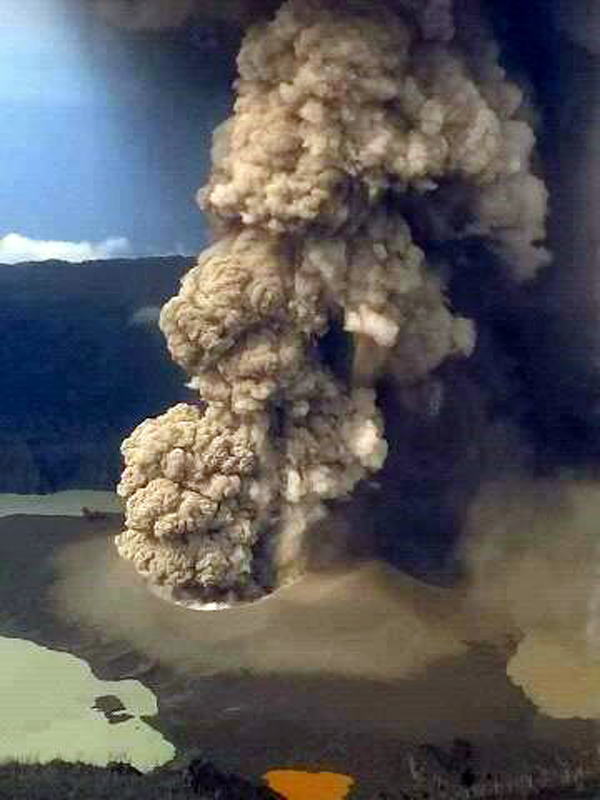
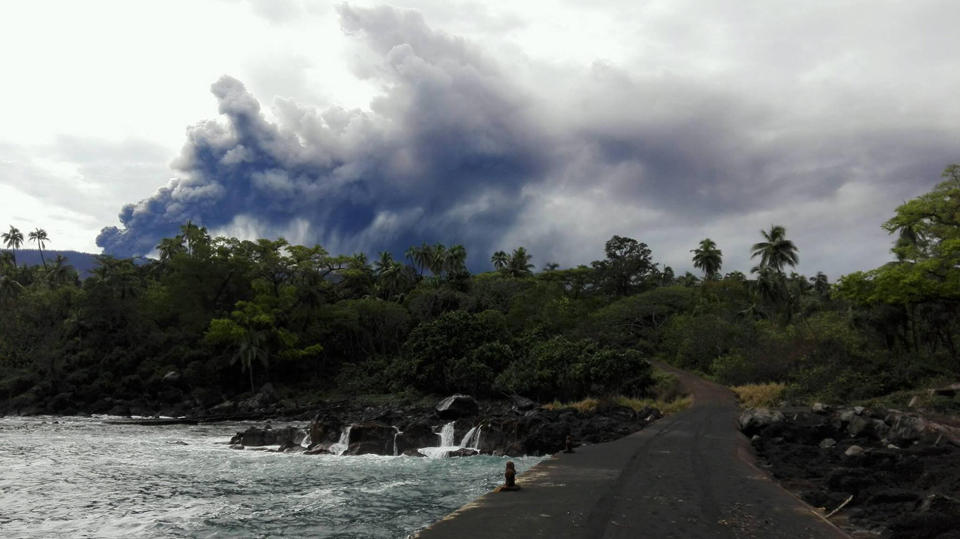
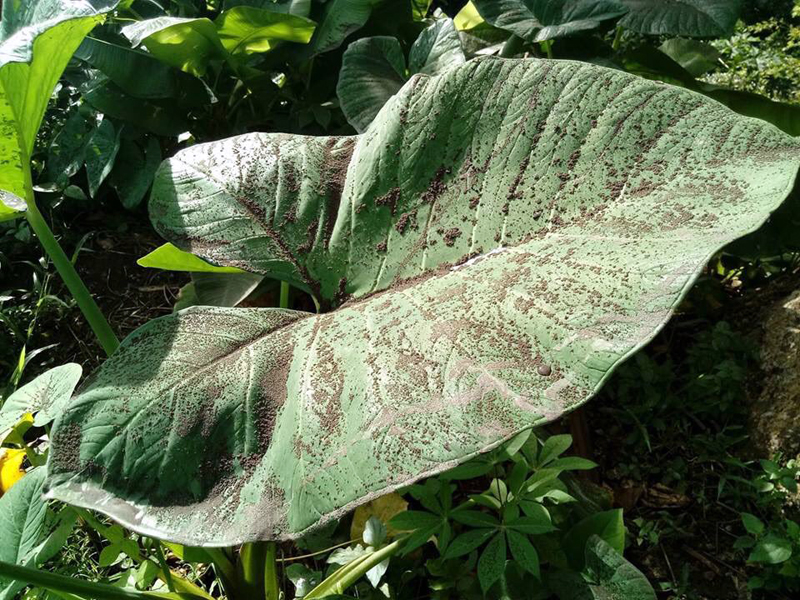
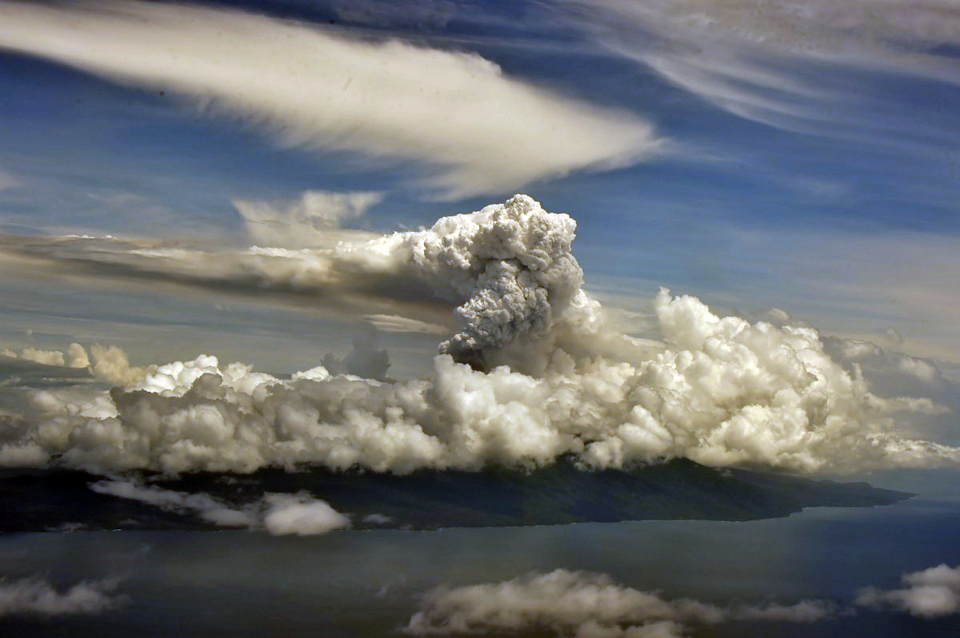
Bagana (Papua New Guinea) Explosions, ash plumes, ashfall, and lava flows during April-September 2023
Mayon (Philippines) Lava flows, pyroclastic flows, ash emissions, and seismicity during April-September 2023
Nishinoshima (Japan) Eruption plumes and gas-and-steam plumes during May-August 2023
Krakatau (Indonesia) White gas-and-steam plumes and occasional ash plumes during May-August 2023
Villarrica (Chile) Strombolian activity, gas-and-ash emissions, and crater incandescence during April-September 2023
Merapi (Indonesia) Frequent incandescent avalanches during April-September 2023
Ebeko (Russia) Moderate explosive activity with ash plumes continued during June-November 2023
Erebus (Antarctica) — January 2024  Cite this Report
Erebus
Antarctica
77.53°S, 167.17°E; summit elev. 3794 m
All times are local (unless otherwise noted)
Lava lake remains active; most thermal alerts recorded since 2019
The lava lake in the summit crater of Erebus has been active since at least 1972. Located in Antarctica overlooking the McMurdo Station on Ross Island, it is the southernmost active volcano on the planet. Because of the remote location, activity is primarily monitored by satellites. This report covers activity during 2023.
The number of thermal alerts recorded by the Hawai'i Institute of Geophysics and Planetology’s MODVOLC Thermal Alerts System increased considerably in 2023 compared to the years 2020-2022 (table 9). In contrast to previous years, the MODIS instruments aboard the Aqua and Terra satellites captured data from Erebus every month during 2023. Consistent with previous years, the lowest number of anomalous pixels were recorded in January, November, and December.
Table 9. Number of monthly MODIS-MODVOLC thermal alert pixels recorded at Erebus during 2017-2023. See BGVN 42:06 for data from 2000 through 2016. The table was compiled using data provided by the HIGP – MODVOLC Thermal Alerts System.
| Year |
Jan |
Feb |
Mar |
Apr |
May |
Jun |
Jul |
Aug |
Sep |
Oct |
Nov |
Dec |
SUM |
| 2017 |
0 |
21 |
9 |
0 |
0 |
1 |
11 |
61 |
76 |
52 |
0 |
3 |
234 |
| 2018 |
0 |
21 |
58 |
182 |
55 |
17 |
137 |
172 |
103 |
29 |
0 |
0 |
774 |
| 2019 |
2 |
21 |
162 |
151 |
55 |
56 |
75 |
53 |
29 |
19 |
1 |
0 |
624 |
| 2020 |
0 |
2 |
16 |
18 |
4 |
4 |
1 |
3 |
18 |
3 |
1 |
6 |
76 |
| 2021 |
0 |
9 |
1 |
0 |
2 |
56 |
46 |
47 |
35 |
52 |
5 |
3 |
256 |
| 2022 |
1 |
13 |
55 |
22 |
15 |
32 |
39 |
19 |
31 |
11 |
0 |
0 |
238 |
| 2023 |
2 |
33 |
49 |
82 |
41 |
32 |
70 |
64 |
42 |
17 |
5 |
11 |
448 |
Sentinel-2 infrared images showed one or two prominent heat sources within the summit crater, accompanied by adjacent smaller sources, similar to recent years (see BGVN 46:01, 47:02, and 48:01). A unique image was obtained on 25 November 2023 by the OLI-2 (Operational Land Imager-2) on Landsat 9, showing the upper part of the volcano surrounded by clouds (figure 32).
Geologic Background. Mount Erebus, the world's southernmost historically active volcano, overlooks the McMurdo research station on Ross Island. It is the largest of three major volcanoes forming the crudely triangular Ross Island. The summit of the dominantly phonolitic volcano has been modified by one or two generations of caldera formation. A summit plateau at about 3,200 m elevation marks the rim of the youngest caldera, which formed during the late-Pleistocene and within which the modern cone was constructed. An elliptical 500 x 600 m wide, 110-m-deep crater truncates the summit and contains an active lava lake within a 250-m-wide, 100-m-deep inner crater; other lava lakes are sometimes present. The glacier-covered volcano was erupting when first sighted by Captain James Ross in 1841. Continuous lava-lake activity with minor explosions, punctuated by occasional larger Strombolian explosions that eject bombs onto the crater rim, has been documented since 1972, but has probably been occurring for much of the volcano's recent history.
Information Contacts: Hawai'i Institute of Geophysics and Planetology (HIGP) - MODVOLC Thermal Alerts System, School of Ocean and Earth Science and Technology (SOEST), Univ. of Hawai'i, 2525 Correa Road, Honolulu, HI 96822, USA (URL: http://modis.higp.hawaii.edu/); Copernicus Browser, Copernicus Data Space Ecosystem, European Space Agency (URL: https://dataspace.copernicus.eu/browser/); NASA Earth Observatory, EOS Project Science Office, NASA Goddard Space Flight Center, Goddard, Maryland, USA (URL: https://earthobservatory.nasa.gov/images/152134/erebus-breaks-through).
Rincon de la Vieja (Costa Rica) — January 2024 Cite this Report
Rincon de la Vieja
Costa Rica
10.83°N, 85.324°W; summit elev. 1916 m
All times are local (unless otherwise noted)
Frequent phreatic explosions during July-December 2023
Rincón de la Vieja is a volcanic complex in Costa Rica with a hot convecting acid lake that exhibits frequent weak phreatic explosions, gas-and-steam emissions, and occasional elevated sulfur dioxide levels (BGVN 45:10, 46:03, 46:11). The current eruption period began June 2021. This report covers activity during July-December 2023 and is based on weekly bulletins and occasional daily reports from the Observatorio Vulcanologico Sismologica de Costa Rica-Universidad Nacional (OVSICORI-UNA).
Numerous weak phreatic explosions continued during July-December 2023, along with gas-and-steam emissions and plumes that rose as high as 3 km above the crater rim. Many weekly OVSICORI-UNA bulletins included the previous week's number of explosions and emissions (table 9). For many explosions, the time of explosion was given (table 10). Frequent seismic activity (long-period earthquakes, volcano-tectonic earthquakes, and tremor) accompanied the phreatic activity.
Table 9. Number of reported weekly phreatic explosions and gas-and-steam emissions at Rincón de la Vieja, July-December 2023. Counts are reported for the week before the Weekly Bulletin date; not all reports included these data. Courtesy of OVSICORI-UNA.
| OVSICORI Weekly Bulletin |
Number of explosions |
Number of emissions |
| 28 Jul 2023 |
6 |
14 |
| 4 Aug 2023 |
10 |
12 |
| 1 Sep 2023 |
13 |
11 |
| 22 Sep 2023 |
12 |
13 |
| 29 Sep 2023 |
6 |
11 |
| 6 Oct 2023 |
12 |
5 |
| 13 Oct 2023 |
7 |
9 |
| 20 Oct 2023 |
1 |
15 |
| 27 Oct 2023 |
3 |
23 |
| 3 Nov 2023 |
3 |
10 |
| 17 Nov 2023 |
0 |
Some |
| 24 Nov 2023 |
0 |
14 |
| 8 Dec 2023 |
4 |
16 |
| 22 Dec 2023 |
8 |
18 |
Table 10. Summary of activity at Rincón de la Vieja during July-December 2023. Weak phreatic explosions and gas emissions are noted where the time of explosion was indicated in the weekly or daily bulletins. Height of plumes or emissions are distance above the crater rim. Courtesy of OVSICORI-UNA.
| Date |
Time |
Description of Activity |
| 1 Jul 2023 |
0156 |
Explosion. |
| 2 Jul 2023 |
0305 |
Explosion. |
| 4 Jul 2023 |
0229, 0635 |
Event at 0635 produced a gas-and-steam plume that rose 700 m and drifted W; seen by residents in Liberia (21 km SW). |
| 9 Jul 2023 |
1843 |
Explosion. |
| 21 Jul 2023 |
0705 |
Explosion. |
| 26 Jul 2023 |
1807 |
Explosion. |
| 28 Jul 2023 |
0802 |
Explosion generated a gas-and-steam plume that rose 500 m. |
| 30 Jul 2023 |
1250 |
Explosion. |
| 31 Jul 2023 |
2136 |
Explosion. |
| 11 Aug 2023 |
0828 |
Explosion. |
| 18 Aug 2023 |
1304 |
Explosion. |
| 21 Aug 2023 |
1224 |
Explosion generated gas-and-steam plumes rose 500-600 m. |
| 22 Aug 2023 |
0749 |
Explosion generated gas-and-steam plumes rose 500-600 m. |
| 24 Aug 2023 |
1900 |
Explosion. |
| 25 Aug 2023 |
0828 |
Event produced a steam-and-gas plume that rose 3 km and drifted NW. |
| 27-28 Aug 2023 |
0813 |
Four small events; the event at 0813 on 28 August lasted two minutes and generated a steam-and-gas plume that rose 2.5 km. |
| 1 Sep 2023 |
1526 |
Explosion generated plume that rose 2 km and ejected material onto the flanks. |
| 2-3 Sep 2023 |
- |
Small explosions detected in infrasound data. |
| 4 Sep 2023 |
1251 |
Gas-and-steam plume rose 1 km and drifted W. |
| 7 Nov 2023 |
1113 |
Explosion. |
| 8 Nov 2023 |
0722 |
Explosion. |
| 12 Nov 2023 |
0136 |
Small gas emissions. |
| 14 Nov 2023 |
0415 |
Small gas emissions. |
According to OVSICORI-UNA, during July-October the average weekly sulfur dioxide (SO2) flux ranged from 68 to 240 tonnes/day. However, in mid-November the flux increased to as high as 334 tonnes/day, the highest value measured in recent years. The high SO2 flux in mid-November was also detected by the TROPOMI instrument on the Sentinel-5P satellite (figure 43).
Geologic Background. Rincón de la Vieja, the largest volcano in NW Costa Rica, is a remote volcanic complex in the Guanacaste Range. The volcano consists of an elongated, arcuate NW-SE-trending ridge constructed within the 15-km-wide early Pleistocene Guachipelín caldera, whose rim is exposed on the south side. Sometimes known as the "Colossus of Guanacaste," it has an estimated volume of 130 km3 and contains at least nine major eruptive centers. Activity has migrated to the SE, where the youngest-looking craters are located. The twin cone of Santa María volcano, the highest peak of the complex, is located at the eastern end of a smaller, 5-km-wide caldera and has a 500-m-wide crater. A Plinian eruption producing the 0.25 km3 Río Blanca tephra about 3,500 years ago was the last major magmatic eruption. All subsequent eruptions, including numerous historical eruptions possibly dating back to the 16th century, have been from the prominent active crater containing a 500-m-wide acid lake located ENE of Von Seebach crater.
Information Contacts: Observatorio Vulcanológico Sismológica de Costa Rica-Universidad Nacional (OVSICORI-UNA), Apartado 86-3000, Heredia, Costa Rica (URL: http://www.ovsicori.una.ac.cr/); NASA Global Sulfur Dioxide Monitoring Page, Atmospheric Chemistry and Dynamics Laboratory, NASA Goddard Space Flight Center (NASA/GSFC), 8800 Greenbelt Road, Goddard MD 20771, USA (URL: https://so2.gsfc.nasa.gov/).
Bezymianny (Russia) — November 2023 Cite this Report
Bezymianny
Russia
55.972°N, 160.595°E; summit elev. 2882 m
All times are local (unless otherwise noted)
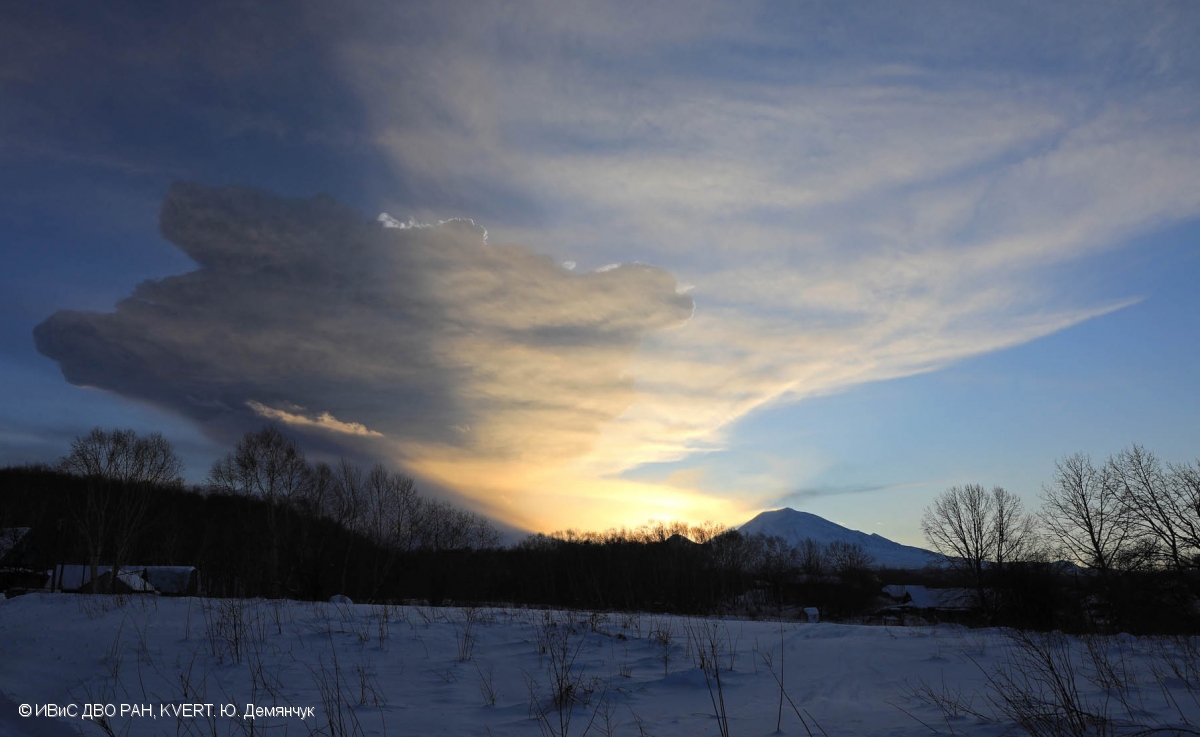
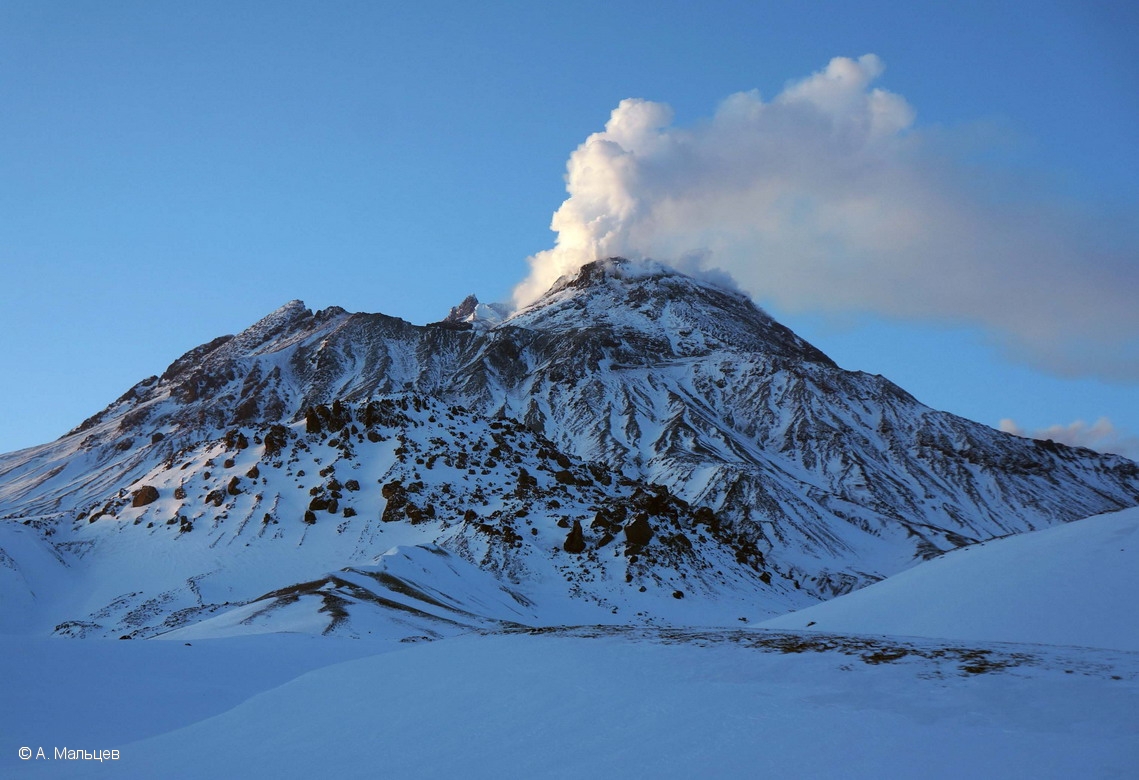
Explosion on 18 October 2023 sends ash plume 8 km high; lava flows and incandescent avalanches
Bezymianny, located on Russia’s Kamchatka Peninsula, has had eruptions since 1955 characterized by dome growth, explosions, pyroclastic flows, ash plumes, and ashfall. Activity during November 2022-April 2023 included gas-and-steam emissions, lava dome collapses generating avalanches, and persistent thermal activity. Similar eruptive activity continued from May through October 2023, described here based on information from weekly and daily reports of the Kamchatka Volcano Eruptions Response Team (KVERT), notices from Tokyo VAAC (Volcanic Ash Advisory Center), and from satellite data.
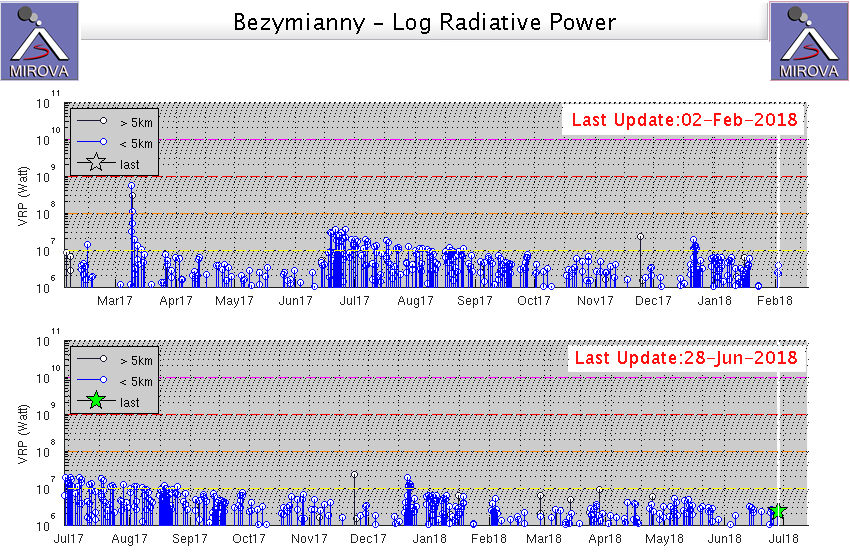
Overall activity decreased after the strong period of activity in late March through April 2023, which included ash explosions during 29 March and 7-8 April 2023 that sent plumes as high as 10-12 km altitude, along with dome growth and lava flows (BGVN 48:05). This reduced activity can be seen in the MIROVA thermal detection system graph (figure 56), which was consistent with data from the MODVOLC thermal detection system and with Sentinel-2 satellite images that showed persistent hotspots in the summit crater when conditions allowed observations. A renewed period of strong activity began in mid-October 2023.
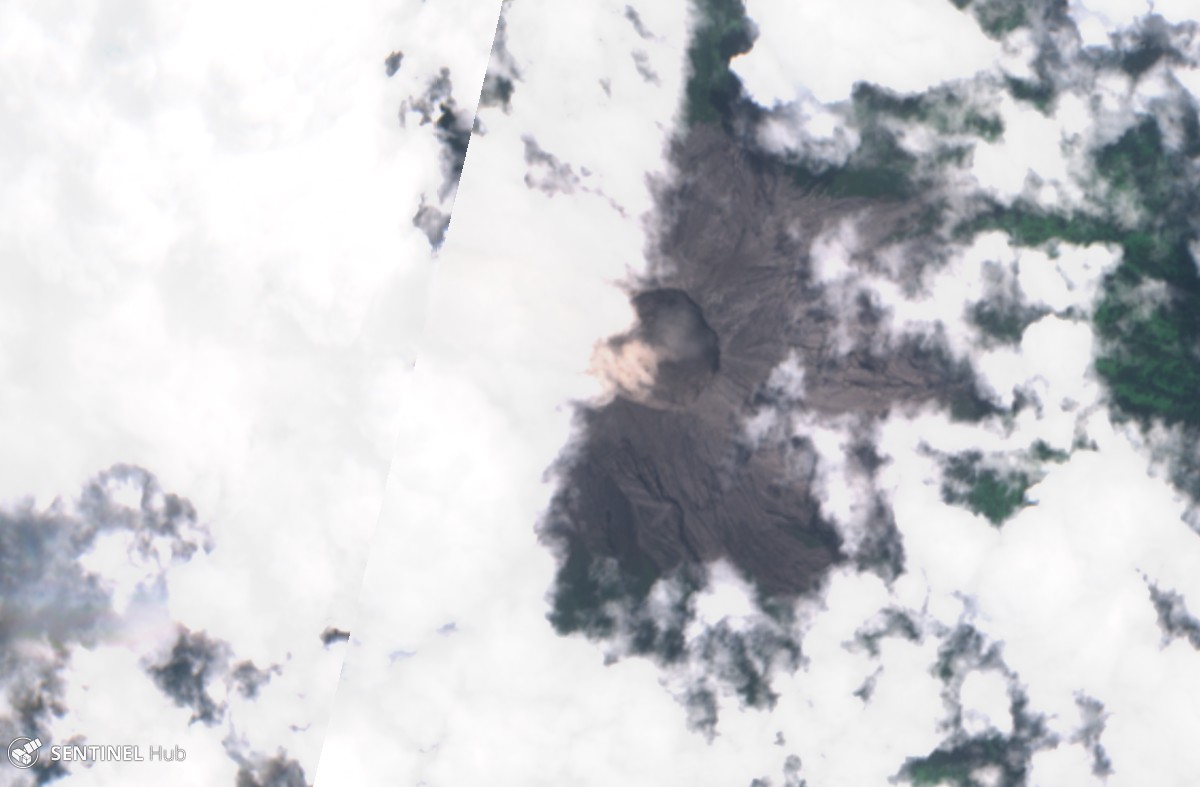
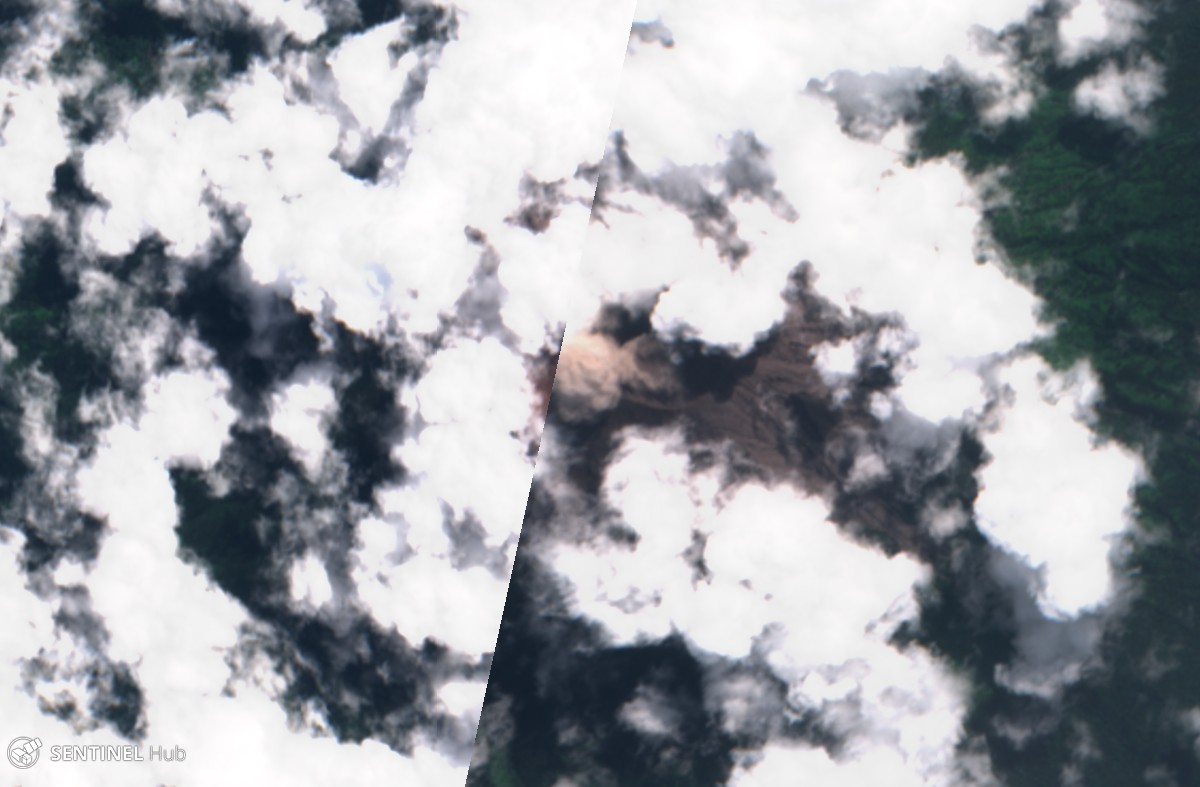
Activity increased significantly on 17 October 2023 when large collapses began during 0700-0830 on the E flanks of the lava dome and continued to after 0930 the next day (figure 57). Ash plumes rose to an altitude of 4.5-5 km, extending 220 km NNE by 18 October. A large explosion at 1630 on 18 October produced an ash plume that rose to an altitude of 11 km (8 km above the summit) and drifted NNE and then NW, extending 900 km NW within two days at an altitude of 8 km. Minor ashfall was noted in Kozyrevsk (45 km WNW). At 0820 on 20 October an ash plume was identified in satellite images drifting 100 km ENE at altitudes of 4-4.5 km.
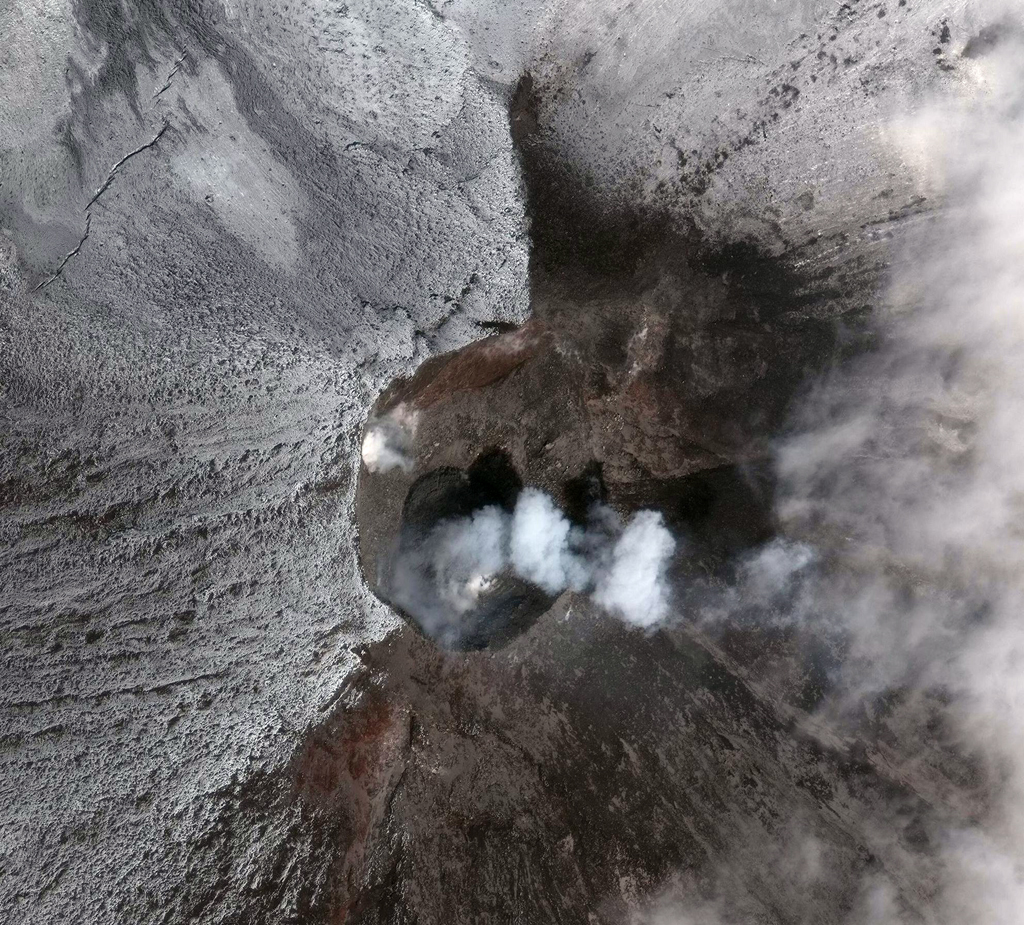
Lava flows and hot avalanches from the dome down the SE flank continued over the next few days, including 23 October when clear conditions allowed good observations (figures 58 and 59). A large thermal anomaly was observed over the volcano through 24 October, and in the summit crater on 30 October (figure 60). Strong fumarolic activity continued, with numerous avalanches and occasional incandescence. By the last week of October, volcanic activity had decreased to a level consistent with that earlier in the reporting period.
Aviation warnings were frequently updated during 17-20 October. KVERT issued a Volcano Observatory Notice for Aviation (VONA) on 17 October at 1419 and 1727 (0219 and 0527 UTC) raising the Aviation Color Code (ACC) from Yellow to Orange (second highest level). The next day, KVERT issued a VONA at 1705 (0505 UTC) raising the ACC to Red (highest level) but lowered it back to Orange at 2117 (0917 UTC). After another decrease to Yellow and back to Orange, the ACC was reduced to Yellow on 20 October at 1204 (0004 UTC). In addition, the Tokyo VAAC issued a series of Volcanic Ash Advisories beginning on 16 October and continuing through 30 October.
Geologic Background. The modern Bezymianny, much smaller than its massive neighbors Kamen and Kliuchevskoi on the Kamchatka Peninsula, was formed about 4,700 years ago over a late-Pleistocene lava-dome complex and an edifice built about 11,000-7,000 years ago. Three periods of intensified activity have occurred during the past 3,000 years. The latest period, which was preceded by a 1,000-year quiescence, began with the dramatic 1955-56 eruption. This eruption, similar to that of St. Helens in 1980, produced a large open crater that was formed by collapse of the summit and an associated lateral blast. Subsequent episodic but ongoing lava-dome growth, accompanied by intermittent explosive activity and pyroclastic flows, has largely filled the 1956 crater.
Information Contacts: Kamchatka Volcanic Eruptions Response Team (KVERT), Far Eastern Branch, Russian Academy of Sciences, 9 Piip Blvd., Petropavlovsk-Kamchatsky, 683006, Russia (URL: http://www.kscnet.ru/ivs/kvert/); Kamchatka Volcanological Station, Kamchatka Branch of Geophysical Survey, (KB GS RAS), Klyuchi, Kamchatka Krai, Russia (URL: http://volkstat.ru/); Tokyo Volcanic Ash Advisory Center (VAAC), 1-3-4 Otemachi, Chiyoda-ku, Tokyo 100-8122, Japan (URL: http://ds.data.jma.go.jp/svd/vaac/data/); Hawai'i Institute of Geophysics and Planetology (HIGP) - MODVOLC Thermal Alerts System, School of Ocean and Earth Science and Technology (SOEST), Univ. of Hawai'i, 2525 Correa Road, Honolulu, HI 96822, USA (URL: http://modis.higp.hawaii.edu/); MIROVA (Middle InfraRed Observation of Volcanic Activity), a collaborative project between the Universities of Turin and Florence (Italy) supported by the Centre for Volcanic Risk of the Italian Civil Protection Department (URL: http://www.mirovaweb.it/); Copernicus Browser, Copernicus Data Space Ecosystem, European Space Agency (URL: https://dataspace.copernicus.eu/browser/).chr
Kilauea (United States) — January 2023 Cite this Report
Kilauea
United States
19.421°N, 155.287°W; summit elev. 1222 m
All times are local (unless otherwise noted)
Low-level lava effusions in the lava lake at Halema’uma’u during July-December 2022
Kīlauea is the southeastern-most volcano in Hawaii and overlaps the E flank of the Mauna Loa volcano. Its East Rift Zone (ERZ) has been intermittently active for at least 2,000 years. An extended eruption period began in January 1983 and was characterized by open lava lakes and lava flows from the summit caldera and the East Rift Zone. During May 2018 magma migrated into the Lower East Rift Zone (LERZ) and opened 24 fissures along a 6-km-long NE-trending fracture zone that produced lava flows traveling in multiple directions. As lava emerged from the fissures, the lava lake at Halema'uma'u drained and explosions sent ash plumes to several kilometers altitude (BGVN 43:10).
The current eruption period started during September 2021 and has recently been characterized by lava effusions, spatter, and sulfur dioxide emissions in the active Halema’uma’u lava lake (BGVN 47:08). Lava effusions, some spatter, and sulfur dioxide emissions have continued during this reporting period of July through December 2022 using daily reports, volcanic activity notices, and abundant photo, map, and video data from the US Geological Survey's (USGS) Hawaiian Volcano Observatory (HVO).
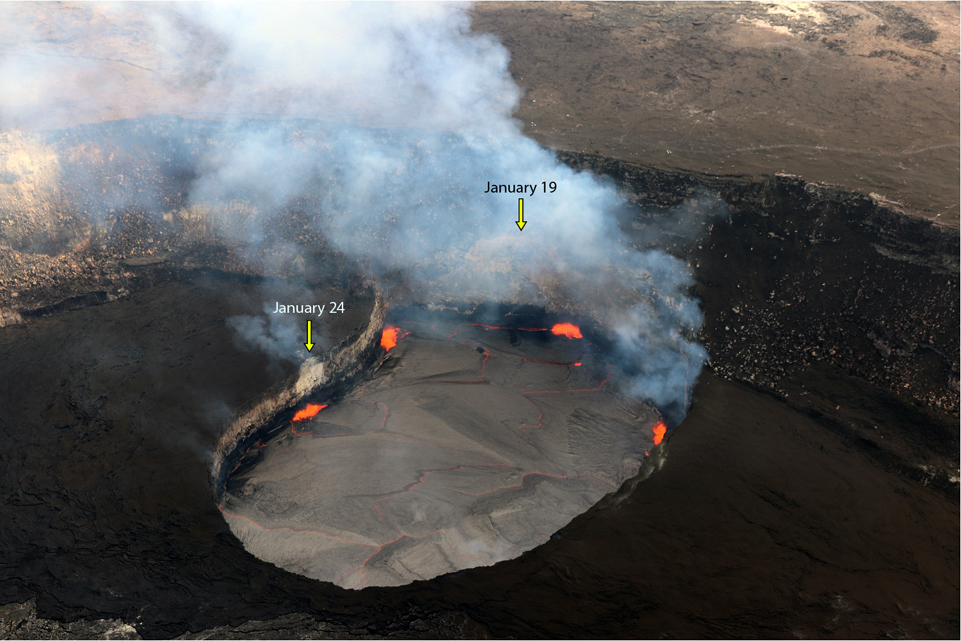
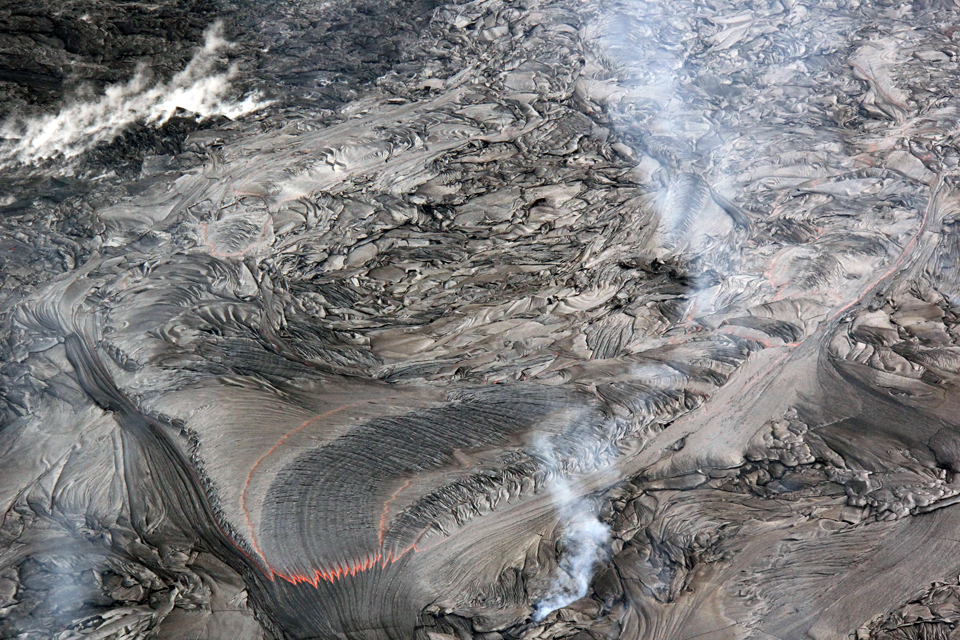
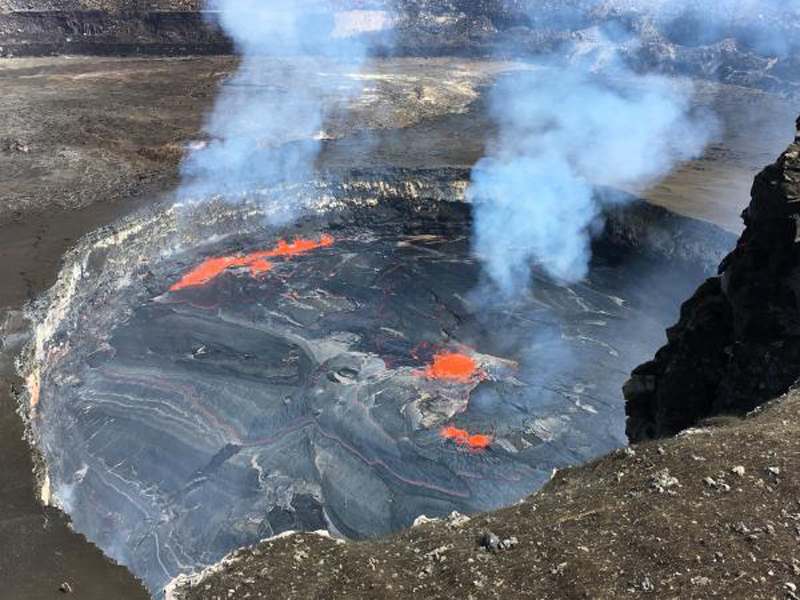
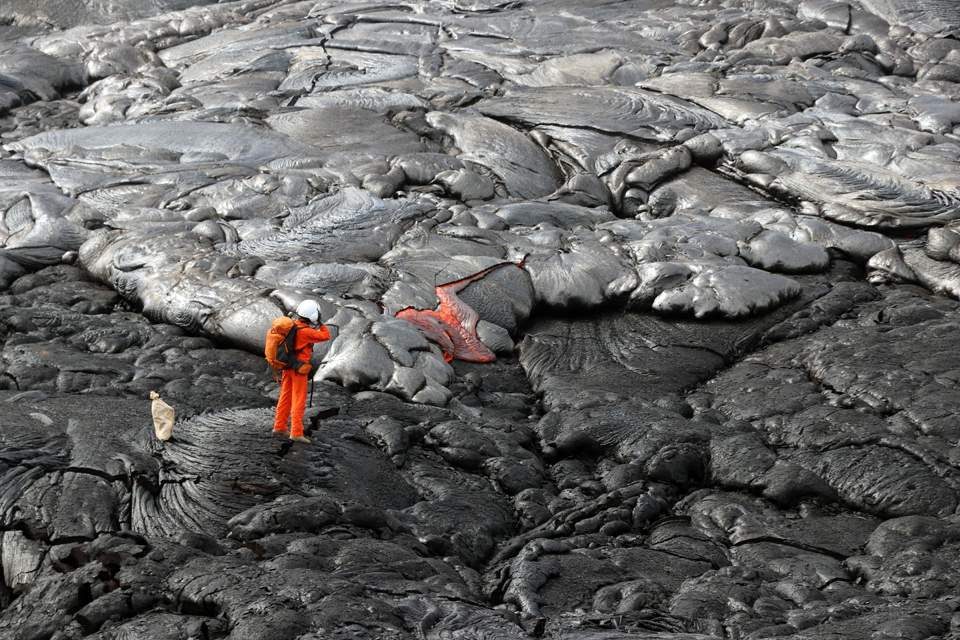
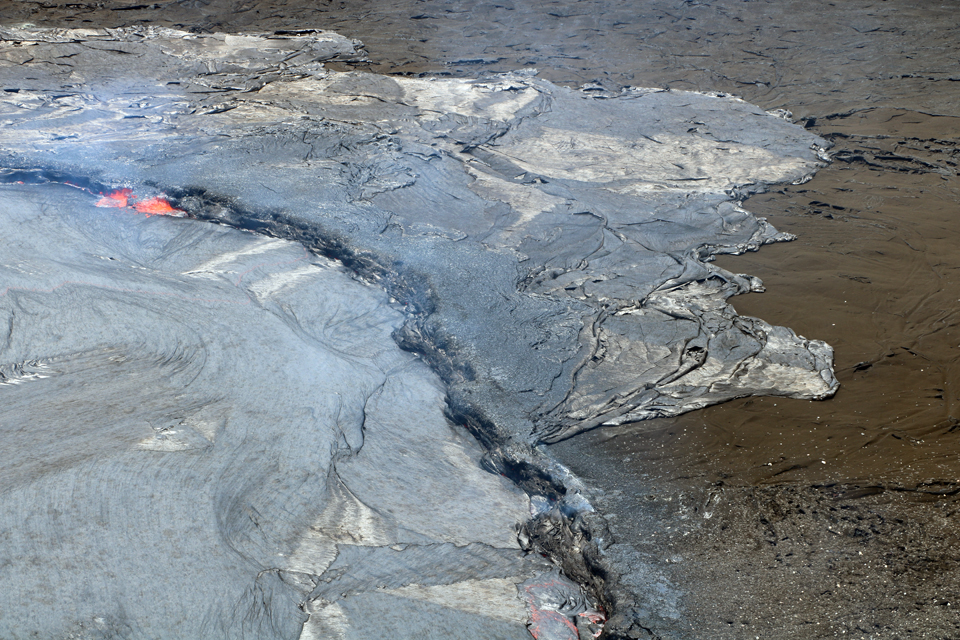
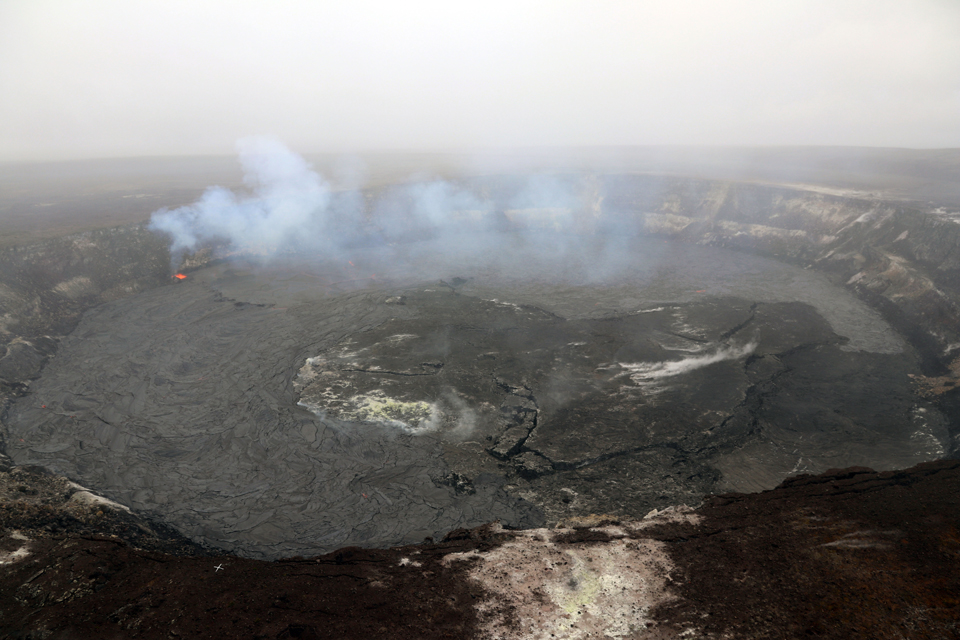
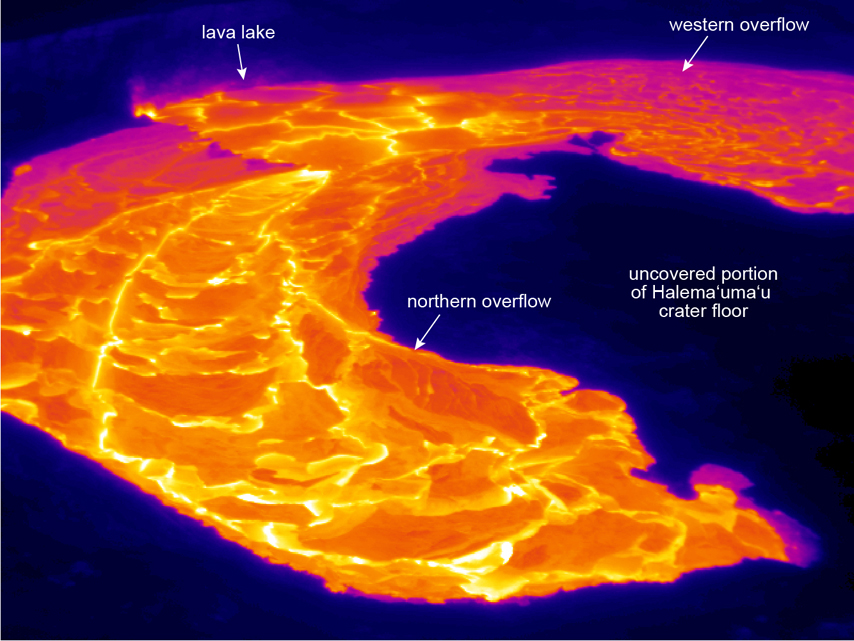
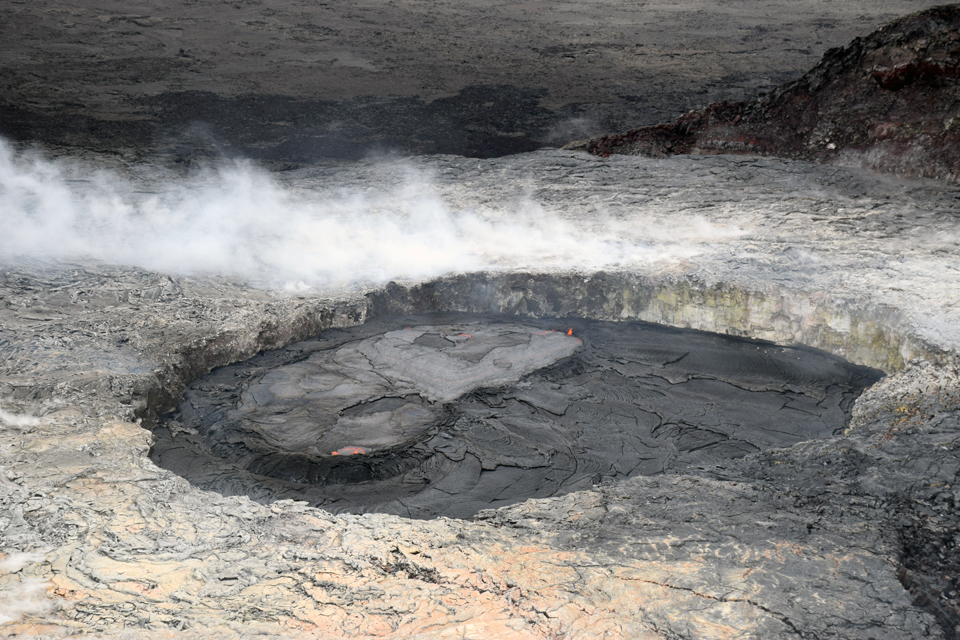
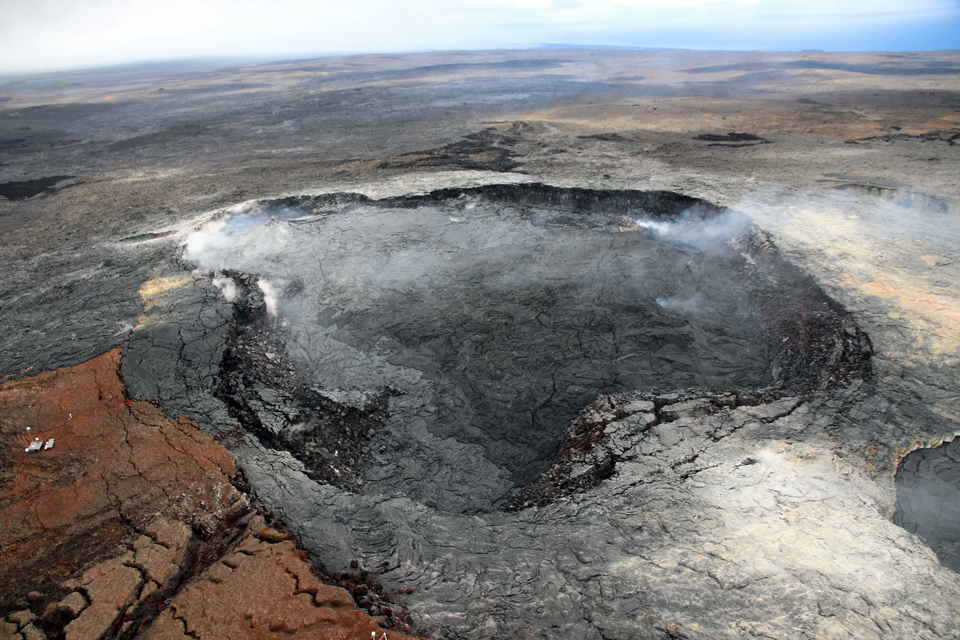
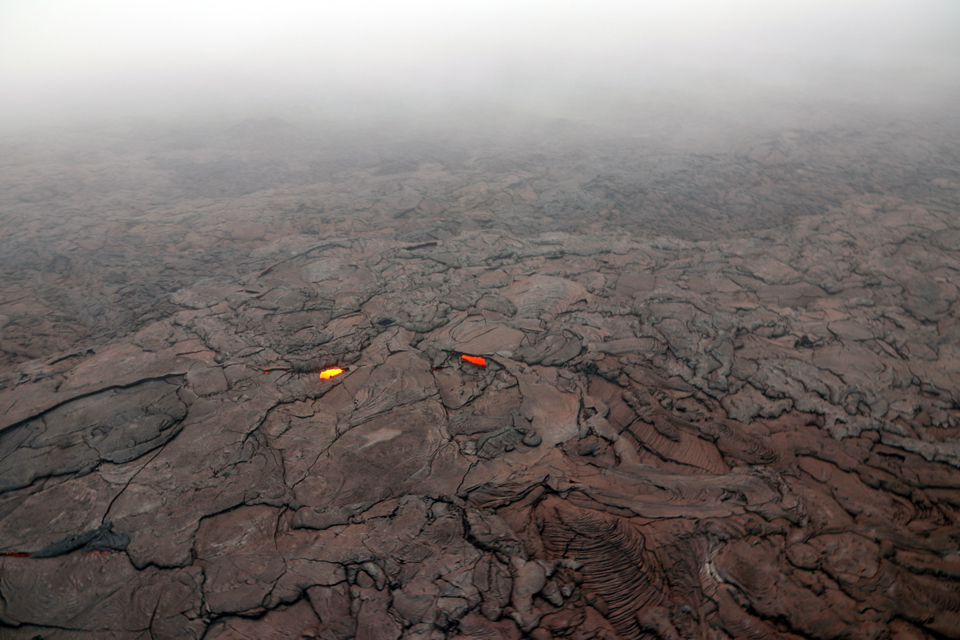
Summary of activity during July-December 2022. Low-level effusions have continued at the western vent of the Halema’uma’u crater during July through early December 2022. Occasional weak ooze-outs (also called lava break outs) would occur along the margins of the crater floor. The overall level of the active lava lake throughout the reporting period gradually increased due to infilling, however it stagnated in mid-September (table 13). During September through November, activity began to decline, though lava effusions persisted at the western vent. By 9 December, the active part of the lava lake had completely crusted over, and incandescence was no longer visible.
Table 13. Summary of measurements taken during overflights at Kīlauea that show a gradual increase in the active lava lake level and the volume of lava effused since 29 September 2021. Lower activity was reported during September-October. Data collected during July-December 2022. Courtesy of HVO.
| Date: |
Level of the active lava lake (m): |
Cumulative volume of lava effused (million cubic meters): |
| 7 Jul 2022 |
130 |
95 |
| 19 Jul 2022 |
133 |
98 |
| 4 Aug 2022 |
136 |
102 |
| 16 Aug 2022 |
137 |
104 |
| 12 Sep 2022 |
143 |
111 |
| 5 Oct 2022 |
143 |
111 |
| 28 Oct 2022 |
143 |
111 |
Activity during July 2022. Lava effusions were reported from the western vent in the Halema’uma’u crater, along with occasional weak ooze-outs along the margins of the crater floor. The height of the lava lake was variable due to deflation-inflation tilt events; for example, the lake level dropped approximately 3-4 m during a summit deflation-inflation event reported on 1 July. Webcam images taken during the night of 6-12 July showed intermittent low-level spattering at the western vent that rose less than 10 m above the vent (figure 519). Measurements made during an overflight on 7 July indicated that the crater floor was infilled about 130 m and that 95 million cubic meters of lava had been effused since 29 September 2021. A single, relatively small lava ooze-out was active to the S of the lava lake. Around midnight on 8 July there were two brief periods of lava overflow onto the lake margins. On 9 July lava ooze-outs were reported near the SE and NE edges of the crater floor and during 10-11 July they occurred near the E, NE, and NW edges. On 16 July crater incandescence was reported, though the ooze-outs and spattering were not visible. On 18 July overnight webcam images showed incandescence in the western vent complex and two ooze-outs were reported around 0000 and 0200 on 19 July. By 0900 there were active ooze-outs along the SW edge of the crater floor. Measurements made from an overflight on 19 July indicated that the crater floor was infilled about 133 m and 98 million cubic meters of lava had erupted since 29 September 2021 (figure 520). On 20 July around 1600 active ooze-outs were visible along the N edge of the crater, which continued through the next day. Extensive ooze-outs occurred along the W margin during 24 July until 1900; on 26 July minor ooze-outs were noted along the N margin. Minor spattering was visible on 29 July along the E margin of the lake. The sulfur dioxide emission rates ranged 650-2,800 tons per day (t/d), the higher of which was measured on 8 July (figure 519).
Activity during August 2022. The eruption continued in the Halema’uma’u crater at the western vent. According to HVO the lava in the active lake remained at the level of the bounding levees. Occasional minor ooze-outs were observed along the margins of the crater floor. Strong nighttime crater incandescence was visible after midnight on 6 August over the western vent cone. During 6-7 August scattered small lava lobes were active along the crater floor and incandescence persisted above the western vent through 9 August. During 7-9 August HVO reported a single lava effusion source was active along the NW margin of the crater floor. Measurements from an overflight on 4 August indicated that the crater floor was infilled about 136 m total and that 102 million cubic meters of lava had been erupted since the start of the eruption. Lava breakouts were reported along the N, NE, E, S, and W margins of the crater during 10-16 August. Another overflight survey conducted on 16 August indicated that the crater floor infilled about 137 m and 104 million cubic meters of lava had been erupted since September 2021. Measured sulfur dioxide emissions rates ranged 1,150-2,450 t/d, the higher of which occurred on 8 August.
Activity during September 2022. During September, lava effusion continued from the western vent into the active lava lake and onto the crater floor. Intermittent minor ooze-outs were reported through the month. A small ooze-out was visible on the W crater floor margin at 0220 on 2 September, which showed decreasing surface activity throughout the day, but remained active through 3 September. On 3 September around 1900 a lava outbreak occurred along the NW margin of the crater floor but had stopped by the evening of 4 September. Field crews monitoring the summit lava lake on 9 September observed spattering on the NE margin of the lake that rose no higher than 10 m, before falling back onto the lava lake crust (figure 521). Overflight measurements on 12 September indicated that the crater floor was infilled a total of 143 m and 111 million cubic meters of lava had been erupted since September 2021. Extensive breakouts in the W and N part of the crater floor were reported at 1600 on 20 September and continued into 26 September. The active part of the lava lake dropped by 10 m while other parts of the crater floor dropped by several meters. Summit tiltmeters recorded a summit seismic swarm of more than 80 earthquakes during 1500-1800 on 21 September, which occurred about 1.5 km below Halema’uma’u; a majority of these were less than Mw 2. By 22 September the active part of the lava lake was infilled about 2 m. On 23 September the western vent areas exhibited several small spatter cones with incandescent openings, along with weak, sporadic spattering (figure 522). The sulfur dioxide emission rate ranged from 930 t/d to 2,000 t/d, the higher of which was measured on 6 September.
Activity during October 2022. Activity during October declined slightly compared to previous months, though lava effusions persisted from the western vent into the active lava lake and onto the crater floor during October (figure 523). Slight variations in the lava lake were noted throughout the month. HVO reported that around 0600 on 3 October the level of the lava lake has lowered slightly. Overflight measurements taken on 5 October indicated that the crater floor was infilled a total of about 143 m and that 111 million cubic meters of lava had been effused since September 2021. During 6-7 October the lake gradually rose 0.5 m. Sulfur dioxide measurements made on 22 October had an emission rate of 700 t/d. Another overflight taken on 28 October showed that there was little to no change in the elevation of the crater floor: the crater floor was infilled a total of 143 m and 111 million cubic meters of lava had erupted since the start of the eruption.
Activity during November 2022. Activity remained low during November, though HVO reported that lava from the western vent continued to effuse into the active lava lake and onto the crater floor throughout the month. The rate of sulfur dioxide emissions during November ranged from 300-600 t/d, the higher amount of which occurred on 9 November.
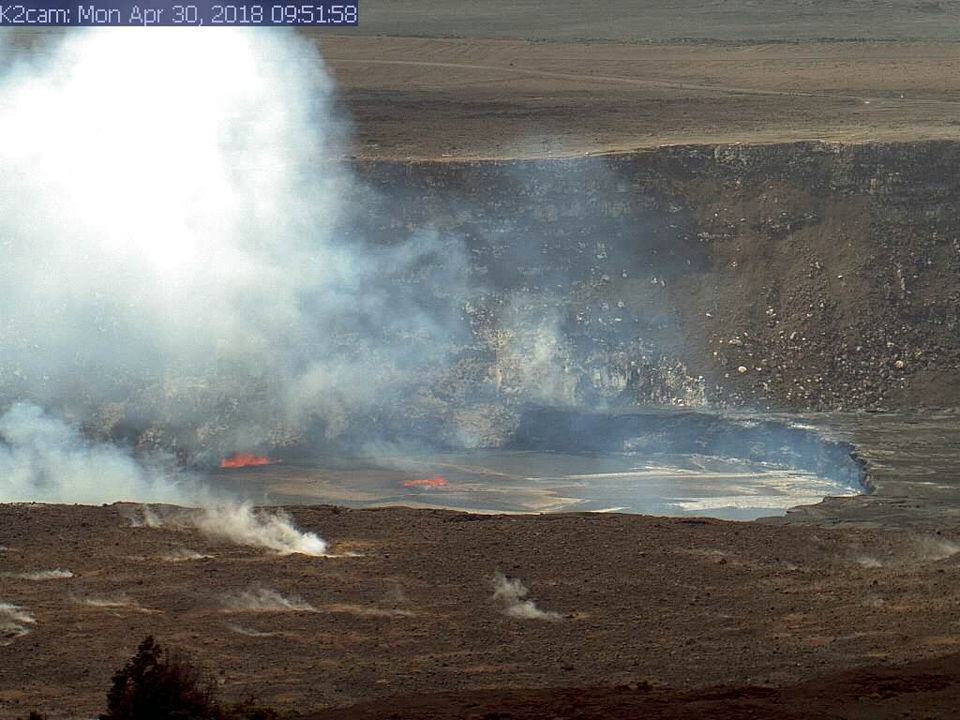
Activity during December 2022. Similar low activity was reported during December, with lava effusing from the western vent into the active lava lake and onto the crater floor. During 4-5 December the active part of the lava lake was slightly variable in elevation and fluctuated within 1 m. On 9 December HVO reported that lava was no longer erupting from the western vent in the Halema’uma’u crater and that sulfur dioxide emissions had returned to near pre-eruption background levels; during 10-11 December, the lava lake had completely crusted over, and no incandescence was visible (figure 524). Time lapse camera images covering the 4-10 December showed that the crater floor showed weak deflation and no inflation. Some passive events of crustal overturning were reported during 14-15 December, which brought fresh incandescent lava to the lake surface. The sulfur dioxide emission rate was approximately 200 t/d on 14 December. A smaller overturn event on 17 December and another that occurred around 0000 and into the morning of 20 December were also detected. A small seismic swarm was later detected on 30 December.
Geologic Background. Kilauea overlaps the E flank of the massive Mauna Loa shield volcano in the island of Hawaii. Eruptions are prominent in Polynesian legends; written documentation since 1820 records frequent summit and flank lava flow eruptions interspersed with periods of long-term lava lake activity at Halemaumau crater in the summit caldera until 1924. The 3 x 5 km caldera was formed in several stages about 1,500 years ago and during the 18th century; eruptions have also originated from the lengthy East and Southwest rift zones, which extend to the ocean in both directions. About 90% of the surface of the basaltic shield volcano is formed of lava flows less than about 1,100 years old; 70% of the surface is younger than 600 years. The long-term eruption from the East rift zone between 1983 and 2018 produced lava flows covering more than 100 km2, destroyed hundreds of houses, and added new coastline.
Information Contacts: Hawaiian Volcano Observatory (HVO), U.S. Geological Survey, PO Box 51, Hawai'i National Park, HI 96718, USA (URL: http://hvo.wr.usgs.gov/).
Nyamulagira (DR Congo) — November 2023 Cite this Report
Nyamulagira
DR Congo
1.408°S, 29.2°E; summit elev. 3058 m
All times are local (unless otherwise noted)
Lava flows and thermal activity during May-October 2023
Nyamulagira (also known as Nyamuragira) is a shield volcano in the Democratic Republic of Congo with the summit truncated by a small 2 x 2.3 km caldera with walls up to about 100 m high. Documented eruptions have occurred within the summit caldera, as well as from numerous flank fissures and cinder cones. The current eruption period began in April 2018 and has more recently been characterized by summit crater lava flows and thermal activity (BGVN 48:05). This report describes lava flows and variable thermal activity during May through October 2023, based on information from the Observatoire Volcanologique de Goma (OVG) and various satellite data.
Lava lake activity continued during May. The MIROVA (Middle InfraRed Observation of Volcanic Activity) system recorded moderate-to-strong thermal activity throughout the reporting period; activity was more intense during May and October and relatively weaker from June through September (figure 95). The MODVOLC thermal algorithm, detected a total of 209 thermal alerts. There were 143 hotspots detected during May, eight during June, nine during September, and 49 during October. This activity was also reflected in infrared satellite images, where a lava flow was visible in the NW part of the crater on 7 May and strong activity was seen in the center of the crater on 4 October (figure 96). Another infrared satellite image taken on 12 May showed still active lava flows along the NW margin of the crater. According to OVG lava effusions were active during 7-29 May and moved to the N and NW parts of the crater beginning on 9 May. Strong summit crater incandescence was visible from Goma (27 km S) during the nights of 17, 19, and 20 May (figure 97). On 17 May there was an increase in eruptive activity, which peaked at 0100 on 20 May. Notable sulfur dioxide plumes drifted NW and W during 19-20 May (figure 98). Drone footage acquired in partnership with the USGS (United States Geological Survey) on 20 May captured images of narrow lava flows that traveled about 100 m down the W flank (figure 99). Data from the Rumangabo seismic station indicated a decreasing trend in activity during 17-21 May. Although weather clouds prevented clear views of the summit, a strong thermal signature on the NW flank was visible in an infrared satellite image on 22 May, based on an infrared satellite image. On 28 May the lava flows on the upper W flank began to cool and solidify. By 29 May seismicity returned to levels similar to those recorded before the 17 May increase. Lava effusion continued but was confined to the summit crater; periodic crater incandescence was observed.
Low-level activity was noted during June through October. On 1 June OVG reported that seismicity remained at lower levels and that crater incandescence had been absent for three days, though infrared satellite imagery showed continued lava effusion in the summit crater. The lava flows on the flanks covered an estimated 0.6 km2. Satellite imagery continued to show thermal activity confined to the lava lake through October (figure 96), although no lava flows or significant sulfur dioxide emissions were reported.
Geologic Background. Africa's most active volcano, Nyamulagira (also known as Nyamuragira), is a massive high-potassium basaltic shield about 25 km N of Lake Kivu and 13 km NNW of the steep-sided Nyiragongo volcano. The summit is truncated by a small 2 x 2.3 km caldera that has walls up to about 100 m high. Documented eruptions have occurred within the summit caldera, as well as from the numerous flank fissures and cinder cones. A lava lake in the summit crater, active since at least 1921, drained in 1938, at the time of a major flank eruption. Recent lava flows extend down the flanks more than 30 km from the summit as far as Lake Kivu; extensive lava flows from this volcano have covered 1,500 km2 of the western branch of the East African Rift.
Information Contacts: Observatoire Volcanologique de Goma (OVG), Departement de Geophysique, Centre de Recherche en Sciences Naturelles, Lwiro, D.S. Bukavu, DR Congo; Hawai'i Institute of Geophysics and Planetology (HIGP) - MODVOLC Thermal Alerts System, School of Ocean and Earth Science and Technology (SOEST), Univ. of Hawai'i, 2525 Correa Road, Honolulu, HI 96822, USA (URL: http://modis.higp.hawaii.edu/); MIROVA (Middle InfraRed Observation of Volcanic Activity), a collaborative project between the Universities of Turin and Florence (Italy) supported by the Centre for Volcanic Risk of the Italian Civil Protection Department (URL: http://www.mirovaweb.it/); NASA Global Sulfur Dioxide Monitoring Page, Atmospheric Chemistry and Dynamics Laboratory, NASA Goddard Space Flight Center (NASA/GSFC), 8800 Greenbelt Road, Goddard, Maryland, USA (URL: https://so2.gsfc.nasa.gov/); Copernicus Browser, Copernicus Data Space Ecosystem, European Space Agency (URL: https://dataspace.copernicus.eu/browser/); Charles Balagizi, Goma Volcano Observatory, Departement de Geophysique, Centre de Recherche en Sciences Naturelles, Lwiro, D.S. Bukavu, DR Congo.
Bagana (Papua New Guinea) — October 2023 Cite this Report
Bagana
Papua New Guinea
6.137°S, 155.196°E; summit elev. 1855 m
All times are local (unless otherwise noted)
Explosions, ash plumes, ashfall, and lava flows during April-September 2023
The remote volcano of Bagana is located in central Bougainville Island, Papua New Guinea. Recorded eruptions date back to 1842 and activity has consisted of effusive activity that has built a small lava dome in the summit crater and occasional explosions that produced pyroclastic flows. The most recent eruption has been ongoing since February 2000 and has produced occasional explosions, ash plumes, and lava flows. More recently, activity has been characterized by ongoing effusive activity and ash emissions (BGVN 48:04). This report updates activity from April through September 2023 that has consisted of explosions, ash plumes, ashfall, and lava flows, using information from the Darwin Volcanic Ash Advisory Center (VAAC) and satellite data.
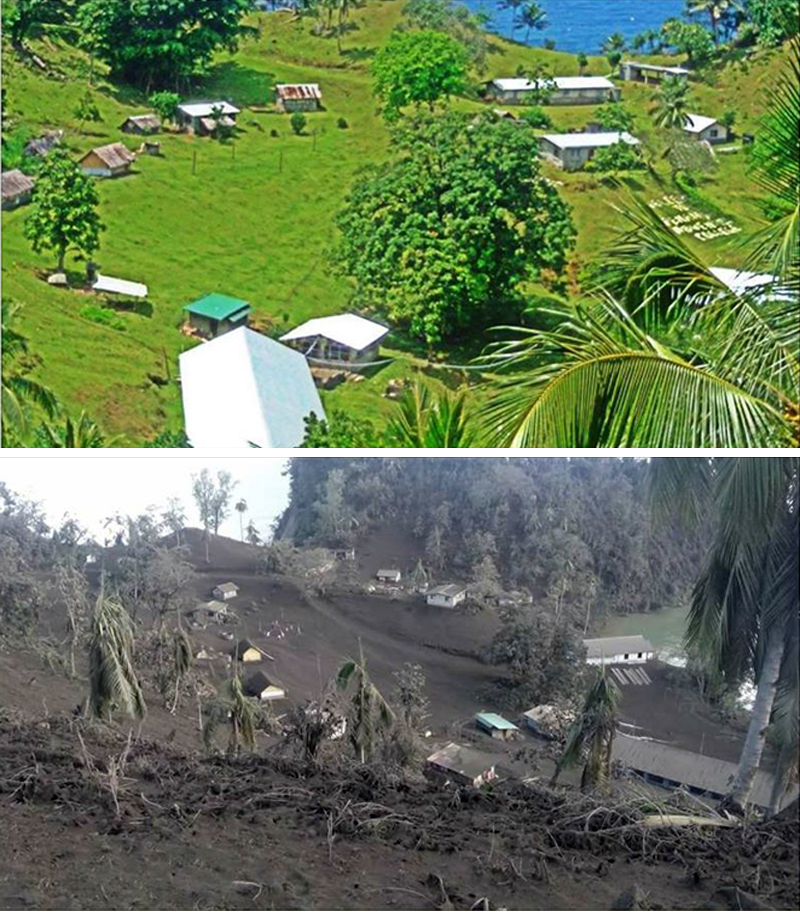
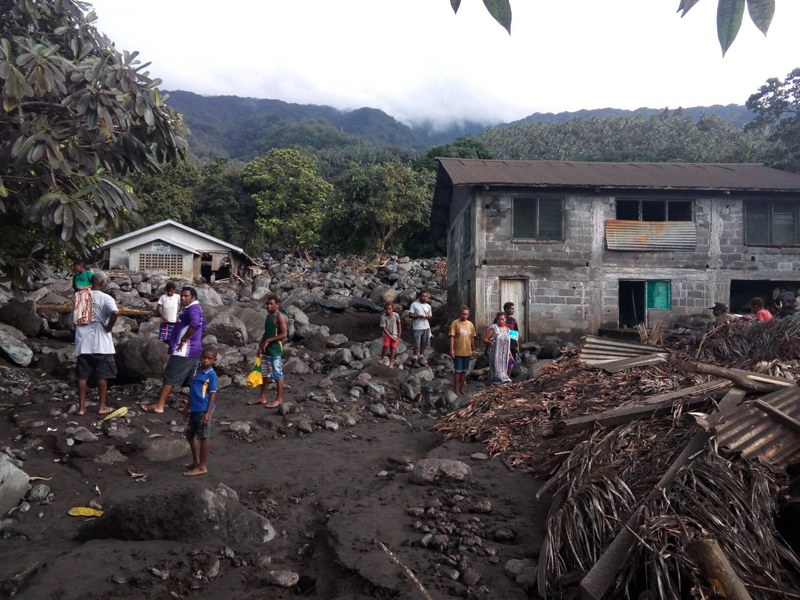
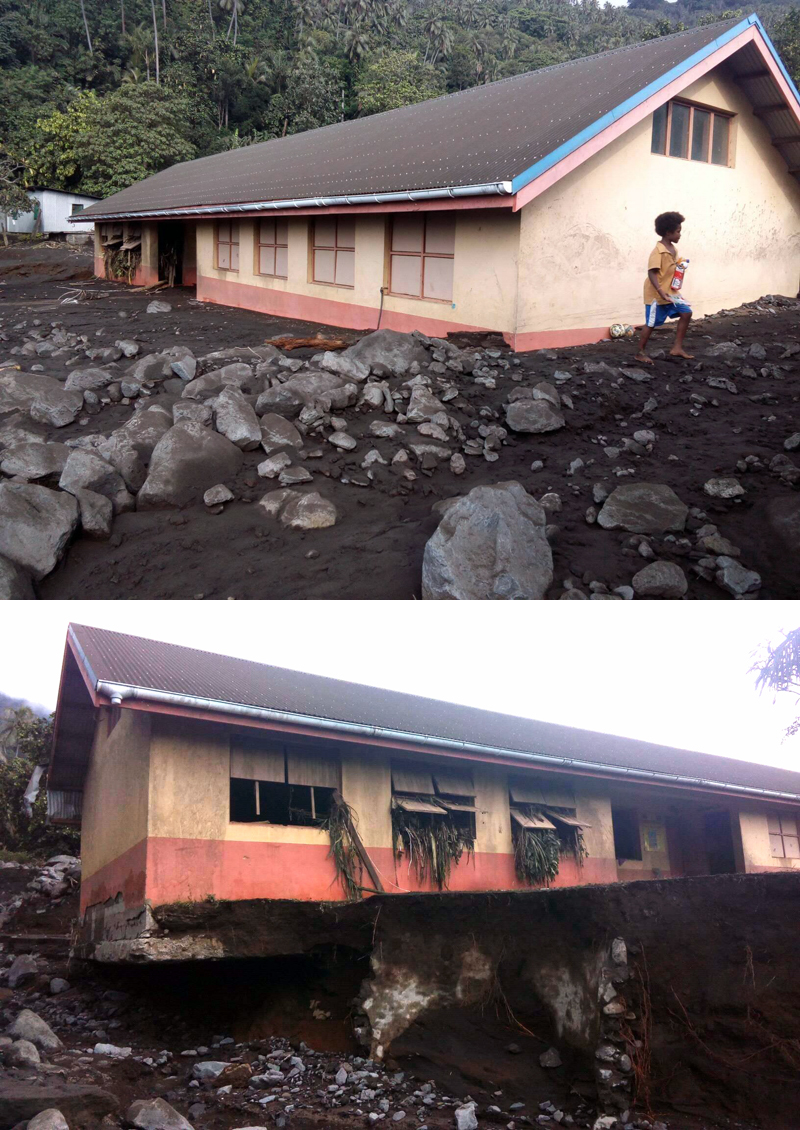
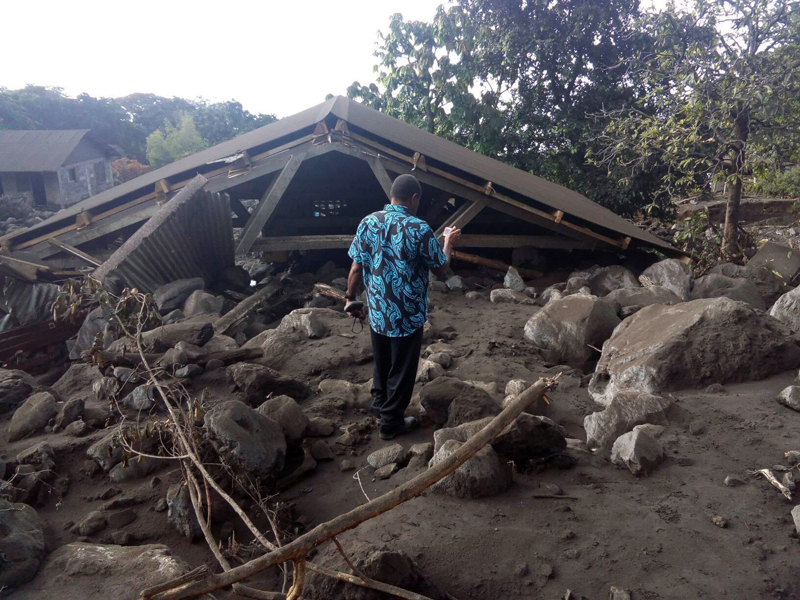
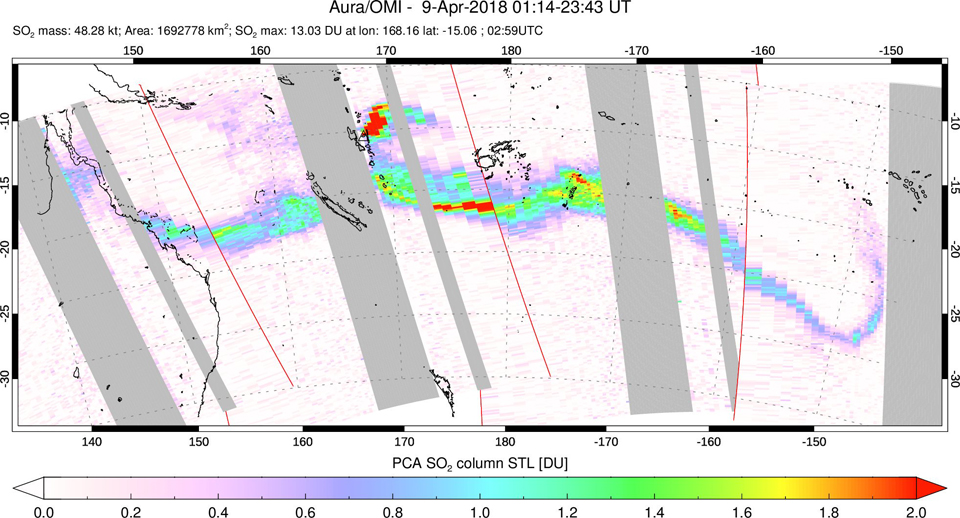
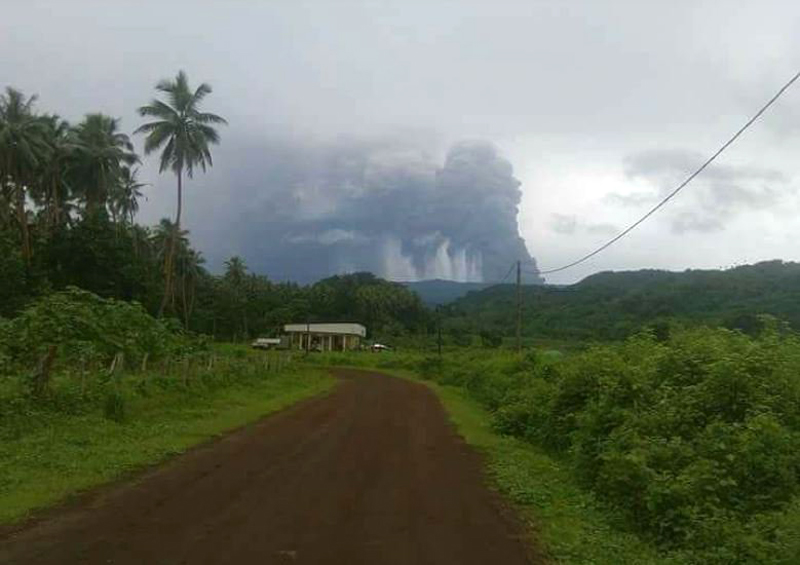
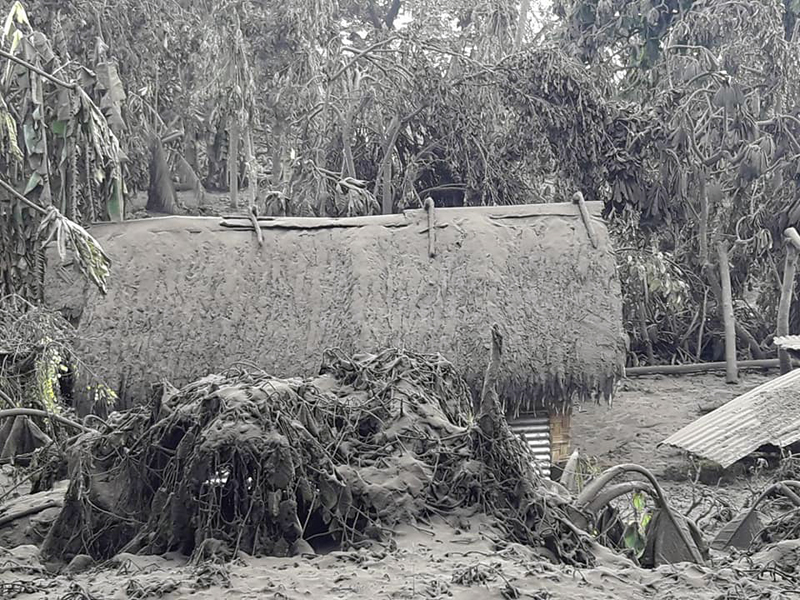
An explosive eruption was reported on 7 July that generated a large gas-and-ash plume to high altitudes and caused significant ashfall in local communities; the eruption plume had reached upper tropospheric (16-18 km altitude) altitudes by 2200, according to satellite images. Sulfur dioxide plumes were detected in satellite images on 8 July and indicated that the plume was likely a mixture of gas, ice, and ash. A report issued by the Autonomous Bougainville Government (ABG) (Torokina District, Education Section) on 10 July noted that significant ash began falling during 2000-2100 on 7 July and covered most areas in the Vuakovi, Gotana (9 km SW), Koromaketo, Laruma (25 km W) and Atsilima (27 km NW) villages. Pyroclastic flows also occurred, according to ground-based reports; small deposits confined to one drainage were inspected by RVO during an overflight on 17 July and were confirmed to be from the 7 July event. Ashfall continued until 10 July and covered vegetation, which destroyed bushes and gardens and contaminated rivers and streams.
RVO reported another eruption on 14 July. The Darwin VAAC stated that an explosive event started around 0830 on 15 July and produced an ash plume that rose to 16.5 km altitude by 1000 and drifted N, according to satellite images. The plume continued to drift N and remained visible through 1900, and by 2150 it had dissipated.
Ashfall likely from both the 7 and 15 July events impacted about 8,111 people in Torokina (20 km SW), including Tsito/Vuakovi, Gotana, Koromaketo, Kenaia, Longkogari, Kenbaki, Piva (13 km SW), and Atsinima, and in the Tsitovi district, according to ABG. Significant ashfall was also reported in Ruruvu (22 km N) in the Wakunai District of Central Bougainville, though the thickness of these deposits could not be confirmed. An evacuation was called for the villages in Wakunai, where heavy ashfall had contaminated water sources; the communities of Ruruvu, Togarau, Kakarapaia, Karauturi, Atao, and Kuritaturi were asked to evacuate to a disaster center at the Wakunai District Station, and communities in Torokina were asked to evacuate to the Piva District station. According to a news article, more than 7,000 people needed temporary accommodations, with about 1,000 people in evacuation shelters. Ashfall had deposited over a broad area, contaminating water supplies, affecting crops, and collapsing some roofs and houses in rural areas. Schools were temporarily shut down. Intermittent ash emissions continued through the end of July and drifted NNW, NW, and SW. Fine ashfall was reported on the coast of Torokina, and ash plumes also drifted toward Laruma and Atsilima.
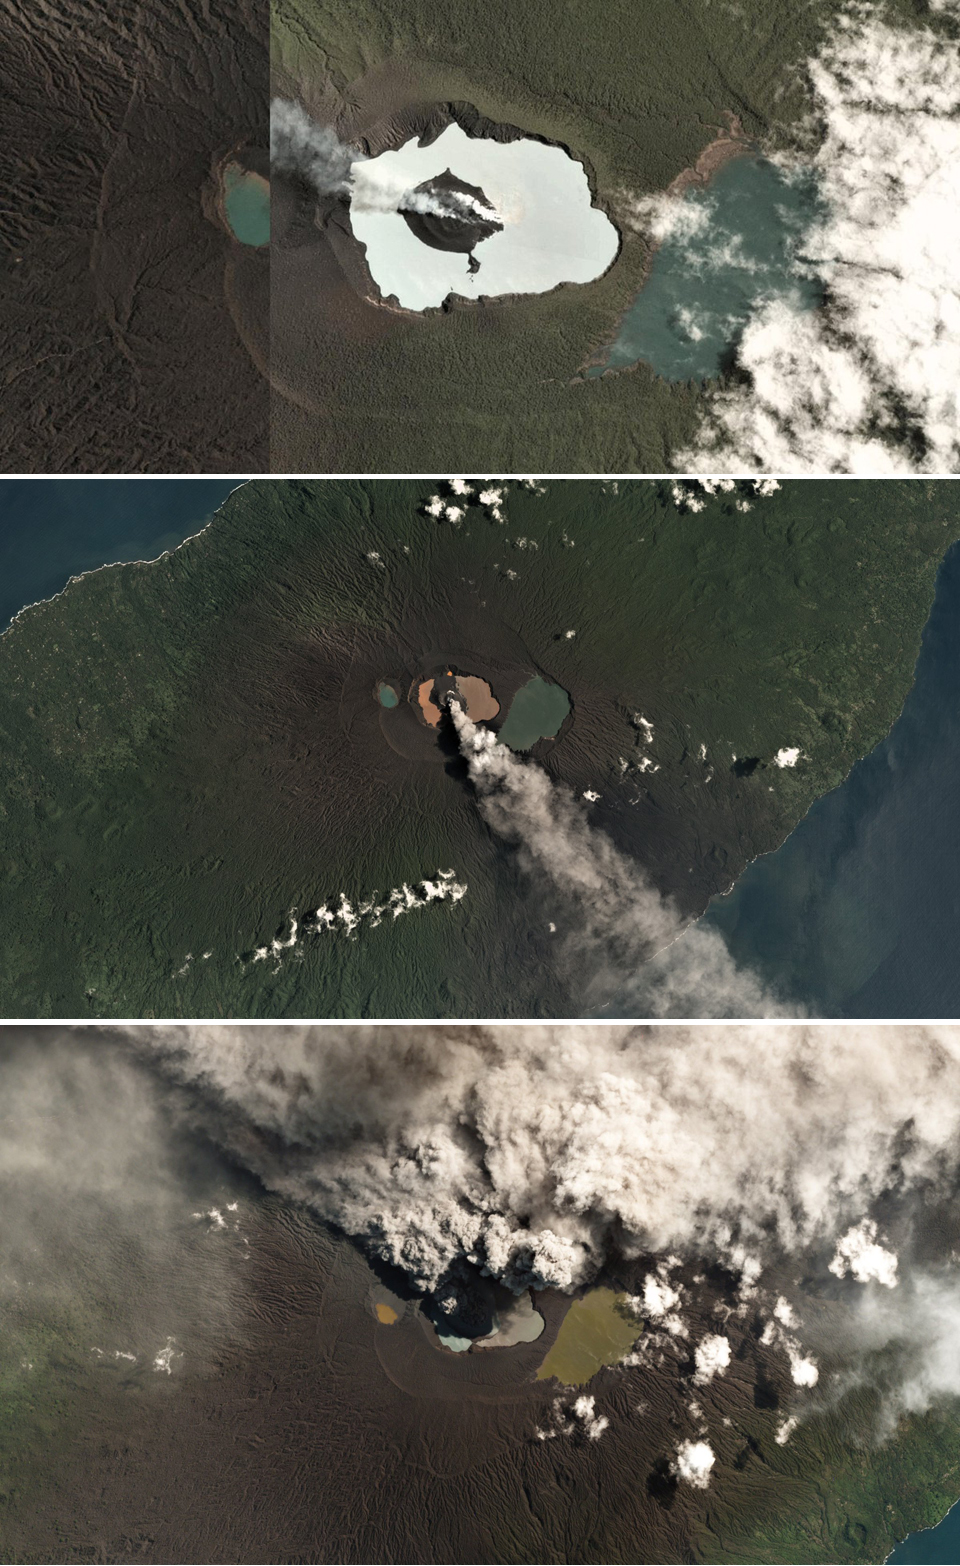
A small explosive eruption occurred at 2130 on 28 July that ejected material from the crater vents, according to reports from Torokina, in addition to a lava flow that contained two lobes. A second explosion was detected at 2157. Incandescence from the lava flow was visible from Piva as it descended the W flank around 2000 on 29 July (figure 47). The Darwin VAAC reported that a strong thermal anomaly was visible in satellite images during 30-31 July and that ash emissions rose to 2.4 km altitude and drifted WSW on 30 July. A ground report from RVO described localized emissions at 0900 on 31 July.
The Darwin VAAC reported that ash plumes were identified in satellite imagery at 0800 and 1220 on 12 August and rose to 2.1 km and 3 km altitude and drifted NW and W, respectively. A news report stated that aid was sent to more than 6,300 people that were adversely affected by the eruption. Photos taken during 17-19 August showed ash emissions rising no higher than 1 km above the summit and drifting SE. A small explosion generated an ash plume during the morning of 19 August. Deposits from small pyroclastic flows were also captured in the photos. Satellite images captured lava flows and pyroclastic flow deposits. Two temporary seismic stations were installed near Bagana on 17 August at distances of 7 km WSW (Vakovi station) and 11 km SW (Kepox station). The Kepox station immediately started to record continuous, low-frequency background seismicity.
Satellite data. Little to no thermal activity was detected during April through mid-July 2023; only one anomaly was recorded during early April and one during early June, according to MIROVA (Middle InfraRed Observation of Volcanic Activity) data (figure 48). Thermal activity increased in both power and frequency during mid-July through September, although there were still some short gaps in detected activity. MODVOLC also detected increased thermal activity during August; thermal hotspots were detected a total of five times on 19, 20, and 27 August. Weak thermal anomalies were also captured in infrared satellite images on clear weather days throughout the reporting period on 7, 12, and 17 April, 27 May, 1, 6, 16, and 31 July, and 19 September (figure 48); a strong thermal anomaly was visible on 31 July. Distinct sulfur dioxide plumes that drifted generally NW were intermittently captured by the TROPOMI instrument on the Sentinel-5P satellite and sometimes exceeded two Dobson Units (DUs) (figure 49).
Geologic Background. Bagana volcano, in a remote portion of central Bougainville Island, is frequently active. This massive symmetrical cone was largely constructed by an accumulation of viscous andesitic lava flows. The entire edifice could have been constructed in about 300 years at its present rate of lava production. Eruptive activity is characterized by non-explosive effusion of viscous lava that maintains a small lava dome in the summit crater, although occasional explosive activity produces pyroclastic flows. Lava flows with tongue-shaped lobes up to 50 m thick and prominent levees descend the flanks on all sides.
Information Contacts: Rabaul Volcano Observatory (RVO), Geohazards Management Division, Department of Mineral Policy and Geohazards Management (DMPGM), PO Box 3386, Kokopo, East New Britain Province, Papua New Guinea; Darwin Volcanic Ash Advisory Centre (VAAC), Bureau of Meteorology, Northern Territory Regional Office, PO Box 40050, Casuarina, NT 0811, Australia (URL: http://www.bom.gov.au/info/vaac/); MIROVA (Middle InfraRed Observation of Volcanic Activity), a collaborative project between the Universities of Turin and Florence (Italy) supported by the Centre for Volcanic Risk of the Italian Civil Protection Department (URL: http://www.mirovaweb.it/); Hawai'i Institute of Geophysics and Planetology (HIGP) - MODVOLC Thermal Alerts System, School of Ocean and Earth Science and Technology (SOEST), Univ. of Hawai'i, 2525 Correa Road, Honolulu, HI 96822, USA (URL: http://modis.higp.hawaii.edu/); NASA Global Sulfur Dioxide Monitoring Page, Atmospheric Chemistry and Dynamics Laboratory, NASA Goddard Space Flight Center (NASA/GSFC), 8800 Greenbelt Road, Goddard, Maryland, USA (URL: https://so2.gsfc.nasa.gov/); Copernicus Browser, Copernicus Data Space Ecosystem, European Space Agency (URL: https://dataspace.copernicus.eu/browser/); Autonomous Bougainville Government, P.O Box 322, Buka, AROB, PNG (URL: https://abg.gov.pg/); Andrew Tupper (Twitter: @andrewcraigtupp); Simon Carn, Geological and Mining Engineering and Sciences, Michigan Technological University, 1400 Townsend Drive, Houghton, MI 49931, USA (URL: http://www.volcarno.com/, Twitter: @simoncarn); Radio NZ (URL: https://www.rnz.co.nz/news/pacific/494464/more-than-7-000-people-in-bougainville-need-temporary-accommodation-after-eruption); USAID, 1300 Pennsylvania Ave, NW, Washington DC 20004, USA (URL: https://www.usaid.gov/pacific-islands/press-releases/aug-08-2023-united-states-provides-immediate-emergency-assistance-support-communities-affected-mount-bagana-volcanic-eruptions).
Mayon (Philippines) — October 2023 Cite this Report
Mayon
Philippines
13.257°N, 123.685°E; summit elev. 2462 m
All times are local (unless otherwise noted)
Lava flows, pyroclastic flows, ash emissions, and seismicity during April-September 2023
Mayon is located in the Philippines and has steep upper slopes capped by a small summit crater. Historical eruptions date back to 1616 CE that have been characterized by Strombolian eruptions, lava flows, pyroclastic flows, and mudflows. Eruptions mostly originated from a central conduit. Pyroclastic flows and mudflows have commonly descended many of the approximately 40 drainages that surround the volcano. The most recent eruption occurred during June through October 2022 and consisted of lava dome growth and gas-and-steam emissions (BGVN 47:12). A new eruption was reported during late April 2023 and has included lava flows, pyroclastic density currents, ash emissions, and seismicity. This report covers activity during April through September 2023 based on daily bulletins from the Philippine Institute of Volcanology and Seismology (PHIVOLCS).
During April through September 2023, PHIVOLCS reported near-daily rockfall events, frequent volcanic earthquakes, and sulfur dioxide measurements. Gas-and-steam emissions rose 100-900 m above the crater and drifted in different directions. Nighttime crater incandescence was often visible during clear weather and was accompanied by incandescent avalanches of material. Activity notably increased during June when lava flows were reported on the S, SE, and E flanks (figure 52). The MIROVA graph (Middle InfraRed Observation of Volcanic Activity) showed strong thermal activity coincident with these lava flows, which remained active through September (figure 53). According to the MODVOLC thermal algorithm, a total of 110 thermal alerts were detected during the reporting period: 17 during June, 40 during July, 27 during August, and 26 during September. During early June, pyroclastic density currents (PDCs) started to occur more frequently.
Low activity was reported during much of April and May; gas-and-steam emissions rose 100-900 m above the crater and generally drifted in different directions. A total of 52 rockfall events and 18 volcanic earthquakes were detected during April and 147 rockfall events and 13 volcanic events during May. Sulfur dioxide flux measurements ranged between 400-576 tons per day (t/d) during April, the latter of which was measured on 29 April and between 162-343 t/d during May, the latter of which was measured on 13 May.
Activity during June increased, characterized by lava flows, pyroclastic density currents (PDCs), crater incandescence and incandescent rockfall events, gas-and-steam emissions, and continued seismicity. Weather clouds often prevented clear views of the summit, but during clear days, moderate gas-and-steam emissions rose 100-2,500 m above the crater and drifted in multiple directions. A total of 6,237 rockfall events and 288 volcanic earthquakes were detected. The rockfall events often deposited material on the S and SE flanks within 700-1,500 m of the summit crater and ash from the events drifted SW, S, SE, NE, and E. Sulfur dioxide emissions ranged between 149-1,205 t/d, the latter of which was measured on 10 June. Short-term observations from EDM and electronic tiltmeter monitoring indicated that the upper slopes were inflating since February 2023. Longer-term ground deformation parameters based on EDM, precise leveling, continuous GPS, and electronic tilt monitoring indicated that the volcano remained inflated, especially on the NW and SE flanks. At 1000 on 5 June the Volcano Alert Level (VAL) was raised to 2 (on a 0-5 scale). PHIVOLCS noted that although low-level volcanic earthquakes, ground deformation, and volcanic gas emissions indicated unrest, the steep increase in rockfall frequency may indicate increased dome activity.
A total of 151 dome-collapse PDCs occurred during 8-9 and 11-30 June, traveled 500-2,000 m, and deposited material on the S flank within 2 km of the summit crater. During 8-9 June the VAL was raised to 3. At approximately 1947 on 11 June lava flow activity was reported; two lobes traveled within 500 m from the crater and deposited material on the S (Mi-isi), SE (Bonga), and E (Basud) flanks. Weak seismicity accompanied the lava flow and slight inflation on the upper flanks. This lava flow remained active through 30 June, moving down the S and SE flank as far as 2.5 km and 1.8 km, respectively and depositing material up to 3.3 km from the crater. During 15-16 June traces of ashfall from the PDCs were reported in Sitio Buga, Nabonton, City of Ligao and Purok, and San Francisco, Municipality of Guinobatan. During 28-29 June there were two PDCs generated by the collapse of the lava flow front, which generated a light-brown ash plume 1 km high. Satellite monitors detected significant concentrations of sulfur dioxide beginning on 29 June. On 30 June PDCs primarily affected the Basud Gully on the E flank, the largest of which occurred at 1301 and lasted eight minutes, based on the seismic record. Four PDCs generated between 1800 and 2000 that lasted approximately four minutes each traveled 3-4 km on the E flank and generated an ash plume that rose 1 km above the crater and drifted N and NW. Ashfall was recorded in Tabaco City.
Similar strong activity continued during July; slow lava effusion remained active on the S and SE flanks and traveled as far as 2.8 km and 2.8 km, respectively and material was deposited as far as 4 km from the crater. There was a total of 6,983 rockfall events and 189 PDCs that affected the S, SE, and E flanks. The volcano network detected a total of 2,124 volcanic earthquakes. Continuous gas-and-steam emissions rose 200-2,000 m above the crater and drifted in multiple directions. Sulfur dioxide emissions averaged 792-4,113 t/d, the latter of which was measured on 28 July. During 2-4 July three PDCs were generated from the collapse of the lava flow and resulting light brown plumes rose 200-300 m above the crater. Continuous tremor pulses were reported beginning at 1547 on 3 July through 7 July at 1200, at 2300 on 8 July and going through 0300 on 10 July, and at 2300 on 16 July, as recorded by the seismic network. During 6-9 July there were 10 lava flow-collapse-related PDCs that generated light brown plumes 300-500 m above the crater. During 10-11 July light ashfall was reported in some areas of Mabinit, Legazpi City, Budiao and Salvacion, Daraga, and Camalig, Albay. By 18 July the lava flow advanced 600 m on the E flank as well.
During 1733 on 18 July and 0434 on 19 July PHIVOLCS reported 30 “ashing” events, which are degassing events accompanied by audible thunder-like sounds and entrained ash at the crater, which produced short, dark plumes that drifted SW. These events each lasted 20-40 seconds, and plume heights ranged from 150-300 m above the crater, as recorded by seismic, infrasound, visual, and thermal monitors. Three more ashing events occurred during 19-20 July. Short-term observations from electronic tilt and GPS monitoring indicate deflation on the E lower flanks in early July and inflation on the NW middle flanks during the third week of July. Longer-term ground deformation parameters from EDM, precise leveling, continuous GPS, and electronic tilt monitoring indicated that the volcano was still generally inflated relative to baseline levels. A short-lived lava pulse lasted 28 seconds at 1956 on 21 July, which was accompanied by seismic and infrasound signals. By 22 July, the only lava flow that remained active was on the SE flank, and continued to extend 3.4 km, while those on the S and E flanks weakened markedly. One ashing event was detected during 30-31 July, whereas there were 57 detected during 31 July-1 August; according to PHIVOLCS beginning at approximately 1800 on 31 July eruptive activity was dominated by phases of intermittent ashing, as well as increased in the apparent rates of lava effusion from the summit crater. The ashing phases consisted of discrete events recorded as low-frequency volcanic earthquakes (LFVQ) typically 30 seconds in duration, based on seismic and infrasound signals. Gray ash plume rose 100 m above the crater and generally drifted NE. Shortly after these ashing events began, new lava began to effuse rapidly from the crater, feeding the established flowed on the SE, E, and E flanks and generating frequent rockfall events.
Intensified unrest persisted during August. There was a total of 4,141 rockfall events, 2,881 volcanic earthquakes, which included volcanic tremor events, 32 ashing events, and 101 PDCs detected throughout the month. On clear weather days, gas-and-steam emissions rose 300-1,500 m above the crater and drifted in different directions (figure 54). Sulfur dioxide emissions averaged 735-4,756 t/d, the higher value of which was measured on 16 August. During 1-2 August the rate of lava effusion decreased, but continued to feed the flows on the SE, S, and E flanks, maintaining their advances to 3.4 km, 2.8 km, and 1.1 km from the crater, respectively (figure 55). Rockfall and PDCs generated by collapses at the lava flow margins and from the summit dome deposited material within 4 km of the crater. During 3-4 August there were 10 tremor events detected that lasted 1-4 minutes. Short-lived lava pulse lasted 35 seconds and was accompanied by seismic and infrasound signals at 0442 on 6 August. Seven collapses were recorded at the front of the lava flow during 12-14 August.
During September, similar activity of slow lava effusion, PDCs, gas-and-steam emissions, and seismicity continued. There was a total of 4,452 rockfall events, 329 volcanic earthquakes, which included volcanic tremor events, two ashing events, and 85 PDCs recorded throughout the month. On clear weather days, gas-and-steam emissions rose 100-1,500 m above the crater and drifted in multiple directions. Sulfur dioxide emissions averaged 609-2,252 t/d, the higher average of which was measured on 6 September. Slow lava effusion continued advancing on the SE, S, and E flanks, maintaining lengths of 3.4 km, 2.8 km, and 1.1 km, respectively. Rockfall and PDC events generated by collapses along the lava flow margins and at the summit dome deposited material within 4 km of the crater.
Geologic Background. Symmetrical Mayon, which rises above the Albay Gulf NW of Legazpi City, is the most active volcano of the Philippines. The steep upper slopes are capped by a small summit crater. Recorded eruptions since 1616 CE range from Strombolian to basaltic Plinian, with cyclical activity beginning with basaltic eruptions, followed by longer periods of andesitic lava flows. Eruptions occur predominately from the central conduit and have also produced lava flows that travel far down the flanks. Pyroclastic density currents and mudflows have commonly swept down many of the approximately 40 ravines that radiate from the summit and have often damaged populated lowland areas. A violent eruption in 1814 killed more than 1,200 people and devastated several towns.
Information Contacts: Philippine Institute of Volcanology and Seismology (PHIVOLCS), Department of Science and Technology, University of the Philippines Campus, Diliman, Quezon City, Philippines (URL: http://www.phivolcs.dost.gov.ph/); MIROVA (Middle InfraRed Observation of Volcanic Activity), a collaborative project between the Universities of Turin and Florence (Italy) supported by the Centre for Volcanic Risk of the Italian Civil Protection Department (URL: http://www.mirovaweb.it/); Hawai'i Institute of Geophysics and Planetology (HIGP) - MODVOLC Thermal Alerts System, School of Ocean and Earth Science and Technology (SOEST), Univ. of Hawai'i, 2525 Correa Road, Honolulu, HI 96822, USA (URL: http://modis.higp.hawaii.edu/); Copernicus Browser, Copernicus Data Space Ecosystem, European Space Agency (URL: https://dataspace.copernicus.eu/browser/); William Rogers, Legazpi City, Albay Province, Philippines.
Nishinoshima (Japan) — October 2023 Cite this Report
Nishinoshima
Japan
27.247°N, 140.874°E; summit elev. 100 m
All times are local (unless otherwise noted)
Eruption plumes and gas-and-steam plumes during May-August 2023
Nishinoshima, located about 1,000 km S of Tokyo, is a small island in the Ogasawara Arc in Japan. The island is the summit of a massive submarine volcano that has prominent submarine peaks to the S, W, and NE. Eruptions date back to 1973 and the current eruption period began in October 2022. Recent activity has consisted of small ash plumes and fumarolic activity (BGVN 48:07). This report covers activity during May through August 2023, using information from monthly reports of the Japan Meteorological Agency (JMA) monthly reports and satellite data.
Activity during May through June was relatively low. The Japan Coast Guard (JCG) did overflights on 14 and 22 June and reported white gas-and-steam emissions rising 600 m and 1,200 m from the central crater of the pyroclastic cone, respectively (figure 125). In addition, multiple white gas-and-steam emissions rose from the inner rim of the W side of the crater and from the SE flank of the pyroclastic cone. Discolored brown-to-green water was observed around almost the entire perimeter of the island; on 22 June light green discolored water was observed off the S coast of the island.
Observations from the Himawari meteorological satellite confirmed an eruption on 9 and 10 July. An eruption plume rose 1.6 km above the crater and drifted N around 1300 on 9 July. Satellite images acquired at 1420 and 2020 on 9 July and at 0220 on 10 July showed continuing emissions that rose 1.3-1.6 km above the crater and drifted NE and N. The Tokyo VAAC reported that an ash plume seen by a pilot and identified in a satellite image at 0630 on 21 July rose to 3 km altitude and drifted S.
Aerial observations conducted by JCG on 8 August showed a white-and-gray plume rising from the central crater of the pyroclastic cone, and multiple white gas-and-steam emissions were rising from the inner edge of the western crater and along the NW-SE flanks of the island (figure 126). Brown-to-green discolored water was also noted around the perimeter of the island.
Intermittent low-to-moderate power thermal anomalies were recorded in the MIROVA graph (Middle InfraRed Observation of Volcanic Activity), showing an increase in both frequency and power beginning in July (figure 127). This increase in activity coincides with eruptive activity on 9 and 10 July, characterized by eruption plumes. According to the MODVOLC thermal alert algorithm, one thermal hotspot was recorded on 20 July. Weak thermal anomalies were also detected in infrared satellite imagery, accompanied by strong gas-and-steam plumes (figure 128).
Geologic Background. The small island of Nishinoshima was enlarged when several new islands coalesced during an eruption in 1973-74. Multiple eruptions that began in 2013 completely covered the previous exposed surface and continued to enlarge the island. The island is the summit of a massive submarine volcano that has prominent peaks to the S, W, and NE. The summit of the southern cone rises to within 214 m of the ocean surface 9 km SSE.
Information Contacts: Japan Meteorological Agency (JMA), 1-3-4 Otemachi, Chiyoda-ku, Tokyo 100-8122, Japan (URL: http://www.jma.go.jp/jma/indexe.html); Tokyo Volcanic Ash Advisory Center (VAAC), 1-3-4 Otemachi, Chiyoda-ku, Tokyo 100-8122, Japan (URL: http://ds.data.jma.go.jp/svd/vaac/data/); MIROVA (Middle InfraRed Observation of Volcanic Activity), a collaborative project between the Universities of Turin and Florence (Italy) supported by the Centre for Volcanic Risk of the Italian Civil Protection Department (URL: http://www.mirovaweb.it/); Copernicus Browser, Copernicus Data Space Ecosystem, European Space Agency (URL: https://dataspace.copernicus.eu/browser/).
Krakatau (Indonesia) — October 2023 Cite this Report
Krakatau
Indonesia
6.1009°S, 105.4233°E; summit elev. 285 m
All times are local (unless otherwise noted)
White gas-and-steam plumes and occasional ash plumes during May-August 2023
Krakatau is located in the Sunda Strait between Java and Sumatra, Indonesia. Caldera collapse during the catastrophic 1883 eruption destroyed Danan and Perbuwatan cones and left only a remnant of Rakata. The post-collapse cone of Anak Krakatau (Child of Krakatau) was constructed within the 1883 caldera at a point between the former Danan and Perbuwatan cones; it has been the site of frequent eruptions since 1927. The current eruption period began in May 2021 and has recently consisted of Strombolian eruptions and ash plumes (BGVN 48:07). This report describes lower levels of activity consisting of ash and white gas-and-steam plumes during May through August 2023, based on information provided by the Indonesian Center for Volcanology and Geological Hazard Mitigation, referred to as Pusat Vulkanologi dan Mitigasi Bencana Geologi (PVMBG), MAGMA Indonesia, and satellite data.
Activity was relatively low during May and June. Daily white gas-and-steam emissions rose 25-200 m above the crater and drifted in different directions. Five ash plumes were detected at 0519 on 10 May, 1241 on 11 May, 0920 on 12 May, 2320 on 12 May, and at 0710 on 13 May, and rose 1-2.5 km above the crater and drifted SW. A webcam image taken on 12 May showed ejection of incandescent material above the vent. A total of nine ash plumes were detected during 6-11 June: at 1434 and 00220 on 6 and 7 June the ash plumes rose 500 m above the crater and drifted NW, at 1537 on 8 June the ash plume rose 1 km above the crater and drifted SW, at 0746 and at 0846 on 9 June the ash plumes rose 800 m and 3 km above the crater and drifted SW, respectively, at 0423, 1431, and 1750 on 10 June the ash plumes rose 2 km, 1.5 km, and 3.5 km above the crater and drifted NW, respectively, and at 0030 on 11 June an ash plume rose 2 km above the crater and drifted NW. Webcam images taken on 10 and 11 June at 0455 and 0102, respectively, showed incandescent material ejected above the vent. On 19 June an ash plume at 0822 rose 1.5 km above the crater and drifted SE.
Similar low activity of white gas-and-steam emissions and few ash plumes were reported during July and August. Daily white gas-and-steam emissions rose 25-300 m above the crater and drifted in multiple directions. Three ash plumes were reported at 0843, 0851, and 0852 on 20 July that rose 500-2,000 m above the crater and drifted NW.
The MIROVA (Middle InfraRed Observation of Volcanic Activity) graph of MODIS thermal anomaly data showed intermittent low-to-moderate power thermal anomalies during May through August 2023 (figure 140). Although activity was often obscured by weather clouds, a thermal anomaly was visible in an infrared satellite image of the crater on 12 May, accompanied by an eruption plume that drifted SW (figure 141).
Geologic Background. The renowned Krakatau (frequently mis-named as Krakatoa) volcano lies in the Sunda Strait between Java and Sumatra. Collapse of an older edifice, perhaps in 416 or 535 CE, formed a 7-km-wide caldera. Remnants of that volcano are preserved in Verlaten and Lang Islands; subsequently the Rakata, Danan, and Perbuwatan cones were formed, coalescing to create the pre-1883 Krakatau Island. Caldera collapse during the catastrophic 1883 eruption destroyed Danan and Perbuwatan, and left only a remnant of Rakata. This eruption caused more than 36,000 fatalities, most as a result of tsunamis that swept the adjacent coastlines of Sumatra and Java. Pyroclastic surges traveled 40 km across the Sunda Strait and reached the Sumatra coast. After a quiescence of less than a half century, the post-collapse cone of Anak Krakatau (Child of Krakatau) was constructed within the 1883 caldera at a point between the former Danan and Perbuwatan cones. Anak Krakatau has been the site of frequent eruptions since 1927.
Information Contacts: Pusat Vulkanologi dan Mitigasi Bencana Geologi (PVMBG, also known as Indonesian Center for Volcanology and Geological Hazard Mitigation, CVGHM), Jalan Diponegoro 57, Bandung 40122, Indonesia (URL: http://www.vsi.esdm.go.id/); MAGMA Indonesia, Kementerian Energi dan Sumber Daya Mineral (URL: https://magma.esdm.go.id/v1); MIROVA (Middle InfraRed Observation of Volcanic Activity), a collaborative project between the Universities of Turin and Florence (Italy) supported by the Centre for Volcanic Risk of the Italian Civil Protection Department (URL: http://www.mirovaweb.it/); Copernicus Browser, Copernicus Data Space Ecosystem, European Space Agency (URL: https://dataspace.copernicus.eu/browser/).
Villarrica (Chile) — October 2023 Cite this Report
Villarrica
Chile
39.42°S, 71.93°W; summit elev. 2847 m
All times are local (unless otherwise noted)
Strombolian activity, gas-and-ash emissions, and crater incandescence during April-September 2023
Villarrica, in central Chile, consists of a 2-km-wide caldera that formed about 3,500 years ago and is located at the base of the presently active cone at the NW margin of a 6-km-wide caldera. Historical eruptions eruptions date back to 1558 and have been characterized by mild-to-moderate explosive activity with occasional lava effusions. The current eruption period began in December 2014 and has recently consisted of nighttime crater incandescence, ash emissions, and seismicity (BGVN 48:04). This report covers activity during April through September 2023 and describes occasional Strombolian activity, gas-and-ash emissions, and nighttime crater incandescence. Information for this report primarily comes from the Southern Andes Volcano Observatory (Observatorio Volcanológico de Los Andes del Sur, OVDAS), part of Chile's National Service of Geology and Mining (Servicio Nacional de Geología y Minería, SERNAGEOMIN) and satellite data.
Seismicity during April consisted of long period (LP) events and tremor (TRE); a total of 9,413 LP-type events and 759 TR-type events were detected throughout the month. Nighttime crater incandescence persisted and was visible in the degassing column. Sulfur dioxide data was obtained using Differential Absorption Optical Spectroscopy Equipment (DOAS) that showed an average value of 1,450 ± 198 tons per day (t/d) during 1-15 April and 1,129 ± 201 t/d during 16-30 April, with a maximum daily value of 2,784 t/d on 9 April. Gas-and-steam emissions of variable intensities rose above the active crater as high as 1.3 km above the crater on 13 April. Strombolian explosions were not observed and there was a slight decrease in the lava lake level.
There were 14,123 LP-type events and 727 TR-type events detected during May. According to sulfur dioxide measurements taken with DOAS equipment, the active crater emitted an average value of 1,826 ± 482 t/d during 1-15 May and 912 ± 41 t/d during 16-30 May, with a daily maximum value of 5,155 t/d on 13 May. Surveillance cameras showed continuous white gas-and-steam emissions that rose as high as 430 m above the crater on 27 May. Nighttime incandescence illuminated the gas column less than 300 m above the crater rim was and no pyroclastic emissions were reported. A landslide was identified on 13 May on the E flank of the volcano 50 m from the crater rim and extending 300 m away; SERNAGEOMIN noted that this event may have occurred on 12 May. During the morning of 27 and 28 May minor Strombolian explosions characterized by incandescent ejecta were recorded at the crater rim; the last reported Strombolian explosions had occurred at the end of March.
Seismic activity during June consisted of five volcano-tectonic (VT)-type events, 21,606 LP-type events, and 2,085 TR-type events. The average value of sulfur dioxide flux obtained by DOAS equipment was 1,420 ± 217 t/d during 1-15 June and 2,562 ± 804 t/d, with a maximum daily value of 4,810 t/d on 17 June. White gas-and-steam emissions rose less than 480 m above the crater; frequent nighttime crater incandescence was reflected in the degassing plume. On 12 June an emission rose 100 m above the crater and drifted NNW. On 15 June one or several emissions resulted in ashfall to the NE as far as 5.5 km from the crater, based on a Skysat satellite image. Several Strombolian explosions occurred within the crater; activity on 15 June was higher energy and ejected blocks 200-300 m on the NE slope. Surveillance cameras showed white gas-and-steam emissions rising 480 m above the crater on 16 June. On 19 and 24 June low-intensity Strombolian activity was observed, ejecting material as far as 200 m from the center of the crater to the E.
During July, seismicity included 29,319 LP-type events, 3,736 TR-type events, and two VT-type events. DOAS equipment recorded two days of sulfur dioxide emissions of 4,220 t/d and 1,009 t/d on 1 and 13 July, respectively. Constant nighttime incandescence was also recorded and was particularly noticeable when accompanied by eruptive columns on 12 and 16 July. Minor explosive events were detected in the crater. According to Skysat satellite images taken on 12, 13, and 16 July, ashfall deposits were identified 155 m S of the crater. According to POVI, incandescence was visible from two vents on the crater floor around 0336 on 12 July. Gas-and-ash emissions rose as high as 1.2 km above the crater on 13 July and drifted E and NW. A series of gas-and-steam pulses containing some ash deposited material on the upper E flank around 1551 on 13 July. During 16-31 July, average sulfur dioxide emissions of 1,679 ± 406 t/d were recorded, with a maximum daily value of 2,343 t/d on 28 July. Fine ash emissions were also reported on 16, 17, and 23 July.
Seismicity persisted during August, characterized by 27,011 LP-type events, 3,323 TR-type events, and three VT-type events. The average value of sulfur dioxide measurements taken during 1-15 August was 1,642 ± 270 t/d and 2,207 ± 4,549 t/d during 16-31 August, with a maximum daily value of 3,294 t/d on 27 August. Nighttime crater incandescence remained visible in degassing columns. White gas-and-steam emissions rose 480 m above the crater on 6 August. According to a Skysat satellite image from 6 August, ash accumulation was observed proximal to the crater and was mainly distributed toward the E slope. White gas-and-steam emissions rose 320 m above the crater on 26 August. Nighttime incandescence and Strombolian activity that generated ash emissions were reported on 27 August.
Seismicity during September was characterized by five VT-type events, 12,057 LP-type events, and 2,058 TR-type events. Nighttime incandescence persisted. On 2 September an ash emission rose 180 m above the crater and drifted SE at 1643 (figure 125) and a white gas-and-steam plume rose 320 m above the crater. According to the Buenos Aires VAAC, periods of continuous gas-and-ash emissions were visible in webcam images from 1830 on 2 September to 0110 on 3 September. Strombolian activity was observed on 2 September and during the early morning of 3 September, the latter event of which generated an ash emission that rose 60 m above the crater and drifted 100 m from the center of the crater to the NE and SW. Ashfall was reported to the SE and S as far as 750 m from the crater. The lava lake was active during 3-4 September and lava fountaining was visible for the first time since 26 March 2023, according to POVI. Fountains captured in webcam images at 2133 on 3 September and at 0054 on 4 September rose as high as 60 m above the crater rim and ejected material onto the upper W flank. Sulfur dioxide flux of 1,730 t/d and 1,281 t/d was measured on 3 and 4 September, respectively, according to data obtained by DOAS equipment.
Strong Strombolian activity and larger gas-and-ash plumes were reported during 18-20 September. On 18 September activity was also associated with energetic LP-type events and notable sulfur dioxide fluxes (as high as 4,277 t/d). On 19 September Strombolian activity and incandescence were observed. On 20 September at 0914 ash emissions rose 50 m above the crater and drifted SSE, accompanied by Strombolian activity that ejected material less than 100 m SSE, causing fall deposits on that respective flank. SERNAGEOMIN reported that a Planet Scope satellite image taken on 20 September showed the lava lake in the crater, measuring 32 m x 35 m and an area of 0.001 km2. Several ash emissions were recorded at 0841, 0910, 1251, 1306, 1312, 1315, and 1324 on 23 September and rose less than 150 m above the crater. The sulfur dioxide flux value was 698 t/d on 23 September and 1,097 t/d on 24 September. On 24 September the Volcanic Alert Level (VAL) was raised to Orange (the third level on a four-color scale). SENAPRED maintained the Alert Level at Yellow (the middle level on a three-color scale) for the communities of Villarrica, Pucón (16 km N), Curarrehue, and Panguipulli.
During 24-25 September there was an increase in seismic energy (observed at TR-events) and acoustic signals, characterized by 1 VT-type event, 213 LP-type events, and 124 TR-type events. Mainly white gas-and-steam emissions, in addition to occasional fine ash emissions were recorded. During the early morning of 25 September Strombolian explosions were reported and ejected material 250 m in all directions, though dominantly toward the NW. On 25 September the average value of sulfur dioxide flux was 760 t/d. Seismicity during 25-30 September consisted of five VT-type events, 1,937 LP-type events, and 456 TR-type events.
During 25-29 September moderate Strombolian activity was observed and ejected material as far as the crater rim. In addition, ash pulses lasting roughly 50 minutes were observed around 0700 and dispersed ENE. During 26-27 September a TR episode lasted 6.5 hours and was accompanied by discrete acoustic signals. Satellite images from 26 September showed a spatter cone on the crater floor with one vent that measured 10 x 14 m and a smaller vent about 35 m NE of the cone. SERNAGEOMIN reported an abundant number of bomb-sized blocks up to 150 m from the crater, as well as impact marks on the snow, which indicated explosive activity. A low-altitude ash emission was observed drifting NW around 1140 on 28 September, based on webcam images. Between 0620 and 0850 on 29 September an ash emission rose 60 m above the crater and drifted NW. During an overflight taken around 1000 on 29 September scientists observed molten material in the vent, a large accumulation of pyroclasts inside the crater, and energetic degassing, some of which contained a small amount of ash. Block-sized pyroclasts were deposited on the internal walls and near the crater, and a distal ash deposit was also visible. The average sulfur dioxide flux measured on 28 September was 344 t/d. Satellite images taken on 29 September ashfall was deposited roughly 3 km WNW from the crater and nighttime crater incandescence remained visible. The average sulfur dioxide flux value from 29 September was 199 t/d. On 30 September at 0740 a pulsating ash emission rose 1.1 km above the crater and drifted NNW (figure 126). Deposits on the S flank extended as far as 4.5 km from the crater rim, based on satellite images from 30 September.
Infrared MODIS satellite data processed by MIROVA (Middle InfraRed Observation of Volcanic Activity) showed intermittent thermal activity during April through September, with slightly stronger activity detected during late September (figure 127). Small clusters of thermal activity were detected during mid-June, early July, early August, and late September. According to the MODVOLC thermal alert system, a total of four thermal hotspots were detected on 7 July and 3 and 23 September. This activity was also intermittently captured in infrared satellite imagery on clear weather days (figure 128).
Geologic Background. The glacier-covered Villarrica stratovolcano, in the northern Lakes District of central Chile, is ~15 km south of the city of Pucon. A 2-km-wide caldera that formed about 3,500 years ago is located at the base of the presently active, dominantly basaltic to basaltic andesite cone at the NW margin of a 6-km-wide Pleistocene caldera. More than 30 scoria cones and fissure vents are present on the flanks. Plinian eruptions and pyroclastic flows that have extended up to 20 km from the volcano were produced during the Holocene. Lava flows up to 18 km long have issued from summit and flank vents. Eruptions documented since 1558 CE have consisted largely of mild-to-moderate explosive activity with occasional lava effusion. Glaciers cover 40 km2 of the volcano, and lahars have damaged towns on its flanks.
Information Contacts: Servicio Nacional de Geología y Minería (SERNAGEOMIN), Observatorio Volcanológico de Los Andes del Sur (OVDAS), Avda Sta María No. 0104, Santiago, Chile (URL: http://www.sernageomin.cl/); Proyecto Observación Villarrica Internet (POVI) (URL: http://www.povi.cl/); Sistema y Servicio Nacional de Prevención y Repuesta Ante Desastres (SENAPRED), Av. Beauchef 1671, Santiago, Chile (URL: https://web.senapred.cl/); Buenos Aires Volcanic Ash Advisory Center (VAAC), Servicio Meteorológico Nacional-Fuerza Aérea Argentina, 25 de mayo 658, Buenos Aires, Argentina (URL: http://www.smn.gov.ar/vaac/buenosaires/inicio.php); MIROVA (Middle InfraRed Observation of Volcanic Activity), a collaborative project between the Universities of Turin and Florence (Italy) supported by the Centre for Volcanic Risk of the Italian Civil Protection Department (URL: http://www.mirovaweb.it/); Hawai'i Institute of Geophysics and Planetology (HIGP) - MODVOLC Thermal Alerts System, School of Ocean and Earth Science and Technology (SOEST), Univ. of Hawai'i, 2525 Correa Road, Honolulu, HI 96822, USA (URL: http://modis.higp.hawaii.edu/); Copernicus Browser, Copernicus Data Space Ecosystem, European Space Agency (URL: https://dataspace.copernicus.eu/browser/).
Merapi (Indonesia) — October 2023 Cite this Report
Merapi
Indonesia
7.54°S, 110.446°E; summit elev. 2910 m
All times are local (unless otherwise noted)
Frequent incandescent avalanches during April-September 2023
Merapi, located just north of the major city of Yogyakarta in central Java, Indonesia, has had activity within the last 20 years characterized by pyroclastic flows and lahars accompanying growth and collapse of the steep-sided active summit lava dome. The current eruption period began in late December 2020 and has more recently consisted of ash plumes, intermittent incandescent avalanches of material, and pyroclastic flows (BGVN 48:04). This report covers activity during April through September 2023, based on information from Balai Penyelidikan dan Pengembangan Teknologi Kebencanaan Geologi (BPPTKG), the Center for Research and Development of Geological Disaster Technology, a branch of PVMBG which specifically monitors Merapi. Additional information comes from the Pusat Vulkanologi dan Mitigasi Bencana Geologi (PVMBG, also known as Indonesian Center for Volcanology and Geological Hazard Mitigation, CVGHM), MAGMA Indonesia, the Darwin Volcanic Ash Advisory Centre (VAAC), and various satellite data.
Activity during April through September 2023 primarily consisted of incandescent avalanches of material that mainly affected the SW and W flanks and traveled as far as 2.3 km from the summit (table 25) and white gas-and-steam emissions that rose 10-1,000 m above the crater.
Table 25. Monthly summary of avalanches and avalanche distances recorded at Merapi during April through September 2023. The number of reported avalanches does not include instances where possible avalanches were heard but could not be visually confirmed as a result of inclement weather. Data courtesy of BPPTKG (April-September 2023 daily reports).
| Month |
Average number of avalanches per day |
Distance avalanches traveled (m) |
| Apr 2023 |
19 |
1,200-2,000 |
| May 2023 |
22 |
500-2,000 |
| Jun 2023 |
18 |
1,200-2,000 |
| Jul 2023 |
30 |
300-2,000 |
| Aug 2023 |
25 |
400-2,300 |
| Sep 2023 |
23 |
600-2,000 |
BPPTKG reported that during April and May white gas-and-steam emissions rose 10-750 m above the crater, incandescent avalanches descended 500-2,000 m on the SW and W flanks (figure 135). Cloudy weather often prevented clear views of the summit, and sometimes avalanches could not be confirmed. According to a webcam image, a pyroclastic flow was visible on 17 April at 0531. During the week of 28 April and 4 May a pyroclastic flow was reported on the SW flank, traveling up to 2.5 km. According to a drone overflight taken on 17 May the SW lava dome volume was an estimated 2,372,800 cubic meters and the dome in the main crater was an estimated 2,337,300 cubic meters.
During June and July similar activity persisted with white gas-and-steam emissions rising 10-350 m above the crater and frequent incandescent avalanches that traveled 300-2,000 m down the SW, W, and S flanks (figure 136). Based on an analysis of aerial photos taken on 24 June the volume of the SW lava dome was approximately 2.5 million cubic meters. A pyroclastic flow was observed on 5 July that traveled 2.7 km on the SW flank. According to the Darwin VAAC multiple minor ash plumes were identified in satellite images on 19 July that rose to 3.7 km altitude and drifted S and SW. During 22, 25, and 26 July a total of 17 avalanches descended as far as 1.8 km on the S flank.
Frequent white gas-and-steam emissions continued during August and September, rising 10-450 m above the crater. Incandescent avalanches mainly affected the SW and W flanks and traveled 400-2,300 m from the vent (figure 137). An aerial survey conducted on 10 August was analyzed and reported that estimates of the SW dome volume was 2,764,300 cubic meters and the dome in the main crater was 2,369,800 cubic meters.
Frequent and moderate-power thermal activity continued throughout the reporting period, according to a MIROVA (Middle InfraRed Observation of Volcanic Activity) analysis of MODIS satellite data (figure 138). There was an increase in the number of detected anomalies during mid-May. The MODVOLC thermal algorithm recorded a total of 47 thermal hotspots: six during April, nine during May, eight during June, 15 during July, four during August, and five during September. Some of this activity was captured in infrared satellite imagery on clear weather days, sometimes accompanied by incandescent material on the SW flank (figure 139).
Geologic Background. Merapi, one of Indonesia's most active volcanoes, lies in one of the world's most densely populated areas and dominates the landscape immediately north of the major city of Yogyakarta. It is the youngest and southernmost of a volcanic chain extending NNW to Ungaran volcano. Growth of Old Merapi during the Pleistocene ended with major edifice collapse perhaps about 2,000 years ago, leaving a large arcuate scarp cutting the eroded older Batulawang volcano. Subsequent growth of the steep-sided Young Merapi edifice, its upper part unvegetated due to frequent activity, began SW of the earlier collapse scarp. Pyroclastic flows and lahars accompanying growth and collapse of the steep-sided active summit lava dome have devastated cultivated lands on the western-to-southern flanks and caused many fatalities.
Information Contacts: Balai Penyelidikan dan Pengembangan Teknologi Kebencanaan Geologi (BPPTKG), Center for Research and Development of Geological Disaster Technology (URL: http://merapi.bgl.esdm.go.id/, Twitter: @BPPTKG); MAGMA Indonesia, Kementerian Energi dan Sumber Daya Mineral (URL: https://magma.esdm.go.id/v1); Pusat Vulkanologi dan Mitigasi Bencana Geologi (PVMBG, also known as Indonesian Center for Volcanology and Geological Hazard Mitigation, CVGHM), Jalan Diponegoro 57, Bandung 40122, Indonesia (URL: http://www.vsi.esdm.go.id/); Darwin Volcanic Ash Advisory Centre (VAAC), Bureau of Meteorology, Northern Territory Regional Office, PO Box 40050, Casuarina, NT 0811, Australia (URL: http://www.bom.gov.au/info/vaac/); MIROVA (Middle InfraRed Observation of Volcanic Activity), a collaborative project between the Universities of Turin and Florence (Italy) supported by the Centre for Volcanic Risk of the Italian Civil Protection Department (URL: http://www.mirovaweb.it/); Hawai'i Institute of Geophysics and Planetology (HIGP) - MODVOLC Thermal Alerts System, School of Ocean and Earth Science and Technology (SOEST), Univ. of Hawai'i, 2525 Correa Road, Honolulu, HI 96822, USA (URL: http://modis.higp.hawaii.edu/); Copernicus Browser, Copernicus Data Space Ecosystem, European Space Agency (URL: https://dataspace.copernicus.eu/browser/); Øystein Lund Andersen (URL: https://www.oysteinlundandersen.com/, https://twitter.com/oysteinvolcano).
Ebeko
Russia
50.686°N, 156.014°E; summit elev. 1103 m
All times are local (unless otherwise noted)
Moderate explosive activity with ash plumes continued during June-November 2023
Ebeko, located on the N end of Paramushir Island in Russia’s Kuril Islands just S of the Kamchatka Peninsula, consists of three summit craters along a SSW-NNE line at the northern end of a complex of five volcanic cones. Observed eruptions date back to the late 18th century and have been characterized as small-to-moderate explosions from the summit crater, accompanied by intense fumarolic activity. The current eruptive period began in June 2022, consisting of frequent explosions, ash plumes, and thermal activity (BGVN 47:10, 48:06). This report covers similar activity during June-November 2023, based on information from the Kamchatka Volcanic Eruptions Response Team (KVERT) and satellite data.
Moderate explosive activity continued during June-November 2023 (figures 50 and 51). According to visual data from Severo-Kurilsk, explosions sent ash 2-3.5 km above the summit (3-4.5 km altitude) during most days during June through mid-September. Activity after mid-September was slightly weaker, with ash usually reaching less than 2 km above the summit. According to KVERT the volcano in October and November was, with a few exceptions, either quiet or obscured by clouds that prevented satellite observations. KVERT issued Volcano Observatory Notices for Aviation (VONA) on 8 and 12 June, 13 and 22 July, 3 and 21 August, and 31 October warning of potential aviation hazards from ash plumes drifting 3-15 km from the volcano. Based on satellite data, KVERT reported a persistent thermal anomaly whenever weather clouds permitted viewing.
Geologic Background. The flat-topped summit of the central cone of Ebeko volcano, one of the most active in the Kuril Islands, occupies the northern end of Paramushir Island. Three summit craters located along a SSW-NNE line form Ebeko volcano proper, at the northern end of a complex of five volcanic cones. Blocky lava flows extend west from Ebeko and SE from the neighboring Nezametnyi cone. The eastern part of the southern crater contains strong solfataras and a large boiling spring. The central crater is filled by a lake about 20 m deep whose shores are lined with steaming solfataras; the northern crater lies across a narrow, low barrier from the central crater and contains a small, cold crescentic lake. Historical activity, recorded since the late-18th century, has been restricted to small-to-moderate explosive eruptions from the summit craters. Intense fumarolic activity occurs in the summit craters, on the outer flanks of the cone, and in lateral explosion craters.
Information Contacts: Kamchatka Volcanic Eruptions Response Team (KVERT), Far Eastern Branch, Russian Academy of Sciences, 9 Piip Blvd., Petropavlovsk-Kamchatsky, 683006, Russia (URL: http://www.kscnet.ru/ivs/kvert/).
Search Bulletin Archive by Publication Date
Select a month and year from the drop-downs and click "Show Issue" to have that issue displayed in this tab.
The default month and year is the latest issue available.
Bulletin of the Global Volcanism Network - Volume 43, Number 07 (July 2018)
Managing Editor: Edward Venzke
Aira (Japan)
Activity resumed in March 2017 and remained relatively low through the year
Ambae (Vanuatu)
Major explosions during March-April 2018 cause heavy ashfall on island; significant lahar damages to infrastructure
Ambrym (Vanuatu)
Benbow and Marum lava lake activity continues with steam and gas emissions through June 2018
Bezymianny (Russia)
Ongoing low-level thermal anomalies during January-June 2018
Cleveland (United States)
Ongoing episodes of lava effusion in the crater and explosions through July 2018
Copahue (Chile-Argentina)
Phreatic explosion in March; possible ash emissions June 2018
Kerinci (Indonesia)
Small ash plumes observed in August 2017, April 2018, and June 2018
Kilauea (United States)
Overflows of lava lake in Halema'uma'u crater; Pu'u 'O'o crater floor collapses 30 April 2018; inflation and increased seismicity
Kirishimayama (Japan)
No further activity from Shinmoedake after 27 June 2018
Merapi (Indonesia)
Lahar in October 2016; phreatic explosions May-June 2018
Aira
Japan
31.5772°N, 130.6589°E; summit elev. 1117 m
All times are local (unless otherwise noted)
Activity resumed in March 2017 and remained relatively low through the year
Aira caldera encompasses the northern half of Kagoshima Bay in Kyushu, Japan. During the Holocene activity has been focused at Sakurajima volcano along the southern rim of the caldera, and more recent activity has occurred at the Minamidake and Showa summit craters (figure 59). Minamidake crater has been persistently active since 1955, and activity at Showa crater resumed in 2006. Sakurajima is one of Japan's most active volcanoes and frequently deposits ash over the nearby Kagoshima city. This report covers activity that occurred through 2017 and is based on reports issued by the Japan Meteorological Agency (JMA).
Typical activity largely consists of Vulcanian explosions that produce ash plumes and small pyroclastic flows. Prior to a decrease in activity in August 2016, the volcano typically produced tens of explosions per month. The last recorded explosion in 2016 was a low-level ash plume on 22 August at 1.2 km altitude, reported by the Tokyo Volcanic Ash Advisory Center (VAAC). Sakurajima has remained on Activity Alert Level 3 (do not approach) on an alert level scale of 1 (little to no activity) to 5 (eruption or imminent eruption causing significant damage to residential areas).
Activity has been low since August 2016. No eruptions were observed through January and February 2017, and both seismicity and SO2 emission levels remained low.
Eruptive activity resumed on 25 March 2017 at 1803 local time, when the Minamidake crater produced an ash plume to 500 m above the crater and a pyroclastic flow travelled approximately 1,100 m to the south (figure 60). Several additional small ash emission events were noted after this event.
Showa crater resumed activity at 0511 on 26 April 2017; 19 more events occurred through the month, including two larger explosive events. One explosive event produced an ash plume to 3,200 m above the crater on 28 April at 1101 local time. Two events occurred at the Minamidake crater through April.
Activity continued at the Showa crater in May, with 47 ash emission events, with nine of these being explosive events. One event on 2 May produced a 4,000-m-high plume that deposited ash on nearby communities (figure 61). Several larger explosions ejected blocks out to 500-800 m from the Showa crater. Activity continued at Minamidake crater, with ash reaching 2,500 m above the crater during an event on 5 May.
Through June, the Showa crater produced 14 events, including two explosive events. An explosion on 6 June produced an ash plume up to 3,200 m above the crater and blocks were deposited out to 800 m from the crater. One small event occurred at Minamidake. Activity was reduced in July, with seven events at Showa crater and none at Minamidake.
During August no events took place at Minamidake. However, Showa crater remained active with 98 events, including 20 that were explosive. Activity through September was similar with no activity in Minamidake crater and 170 events at Showa, including 38 explosive events.
Activity declined again from October through December. During October there were 37 events from Showa crater, with five being explosive (figure 62). One event at Minamidake crater on 31 October produced an ash plume up to 1,000 m above the crater. During November, five events occurred at Minamidake crater, and one at Showa crater that produced an ash plume to 1,300 m above the crater. In December, one event occurred at the Showa crater and Minamidake produced one small event.
Geologic Background. The Aira caldera in the northern half of Kagoshima Bay contains the post-caldera Sakurajima volcano, one of Japan's most active. Eruption of the voluminous Ito pyroclastic flow accompanied formation of the 17 x 23 km caldera about 22,000 years ago. The smaller Wakamiko caldera was formed during the early Holocene in the NE corner of the caldera, along with several post-caldera cones. The construction of Sakurajima began about 13,000 years ago on the southern rim and built an island that was joined to the Osumi Peninsula during the major explosive and effusive eruption of 1914. Activity at the Kitadake summit cone ended about 4,850 years ago, after which eruptions took place at Minamidake. Frequent eruptions since the 8th century have deposited ash on the city of Kagoshima, located across Kagoshima Bay only 8 km from the summit. The largest recorded eruption took place during 1471-76.
Information Contacts: Tokyo Volcanic Ash Advisory Center (VAAC), 1-3-4 Otemachi, Chiyoda-ku, Tokyo, Japan (URL: http://ds.data.jma.go.jp/svd/vaac/data/); Japan Meteorological Agency (JMA), Otemachi, 1-3-4, Chiyoda-ku Tokyo 100-8122, Japan (URL: http://www.jma.go.jp/jma/indexe.html); Sentinel Hub Playground (URL: https://www.sentinel-hub.com/explore/sentinel-playground).
Ambae
Vanuatu
15.389°S, 167.835°E; summit elev. 1496 m
All times are local (unless otherwise noted)
Major explosions during March-April 2018 cause heavy ashfall on island; significant lahar damages to infrastructure
Ambae (Aoba) is a large basaltic shield volcano in the New Hebrides arc that has generated periodic phreatic and pyroclastic explosions originating in the summit crater lakes Manaro Lakua and Voui during the last 25 years; the central edifice with the active summit craters is often referred to as Manaro Voui. A pyroclastic cone appeared in Lake Voui during November 2005-February 2006 (figure 30, BGVN 31:12). The volcano remained mostly quiet until an explosive eruption from a new pyroclastic cone in the lake began in mid-September 2017 and lasted through mid-November (BGVN 43:02). Activity included high-altitude ash emissions (9.1 km), lava flows, and Strombolian activity. After a quieter December, ash emissions resumed during January-April 2018. This report summarizes activity from January to June 2018, with information provided by the Vanuatu Geohazards Observatory of the Vanuatu Meteorology and Geo-Hazards Department (VMGD), the Wellington Volcanic Ash Advisory Center (VAAC), satellite data from several sources, and social media photographs.
Ongoing steam and intermittent ash emissions were observed during January and February 2018; incandescent ejecta continued from the pyroclastic cone at the summit. An increase in the frequency and volume of ash emissions in March led VMGD to raise the Alert Level to 3 (on a 0-5 level scale) by the middle of the month. Ash plume heights ranged from 3-5 km altitude. Heavy rains on 30 March caused a large lahar that significantly damaged a village on the N side of the island. A high-altitude plume on 31 March was measured at 13.7 km altitude. Significant ashfall around the island caused infrastructure damage and health hazards to humans, livestock, and plants. An explosion in early April produced another high-altitude ash plume observed in satellite imagery at 12.2 km altitude and one of the largest SO2 plumes measured in several years. A major ash plume on 11 April rose to 9.1 km altitude and enveloped much of the island in ash-laden meteoric clouds. The pyroclastic cone growing in Lake Voui had bisected the lake by March, and continued to fill it in. By late May, only two remnants of the lake remained, and a nearby smaller lake was dry. A low-level ash emission in late June signaled the beginning of a new, larger eruptive episode that began on 1 July 2018.
Activity during January-February 2018. The Wellington VAAC reported an ash plume at Ambae on 2 January 2018 drifting E at 3.1 km altitude that dissipated after a few hours. A plume on 8 January estimated at the same altitude resulted in reports of ashfall on the N and NE areas of the island; meteoric clouds prevented observations of the plume. Ongoing steam emissions were reported for the rest of January. On 7 February a continuous ash plume was observed in satellite data at 2.7 km altitude moving N. The following day, it was visible spreading E from the summit. A pilot confirmed observation of the plume continuing to spread to the E at 3.1 km altitude late on 8 February. Another low-level emission on 10 February extended NE at 2.1 km for a few hours. An ash plume on 13 February was clearly visible drifting N in satellite imagery; its altitude was estimated at 3.1 km.
A larger eruption on 16 February generated an ash plume that rose to 4.6 km altitude and initially drifted NE. Continuous ash emission extended as high as 5.5 km through 17 February and drifted SE and then S. By the next day, the constant emissions were still visible in satellite imagery, estimated at 4.6 km altitude; the main plume was drifting E with a remnant moving to the SW, finally dissipating on 19 February (figure 54). Ash emissions were visible in infrared imagery at about 3.9 km altitude on 23 February. Ongoing explosions were observed in the webcam on 23 and 24 February; ash was visible in satellite imagery until the end of the day on 24 February. A brief explosion observed in the webcam around sunrise on 27 February generated a small ash plume that rose to 3.1 km altitude and drifted SE. Moderate sulfur dioxide emissions were recorded a number of times during January and February (figure 55).
Activity during March 2018. The frequency and volume of ash emissions increased significantly during March 2018. Ash plumes were visible in satellite imagery during 3-6 March 2018. The initial plume rose to 3.7 km altitude and drifted NE, rising to 3.9 on 4 March and drifting N. The following day plumes rose to 4.6 km. By 6 March the plume was lower, drifting NW at 2.4 km altitude. A series of continuous low-level ash emissions were visible in satellite and webcam imagery every day from 11-19 March (figure 56). They initially drifted SE and SW and then moved to the W on 15 March at altitudes of generally 2.4-3.1 km, occasionally higher. The plumes drifted N and W during 17-19 March. This increase in ash emissions affecting local villages led VMGD to raise the alert level from 2 to 3 on 18 March 2018. They noted that activity was similar to the previous October but with more sustained ash emissions.
Local observers reported an explosion on 21 March that rose to 3.4 km altitude and drifted SW (figures 57-59). Continuous emissions through the end of the month were discernible in either satellite imagery or the webcam each day. Plume altitudes ranged from 3.1 to 4.9 km altitude, drifting in several directions. Significant ashfall began affecting local villages, destroying crops and livestock, and collapsing structures during the second half of March.
Local news reports on 25 March noted that ejecta from the previous evening was visible over 70 km away to the SW by residents on Espiritu Santo Island, and small amounts of ash fell on Pentecost Island, 60 km SE (figure 60). According to the Vanuatu Independent, Virgin Australia cancelled flights to Vanuatu on 25 March. The New Zealand Defence Force did an aerial survey on 26 March and observed a large ash plume rising several kilometers (figure 61). Radio New Zealand reported on 30 March that large amounts of ashfall and acid rain had damaged crops, water supplies and buildings on Ambae (figures 62). A New Zealand GNS Science volcanologist reported that gardens were covered by ash and limbs on trees were broken. Some of the roofs over buildings and water supplies had collapsed due to the weight of the volcanic ash. Heavy ashfall in the S and NW parts of the island at the end of the month resulted in evacuations of several villages in the affected areas.
The village of Waluebue on the N side of Ambae was badly damaged by a lahar during the night of 30-31 March. Homes and churches were destroyed from the mud and large boulders in the debris flow. All residents were safely evacuated (figures 63-67).
A new series of high-altitude ash emissions were reported by the Washington VAAC beginning on 30 March (figure 68). Early reports from satellite images and webcams indicated an ash plume at 6.1 km altitude. This was followed within the hour of confirmation from satellite imagery of the plume at 13.7 km altitude moving NW. By the following morning, two plumes were visible, one drifting S at 6.1 km and a second drifting NW at 13.7 km altitude. Meteoric clouds prevented observations later that day, but by 1 April, intermittent explosions were producing plumes moving E at an estimated altitude of 3.0 km, and SE estimated at 6.1 km altitude.
Activity during April-June 2018. New eruptions occurred overnight during 5-6 April 2018 that generated an ash plume and a large distinct SO2 plume. Meteoric clouds and darkness prevented observation of the ash plume, but the SO2 signal was clearly visible on false-color satellite imagery. The plume initially rose to 7.3 km altitude and drifted W; a few hours later, it rose to 12.2 km. With a Dobson Unit measurement of 52.55 units, it was one of the strongest SO2 plumes measured on the planet since 2015, according to Simon Carn of Michigan Technological University (figure 69). An ongoing eruption was visible in the webcam on 6 April, but meteoric clouds again prevented observation in satellite data. A cluster of lightning strikes was detected by the World Wide Lightning Location Network (WWLLN) around the reported time of the eruption, according to Simon Carn. Intermittent low-level ash emissions were confirmed in the webcam on 8 April, estimated to be moving NE and E at 3.0-4.9 km altitude.
Ash from a continuous low-level eruption during 9-10 April 2018 was clearly visible in the webcam and partly visible in satellite imagery drifting E and NE at 4.3-4.9 km altitude. The SO2 plume from the eruption stretched across most of the South Pacific (figure 70). Ashfall from the plume spread across a large area of the island causing substantial damage in local communities (figures 71 and 72).
The ash plume height increased significantly on 11 April to 9.1 km altitude and drifted SE according to the Wellington VAAC. Planet Lab images showed the plume covering the N half of the island a short time later (figure 73). The following day, the plume altitude gradually lowered from 4.6 to 1.8 km and drifted N, then NW. Local communities reported intermittent low-level ash emissions and localized ashfall late on 12 April; this was the last report of ash emissions for April. Thick meteoric and ash clouds enveloped much of the island as seen in social media video on 12 April.
According to the Vanuatu Daily Post on 16 April 2018, the Council of Ministers for Vanuatu declared their intent to seek help from International Relief Organizations to evacuate the island's population after the latest episodes of extensive ashfall destroyed much of the infrastructure. Photographs from an overflight by VGMD on 21 April 2018 showed the increased size of the pyroclastic cone inside Lake Voui dividing the lake into two segments, one nearly consumed by the cone (figure 74). They reported small eruptions on 23 and 27 April; these were the last ash emissions until the end of June 2018.
The thermal activity recorded by the MODVOLC and MIROVA systems corresponded with the observations of explosions and ash emissions. There were MODVOLC thermal alerts issued each month from January through 10 April 2018, with strong, multi-alert periods in February and March; these data were similar to the MIROVA signal for the period, which also showed increased activity during the same time (figure 75).
By the end of May 2018, Manaro Ngoru, the small water body on the W side of the summit was dry; Lake Voui, divided into two segments by the pyroclastic cone, had a small amount of orange-brown water in the W half, and muddy brown water in the E half (figures 76 and 77). Steam plumes rose continuously from the cone, but no ash emissions were observed.
VMGB issued a volcano alert on 7 June 2018, announcing that they had lowered the Alert Level from 3 to 2, due to the reduced activity at Ambae during late April and May. Radio New Zealand reported that on 9 June, the Vanuatu government announced plans to move its Penama Province capital due to the ongoing eruption. The Penama Council agreed to relocate its headquarters from Saatamaa in Eastern Ambae to Loltong in North Pentacost. The Penama Province is one of six in Vanuatu and includes the three islands of Ambae, Maewo, and Pentecost.
The Wellington VAAC issued an ash advisory from a low-level ash emission on 21 June 2018. It was clearly visible in satellite imagery, and rose to 3 km altitude, drifting SE. That was the last activity reported until a large new ash plume was recorded in the webcam on 1 July 2018.
Geologic Background. The island of Ambae, also known as Aoba, is a massive 2,500 km3 basaltic shield that is the most voluminous volcano of the New Hebrides archipelago. A pronounced NE-SW-trending rift zone with numerous scoria cones gives the 16 x 38 km island an elongated form. A broad pyroclastic cone containing three crater lakes (Manaro Ngoru, Voui, and Manaro Lakua) is located at the summit within the youngest of at least two nested calderas, the largest of which is 6 km in diameter. That large central edifice is also called Manaro Voui or Lombenben volcano. Post-caldera explosive eruptions formed the summit craters about 360 years ago. A tuff cone was constructed within Lake Voui (or Vui) about 60 years later. The latest known flank eruption, about 300 years ago, destroyed the population of the Nduindui area near the western coast.
Information Contacts: Geo-Hazards Division, Vanuatu Meteorology and Geo-Hazards Department (VMGD), Ministry of Climate Change Adaptation, Meteorology, Geo-Hazards, Energy, Environment and Disaster Management, Private Mail Bag 9054, Lini Highway, Port Vila, Vanuatu (URL: http://www.vmgd.gov.vu/, https://www.facebook.com/VanuatuGeohazardsObservatory/); Wellington Volcanic Ash Advisory Centre (VAAC), Meteorological Service of New Zealand Ltd (MetService), PO Box 722, Wellington, New Zealand (URL: http://www.metservice.com/vaac/, http://www.ssd.noaa.gov/VAAC/OTH/NZ/messages.html); NASA Goddard Space Flight Center (NASA/GSFC), Global Sulfur Dioxide Monitoring Page, Atmospheric Chemistry and Dynamics Laboratory, 8800 Greenbelt Road, Goddard, Maryland, USA (URL: https://so2.gsfc.nasa.gov/); European Space Agency (ESA), Copernicus (URL: http://www.esa.int/Our_Activities/Observing_the_Earth/Copernicus; MIROVA (Middle InfraRed Observation of Volcanic Activity), a collaborative project between the Universities of Turin and Florence (Italy) supported by the Centre for Volcanic Risk of the Italian Civil Protection Department (URL: http://www.mirovaweb.it/); Hawai'i Institute of Geophysics and Planetology (HIGP) - MODVOLC Thermal Alerts System, School of Ocean and Earth Science and Technology (SOEST), Univ. of Hawai'i, 2525 Correa Road, Honolulu, HI 96822, USA (URL: http://modis.higp.hawaii.edu/); New Zealand Defence Force (NZDF), Wellington, New Zealand (URL: http://www.nzdf.mil.nz/, Twitter: @NZDefenceForce); Vanuatu Daily Post (URL: http://dailypost.vu/news/flash-appeal/article_7c929c1e-dda3-5eab-925b-c814e04eeacb.html); Dan McGarry, Vanuatu Daily Post (Twitter: @dailypostdan); Vanuatu Independent News Magazine, Port Vila, Vanuatu (URL: https://vanuatuindependent.com/2018/03/26/flight-cancelled-due-to-volcanic-ash/); Simon Carn, Dept of Geological and Mining Engineering and Sciences, Michigan Technological University, 1400 Townsend Dr., Houghton, MI 49931, USA (URL: http://www.volcarno.com/, http://so2.umbc.edu/omi/); Radio New Zealand, 155 The Terrace, Wellington 6011, New Zealand (URL: https://www.radionz.co.nz/international/pacific-news/359231/vanuatu-provincial-capital-moves-due-to-volcano); Bani Philipson, Observatoire de Physique du Globe de Clermont-Ferrand (OPGC) and Institut de Recherche pour le Developpement (IRD), Laboratoire Magmas et Volcans (LMV), University Campus of Cézeaux, 6 Blaise Pascal Avenue, TSA 60026 - CS 60026, 63178 AUBIERE Cedex, France (URL: http://lmv.univ-bpclermont.fr/bani-philipson/, Twitter: @philipsonbani); David Sarginson (Facebook: URL: https://www.facebook.com/david.sarginson.16); Clifford Tarisimbi (Facebook: https://www.facebook.com/profile.php?id=100009930510696); Wilfred Woodrow (Facebook: https://www.facebook.com/groups/558036627684741/permalink/974980079323725); Planet Labs Inc. (URL: http://www.planet.com/).
Ambrym
Vanuatu
16.25°S, 168.12°E; summit elev. 1334 m
All times are local (unless otherwise noted)
Benbow and Marum lava lake activity continues with steam and gas emissions through June 2018
Ambrym volcano, located in Vanuatu along the New Hebrides Island Arc, consists of a large 12-km-diameter caldera with two active craters, Marum and Benbow. Historical activity has occurred at summit and flank vents, producing moderate explosive eruptions and lava flows that reach the coast. Historically important eruptions date back two centuries, including extra-caldera W-flank lava flows that caused destruction in coastal areas in 1820, 1894, 1913, and 1929. Since then, there have not been extra-caldera lava eruptions, although the areas around Marum and Benbow craters remain hazardous. The Vanuatu Meteorology and Geo-Hazards Department (VMGD) located in Port Vila, Vanuatu, is responsible for monitoring ongoing activity at Ambrym.
During January through June 2018, volcanic activity was confined to the eruptive vents of Benbow and Marum craters, including ongoing lava lake activity inside the active vents, substantial degassing, and emission of steam clouds. The Volcanic Alert Level remained at Level 2 on a scale from 0 to 5 with five being the highest (figure 30). At Level 2 ('Major Unrest') the danger is restricted to the active craters and the Permanent Exclusion Zones, which are located within a 1 km radius around Benbow crater and about a 2.7 km radius around Marum crater (figure 38).
VMGD reported that the lava lakes in Benbow and Marum craters continued to be active and produced gas and steam emissions on 30 January, 19 March, and 25 April 2018. More sustained and substantial emissions were reported on 7 June.
During the reporting period, numerous thermal anomalies were detected by the MODIS satellite instruments and subsequently analyzed using the MODVOLC algorithm, possibly reflecting lava lake activity in Benbow and Marum craters (figures 39 and 40). The MIROVA (Middle InfraRed Observation of Volcanic Activity) system also detected numerous hotspots almost every day (figure 41).
Geologic Background. Ambrym, a large basaltic volcano with a 12-km-wide caldera, is one of the most active volcanoes of the New Hebrides Arc. A thick, almost exclusively pyroclastic sequence, initially dacitic then basaltic, overlies lava flows of a pre-caldera shield volcano. The caldera was formed during a major Plinian eruption with dacitic pyroclastic flows about 1,900 years ago. Post-caldera eruptions, primarily from Marum and Benbow cones, have partially filled the caldera floor and produced lava flows that ponded on the floor or overflowed through gaps in the caldera rim. Post-caldera eruptions have also formed a series of scoria cones and maars along a fissure system oriented ENE-WSW. Eruptions have apparently occurred almost yearly during historical time from cones within the caldera or from flank vents. However, from 1850 to 1950, reporting was mostly limited to extra-caldera eruptions that would have affected local populations.
Information Contacts: Geo-Hazards Division, Vanuatu Meteorology and Geo-Hazards Department (VMGD), Ministry of Climate Change Adaptation, Meteorology, Geo-Hazards, Energy, Environment and Disaster Management, Private Mail Bag 9054, Lini Highway, Port Vila, Vanuatu (URL: http://www.vmgd.gov.vu/, https://www.facebook.com/VanuatuGeohazardsObservatory/); Hawai'i Institute of Geophysics and Planetology (HIGP) - MODVOLC Thermal Alerts System, School of Ocean and Earth Science and Technology (SOEST), Univ. of Hawai'i, 2525 Correa Road, Honolulu, HI 96822, USA (URL: http://modis.higp.hawaii.edu/); MIROVA (Middle InfraRed Observation of Volcanic Activity), a collaborative project between the Universities of Turin and Florence (Italy) supported by the Centre for Volcanic Risk of the Italian Civil Protection Department (URL: http://www.mirovaweb.it/).
Bezymianny
Russia
55.972°N, 160.595°E; summit elev. 2882 m
All times are local (unless otherwise noted)
Ongoing low-level thermal anomalies during January-June 2018
Activity at Bezymianny has been frequent over the past 60 years, and almost continuous since May 2010. The Kamchatka Volcanic Eruptions Response Team (KVERT) reported that ash plumes from the 20 December 2017 explosive eruption (BGVN 43:01) rose as high as 15 km and drifted 320 km NE (figure 24). On 29 December activity included moderate gas-and-steam emissions; a lava flow likely continued to effuse onto the N flank of the lava dome. A thermal anomaly over the volcano was identified in satellite images in late December 2017.
KVERT reported on 5 April 2018 that moderate gas-and-steam activity was continuing. Satellite data showed a thermal anomaly over the volcano on 29-30 March and 2-3 April, but the volcano was obscured by clouds in the other days of week. Fumarolic plumes were also seen on 13 April (figure 25). No MODVOLC thermal alerts were measured during the first half of 2018, and MIROVA analysis shows only low level radiative power anomalies for the same period (figure 26).
Geologic Background. The modern Bezymianny, much smaller than its massive neighbors Kamen and Kliuchevskoi on the Kamchatka Peninsula, was formed about 4,700 years ago over a late-Pleistocene lava-dome complex and an edifice built about 11,000-7,000 years ago. Three periods of intensified activity have occurred during the past 3,000 years. The latest period, which was preceded by a 1,000-year quiescence, began with the dramatic 1955-56 eruption. This eruption, similar to that of St. Helens in 1980, produced a large open crater that was formed by collapse of the summit and an associated lateral blast. Subsequent episodic but ongoing lava-dome growth, accompanied by intermittent explosive activity and pyroclastic flows, has largely filled the 1956 crater.
Information Contacts: Kamchatka Volcanic Eruptions Response Team (KVERT), Far Eastern Branch, Russian Academy of Sciences, 9 Piip Blvd., Petropavlovsk-Kamchatsky, 683006, Russia (URL: http://www.kscnet.ru/ivs/kvert/); Institute of Volcanology and Seismology, Far Eastern Branch, Russian Academy of Sciences (IVS FEB RAS), 9 Piip Blvd., Petropavlovsk-Kamchatsky 683006, Russia (URL: http://www.kscnet.ru/ivs/eng/); Hawai'i Institute of Geophysics and Planetology (HIGP) - MODVOLC Thermal Alerts System, School of Ocean and Earth Science and Technology (SOEST), Univ. of Hawai'i, 2525 Correa Road, Honolulu, HI 96822, USA (URL: http://modis.higp.hawaii.edu/); MIROVA (Middle InfraRed Observation of Volcanic Activity), a collaborative project between the Universities of Turin and Florence (Italy) supported by the Centre for Volcanic Risk of the Italian Civil Protection Department (URL: http://www.mirovaweb.it/).
Cleveland (United States) — July 2018 Cite this Report
Cleveland
United States
52.825°N, 169.944°W; summit elev. 1730 m
All times are local (unless otherwise noted)
Ongoing episodes of lava effusion in the crater and explosions through July 2018
Cleveland, at the western end of the isolated Chuginadak Island in the Aleutian Islands, is characterized by frequent small explosions that are monitored using local seismic and infrasound sensors, and by elevated surface temperatures that are monitored by satellite-based infrared sensors. The current eruptive period began in April 2016 and has continued through at least July 2018. The Alaska Volcano Observatory (AVO) is responsible for monitoring, and issues regular reports describing activity.
Small explosions in mid-December 2017 were followed by elevated surface temperatures later in the month and a lava flow in the summit crater that began effusing on 5 January 2018 (table 9). Thermal anomalies and other signs of unrest continued through 24 February, when a small explosion was detected. Another explosion was reported on 2 March with a plume rising to 4.6 km altitude and drifting ENE. Satellite data continued to identify elevated temperatures in early March. Small explosions were identified using seismic and infrasound data on 14 March and 4 April. The ash cloud on 4 April rose to 4.6 km altitude and drifted SW; hot material was ejected onto the W flank.
Thermal anomalies were ongoing in June. A small circular lava flow (~80 m in diameter) in the summit crater was reported on 25 June; a thermal anomaly noted during 29 June-2 July extending SW downslope within the crater was consistent with a lava flow, according to AVO. Weakly elevated surface temperatures were reported on many days during 7-23 July, along with some small steam plumes (figure 25). A small deposit of blocks, within the summit crater and just below the E crater rim, seen using satellite imagery during 18-23 July suggested to AVO that there had been a very small explosion not recorded using seismic or pressure sensor monitors.
Table 9. Observations of dome growth and other crater activity at Cleveland, December 2017-July 2018. Note that the absence of observable activity from satellites is often due to cloud cover. Data courtesy of Alaska Volcano Observatory (AVO).
| Date |
Observation |
| 13 Dec 2017 |
Small explosion (0420); plume rising to 6.1 km and drifting E |
| 17 Dec 2017 |
Small explosion (1817) |
| 27 Dec-01 Jan 2018 |
Elevated surface temperatures |
| 19 Jan 2018 |
New lava flow within summit crater since 5 January |
| 19-22 Jan 2018 |
Elevated surface temperatures |
| 24-30 Jan 2018 |
Unrest; possible cold vapor plume drifted S on 24 Jan; some slightly elevated surface temperatures during 26-30 Jan |
| 31 Jan-06 Feb 2018 |
Unrest, moderately elevated surface temperatures |
| 07-13 Feb 2018 |
Low-level unrest |
| 14-20 Feb 2018 |
Low-level unrest; thermal anomalies during 15-17 Feb |
| 24 Feb 2018 |
Small explosion (2154); several hours later satellite showed moderately elevated surface temperatures extending ~2 km from summit |
| 28 Feb-03 Mar 2018 |
Elevated surface temperatures |
| 02 Mar 2018 |
Small explosion (0557); plume rose to 4.6 km, drifted ENE |
| 07 Mar 2018 |
Elevated surface temperatures on satellite images |
| 08 Mar 2018 |
Seismicity slightly increased |
| 14 Mar 2018 |
Small explosion in seismic and infrasound (2219), no visible ash plume |
| 04 Apr 2018 |
Small explosion in seismic and infrasound (0355), hot material ejected on W flank and small ash cloud to 4.6 km drift SW |
| 04 Apr 2018 |
Small, short-duration seismic event (~0600) coupled with small ash emission |
| 13 Apr 2018 |
Small explosion (0759) in seismic and infrasound |
| 04 May 2018 |
Small explosion (2149) in seismic and infrasound; small ash cloud to 6.7 km, drift SE |
| 6-12 Jun 2018 |
Elevated surface temperatures |
| 11-12 Jun 2018 |
Steam emissions |
| 13-19 Jun 2018 |
Elevated surface temperatures |
| 25 Jun 2018 |
Small, circular lava flow (~80 m in diameter) in summit crater |
| 29 Jun-02 Jul 2018 |
Elevated surface temperatures; thermal anomaly extended SW |
| 07, 09-10 Jul 2018 |
Weakly elevated surface temperatures; small steam cloud on 7 July |
| 11 Jul 2018 |
Weakly elevated surface temperatures |
| 18-23 Jul 2018 |
Weakly elevated surface temperatures; small deposit of blocks within the summit crater and just below the E crater rim |
Geologic Background. The beautifully symmetrical Mount Cleveland stratovolcano is situated at the western end of the uninhabited Chuginadak Island. It lies SE across Carlisle Pass strait from Carlisle volcano and NE across Chuginadak Pass strait from Herbert volcano. Joined to the rest of Chuginadak Island by a low isthmus, Cleveland is the highest of the Islands of the Four Mountains group and is one of the most active of the Aleutian Islands. The native name, Chuginadak, refers to the Aleut goddess of fire, who was thought to reside on the volcano. Numerous large lava flows descend the steep-sided flanks. It is possible that some 18th-to-19th century eruptions attributed to Carlisle should be ascribed to Cleveland (Miller et al., 1998). In 1944 it produced the only known fatality from an Aleutian eruption. Recent eruptions have been characterized by short-lived explosive ash emissions, at times accompanied by lava fountaining and lava flows down the flanks.
Information Contacts: Alaska Volcano Observatory (AVO), a cooperative program of a) U.S. Geological Survey, 4200 University Drive, Anchorage, AK 99508-4667 USA (URL: https://avo.alaska.edu/), b) Geophysical Institute, University of Alaska, PO Box 757320, Fairbanks, AK 99775-7320, USA, and c) Alaska Division of Geological & Geophysical Surveys, 794 University Ave., Suite 200, Fairbanks, AK 99709, USA (URL: http://www.dggs.alaska.gov/); Anchorage Volcanic Ash Advisory Center (VAAC), Alaska Aviation Weather Unit, NWS NOAA US Dept of Commerce, 6930 Sand Lake Road, Anchorage, AK 99502-1845 USA (URL: http://vaac.arh.noaa.gov/).
Copahue (Chile-Argentina) — July 2018 Cite this Report
Copahue
Chile-Argentina
37.856°S, 71.183°W; summit elev. 2953 m
All times are local (unless otherwise noted)
Phreatic explosion in March; possible ash emissions June 2018
The most recent activity from Copahue originates in the El Agrio crater, which has permanent fumarolic activity and an acidic lake. During 2017, ash emissions began in early June, but decreased after July, although tremor and degassing with occasional ash continued for the remainder of the year (BGVN 43:01). The volcano is monitored by the Servicio Nacional de Geología y Minería (SERNAGEOMIN). This report discusses activity during January-June 2018.
According to the Oficina Nacional de Emergencia-Ministerio del Interior (ONEMI), SERNAGEOMIN reported that a hydrothermal explosion was recorded on 24 March 2018, along with increased tremor. The Alert Level was raised to Yellow (second highest level on a four-color scale); SERNAGEOMIN recommended no entry into a restricted area within 1 km of the crater. ONEMI maintained its own Alert Level of Yellow (the middle level on a three-color scale) for the municipality of Alto Biobío (25 km SW).
Based on SERNAGEOMIN information, ONEMI reported that during 1-31 March 2018 there were 83 volcano-tectonic events recorded and 204 earthquakes indicting fluid movement. Tremor levels increased on 24 March, the same day as a phreatic explosion, though by the next day it had decreased to baseline levels. Webcams recorded gas plumes rising from El Agrio crater as high as 1 km. During an overflight on 3 April, scientists observed continuous white gas plumes rising almost 400 m.
The Buenos Aires Volcanic Ash Advisory Center (VAAC) reported that on 24 June diffuse steam emissions possibly containing ash were visible in webcam views rising to an altitude of 3.6 km.
Geologic Background. Volcán Copahue is an elongated composite cone constructed along the Chile-Argentina border within the 6.5 x 8.5 km wide Trapa-Trapa caldera that formed between 0.6 and 0.4 million years ago near the NW margin of the 20 x 15 km Pliocene Caviahue (Del Agrio) caldera. The eastern summit crater, part of a 2-km-long, ENE-WSW line of nine craters, contains a briny, acidic 300-m-wide crater lake (also referred to as El Agrio or Del Agrio) and displays intense fumarolic activity. Acidic hot springs occur below the eastern outlet of the crater lake, contributing to the acidity of the Río Agrio, and another geothermal zone is located within Caviahue caldera about 7 km NE of the summit. Infrequent mild-to-moderate explosive eruptions have been recorded since the 18th century. Twentieth-century eruptions from the crater lake have ejected pyroclastic rocks and chilled liquid sulfur fragments.
Information Contacts: Oficina Nacional de Emergencia - Ministerio del Interior (ONEMI), Beaucheff 1637/1671, Santiago, Chile (URL: http://www.onemi.cl/); Servicio Nacional de Geología y Minería (SERNAGEOMIN), Observatorio Volcanológico de Los Andes del Sur (OVDAS), Avda Sta María No. 0104, Santiago, Chile (URL: http://www.sernageomin.cl/); Buenos Aires Volcanic Ash Advisory Center (VAAC), Servicio Meteorológico Nacional-Fuerza Aérea Argentina, 25 de mayo 658, Buenos Aires, Argentina (URL: http://www.smn.gov.ar/vaac/buenosaires/inicio.php).
Kerinci
Indonesia
1.697°S, 101.264°E; summit elev. 3800 m
All times are local (unless otherwise noted)
Small ash plumes observed in August 2017, April 2018, and June 2018
Kerinci has produced intermittent ash explosions in recent years, including December 2011, June 2013, March-June 2016, and November 2016 (BGVN 42:04). The Darwin Volcanic Ash Advisory Centre (VAAC) has issued the only reports on activity between December 2016 and July 2018, and these have been based on satellite data. The Indonesia volcano monitoring agency, Pusat Vulkanologi dan Mitigasi Bencana Geologi (PVMBG, also known as Indonesian Center for Volcanology and Geological Hazard Mitigation, CVGHM), has kept the Alert Level at 2 (on a scale of 1-4) since 9 September 2007.
According to the Darwin VAAC, on 13 August 2017, an ash plume rose to an altitude of 4.3 km and drifted WSW.
Sentinel-2 satellite imagery showed what appeared to be a small ash plume rising from the crater on 21 April 2018 (figure 4). The Darwin VAAC also reported that on 5 June 2018 a minor ash emission rose to an altitude of 4.3 km and drifted W (figure 5). On 10 June an ash plume rose to an altitude of 4 km and drifted W.
During the reporting period, no significant sulfur dioxide levels near the volcano were recorded by NASA's satellite-borne ozone instruments, and no thermal anomalies were detected.
Geologic Background. Gunung Kerinci in central Sumatra forms Indonesia's highest volcano and is one of the most active in Sumatra. It is capped by an unvegetated young summit cone that was constructed NE of an older crater remnant. There is a deep 600-m-wide summit crater often partially filled by a small crater lake that lies on the NE crater floor, opposite the SW-rim summit. The massive 13 x 25 km wide volcano towers 2400-3300 m above surrounding plains and is elongated in a N-S direction. Frequently active, Kerinci has been the source of numerous moderate explosive eruptions since its first recorded eruption in 1838.
Information Contacts: Darwin Volcanic Ash Advisory Centre (VAAC), Bureau of Meteorology, Northern Territory Regional Office, PO Box 40050, Casuarina, NT 0811, Australia (URL: http://www.bom.gov.au/info/vaac/); Pusat Vulkanologi dan Mitigasi Bencana Geologi (PVMBG, also known as Indonesian Center for Volcanology and Geological Hazard Mitigation, CVGHM), Jalan Diponegoro 57, Bandung 40122, Indonesia (URL: http://www.vsi.esdm.go.id/); Sentinel Hub Playground (URL: https://www.sentinel-hub.com/explore/sentinel-playground); Hawai'i Institute of Geophysics and Planetology (HIGP) - MODVOLC Thermal Alerts System, School of Ocean and Earth Science and Technology (SOEST), Univ. of Hawai'i, 2525 Correa Road, Honolulu, HI 96822, USA (URL: http://modis.higp.hawaii.edu/); NASA Goddard Space Flight Center (NASA/GSFC), Global Sulfur Dioxide Monitoring Page, Atmospheric Chemistry and Dynamics Laboratory, 8800 Greenbelt Road, Goddard, Maryland, USA (URL: https://so2.gsfc.nasa.gov/).
Kilauea (United States) — July 2018 Cite this Report
Kilauea
United States
19.421°N, 155.287°W; summit elev. 1222 m
All times are local (unless otherwise noted)
Overflows of lava lake in Halema'uma'u crater; Pu'u 'O'o crater floor collapses 30 April 2018; inflation and increased seismicity
Open lava lakes at the Kīlauea summit caldera along with a lava lake and flows from the East Rift Zone (ERZ) have been almost continuous since the current eruption began in 1983, and the rift zone has been intermittently active for at least two thousand years. The period from January-April 2018 included the ending of activity in one part of the ERZ and the beginning of a new episode. March 2018 marked the tenth year of the active lava lake inside the Overlook vent at Halema'uma'u. Information for this report comes primarily from the US Geological Survey's (USGS) Hawaiian Volcano Observatory (HVO) which provides daily reports, volcanic activity notices, and photo and video data.
At the end of 2017, the lava lake inside the Overlook vent at Halema'uma'u crater maintained the typical activity it had exhibited throughout the year, with a consistent lava circulation pattern, and occasional spattering events from hardened lava falling into the lake from the pit walls. The lake level rose and fell by a few meters over periods of hours to days, ending the year about 30 m below its level at the beginning of the year. Longer-term subsidence of the Pu'u 'O'o cone on the East Rift Zone was also apparent during 2017, although there was little change in the elevation of the lava pond inside the west pit area of the crater; occasional rockfalls triggered minor spattering. At the end of 2017 the East Rift Zone episode 61g surface lava flow activity persisted on the upper portions of the flow field near Pu'u 'O'o, on the pali, and in scattered areas along the coastal plain. Changes in the subsurface flow in lava tubes contributed to frequent changes to surface breakout locations. The lava flowing into the ocean at Kamokuna slowed and finally ended in November 2017.
During January-April 2018, the lava lake level inside the Overlook vent of Halema'uma'u crater rose and fell daily with alternating periods of inflation and deflation, with a gradual overall inflationary trend. Inflation intensified at the end of April, and the lake overflowed onto the floor of the crater during 21-27 April. The lake level had dropped several meters below the rim of the vent by the last day of the month. Activity of the episode 61g lava flow decreased gradually throughout the period. The flow remained active at the base of the pali and on the upper flow field through February, but activity tapered off on the coastal plain. By the end of March, only the upper flow field was still active. Notable inflationary tilt began at Pu'u 'O'o on 12 March 2018. Lava flowed out of vents on the main crater floor and also created a perched lava pond in the west pit. In mid-April HVO noted that the inflation resulted from increased pressurization of the magma under Pu'u 'O'o and in the past this had led to the formation of new vents and lava flows along the East Rift Zone. A marked increase in seismicity and ground deformation at Pu'u 'O'o on the afternoon of 30 April was followed by the collapse of the crater floor, dispersing red ash a significant distance around the cone. Following the collapse, HVO seismometers and tiltmeters recorded a substantial increase in seismic activity and deformation from Kīlauea's summit to an area about 10-16 km downrift (east) of Pu'u 'O'o which propagated eastward overnight along the Lower East Rift Zone (LERZ), marking the beginning of a major new eruptive phase.
Activity during January 2018. Consistent activity continued into January 2018 with few notable changes. The lava lake inside the Overlook vent at Halema'uma'u crater rose and fell by a few meters over hours and days; on the East Rift Zone the lava pond persisted at Pu'u 'O'o cone, and scattered breakouts from the episode 61g lava flow continued. Early on 19 January two earthquakes of magnitude 2.4 and 2.5 occurred on the lower East Rift Zone near Leilani Estates. Also on 19 January, a rockfall from the wall of Halema?uma?u crater plunged into the lava lake producing a short-lived explosion of spatter and wallrock that blanketed an area around the former visitor overlook. Debris fell as far as the Halema'uma'u parking lot (figure 312).
HVO noted that spattering from the lava lake at Halema'uma'u was visible from the visitor overlook overnight during 25-26 January. Spatter appeared again briefly the next day, and overnight during 29-30 January. Four spattering sites were visible on a clear 30 January day (figure 313). Webcam views overnight on 30-31 January showed that incandescence persisted from the small lava pond on the W side of the Pu'u 'O'o crater. On the morning of 26 January a new breakout from the episode 61g flow appeared on the pali. By the end of January, most of the breakouts from the episode 61g flow field were concentrated at the base of the pali and on the upper flow field, with little activity on the coastal plain.
Activity during February 2018. The lake level inside the Overlook vent continued with daily fluctuations of several meters, between 31 and 42 m below the Halema'uma'u crater floor, during February 2018. A small veneer collapse (rockfall) into the lava lake on 23 February was visible in lava lake webcam images. Throughout the month, persistent incandescence was observed in the webcam at the Pu'u 'O'o west pit lava pond (figure 314). On 10 February a large portion of the NE rim of the west pit collapsed. Prior to and during the rim collapse, the adjacent ground also subsided. The episode 61g flow remained active at the base of the pali (figure 315) and in the upper flow field. A new breakout on the upper flow field, 1-2 km from the vent, appeared early on 26 February. A small swarm of earthquakes occurred in the upper East Rift Zone on 21 February; the largest event was a M 2.3. Seismicity throughout the volcano was otherwise at normal rates throughout the month.
Activity during March 2018. A brief swarm of small earthquakes occurred in the upper East Rift Zone on 2 March 2018. An ongoing long-period earthquake swarm at 5-10 km depth beneath the caldera began late on 6 March and continued into the next day. At the Halema'uma'u crater, the lava lake fluctuated daily, with levels ranging from a low of 40.5 m below the crater floor to a high of 20 m below it. Changes in levels of up to 10 m in a 24-hour period were common. Vigorous spattering was observed on 6 March (figure 316). On 16 March, the lava lake rose high enough (26 m below the crater floor) for active spattering to be visible in webcams mounted in the HVO tower, located across the crater from the vent. The 10th anniversary of the eruption within Halema'uma'u crater was marked on 19 March. When the vent first opened on 19 March 2008, it formed a small pit about 35 m wide. Over the following decade, the pit (informally called the "Overlook crater") grew to about 280 x 200 m in size (see figure 313).
Notable inflationary tilt at Pu'u 'O'o cone began on 12 March 2018; GPS stations also started recording extension across the cone on that date. A small increase in seismic events was observed at Pu'u 'O'o on the evening of 21 March. Increased views of spattering from the west pit lava pond were visible beginning the following day, likely due to subsidence over the previous months as reported by HVO. During the evening of 25 March lava flowed out of a vent in the SE part of the crater floor and continued to expand for the rest of the month (figure 317). Inflationary tilt slowed significantly on 27 March. Cracks along the ridge between the main crater and the west pit continued to grow throughout the month as the ridge continued to subside (figure 318).
By 20 March surface lava flow activity from the episode 61g flow near the base of the pali appeared to have diminished, and only sparse lava flow activity on the coastal plains was noted after 23 March. Activity on the upper flow field, closer to Pu'u 'O'o, continued (figure 319). A 30 March overflight by HVO confirmed no flow activity on the coastal plain or the pali.
Activity during 1-16 April 2018. Constant spattering at the Overlook vent lava lake (figure 320) was intermittently visible from HVO and the Jagger Museum during April 2018 as the lake level rose and fell several meters on a daily basis. Its lowest level of the month was 32 m below the crater floor, and a general inflationary trend throughout the month resulted in significant overflows onto the floor of Halema'uma'u crater at the end of the month. A rockfall in the morning of 6 April triggered an explosion at the summit lava lake that damaged the power system to the Halema'uma'u crater rim webcams (figure 321). A moderate swarm of over 200 earthquakes occurred on 11 April at depths of 7-9 km below the summit; the largest event in the sequence was M 2.4. Seismicity returned to its background rate in the early morning of 12 April. Three minor ledge collapses, common while the lava lake level is lowering, occurred on 12 April.
For the first half of April 2018, steady minor inflation continued at Pu'u 'O'o, interrupted by brief episodes of sharp deflation that appeared related to small lava flows on the crater floor. During an overflight on 13 April HVO geologists viewed a perched lava pond inside the west pit (figure 322). A slight increase in seismicity in the Upper East Rift Zone began overnight during 15-16 April; the largest event was a M 2.9 earthquake.
At the beginning of April 2018 the episode 61g lava flow was active only above the Pulama pali. The areas of the upper flow field with active lava flows were located within the Kahauale'a Natural Area Reserve, which has been closed to the public since 2007 due to volcanic hazards. On 13 April 2018, geologists observed scattered breakouts from the 61g flow within about 2.2 km from Pu'u 'O'o and another sluggish breakout about 5 km from Pu'u 'O'o (figure 323).
Activity during 17-30 April 2018. Beginning in mid-April 2018 seismometers recorded an increase in the number of small earthquakes beneath the summit and upper East Rift Zone reflecting increased pressurization. Kīlauea's summit and East Rift Zone magma systems are connected, with changes at one sometimes leading to changes at the other. Tiltmeters, GPS, web cameras, and field observations, continued to record inflation at the Halema'uma'u crater, at Pu'u 'O'o, and at the upper portion of the episode 61g lava tube system. HVO noted that this inflation could lead to the opening of a new vent on or near Pu'u 'O'o that could cause a significant drop in the summit lake level.
At the Halema'uma'u crater, inflation significantly outpaced deflation for the second half of April. In the afternoon of 18 April the lake level was at 25 m below the crater floor. A lengthy episode of inflation brought the lava to within 6 m of the floor on the afternoon of 21 April. As the level continued to rise, a small overflow along the S crater rim occurred about midnight overnight on 21-22 April (figure 324). The lava lake was below the rim again the next morning but spilled out several times over the next several days to the N, S, and SW. The flows, similar to those produced during the last significant overflow event in April-May 2015, consisted of lobate sheets of shelly pahoehoe traveling as far as 375 m across the floor of Halema'uma'u. A small overflow had also occurred in October 2016.
The summit lava lake spilled out of the Overlook crater rim multiple times during 22-27 April, caused by repeated inflation-deflation cycles (figures 325-327). Between overflows, the lava column receded below the crater rim. An overflight during the afternoon of 23 April showed that the overflows covered about 30% of the Halema'uma'u crater floor, approximately 16 ha. The height of the lava lake, on the floor of Halema'uma'u crater, was 79 m below the rim of the crater on 25 April. HVO estimated that only about one quarter of the floor of the crater remained uncovered by new flows as of 26 April. Summit tiltmeters continued to record an overall inflationary trend with brief periods of deflation until turning to more sustained deflation around midnight overnight on 26-27 April. A magnitude 3.2 earthquake occurred around 1308 HST on 26 April but did not cause any eruptive changes. Seismometers recorded a few small earthquakes in the upper East Rift Zone and south part of the caldera during 25-29 April.
The summit lake level dropped 16 m during 27-28 April, ending the period of inflation that produced the overflows onto the crater floor. The lake level remained about 15 m below the floor when skies cleared on 30 April and permitted a view from the webcam (figure 328). Slight inflation returned later in the day and the lake level rose to just beneath the vent rim.
HVO released a Volcanic Activity Notice, in addition to their regular daily report, midday on 17 April 2018. They noted that observations and measurements at Pu'u 'O'o during the previous month suggested that the magma system had become increasingly pressurized, raising the possibility that a new vent could form at any time, either on the Pu'u 'O'o cone or along adjacent areas. Since mid-March there had been uplift of the Pu'u 'O'o crater floor by several meters. Similar episodes of inflation and uplift at Pu'u 'O'o occurred in May-June 2014, prior to the start of the June 27th flow (active 2014-2016) and May 2016 before the start of the ongoing episode 61g flow.
When measured during a site visit on 18 April the pond level in the west pit at Pu'u 'O'o was 7 m higher than it had been in late March as a result of lava overflows building up the surrounding levee. An overflight on 23 April showed the perched lava pond with overflows slowly filling the pit (figure 329), and significant cracks on the NE part of the crater rim (figure 330). The pond had another overflow that remained in the pit on 24 April, and the floor continued to rise. Inflationary tilt continued at Pu'u 'O'o until it leveled off around midnight during 26-27 April, but the crater floor continued to rise for the next four days.
Just after 1400 on 30 April 2018, a marked increase in seismicity and ground deformation began at Pu'u 'O'o. A few minutes later, a thermal webcam (PTcam) located on the crater rim showed the first of two episodes of floor collapse; the second collapse began at 1520 and lasted about an hour. Webcam views into the crater and surrounding area were frequently obscured by poor weather conditions. However, shortly after 1600 the PTcam recorded images that were likely the signature of small explosions from the western side of the crater as the floor collapsed.
Following the collapse there was an increase in seismicity and deformation from the summit to an area about 10-16 km downrift (east) of Pu'u 'O'o. Overnight, this activity continued to propagate eastward along the rift zone. The largest earthquake of this sequence was a magnitude 4.0 just offshore south of Pu'u 'O'o at 0239 on the morning of 1 May. HVO field crews were turned back the next morning by ash in the air above Pu'u 'O'o, likely due to continuing collapse within the crater and vigorous gas emissions. Reddish ash was also noted in abundance on the ground around Pu'u 'O'o.
Lava flow activity in the episode 61g flow continued on the upper flow field through the end of April 2018. Activity was focused above the pali and closer to Pu'u 'O'o, within 2 km of the vent. After the explosion and collapse of the crater floor at Pu'u 'O'o on 30 April, a large amount of red ash was deposited around the cone and covered over some of the active breakouts of the 61g flow (figure 331).
Geologic Background. Kilauea overlaps the E flank of the massive Mauna Loa shield volcano in the island of Hawaii. Eruptions are prominent in Polynesian legends; written documentation since 1820 records frequent summit and flank lava flow eruptions interspersed with periods of long-term lava lake activity at Halemaumau crater in the summit caldera until 1924. The 3 x 5 km caldera was formed in several stages about 1,500 years ago and during the 18th century; eruptions have also originated from the lengthy East and Southwest rift zones, which extend to the ocean in both directions. About 90% of the surface of the basaltic shield volcano is formed of lava flows less than about 1,100 years old; 70% of the surface is younger than 600 years. The long-term eruption from the East rift zone between 1983 and 2018 produced lava flows covering more than 100 km2, destroyed hundreds of houses, and added new coastline.
Information Contacts: Hawaiian Volcano Observatory (HVO), U.S. Geological Survey, PO Box 51, Hawai'i National Park, HI 96718, USA (URL: http://hvo.wr.usgs.gov/).
Kirishimayama (Japan) — July 2018 Cite this Report
Kirishimayama
Japan
31.934°N, 130.862°E; summit elev. 1700 m
All times are local (unless otherwise noted)
No further activity from Shinmoedake after 27 June 2018
Three volcanoes in the Kirishimayama volcanic complex experienced heightened activity during late 2017 and early 2018. There were explosions at Shinmoedake during September-October 2017 and March-May 2018, an explosion at Iwo-yama in April 2018, and heightened seismicity at Ohachi in February 2018 (BGVN 43:06). Activity weakened afterwards, and by the beginning of July the three volcanoes were relatively quiet except for some fumarolic activity and seismic activity. This report documents activity between June and November 2018. Most of the information was provided in Japan Meteorological Agency (JMA) monthly reports.
Activity at Shinmoedake during June 2018. JMA reported that an explosion at 0909 on 22 June generated an ash plume that rose 2.6 km above the crater rim and drifted E. Tephra was ejected 1.1 km away, and shock waves were felt in the Miyazaki region. Minor amounts of ash fell in Kirishima prefecture and Kagoshima prefecture to the S, Miyakonojo city (Miyazaki prefecture) to the E, and Takahara Town. Another explosion at 1534 on 27 June generated a plume that rose 2.2 km above the crater rim.
According to JMA, since the beginning of May the rate of deformation had slowed, and tiltmeter data showed no change. In addition, sulfur dioxide emissions had decreased from 1,000 tons/day on mid-March to 80 tons/day on 1 June. Based on the data, JMA believed the magma supply had declined, decreasing the possibility of an eruption affecting an area outside a radius of 2 km. Thus, on 28 June, JMA lowered the Alert Level from 3 to 2.
Activity at Iwo-yama during June-July 2018. Activity weakened in May, and no volcanic explosions occurred after 27 April. However, active fumarolic activity and ejection of mud continued through November from the vent on the S side. During 23-30 July, white plumes rose 300-500 m above the vent. Also on the S side, the hot lake, which was muddy in May, became transparent in June, but was cloudy again in July. Fumarolic activity also occurred at a vent 500 W of the crater.
Volcanic earthquakes slightly increased in late May. According to measurements by the Global Navigation Satellite System (GNSS), the volcano, which had been contracting, began to expand slowly at the beginning of June. The Alert Level remained at 2.
Geologic Background. Kirishimayama is a large group of more than 20 Quaternary volcanoes located north of Kagoshima Bay. The late-Pleistocene to Holocene dominantly andesitic group consists of stratovolcanoes, pyroclastic cones, maars, and underlying shield volcanoes located over an area of 20 x 30 km. The larger stratovolcanoes are scattered throughout the field, with the centrally located Karakunidake being the highest. Onamiike and Miike, the two largest maars, are located SW of Karakunidake and at its far eastern end, respectively. Holocene eruptions have been concentrated along an E-W line of vents from Miike to Ohachi, and at Shinmoedake to the NE. Frequent small-to-moderate explosive eruptions have been recorded since the 8th century.
Information Contacts: Japan Meteorological Agency (JMA), Otemachi, 1-3-4, Chiyoda-ku Tokyo 100-8122, Japan (URL: http://www.jma.go.jp/jma/indexe.html).
Merapi
Indonesia
7.54°S, 110.446°E; summit elev. 2910 m
All times are local (unless otherwise noted)
Lahar in October 2016; phreatic explosions May-June 2018
After a major eruption on 26 October 2010 that subsided in early December of that year, Merapi erupted regularly amid elevated seismicity between 13 June 2011 and April 2014; seismicity returned to normal levels in May 2014 (BGVN 39:10). Renewed activity in the form of phreatic explosions took place during May-June 2018.
Lahar in October 2016. According to the Badan Nasional Penanggulangan Bencana (BNPB) (National Disaster Management Agency), a lahar on 27 October 2016 induced by moderate to heavy rain swept nine sand mining trucks down the Bebeng River on the SW flank; at least one truck was buried and six were severely damaged. There were no fatalities as the miners and other people at the scene escaped. Material at the summit and on the flanks produced during the October-November 2010 eruption was an estimated 20-25 million cubic meters, contributing to the continuing high potential of lahars during heavy rain. BNPB recommended that the public remain vigilant during rainy weather because a lahar formed on the upper flanks of Merapi can reach the bottom in less than 30 minutes. The Alert Level remained at 1 (on a scale of 1-4).
Phreatic explosions during May-June 2018. The volcano was apparently quiet between November 2016 and April 2018. According to the Pusat Vulkanologi dan Mitigasi Bencana Geologi (PVMBG, also known as CVGHM), an explosion occurred at 0740 on 11 May 2018. The eruption began with a small roar and vibrations that were felt at the observation post for 10 minutes. A plume rose to 5.5 km above the summit. There was no seismic precursor and no subsequent seismic activity. According to a news account (The Jakarta Post) on 11 May, the increased activity caused Yogyakarta's Adisutjipto International Airport (27 km S) to close, resulting in the cancellation of eight Garuda Indonesia flights. PVMBG did not increase the alert level from Green/Normal; they interpreted the explosion as being a minor event triggered by the accumulation of volcanic gases, and unlikely to result in subsequent explosions. High levels of sulfur dioxide in the vicinity of the volcano were detected by the satellite-based Ozone Monitoring Instrument (OMI) on 11 May; concentrations reached as high as 2.0 Dobson Units.
On 21 May a phreatic explosion began at 0125 and lasted for 19 minutes, generating an ash plume that rose 700 m above the crater and drifted W. At 0938, another phreatic explosion began that lasted six minutes and produced an ash plume that rose 1.2 km above the crater. Ashfall from both events was reported in areas 15 km downwind. A third event, detected at 1750, lasted three minutes and produced a plume of unknown height. After these events, one volcano-tectonic (VT) earthquake and one tremor event were recorded. The seismicity along with increased phreatic events prompted PVMBG to raise the Alert Level to 2.
According to PVMBG, on 23 May, at 1349 the Babadan observation post heard a two-minute-long phreatic explosion. A plume was not visible due to inclement weather, though minor ashfall was reported at the Ngepos observation post. On 24 May an event at 0256 generated an ash plume that rose 6 km above the crater rim and drifted W. Roaring was heard at all the Merapi observation posts. A two-minute-long event at 1048 produced an ash plume that rose 1.5 km and drifted W. PVMBG recommended the evacuation of everyone within 3 km of the summit.
PVMBG reported that on 1 June, at 0820, an event generated an ash plume that rose at least 6 km above the crater rim and drifted NW, then SW (figure 68). Ashfall was reported at the Selo observation post. Observers noted white smoke rising from a forested area 1.5 km NW, possibly indicating burning vegetation. PVMBG indicated that VT events were occurring at about 3 km below the crater. Later that day at 2024, an ash plume from a 1.5-minute-long event rose 2.5 km above the crater rim and drifted NE and W. At 2100, an ash plume rose 1 km and drifted NW. The Alert Level remained at 2.
Geologic Background. Merapi, one of Indonesia's most active volcanoes, lies in one of the world's most densely populated areas and dominates the landscape immediately north of the major city of Yogyakarta. It is the youngest and southernmost of a volcanic chain extending NNW to Ungaran volcano. Growth of Old Merapi during the Pleistocene ended with major edifice collapse perhaps about 2,000 years ago, leaving a large arcuate scarp cutting the eroded older Batulawang volcano. Subsequent growth of the steep-sided Young Merapi edifice, its upper part unvegetated due to frequent activity, began SW of the earlier collapse scarp. Pyroclastic flows and lahars accompanying growth and collapse of the steep-sided active summit lava dome have devastated cultivated lands on the western-to-southern flanks and caused many fatalities.
Information Contacts: Pusat Vulkanologi dan Mitigasi Bencana Geologi (PVMBG, also known as Indonesian Center for Volcanology and Geological Hazard Mitigation, CVGHM), Jalan Diponegoro 57, Bandung 40122, Indonesia (URL: http://www.vsi.esdm.go.id/); Badan Nasional Penanggulangan Bencana (BNPB), National Disaster Management Agency, Graha BNPB - Jl. Scout Kav.38, East Jakarta 13120, Indonesia (URL: http://www.bnpb.go.id/); The Jakarta Post (URL: http://www.thejakartapost.com/); NASA Goddard Space Flight Center (NASA/GSFC), Global Sulfur Dioxide Monitoring Page, Atmospheric Chemistry and Dynamics Laboratory, 8800 Greenbelt Road, Goddard, Maryland, USA (URL: https://so2.gsfc.nasa.gov/).