Analysis of seismic swarms (Mw =1.9; ~219 events) during September 2012
219 low-magnitude earthquakes occurred at Campi Flegrei during September 2012, a comparatively large number with respect to the previous year (figure 22). The earthquakes chiefly were contained within two swarms (with events up to Mw 1.9; Mw indicates moment magnitude) occurring on 7 and 15 September. Peak ground accelerations (PGA) were non-trivial (up to ~0.5 g), and some earthquakes were widely felt by area residents. Analysis revealed that the strain release rate of the 7 September swarm fell within values seen for other swarms during the last 20 years. The observations reported by the Vesuvius Observatory (who provided the material for this report) were limited to those associated with the earthquakes and related seismic analysis. Other reporting on topics such as deformation appears on the Observatory's website (see Information Contacts, below). The observatory is part of Italy's National Institute of Geophysics and Volcanology (INGV).
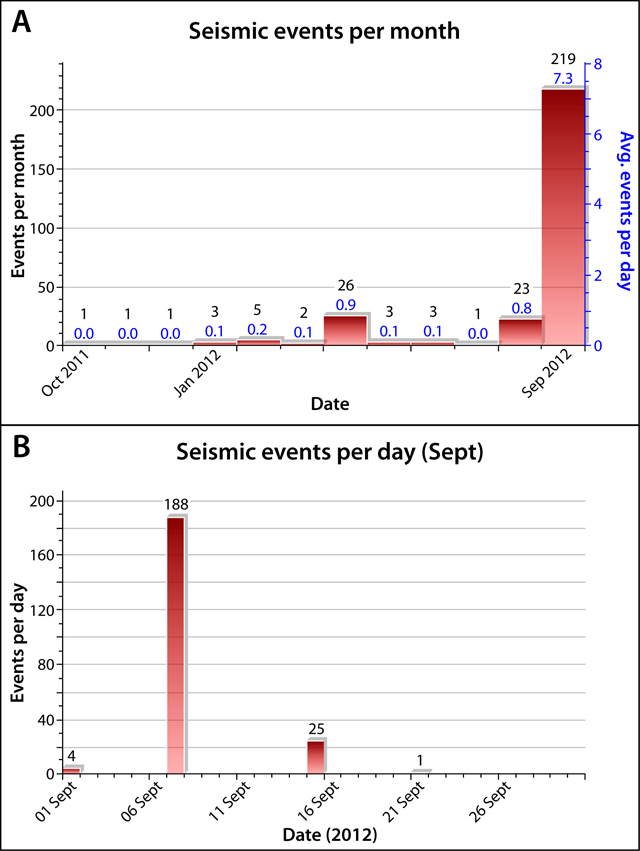 |
Figure 22. Campi Flegrei earthquake count recorded between October 2011 and the end of September 2012. (A) The number of earthquakes recorded per month during October 2011-September 2012 (288 total events). (B) The number of earthquakes recorded during September 2012 alone (219 total events), highlighting the swarm of 188 events on 7 September. Courtesy of Vesuvius Observatory-INGV (Naples). |
Almost all of the earthqaukes that occurred during September took place in two swarms (figures 22 and 23). The first swarm occurred in the area of Pozzuoli during 0715-0935 UTC on 7 September. The two largest events of that swarm were Mw 1.9 (a duration magnitude, Md, value of 1.7; figure 24); these events were the largest recorded events of the prior year (figure 24A). The 7 September swarm was dominant over the 15 September swarm both in terms of the number and magnitude of events.
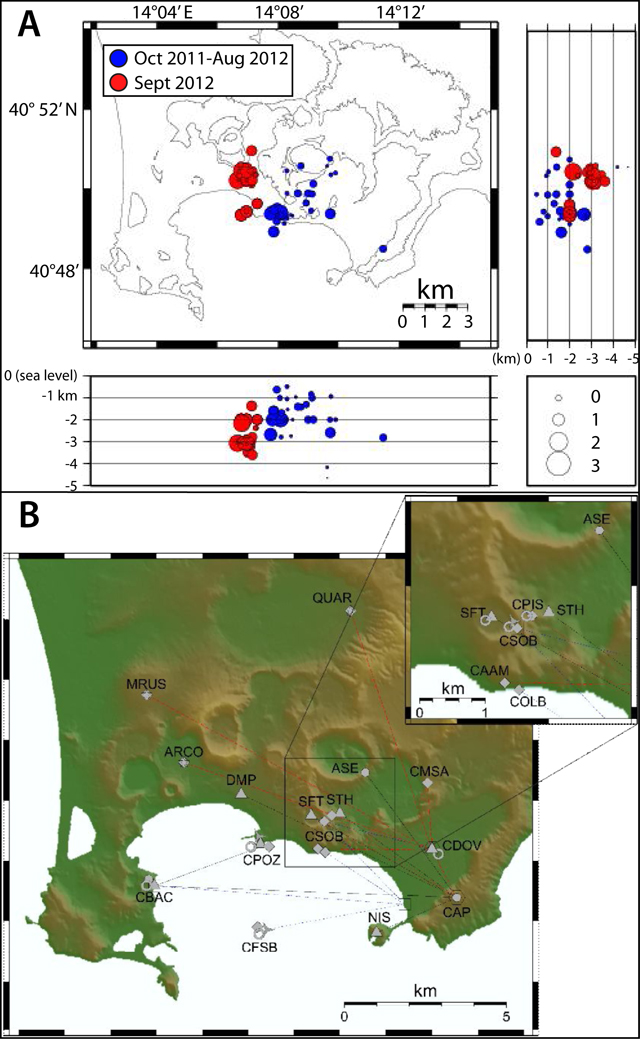 |
Figure 23. (A) Hypocentral locations registered at Campi Flegrei during October 2011-August 2012 (blue) and September 2012 (red). The size of the symbols is proportional to the magnitude, as shown in the lower right box. (B) A map with the seismic network at Campi Flegrei. The boxed area zooms in on the region where the two swarms occured. Courtesy of Vesuvius Observatory-INGV (Naples). |
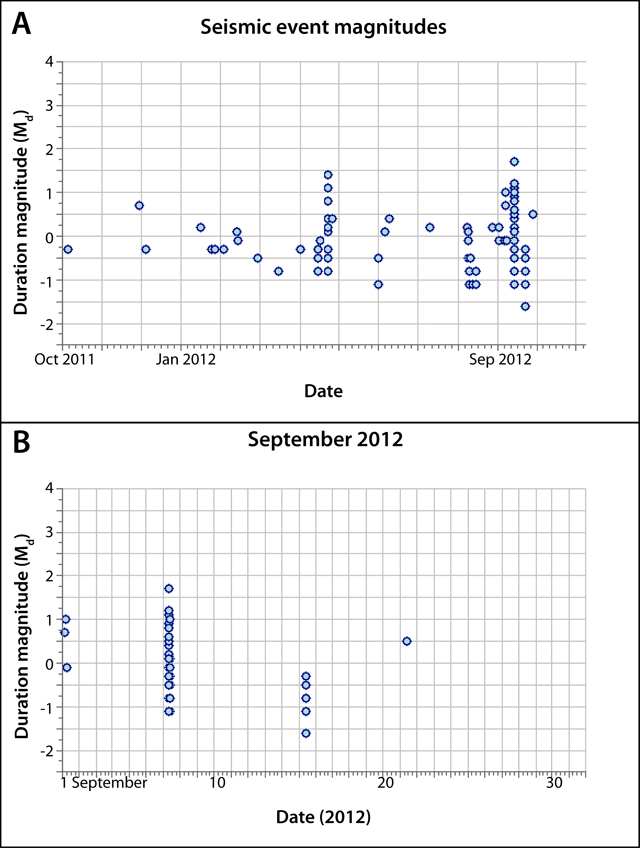 |
Figure 24. Magnitudes (duration magnitude, Md) of seismic events recorded at Campi Flegrei during October 2011-September 2012 (A). (B) shows the details of the computed magnitudes during the September 2012 seismic swarm. Courtesy of Vesuvius Observatory-INGV (Naples). |
The second swarm of September 2012 took place between 0901 and 1012 UTC on 15 September (figure 22), with the strongest events (Md -0.3) occurring at 0947 and 0954 UTC. This swarm was recorded by only one station (STH, Agnano, figure 23B) and thus was plausibly located in close proximity to that station at shallow depth. This swarm is absent on the depth plot in figure 25 (depth not available).
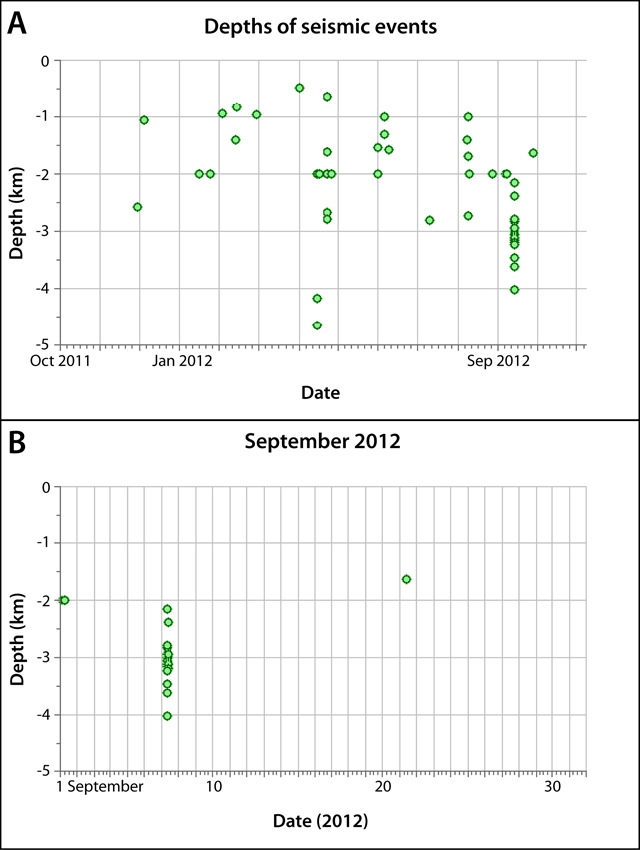 |
Figure 25. Time series plots of the hypocentral depths of seismic events recorded at Campi Flegrei during October 2011-September 2012 (A) and during September 2012 (B) showing details of the September 2012 seismic swarm. Courtesy of Vesuvius Observatory-INGV (Naples). |
The hypocenters of 49 events were determined during September 2012; their depths were generally less than 4 km (figures 23 and 25). The seismological parameters did not show significant anomalies (figures 24 and 25). However, September 2012 was the most seismically energetic time period of the prior year (figure 26); seismicity during September produced >3 times the cumulative energy released during the preceding year.
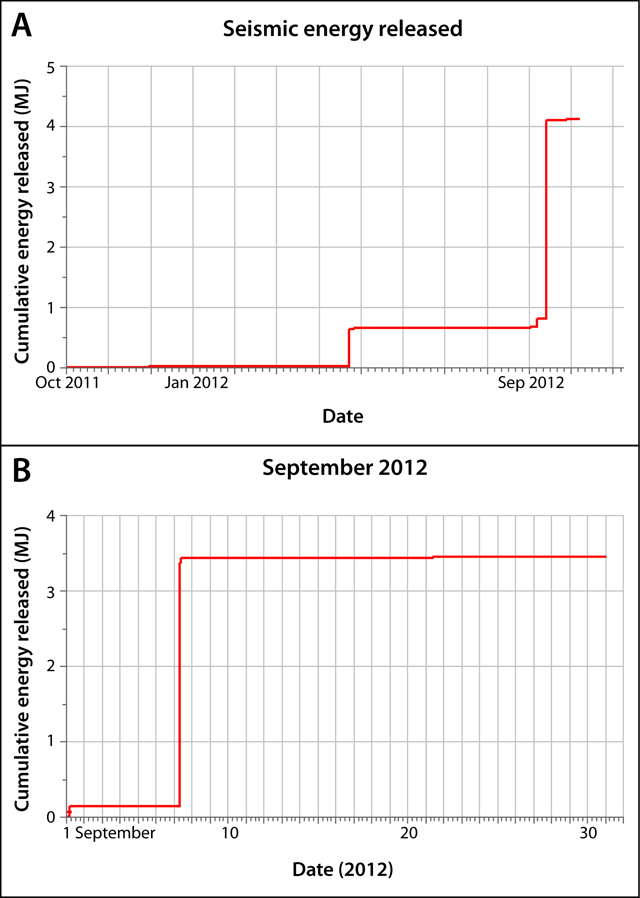 |
Figure 26. Cumulative seismic energy released at Campi Flegrei during (A) October 2011-September 2012 and (B) September 2012. Courtesy of Vesuvius Observatory-INGV (Naples). |
Analysis of the 7 September seismic swarm. For the two main events (0734 and 0825 UTC) on 7 September, source parameters were determined from S-wave displacement spectra (results shown in figure 27).
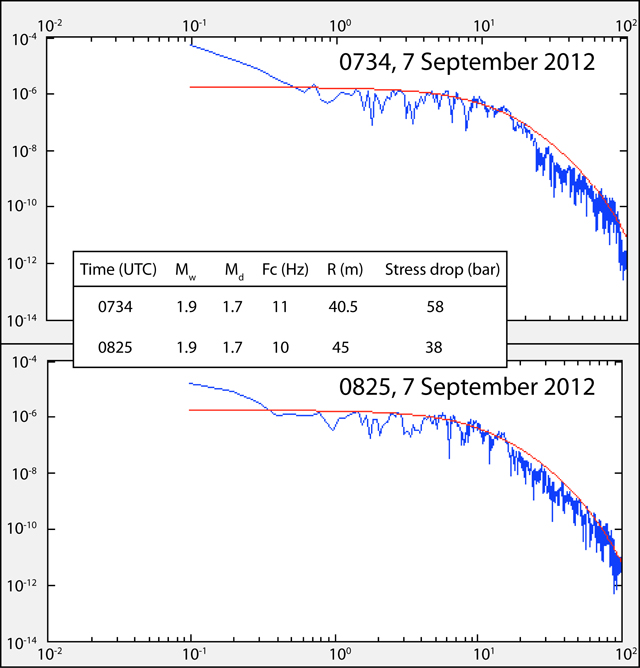 |
Figure 27. Displacement spectra (blue) for the S-waves of the largest events in the 7 September 2012 seismic swarm, occurring at 0734 (top) and 0825 UTC (bottom). The red curves represent the fit with a theoretical model. The displacement spectra were obtained from the records of the accelerometer CPOZ (Pozzuoli, figure 23B). The tabulated values display the computed source parameters for each event: Mw, moment magnitude; Md, duration magnitude; Fc, corner frequency; R (m), source radius, and stress drop (bars). For discussion of source parameters see Mooney (1989). Courtesy of Vesuvius Observatory-INGV (Naples). |
The duration and strain release of the 7 September swarm were similar to other seismic swarms at Campi Flegrei since at least 1994 (figure 28).
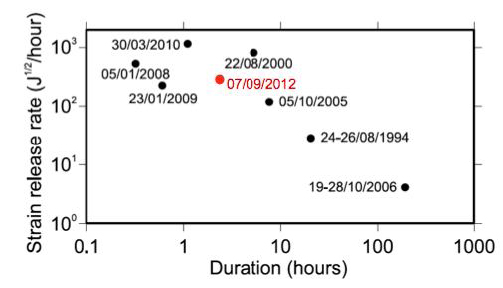 |
Figure 28. A plot showing duration and strain release rate for Campi Flegrei seismic swarms since 1994. Courtesy of Vesuvius Observatory-INGV (Naples). |
Some of the events in the swarm were widely felt in the urban area of Pozzuoli. Peak ground acceleration values (PGA, units of %g, the acceleration due to gravity) recorded by the accelerometer in Pozzuoli (CPOZ, figure 23B) show two prominent peaks corresponding to the two largest events that occurred at 0734 and 0825 UTC (figure 29).
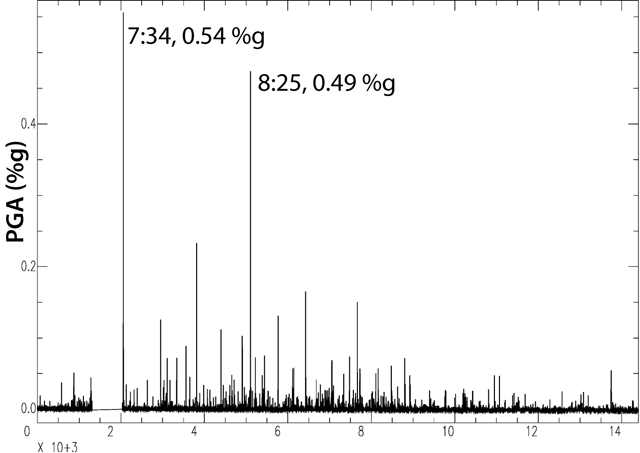 |
Figure 29. Peak ground acceleration values (PGA, in units of %g, the acceleration due to gravity) recorded by the accelerometer CPOZ (Pozzuoli, figure 23B) between 0700 and 1100 UTC on 7 September 2012. The visible gap in the data between 0722 and 0733 was caused by technical problems in the data transmission system. The two largest events are labelled with their timestamps and PGA values. Courtesy of Vesuvius Observatory-INGV (Naples). |
Reference. Mooney, W.D., 1989. Seismic methods for determining earthquake source parameters and lithospheric structure, in Pakiser, L.C. and Mooney, W.D. (eds), Geophysical framework of the continental United States, Geological Society of America Memoir 172.
Information Contacts: Vesuvius Observatory, National Institute of Geophysics and Volcanology (INGV), Via Diocleziano 328, 80124 Napoli, Italy (URL: http://www.ov.ingv.it/ov/).
The Global Volcanism Program has no Weekly Reports available for Campi Flegrei.
Reports are organized chronologically and indexed below by Month/Year (Publication Volume:Number), and include a one-line summary. Click on the index link or scroll down to read the reports.
Inflation in Pozzuoli area; inaccurate press reports cause evacuations
Card 0877 (04 March 1970) Ten new fissures and inflation in the Campi Flegrei
Ten new volcanic fissures have opened in the "Campi Flegrei" (fiery fields) near the city of Pozzuoli (a suburb of Naples), which is being pushed upwards. The fissures showed a recrudescence of the volcanic activity which has always gone on in the area. The sudden raising of the Pozzuoli area has caused damage and fracturing of houses and walls. One church and two schools were recently closed. A leveling carried out on 6 February 1970 has shown that the floor of Serapaeum at Pozzuoli has risen about 80 cm with respect to the former leveling carried out in october 1968. The floor of Serapaeum had been sinking since the last eruption in the "Campi Flegrei" occurred in 1538, the average rate of sinking being 13 mm per year. Plans are being made to evacuate the inhabitants of the city if necessary. The opposite phenomenon is happening on the Isle of Ischia, where the land has sunk by up to 15 cm in some places.
Corrections. [The following corrections to this report from G. Imbo was originally published on Card 916.] Statements concerning "new volcanic fissures," the "recrudescence of volcanic activity," and the "15 cm sinking of parts of the Isle of Ischia" were attributed to G. Imbo by UPI. Imbo states that these statements are "not entirely correct." The remaining statements were quotations from one of the cables received from Imbo.
Card 0878 (05 March 1970) Additional investigations and measurements being made
"Landrise of Flegrean area is presently about 1 m at Serapeo floor and at harbour of Pozzuoli referring ot the level measured in October 1968. The land rise decreases slowly toward the borders of Flegrea area. Levelling is underway by us and the Public Works office. Two pipe gauges have been installed and additional ones will be installed along the coast from Nisida to Miseno cape. Two seismographs are installed and seismic activity has been recorded on 1 and 2 March. Ten shocks have been recorded with epicenter off Pozzuoli and very shallow foci. Additional seismographs are being installed.
"Gravity flow and geothermal measurements and chemical analysis of gases and thermal waters are underway. Bathymetric and magnetic surveys are being carried out by Italian C.N.R. and Hydrographic Institute of Italian Navy. Three tiltmeters will be installed."
Card 0879 (09 March 1970) Inaccurate press reports cause voluntary evacuation of 20,000 people
"From 5 February to 5 March landrise in Pozzuoli measured additional 5 cm, bringing total landrise to 70 cm since October 1968. Additional measuring equipment, including seismographs and tide gauges, now in operation. Navy oceanographic vessel Ulisse Igliori, presently conducting depth soundings in Pozzuoli Gulf with divers, engaged underwater observations [of] active fumaroles which [were] reportedly killing fauna with noxious emissions. In this connection, fisherman's stories of finding cooked fish and burnt fish nets have not aided local officials attempts to ease increasing alarm among Pozzuoli citizens. Second oceanographic vessel Bannock, of Italian National Research Council, expected [to] arrive [in] Pozzuoli Gulf today. Two Japanese volcanologists [are] also expected [to] arrive today from Tokyo.
"Local press speaks of [the] preoccupation [of] Pozzuoli citizens with [the] possibility [of a] major catastrophe, despite repeated reassuring statements [from] responsible government and scientific officials. These continue to maintain that [the] sole threat is to old buildings of Rione Terra suburb which now completely evacuated. Nonetheless, some 20,000 persons may have left other parts of [the] city, and local officials fear major impact on local economy which [has] already [been] hard hit with [the] suspension [of] fishing activities and commerce."
Information Contacts: Card 0877 (04 March 1970)Giuseppe Imbo, Vesuvius Observatory, Naples, Italy.
Card 0878 (05 March 1970)Giuseppe Imbo, Vesuvius Observatory, Naples, Italy.
Card 0879 (09 March 1970)Science Attache, American Consulate General, Naples, Italy.
Fieldwork reveals no seismicity or recent volcanism; fumarole temperatures unchanged
Card 0915 (22 April 1970) Investigations show no evidence of recent fissures, uplift, or seismicity
H. Tazieff led a team of four seismologists from the Institut de Physique du Globe, Paris, and two chemists from the MHD Service of the Commisariat a l'Energie Atomique, Saclay, to investigate the Pozzuoli uplift between 6 and 15 March 1970. The team employed five Mark Product portable three-component seismograph stations, one gas chromatograph, and four Pt-Rh thermocouples. Their field investigations and studies contradict several important statements made by sources in the event area and previously reported by the CSLP.
The following was received from H. Tazieff on 21 April 1970. No volcanic fissures did open in the "Campi Flegrei." No recrudescence of the volcanic activity was actually detectable in this area. Tazieff's team could not obtain any valuable proof of the 20 cm uprise of Pozzuoli that allegedly occurred between March 4th and 5th and did not find any seismogram evidence of the ten shocks that allegedly occurred off the Pozzuoli coast. In fact, during their ten-day investigation not a single seismic event was recorded by their network of sensitive seismographs. Inquiry of local fishermen proved that no cooked fish or burnt nets were found in the area.
Card 0916 (22 April 1970) Fumarole temperatures and composition unchanged from previous measurements
The temperatures of the fumaroles in the Solfatara crater are 147-149°C, the same as those measured by Tazieff in 1967 and those reported by D.E. White for 1907 and 1933. The escaping gases showed, during this period, a quite stable composition. H2O not determined; represents more than 90% of the volume. Analysis of the dry gases show the following and very stable composistion -- for ten analyses for the period 8-15 March 1970. Two samples were heavily polluted by air. CO2, 96.51-99.52%; H2, 0.03-0.07%; H2S, 0.01-0.15%; SO2, 0.00-0.02%; N2, 0.19-2.95%; O2, 0.05-0.49%; A, 0.01-0.03%.
[Corrections to Card 877 from G. Imbo have been moved to directly follow that report.]
Information Contacts: Card 0915 (22 April 1970)Haroun Tazieff, Laboratoire International de Recherches Volcanologiques, Catania, Italy.
Card 0916 (22 April 1970)Haroun Tazieff, Laboratoire International de Recherches Volcanologiques, Catania, Italy.
Slow uplift detected in small area; no other unusual phenomena
Card 0939 (14 May 1970) Slow uplift detected in small area; no other unusual phenomena
The following was received on 12 May 1970. "The so-called 'bradyseism' is still going up. During the period 20 March to 20 April the uprise was of 0.067 m. The affected area is comparatively small (approximately 15-20 km from E to W and apparently 4-6 km from S to N). The uprise in itself is anomalous for sure, but its rate is still too slow to be taken as an evacuation pretext by itself alone. Not one single new eruptive fracture appeared anywhere to date. An earthquake was felt at Pozzuoli on 3 May with an intensity of III in the Mercalli scale.
"Absolutely no other unusual phenomenon could be detected, neither by seismology, nor geochemistry, geomagnetism, heat, or temperature measurements. An important set of geophysical and geochemical investigations, both on land and at sea, are underway since late March and shall be carried on as long as necessary. A permanent station will be installed. Although an eruption can happen at any time and at any place both in Phlegrean Fields and Vesuvius area, absolutely no preliminary manifestations appeared to date in this area."
Information Contacts: Card 0939 (14 May 1970)Haroun Tazieff, Laboratoire International de Recherches Volcanologiques, Catania, Italy.
Uplift and seismicity in the caldera since mid-1982
"Campi Flegrei has been the site of slow vertical movements since at least Roman times. A slow subsidence had occurred since the last eruption in 1538. An uplift observed in 1970 continued until 1972 without significant seismic activity. The inferred maximum uplift with respect to previous levellings was 170 cm. Slow ground oscillations observed between 1972 and 1982 had an annual period with a range of about 10-15 cm/year in the zone of maximum uplift. Since the summer of 1982 oscillation has not reversed as in previous years. The overall uplift amounted to 110 cm between January 1982 and December 1983 in the zone of maximum movement, within the town of Pozzuoli in the center of the caldera. Repeated levelling surveys in the area have given evidence of an area of uplift of about 6 km radius with a fairly circular symmetry.
"In November 1982 moderate seismic activity was observed by the permanent seismic network that has been operating since 1972 (figure 1). The level of activity was slightly above the microseismic background in the area. In January 1983, public officials were notified of the anomalous trend of the phenomenon and the possibility of increasing seismic and volcanic hazard. In March, a distinct increase in seismic activity was observed with the first M 3 earthquake. Since then, ground uplift has continued with a velocity that reached 5 mm/day during October. After October, oscillations in the rate of uplift were observed, with a range between 1 and 4 mm/day. The seismic activity increased, following a trend similar to that of the uplift velocity. A M 4 earthquake occurred on 4 October when the rate of uplift reached 5 mm/day. This earthquake caused some building collapses (without injuries) in the town of Pozzuoli. Downtown Pozzuoli was evacuated after this event because of concern about the increasing seismic hazard. The main part of the town is built of old brick houses that were increasingly affected by the continuous seismic activity. On 13 October a seismic swarm of >250 shocks occurred in 5 hours. Maximum magnitude was 3.0.
 |
Figure 1. Map showing the distribution of the 212 best-located earthquakes as of early 1984 (circles) and positions of seismic stations (triangles). Index map (bottom) is after Nunziata and Rapolla (1981). |
"The people evacuated from Pozzuoli were temporarily resettled in the resort areas surrounding Campi Flegrei. A new settlement has already been planned on the border of the more vulnerable area. The choice of its location was made by public authorities to minimize the social consequences of evacuating people from their residences. The new settlement is relatively safe from a seismic point of view but is not safe from a maximum probable volcanic event.
"The permanent surveillance network operating in the area comprises measurements of ground deformation and seismic activity, and monitoring of gas content and temperatures of fumaroles. Temporary measurements of self-potential have been performed by a French team from the IPG.
"Vertical ground deformation is measured by a repeated levelling of the permanent network (figure 2) and is also checked daily by a tide gauge in Pozzuoli harbor. Measurements are referred to a tide gauge located in the nearest stable place in Naples. Horizontal deformation is also measured on a network covering Campi Flegrei. The data give evidence of a maximum extension of about 40 cm over 4 km, nearly coincident with the area of maximum vertical uplift.
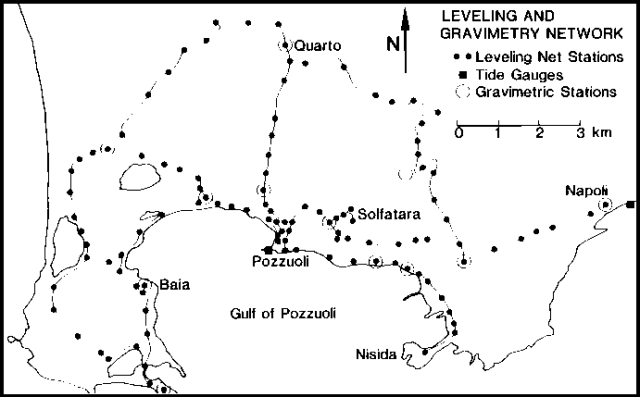 |
Figure 2. Levelling network in the Campi Flegrei area, early 1984. |
"The permanent seismic network operating in the area is composed of 22 vertical seismometers, eight of which are operated by the Osservatorio Vesuviano (OV) and 14 by the AGIP company for the initial purpose of monitoring seismic activity connected with the geothermal field. Seven AGIP stations and the eight OV stations are cable-connected to a central point in Naples. Routine locations are made on these 15 stations using the HYP071 program. Subsequent analysis of data from all 22 stations is made utilizing the program LQUAKE by R. Crosson. The preliminary velocity model is based on data collected from the geothermal wells in the area. The shallow character of the seismic activity does not give any evidence of a zone of anomalous propagation of S waves. A seismic explosion campaign has been planned in the Gulf of Pozzuoli of to provide information on the deeper structure of the area.
"The earthquakes of higher magnitude are mainly confined within a restricted area under the Solfatara Crater. They are offset with respect to the area of maximum uplift and their mean depth is about 3 km (E-W profile is shown in figure 3). Preliminary focal mechanisms indicate a predominantly tensile field in this area. The data on temporal distribution of earthquakes indicate a swarm-type character. The event of maximum magnitude (4) occurred 4 October 1983 and its epicenter was in the Solfatara area. A close correlation seems to exist between the velocity of uplift and the seismic activity. The more energetic earthquakes seem to coincide with the higher rates of uplift (4-5 mm/day).
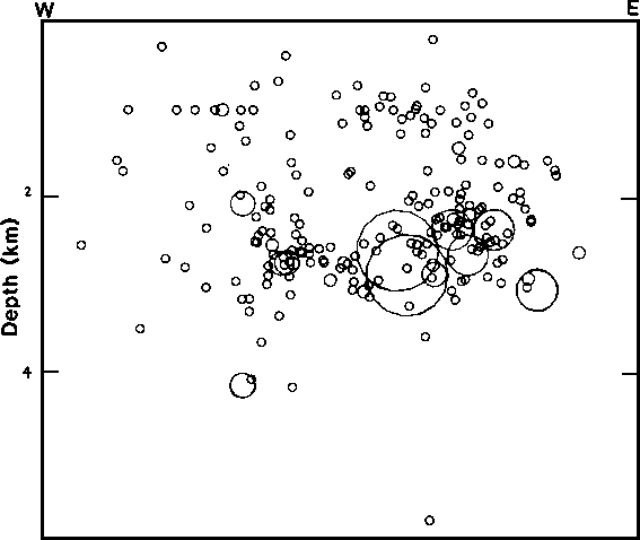 |
Figure 3. Profile (W-E) showing depth distribution of the earthquakes at Campi Flegrei shown in figure 1. Maximum magnitude 4.0. |
"A cross-cooperation with seimologists from the Univ of Wisconsin is under way. A temporary network of ten 3-component stations with high dynamic range has already been deployed in the area and will be operating for some months. A temporary network of 3-component stations was also operated during November 1983 by IPG seismologists.
"Since April 1983, radon measurements have been made in water wells located in the area. The data are still too preliminary to infer any model. We await a prolonged period of measurements to infer what may be the seasonal trend. Temperatures of the Solfatara fumaroles are also continuously monitored. No significant change has been detected.
"Gas monitoring of the Solfatara fumaroles is carried out by several teams from the Universities of of Pisa, Palermo and Florence, both by continuous measurement and periodic sampling. Preliminary data seem to indicate an increase in the energy flux supplied to the deep water table located at 1.2 km depth by the geothermal wells.
"Two detailed surveys of the helium content of the ground have been performed by a team from the Univ of Rome. Order of magnitude variations have been detected in a large area NW of Pozzuoli."
Reference. Nunziata, C., and Rapolla, A., 1981, Interpretation of gravity and magnetic in the Phlegraean Fields Geothermal Area, Naples, Italy: JVGR, v. 9, p.
Information Contacts: G. Luongo and R. Scandone, OV; F. Barberi, Univ. di Pisa.
More vigorous seismicity; uplift continues
"The rate of seismic strain energy release at Campi Flegrei was higher during the first three months of 1984 than during 1983. The seismic strain energy released in the first three months of 1984 was almost as high as that released during all of 1983, although it must be noted that seismic activity did not begin to be detected until March 1983. Seasonal trends in periods of quiet activity have been observed at Campi Flegrei. The complex interplay between external and internal causes of the present crisis makes prediction of the development of the phenomenon still more difficult.
"A peak in activity occurred during the second week of March and at the beginning of April 1984. A magnitude 3.9 earthquake occurred 9 March and five days later a M 4.0 earthquake caused the roof collapse of a fifteenth century church in Pozzuoli. No injuries occurred. The close association of these two earthquakes caused some concern about the possible development of the continuing crisis. On 1 April, a seismic swarm of 499 events occurred between 0300 and 0800. The maximum magnitude was 3.0. The preliminary location is in an area about 1 km W of Pozzuoli, the same area as another swarm on 13 October 1983.
"An analysis of the reliability of hypocentral determinations has been performed using different velocity models. The uncertainties in the velocity model prevent any reliable estimate of the true depth of the earthquakes, even if they are definitely confined within the upper 4 km of crust. The effect of different velocity models does not appreciably change the epicentral determinations. The most energetic events are still confined in a small area around Solfatara Crater. The M 4.0 earthquake of 14 March was located ~ 1 km SE of Solfatara.
"The focal mechanisms of 37 selected events have been studied. Fifteen reliable solutions were obtained (figure 4). Ten events, located around Solfatara Crater, are of tensional type. Two events, located in the Gulf of Pozzuoli, seem of compressive type. No predominant orientation of the P and T axes is found.
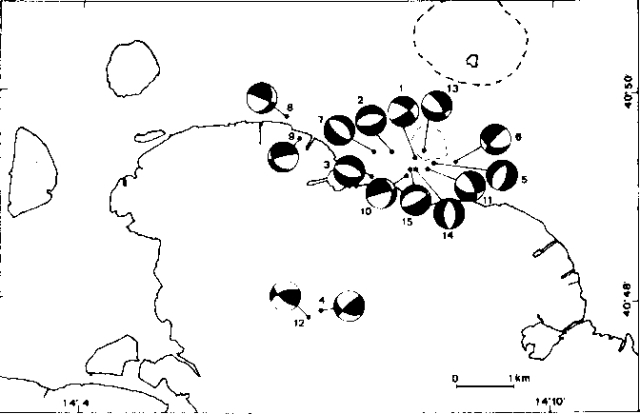 |
Figure 4. Focal mechanisms of 15 selected earthquakes at Campi Flegrei. Courtesy of OV. |
"The previously inferred trend of high deformation rates preceding the largest shocks was not observed for the last two large events. The velocity of uplift, as measured by the Pozzuoli tide gauge, was in the range of 2-3 mm/day during the first two weeks of March 1984; it increased to ~ 4 mm/day during the last two weeks in March. A survey of the levelling network was completed during March. The pattern of deformation is similar to that observed in December 1983. A maximum uplift of 32 cm since December 1983 was measured near Pozzuoli. The maximum uplift since January 1982 was 142 cm. Geochemical surveillance was implemented in 1983 as a consequence of the uplift. Some variations in the chemical composition of water wells have been detected between January and March 1984. In the same period, small variations in the composition of fumarolic gases from Solfatara Crater have been recorded (slight increase of the S/C ratio). The radon content was approximately constant. The reducing capacity of fumarolic gases has been continuously monitored at two fumaroles within Solfatara Crater, showing a broad peak since mid-February, and reaching a maximum in mid-March.
Information Contacts: G. Luongo and R. Scandone, OV; F. Barberi, Univ. di Pisa; M. Carapezza, Univ. di Palermo.
Seismic energy release and uplift slow after 1 April earthquake swarm
"Seismic activity at Campi Flegrei decreased in April. Following the earthquake swarm of 1 April and a M 3.5 event that occurred on 3 April, the cumulative seismic strain energy release had a smaller slope than in the previous three months (figure 5).
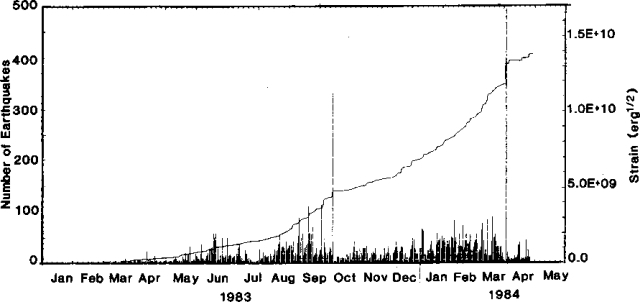 |
Figure 5. Daily number of earthquakes at Campi Flegrei (vertical lines) and cumulative strain release (curve), January 1983-April 1984. |
"The distribution of epicenters for the best-located events (number of stations >8, RMS
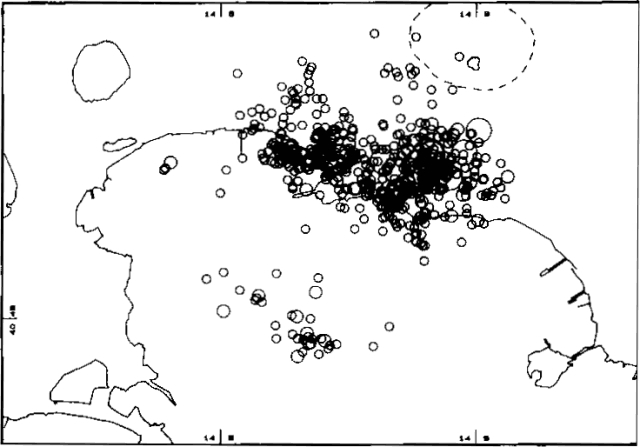 |
Figure 6. Epicentral distribution of best-located events at Campi Flegrei through 15 January 1984. Courtesy of OV. |
"The mean velocity of uplift during April, as measured by the tide gauge located in Pozzuoli harbor, was 1.6 mm/day. This value is definitely smaller than the previous month. Temperatures of the two fumaroles within Solfatara Crater remained at constant values of 110° and 157-159°C.
"The decrease in activity observed after the swarm of 1 April is similar to the decrease observed during November 1983. In that case, a diminuition in seismic activity and a decrease in the uplift velocity were observed after a M 4.0 earthquake, and a swarm that occurred 13 October 1983."
Information Contacts: G. Luongo and R. Scandone, OV; F. Barberi, Univ. di Pisa.
Seismicity and uplift continue; socio-economic impact discussed; increased submarine fumarolic activity
"Seismic activity remained at a low level for most of May and June. The mean velocity of uplift, measured by the Pozzuoli tide gauge, was of the order of 3 mm/day in May.
"We were puzzled by the low level of seismicity and the relatively high rate of ground uplift. Our previous experience indicated that uplift velocities greater than 2-3 mm/day in Pozzuoli are often associated with increased seismic activity. This had not happened during April and May. We were suspicious that a change might have occurred to the system. Finally, there was a small swarm of 80 events in 2 hours on 28 May. The maximum magnitude was 2.0. The location of the swarm was in an area ~1 km W of downtown Pozzuoli, in the same area as the swarms of 13 October 1983 and 1 April 1984. The significant difference is that this time we were able to identify three low-frequency events that occurred at the beginning of the swarms. They had unclear onsets and a typical frequency of ~1 Hz. Two were sufficiently well-recorded on many stations of the network to have a good location, in the same area as the swarm. These events have remained isolated so far, but we have alerted personnel to look carefully for other occurrences. We cannot exclude the possibility that other occurrences may have passed unnoticed. Unfortunately, the bad season, with frequent sea storms, and high human background noise may have completely hidden the low-level seismic activity.
"Four magnitude 3+ earthquakes occurred 1-2 June near Solfatara Crater on the E edge of the active seismic area, where we again observed that the most energetic events occur. Two events of magnitude 3.3 and 2.6 occurred 17 June on the E side of the caldera near the Nisida Peninsula, and a magnitude 3.6 event on 27 June was located in the center of the Gulf of Pozzuoli. They are the most energetic events that have occurred in these areas. On 1 July, a M 3.6 event started a swarm of more than 100 events near Solfatara Crater. Another M 3.5 event occurred during this swarm.
"Uplift measured by the Pozzuoli tide gauge was ~1 mm/day 1-24 June. A new tide gauge was installed on the E border of the caldera (in Nisida) to monitor the differential movement of the caldera. It gave a value of 0.2 mm/day 1-24 June. A levelling survey was completed in June. Preliminary data indicate a maximum uplift of 17 cm with respect to March 1984. The center of maximum uplift remained in the same area as in previous levellings totaling 160 cm since January 1984.
"At the end of May, divers reported a visible increase in submarine fumarolic activity in the Gulf of Pozzuoli, in front of Monte Nuovo Crater (site of the last eruption at Campi Flegrei, in 1538). We still do not know how to monitor this activity. A few pictures have been taken at different times, but we do not know if the increased activity occurs episodically.
"Radon measurements have been routinely performed since April 1983 in two water wells. They gave evidence of a strong peak (of probable seasonal origin) during the winter (figure 7). Fluctuations of smaller period are superimposed on the trend. Fumarole temperatures in Solfatara Crater remained at 158° and 110°C, with variations of only a few degrees.
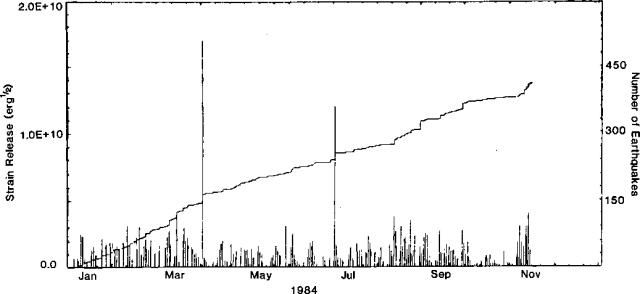 |
Figure 7. Daily number of earthquakes at Campi Flegrei (vertical lines) and cumulative strain release (curve), January-November 1984. Courtesy of OV. |
"Discussions have been carried out on the character of recognizable short-term precursors, if any, of a possible volcanic event in the area. We were strongly relying on a significant increase in seismic activity days before an eruption. We based this assumption on historic chronicles of the eruption of Monte Nuovo. The occurrence of three swarms without any evident volcanic activity has reduced our confidence in recognizing a swarm as a possible precursor of volcanic activity. The maximum duration of a swarm has been 6 hours. We are now relying on the total energy release during a swarm and on the character of the seismic activity. We have never observed harmonic tremor or a significant number of low-frequency events. The deformation rate is another possible precursor, but we could recognize it as a precursor if a significant uplift occurred in a matter of days before a volcanic event. The magnitude of the uplift should be at least the same as the daily sea tide (tens of cm). We are planning the installation of more tide gauges, to be able to detect more localized uplift if it occurs. Geochemical monitoring is presently carried out mainly in Solfatara Crater; plans have been made to extend this monitoring to other areas.
"The beginning of the summer season is increasing the demographic pressure on the area. The evacuation order in the central part of the caldera is not strictly enforced. The high density of population of the area (250,000 people live within the caldera) is posing a tremendous problem with respect to the measures that should be taken to reduce the hazard.
"The length of the present crisis (two years since the beginning of uplift) has produced a social impact and economic loss comparable to that of an actual eruption. The researchers, devoted to the difficult task of monitoring and understanding the development of the phenomenon, suffer from the accumulated stress of being responsible for the lives of thousands of people."
Information Contacts: G. Luongo and R. Scandone, OV; F. Barberi, Univ. di Pisa.
More M > 3 events with wider distribution, but seismic energy release unchanged and uplift slows
"Activity at Campi Flegrei displayed some changes July-September. The monthly mean uplift velocity was in the range of 1.2 mm/day at Pozzuoli and
"Seismic energy release remained at the same level as in the past year. We observed a higher number of the most energetic events (M 3) than in past months (table 1). They are also no longer confined within the restricted area around Solfatara Crater, but instead occur all over the seismically active area.
Table 1. Magnitudes of the most energetic events in the Campi Flegrei area, July-September 1984.
| Date | Magnitude |
| 01 Jul 1984 | 3.7, 3.5 |
| 11 Jul 1984 | 3.8 |
| 22 Aug 1984 | 3.6 |
| 29 Aug 1984 | 3.9, 3.8 |
| 12 Sep 1984 | 3.3 |
| 13 Sep 1984 | 3.2 |
| 28 Sep 1984 | 3.5, 3.7 |
"The temperatures of fumaroles in Solfatara Crater remained stable. The radon content of the water wells reached a minimum in the last year, with a slight increase again at the end of September.
"The decrease in the uplift velocity during constant seismic energy release does not support the idea that uplift velocity is closely related to the occurrence of larger earthquakes. On the contrary, in this last period we have observed higher-energy events. They often occur as double events (1 July, 29 August and 28 September; table 1). The area that was previously affected by swarms of low-energy events (1 km W of Pozzuoli) is now also affected by high-energy events. We do not know if this pattern of activity indicates a higher risk of eruption."
Information Contacts: G. Luongo and R. Scandone, OV; F. Barberi, Univ. di Pisa.
Uplift stops in October, but resumes in November
"Activity at Campi Flegrei declined in October. The velocity of uplift, as measured by the tide gauge at Pozzuoli, was null for the entire month and seismic activity was very low. This was the first substantial decrease in activity observed since the beginning of the crisis in the summer of 1982 (figures 7 and 8). A new increase in seismic activity was observed during the first week of November with a M 2.7 earthquake on the 5th. During the second week, uplift started again with a mean velocity of 1 mm/day. On 8 November, events of magnitude 3.2, 3.2, 2.8, and 3.3 occurred in the Gulf of Pozzuoli. Other events occurred on the 10th (M 2.9) and 11th (M 3). Minor events occurred during the third week, but uplift velocity remained at 1 mm/day. During the last week in November, uplift velocity rose to 2.5 mm/day with two earthquakes (M 3.1, M 2.9) on 26 November and several others of lower magnitude.
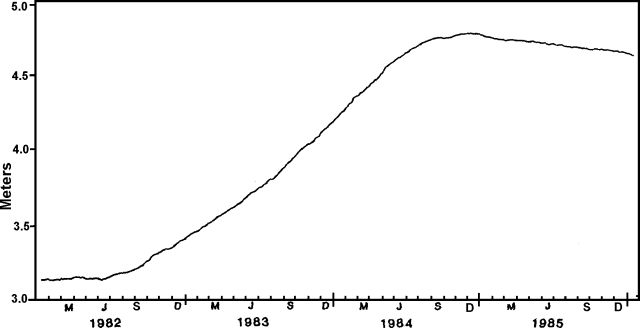 |
Figure 8. Ground movements at Campi Flegrei measured by the tide gauge in Pozzuoli Harbor, January 1982-December 1985. Courtesy of Roberto Scandone. |
"The temperatures of fumaroles in Solfatara Crater remained constant at 156°C. A new fumarolic vent opened in the crater during the night of 16-17 November with a violent emission of steam.
"Figure 9 shows the distribution of the 181 best-located events between January 1983 and May 1984. These events were recorded at more than 12 stations and have an (rms) less than 0.1. The figure shows an alignment of the January 1983-May 1984 epicenters on land along a N110°E direction with a clustering of the stronger earthquakes around Solfatara Crater. The earthquake area is limited on the E by the remains of the old Agnano Crater and on the west by Monte Nuovo Crater. A striking feature is that the earthquakes occur mainly along the coastline and the remains of an old marine terrace which uplifted some 40 m about 5,000 years BP.
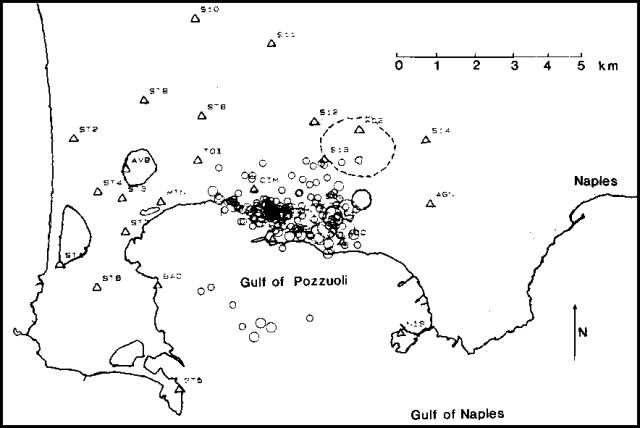 |
Figure 9. Distribution of the epicenters of the 181 best-located seismic events at Campi Flegrei, January 1983-May 1984. Triangles mark seismic stations. Courtesy of OV. |
"Figure 10 shows two perpendicular sections of the same data set. The N20°E section shows two clusters of events, on land and in the sea, with an aseismic area in the middle. The same section shows the rather abrupt boundary between the seismically active areas on land and in the sea. Most of the earthquakes occur between 2 and 3 km depth, but these data are still preliminary due to the uncertainties of the velocity model."
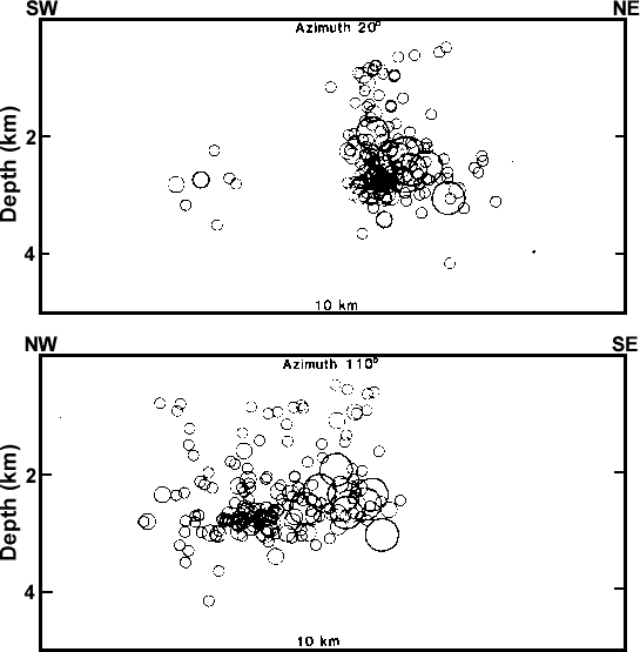 |
Figure 10. Epicenters in figure 9 projected onto cross sections oriented N20°E, left, and N110°E, right. Courtesy of OV. |
Information Contacts: G. Luongo and R. Scandone, OV; F. Barberi, Univ. di Pisa.
Seismicity declines; slight deflation
"A magnitude 3.8 earthquake occurred on 8 December and was located on the E side of Solfatara Crater. After this event, the seismic activity was very low during December and January. During December the tide gauges in the Gulf of Pozzuoli recorded no uplift of the ground in the area. In the second week of January, a slight deflation was measured by the Pozzuoli tide gauge. Only the radon contents of water in monitored wells showed an increase. In mid-November the values were similar to those in the corresponding period of December 1983-January 1984. We are waiting for a longer quiescence period before releasing a ceased alert warning."
Information Contacts: G. Luongo and R. Scandone, OV; F. Barberi, Univ. di Pisa.
Deflation continues and seismicity weak
"Activity at Campi Flegrei has decreased substantially after 2.5 years of continuous ground uplift and seismic activity. The tide gauge in Pozzuoli harbor measured 2 cm of ground subsidence during February (figure 8). Seismic activity remained at a very low level with only a few low-energy events in the Gulf of Pozzuoli. The periodic survey of the entire vertical deformation network was completed in January. An uplift of 3 cm since October 1984 was measured on the benchmark in the area of maximum deformation (figure 11).
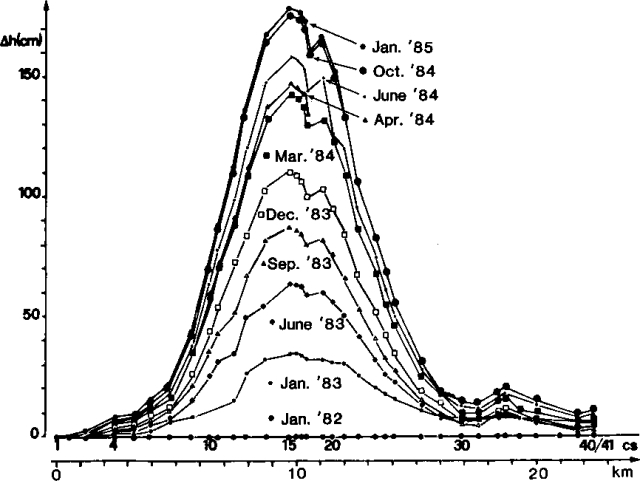 |
Figure 11. Results of 10 surveys of the levelling network at Campi Flegrei, January 1982-January 1985. Benchmarks are oriented along an approximately E-W line (see figure 1 for their locations). |
"Radon and temperature measurements are currently made in four water wells. The pattern of radon content of two of them, near Solfatara (Tortorelli well) and Monte Nuovo (Damiani well), shows good correlation (figure 12). At the present time, we observe high radon emission, similar to observations in the same period last year. The two years of continuous monitoring give evidence of a seasonal trend in radon emission.
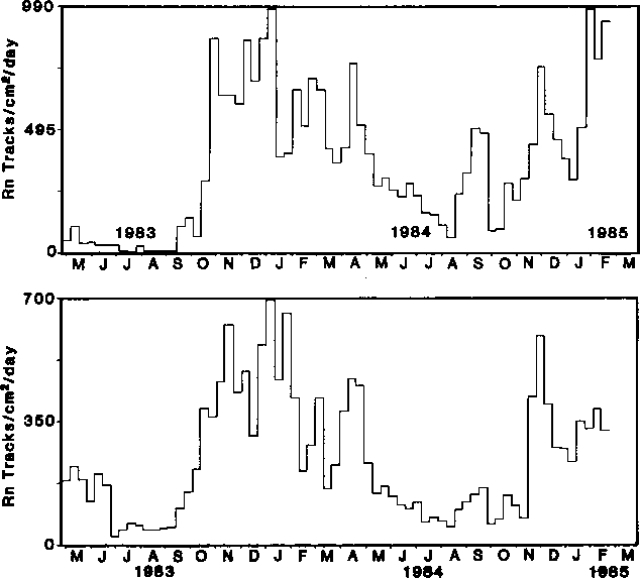 |
Figure 12. Results of radon measurements from two water wells at Campi Flegrei: top, near Solfatara, 26 April 1983-2 March 1985 (Tortorelli); bottom, near Monte Nuovo, 26 April 1983-25 February 198 (Damiani). Courtesy of OV. |
A possible increase, due to influx of hot fluids from depth, may have occurred December 1983-April 1984. During this period, a slight but significant increase in water temperature was observed (figure 13), which matches well with the period of highest seismic energy release. A more detailed study is under way.
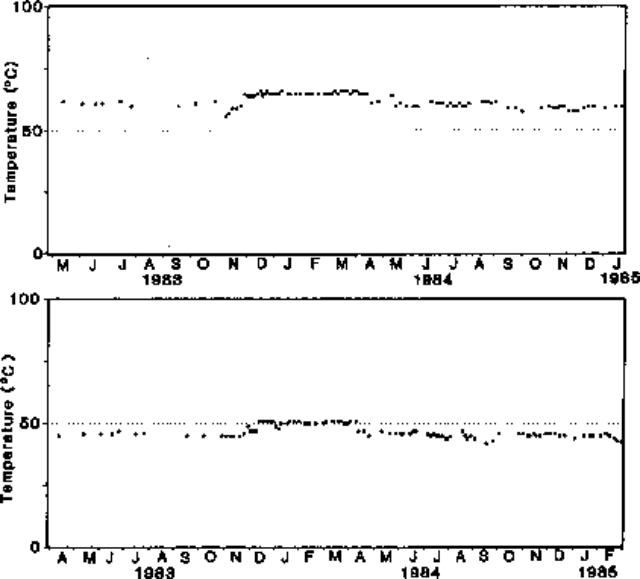 |
Figure 13. Temperature measurements at the same wells as in figure 12: top, 26 April 1983-23 January 1985 (Tortorelli); bottom, 30 March 1983-2 March 1985 (Damiani). Courtesy of OV. |
"A maximum uplift of 180 cm has occurred since June 1982, and 320 cm since 1969 (figure 14). The moderate seismic activity during the present crisis has caused extensive damage to old buildings. We consider this period of unrest as the major geological event at Campi Flegrei in the last 180 years (since the first measurements of sea level in the area). The order of magnitude of the ground uplift during the last 16 years is comparable to that which occurred before the eruption of Monte Nuovo in 1538, and we consider this phase as a possible precursor (on a time scale of years) to new volcanic activity.
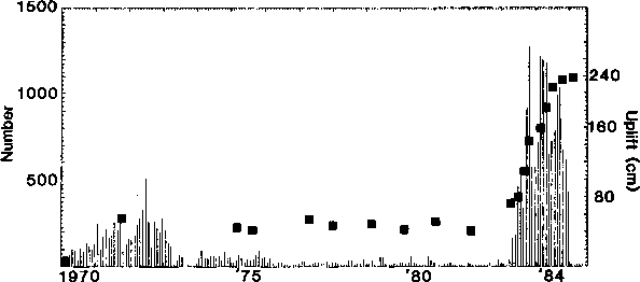 |
Figure 14. Uplift and seismicity at Campi Flegrei, 1970-84. Squares show relative height of benchmark no. 15 of the levelling network (see figure 2), vertical lines show monthly number of seismic events. Courtesy of OV. |
"If the present crisis follows the same pattern as that of 1969-72, we must expect a period of slight subsidence, followed by a period of slight oscillations of the ground level, until a new crisis eventually occurs. The reversal of the secular pattern of subsidence of the area (the most significant in 450 years) that occurred in 1969, along with the relatively long period of quiescence of Vesuvius (since 1944; 6 times longer than any repose period since 1694) may all be related to a change in the stress field controlling volcanic activity in the Naples area."
Further References. Barberi, F., Hill, D., Innocenti, F., Luongo, G., and Treiul, M., eds., 1984, The 1982-1984 bradyseismic crisis at Phlegraean Fields (Italy): B.V., v. 47, no. 2, p. 173-370 (21 papers).
Rosi, M, and Sbrana, A., eds., 1987, Phlegrean Fields: Quaderni de "La Ricerca Scientifica" 114, v. 9, 176 p.
Lirer, L., Luongo, G., and Scandone, R., 1987, On the volcanological evolution of Campi Flegrei, Italy: EOS, v. 68, no. 16, p. 226-234.
Information Contacts: G. Luongo, R. Scandone, and R. Pece, OV; F. Barberi, Univ. di Pisa.
Gradual aseismic subsidence
"Since January 1985, there has been no detectable seismic activity at Campi Flegrei [and] the ground has been subsiding at a mean rate of ~1 cm/month without any seismic activity (figure 15). The pattern of ground deformation during the crisis of 1982-84 was similar to that during 1970-72. The . . . latter crisis was accompanied by moderate seismic activity during the uplift phase. Gas monitoring of fumaroles in Solfatara Crater showed no significant changes in the past year.
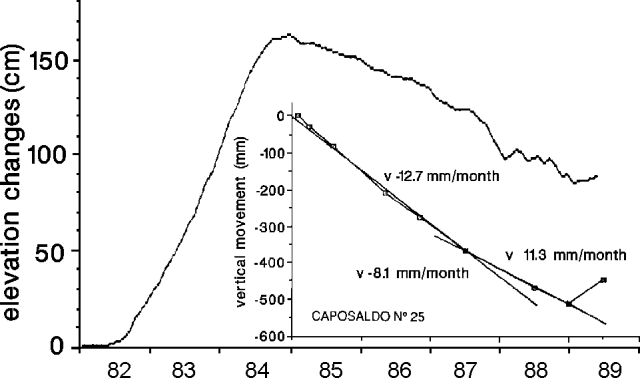 |
Figure 15. Changes in elevation (in cm) in the Campi Flegrei area recorded by a tide gauge at Pozzuoli, 1982-89. Inset shows vertical movement (in mm) at the point of maximum uplift on the Campi Flegrei levelling line, 1985-89. |
"During the past year, people from Pozzuoli have slowly been moving back into the town. The new settlement on the NW side of the caldera has almost been completed, but it is not certain that all of the people evacuated from the town will move in. The fears of an impending eruption are already gone, and the interest of the media has vanished."
Information Contacts: G. Luongo and R. Scandone, Osservatorio Vesuviano (OV); F. Barberi, Univ di Pisa.
Inflation and seismicity resume after 4-year hiatus
From the beginning of 1985 until the end of 1988, activity . . . was characterized by a generally deflationary trend, but uplift then resumed and a maximum uplift of 7.2 cm was measured in June.
The surveillance network operated by OV consists of eight seismic stations, five tide gauges (four in the Gulf of Pozzuoli, one in Naples for comparison), and four electronic tiltmeters (figure 16). Periodic levelling measurements are made on an extended line and distance measurements are performed twice a year. Radon content and water temperature are monitored in four water wells. Periodic measurements of S/C ratio and water vapor content of fumarolic emissions are made at Solfatara Crater.
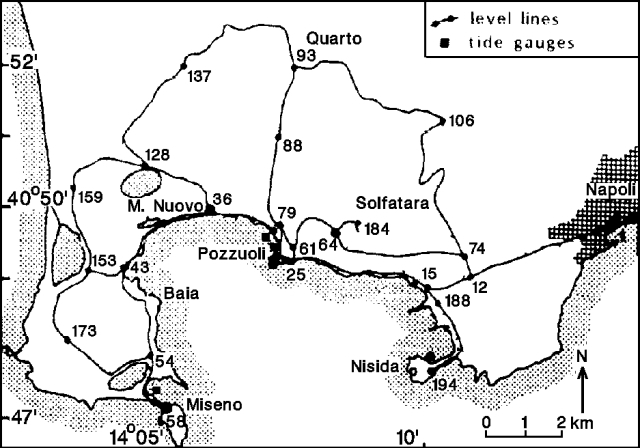 |
Figure 16. Levelling network and tide gauges at Campi Flegrei. |
Deformation. Vertical motion recorded by the tide gauge in Pozzuoli harbor showed steady deflation until mid-1987 (figure 15). The record then became more oscillatory and some uplift episodes were observed in the general deflationary trend. Figure 15 also shows vertical motion recorded on the levelling line at benchmark 25 (the site of maximum vertical deformation). A steady trend with an average rate of -12.7 mm/month was observed until mid-1987. From then until the beginning of 1989 a decrease in the subsidence rate was observed, and a net uplift of 7.2 cm was measured January-June 1989. Since the end of 1988, four tilt stations have been installed at Campi Flegrei. They are 2-component horizontal pendulum systems with resolutions of 6.9 and 14.5x10⁻⁹ rad for the radial and tangential components, respectively. One tiltmeter is in Baia Castle (on the W side of the bay), the other three along an abandoned tunnel roughly 2.5-3.5 km N of Pozzuoli pier. Different trends were observed December 1987-June 1989, showing complex local movement still not fully understood. Two periods of inclination toward the SE were observed, 10 December 1987-12 February 1988 and 22 March-7 April 1988, compatible with deflation of the area of maximum vertical deformation. In other periods the trends were less compatible with this feature, as if the source of deformation had changed its center. Particularly notable was the rotation of the vector after March 1989, indicating an inclination toward the ENE.
Seismicity. No seismic events were observed from 1985 through the beginning of 1987. Since April 1987, several swarms have been observed (figures 17 and 18): 10 April 1987, 50 events, maximum M 2, W sector of Solfatara; 4 November 1987, 26 events, maximum M 1.1, E sector of Solfatara; March 1989, 15 events, Solfatara area; 3 April 1989, 82 events, maximum M 2.2, Solfatara; May 1989, 33 events, maximum M 2.2, Solfatara; 1-13 June 1989, 45 events, maximum M 2.7. Most notable was the occurrence of several low-frequency events, the first time that such events have been observed. They were generally shallow and on the E border of Solfatara crater.
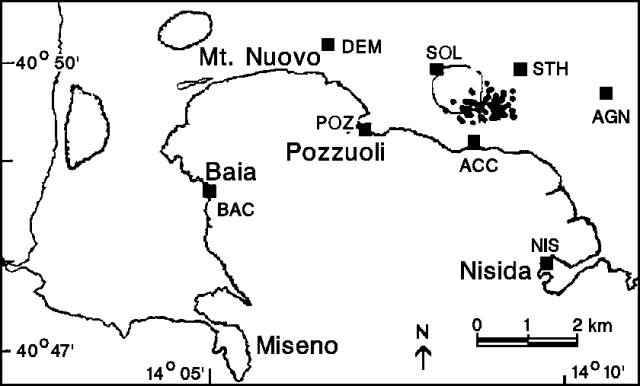 |
Figure 17. Seismic stations (large squares) and March-June 1989 earthquake epicenters (diamonds) in the Campi Flegrei area. |
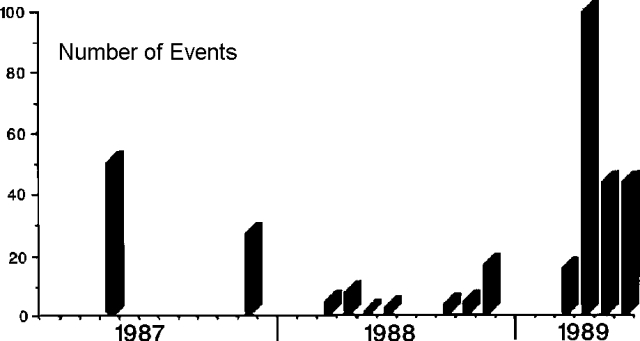 |
Figure 18. Number of local earthquakes recorded in the Campi Flegrei area, January 1987-June 1989. |
Chemistry. The Costagliola well near Monte Nuovo has shown a clear increase in average radon content superimposed on annual variations. A similar trend is apparent for radon contents measured in water wells in different parts of Campi Flegrei. Both the S/C ratio and the water vapor content of a fumarole at Solfatara showed a steady increase starting in mid-1986.
Geologists noted that "All of these data seem to indicate a progressive change in the style of activity . . . , and it seems that the steady deflationary trend has come to an end. We still do not know if the picture we have described is the precursor of a new prolonged uplift phase, or if it represents the restoration of a trend similar to that after the 1970-72 uplift episode, characterized by oscillatory activity until 1982. It is notable, however, that Campi Flegrei is displaying in each new episode of unrest a new phenomenon that was not observed in the previous one. In 1970-72 there was a major uplift without significant seismic activity, and in 1982-84 there was uplift accompanied by seismic activity. In this case, although we still do not know if a sustained uplift will occur, there is the occurrence of low-frequency seismic events."
Further Reference. Tedesco, D., Bottiglieri, L., and Pece,R., 1988, 10th of April 1987 seismic swarm; correlation with geochemical parameters in Campi Flegrei Caldera (southern Italy): Geophysical Research Letters, v. 15, p. 661-664.
Information Contacts: G. Luongo, C. Del Gaudio, F. Obrizzo, G. Ricciardi, and D. Tedesco, OV; R. Pece and R. Scandone, Univ di Napoli.
Increase in sulfate concentrations and fumarole temperatures
Since the ground upheaval events of 1982-84, systematic geochemical surveillance has been performed at Campi Flegrei. Fumarolic gases, crater lakes, and thermal springs have been monitored; since 1984, no significant physical or chemical changes have occurred.
However, two characteristics showed a statistically significant change; the temperature in the Bocca Grande fumarole increased (figure 19) and the sulfate concentration in crater lakes and thermal springs increased sharply during 1995-97 (figure 20). These increases may have resulted from a perturbation in the area caused by increased permeability; thus the interaction of confined, hot, sulfate-rich aquifers may have increased.
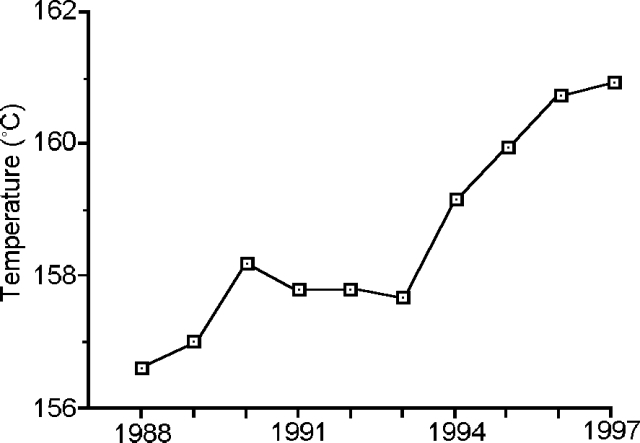 |
Figure 19. Temperature of Bocca Grande fumarole at Campi Flegrei during 1988-97. Courtesy of M. Martini. |
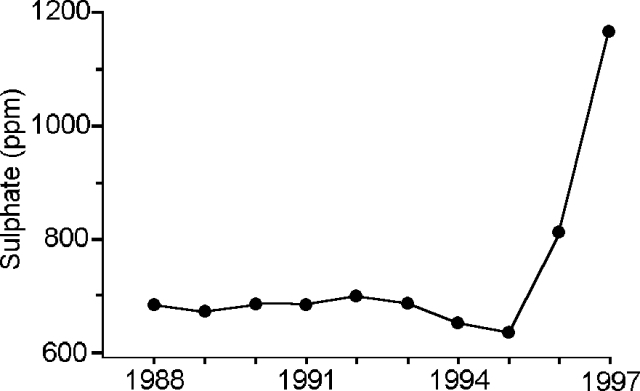 |
Figure 20. Sulfate concentration in crater lakes and thermal springs at Campi Flegrei, 1988-97. Courtesy of M. Martini. |
Information Contacts: Marino Martini, Dipartimento di Scienze della Terra, Università di Firenze, Via La Pira 4, 50125, Firenze, Italy.
Variable sulfate concentration; rising temperatures and other increases
Regular geochemical surveys of Campi Flegrei's fumarolic gases, crater lakes, and thermal springs (figure 21) have led to the following conclusions. First, the temperature of Bocca Grande continued the increase noted in 1997. Second, the sulfate concentration increase noted in 1997 for crater lakes and thermal springs was a "transitory event" caused by the unstable underlying geothermal system. Third, there have been shifts in the f (phi) function, an empirical relationship related to fumarolic gas chemistry (Martini, 1996). The f function acted as an empirical indicator of ground upheaval during the events of 1982-85. Since 1996 the f function has steadily increased to levels not observed since 1982-85 (figure 21).
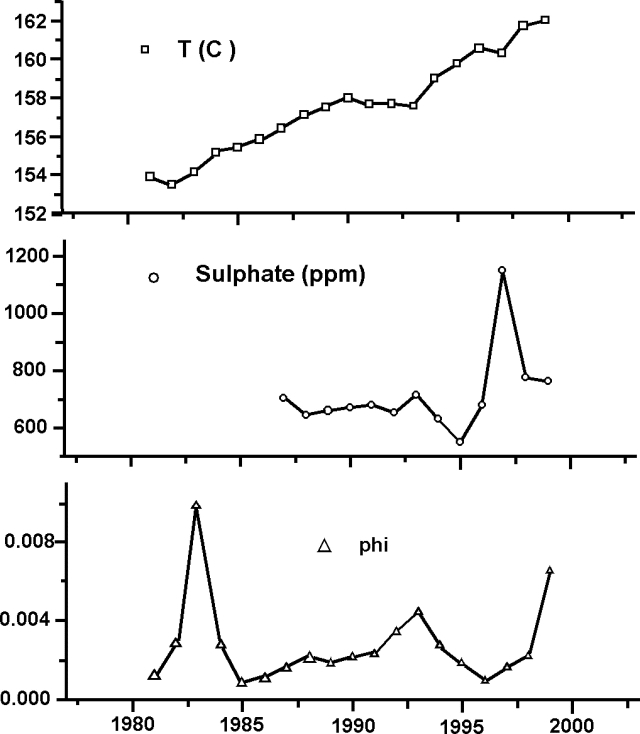 |
Figure 21. Campi Flegrei hydrothermal data plotted for 1980-late 1999. Courtesy of Marino Martini. |
Reference. Martini, M., 1996, Chemical character of the gaseous phase in different stages of volcanism: precursors and volcanic activity, in Scarpa and Tilling (eds.) Monitoring and mitigation of volcano hazards: Springer, Berlin, p. 199-219.
Information Contacts: Marino Martini, Dipartimento di Scienze della Terra, Università di Firenze, Via La Pira 4, 50125, Firenze, Italy.
Analysis of seismic swarms (Mw =1.9; ~219 events) during September 2012
219 low-magnitude earthquakes occurred at Campi Flegrei during September 2012, a comparatively large number with respect to the previous year (figure 22). The earthquakes chiefly were contained within two swarms (with events up to Mw 1.9; Mw indicates moment magnitude) occurring on 7 and 15 September. Peak ground accelerations (PGA) were non-trivial (up to ~0.5 g), and some earthquakes were widely felt by area residents. Analysis revealed that the strain release rate of the 7 September swarm fell within values seen for other swarms during the last 20 years. The observations reported by the Vesuvius Observatory (who provided the material for this report) were limited to those associated with the earthquakes and related seismic analysis. Other reporting on topics such as deformation appears on the Observatory's website (see Information Contacts, below). The observatory is part of Italy's National Institute of Geophysics and Volcanology (INGV).
|
Figure 22. Campi Flegrei earthquake count recorded between October 2011 and the end of September 2012. (A) The number of earthquakes recorded per month during October 2011-September 2012 (288 total events). (B) The number of earthquakes recorded during September 2012 alone (219 total events), highlighting the swarm of 188 events on 7 September. Courtesy of Vesuvius Observatory-INGV (Naples). |
Almost all of the earthqaukes that occurred during September took place in two swarms (figures 22 and 23). The first swarm occurred in the area of Pozzuoli during 0715-0935 UTC on 7 September. The two largest events of that swarm were Mw 1.9 (a duration magnitude, Md, value of 1.7; figure 24); these events were the largest recorded events of the prior year (figure 24A). The 7 September swarm was dominant over the 15 September swarm both in terms of the number and magnitude of events.
|
Figure 23. (A) Hypocentral locations registered at Campi Flegrei during October 2011-August 2012 (blue) and September 2012 (red). The size of the symbols is proportional to the magnitude, as shown in the lower right box. (B) A map with the seismic network at Campi Flegrei. The boxed area zooms in on the region where the two swarms occured. Courtesy of Vesuvius Observatory-INGV (Naples). |
|
Figure 24. Magnitudes (duration magnitude, Md) of seismic events recorded at Campi Flegrei during October 2011-September 2012 (A). (B) shows the details of the computed magnitudes during the September 2012 seismic swarm. Courtesy of Vesuvius Observatory-INGV (Naples). |
The second swarm of September 2012 took place between 0901 and 1012 UTC on 15 September (figure 22), with the strongest events (Md -0.3) occurring at 0947 and 0954 UTC. This swarm was recorded by only one station (STH, Agnano, figure 23B) and thus was plausibly located in close proximity to that station at shallow depth. This swarm is absent on the depth plot in figure 25 (depth not available).
|
Figure 25. Time series plots of the hypocentral depths of seismic events recorded at Campi Flegrei during October 2011-September 2012 (A) and during September 2012 (B) showing details of the September 2012 seismic swarm. Courtesy of Vesuvius Observatory-INGV (Naples). |
The hypocenters of 49 events were determined during September 2012; their depths were generally less than 4 km (figures 23 and 25). The seismological parameters did not show significant anomalies (figures 24 and 25). However, September 2012 was the most seismically energetic time period of the prior year (figure 26); seismicity during September produced >3 times the cumulative energy released during the preceding year.
|
Figure 26. Cumulative seismic energy released at Campi Flegrei during (A) October 2011-September 2012 and (B) September 2012. Courtesy of Vesuvius Observatory-INGV (Naples). |
Analysis of the 7 September seismic swarm. For the two main events (0734 and 0825 UTC) on 7 September, source parameters were determined from S-wave displacement spectra (results shown in figure 27).
|
Figure 27. Displacement spectra (blue) for the S-waves of the largest events in the 7 September 2012 seismic swarm, occurring at 0734 (top) and 0825 UTC (bottom). The red curves represent the fit with a theoretical model. The displacement spectra were obtained from the records of the accelerometer CPOZ (Pozzuoli, figure 23B). The tabulated values display the computed source parameters for each event: Mw, moment magnitude; Md, duration magnitude; Fc, corner frequency; R (m), source radius, and stress drop (bars). For discussion of source parameters see Mooney (1989). Courtesy of Vesuvius Observatory-INGV (Naples). |
The duration and strain release of the 7 September swarm were similar to other seismic swarms at Campi Flegrei since at least 1994 (figure 28).
|
Figure 28. A plot showing duration and strain release rate for Campi Flegrei seismic swarms since 1994. Courtesy of Vesuvius Observatory-INGV (Naples). |
Some of the events in the swarm were widely felt in the urban area of Pozzuoli. Peak ground acceleration values (PGA, units of %g, the acceleration due to gravity) recorded by the accelerometer in Pozzuoli (CPOZ, figure 23B) show two prominent peaks corresponding to the two largest events that occurred at 0734 and 0825 UTC (figure 29).
|
Figure 29. Peak ground acceleration values (PGA, in units of %g, the acceleration due to gravity) recorded by the accelerometer CPOZ (Pozzuoli, figure 23B) between 0700 and 1100 UTC on 7 September 2012. The visible gap in the data between 0722 and 0733 was caused by technical problems in the data transmission system. The two largest events are labelled with their timestamps and PGA values. Courtesy of Vesuvius Observatory-INGV (Naples). |
Reference. Mooney, W.D., 1989. Seismic methods for determining earthquake source parameters and lithospheric structure, in Pakiser, L.C. and Mooney, W.D. (eds), Geophysical framework of the continental United States, Geological Society of America Memoir 172.
Information Contacts: Vesuvius Observatory, National Institute of Geophysics and Volcanology (INGV), Via Diocleziano 328, 80124 Napoli, Italy (URL: http://www.ov.ingv.it/ov/).
This compilation of synonyms and subsidiary features may not be comprehensive. Features are organized into four major categories: Cones, Craters, Domes, and Thermal Features. Synonyms of features appear indented below the primary name. In some cases additional feature type, elevation, or location details are provided.
Synonyms |
||||
| Phlegraean Fields | Phlegraeishe Felder | Champes Phlegrais | ||||
Cones |
||||
| Feature Name | Feature Type | Elevation | Latitude | Longitude |
| Archiaverno | Tuff cone | |||
| Astroni | Tuff ring | 253 m | ||
| Averno | Tuff ring | |||
| Baia | Tuff ring | |||
| Banco Di Nisida | Tuff cone | -72 m | ||
| Banco Miseno | Cone | -26 m | ||
| Fiumicello | Tuff ring | |||
| Fondi di Baia | Tuff ring | 95 m | ||
| Fondo Riccio | Cone | |||
| Gauro | Tuff cone | 331 m | ||
| Miseno, Cabo | Tuff cone | 155 m | ||
| Nisida | Tuff cone | 109 m | ||
| Nuovo, Monte | Tuff cone | 132 m | 40° 50' 0" N | 14° 6' 0" E |
| Penta Palummo | Cone | |||
| Punta Serra | Tuff ring | |||
| Sant'Angelo, Monte | Cone | 172 m | ||
| Senga, Monte | Cone | 107 m | ||
| Solchiaro | Tuff ring | |||
| Terra Murata | Tuff ring | |||
| Torre Gaveta | Cone | |||
| Vivara | Tuff ring | |||
Craters |
||||
| Feature Name | Feature Type | Elevation | Latitude | Longitude |
| Agnano | Caldera | |||
| Agnano Monte Spina | Crater | |||
| Bacoli | Crater | |||
| Bellavista | Crater | |||
| Belvedere | Crater | |||
| Campanian Ignimbrite | Pleistocene caldera | |||
| Celle | Crater | |||
| Cigliano | Crater | 212 m | ||
| Concola | Crater | |||
| Contrada Murera | Crater | |||
| Coste San Domenico | Crater | |||
| Fossa Lupara | Crater | |||
| Grotta del Cane | Crater | |||
| Minopoli | Crater | |||
|
Mofete
Rione delle Mofete |
Crater | |||
| Monticelli | Crater | |||
| Neapolitan Yellow Tuff | Pleistocene caldera | |||
| Pietra, La | Crater | |||
| Pigna San Nicola | Crater | 215 m | ||
| Pisani | Crater | |||
| Porto Miseno | Crater | |||
| Rione Terra | Crater | |||
| Romano | Crater | |||
| Rusciello, Monte | Crater | |||
| San Giacomo | Crater | |||
| San Martino | Crater | |||
| Santa Teresa, Monte | Crater | |||
| Sartania | Crater | |||
| Solfatara | Crater | |||
| Spaccata, Montagna | Crater | 116 m | ||
| Stoves of Nero | Crater | |||
| Torre Cappella | Crater | |||
| Traversa Campana | Crater | |||
| Trentaremi | Crater | |||
Domes |
||||
| Feature Name | Feature Type | Elevation | Latitude | Longitude |
| Accademia | Dome | 199 m | ||
| Caprara | Dome | |||
| Colle Rotondella | Dome | |||
| Cuma | Dome | 80 m | ||
| Olibano, Mount | Dome | 155 m | ||
| Punta Marmolite | Dome | |||
| San Martino | Dome | 249 m | ||
| San Martino, Isolotto di | Dome | |||
| Spina, Monte | Dome | 162 m | ||
| Vita Fumo | Dome | |||
|
|
||||||||||||||||||||||||||
There is data available for 20 confirmed Holocene eruptive periods.
1538 Sep 29 - 1538 Oct 6 Confirmed Eruption Max VEI: 3
| Episode 1 | Eruption Episode | Monte Nuovo | ||||||||||||||||||||||||||||||||||||||||||||||||||||||||||||||||||||||||||||||||||||||||||||||
|---|---|---|---|---|---|---|---|---|---|---|---|---|---|---|---|---|---|---|---|---|---|---|---|---|---|---|---|---|---|---|---|---|---|---|---|---|---|---|---|---|---|---|---|---|---|---|---|---|---|---|---|---|---|---|---|---|---|---|---|---|---|---|---|---|---|---|---|---|---|---|---|---|---|---|---|---|---|---|---|---|---|---|---|---|---|---|---|---|---|---|---|---|---|---|---|
| 1538 Sep 29 - 1538 Oct 6 | Evidence from Observations: Reported | ||||||||||||||||||||||||||||||||||||||||||||||||||||||||||||||||||||||||||||||||||||||||||||||
|
List of 17 Events for Episode 1 at Monte Nuovo
| |||||||||||||||||||||||||||||||||||||||||||||||||||||||||||||||||||||||||||||||||||||||||||||||
1198 Confirmed Eruption Max VEI: 1
| Episode 1 | Eruption Episode | Solfatara | ||||||||||||||||||||||||||||||||||
|---|---|---|---|---|---|---|---|---|---|---|---|---|---|---|---|---|---|---|---|---|---|---|---|---|---|---|---|---|---|---|---|---|---|---|---|
| 1198 - Unknown | Evidence from Observations: Reported | ||||||||||||||||||||||||||||||||||
|
List of 5 Events for Episode 1 at Solfatara
| |||||||||||||||||||||||||||||||||||
1650 BCE (?) Confirmed Eruption Max VEI: 4
| Episode 1 | Eruption Episode | Fossa Lupara (Monte Senga) | ||||||||||||||||||||||||||||||||||
|---|---|---|---|---|---|---|---|---|---|---|---|---|---|---|---|---|---|---|---|---|---|---|---|---|---|---|---|---|---|---|---|---|---|---|---|
| 1650 BCE (?) - Unknown | Evidence from Correlation: Tephrochronology | ||||||||||||||||||||||||||||||||||
|
List of 5 Events for Episode 1 at Fossa Lupara (Monte Senga)
| |||||||||||||||||||||||||||||||||||
1870 BCE ± 50 years Confirmed Eruption Max VEI: 4
| Episode 1 | Eruption Episode | Astroni | ||||||||||||||||||||||||||||||||||||||||||||||||||||||
|---|---|---|---|---|---|---|---|---|---|---|---|---|---|---|---|---|---|---|---|---|---|---|---|---|---|---|---|---|---|---|---|---|---|---|---|---|---|---|---|---|---|---|---|---|---|---|---|---|---|---|---|---|---|---|---|
| 1870 BCE ± 50 years - Unknown | Evidence from Isotopic: 14C (uncalibrated) | ||||||||||||||||||||||||||||||||||||||||||||||||||||||
|
List of 9 Events for Episode 1 at Astroni
| |||||||||||||||||||||||||||||||||||||||||||||||||||||||
2000 BCE ± 150 years Confirmed Eruption Max VEI: 4
| Episode 1 | Eruption Episode | Averno | |||||||||||||||||||||||||||||||||||||||||||||||||
|---|---|---|---|---|---|---|---|---|---|---|---|---|---|---|---|---|---|---|---|---|---|---|---|---|---|---|---|---|---|---|---|---|---|---|---|---|---|---|---|---|---|---|---|---|---|---|---|---|---|---|
| 2000 BCE ± 150 years - Unknown | Evidence from Correlation: Tephrochronology | |||||||||||||||||||||||||||||||||||||||||||||||||
|
List of 8 Events for Episode 1 at Averno
| ||||||||||||||||||||||||||||||||||||||||||||||||||
2040 BCE (?) Confirmed Eruption Max VEI: 3
| Episode 1 | Eruption Episode | Solfatara | |||||||||||||||||||
|---|---|---|---|---|---|---|---|---|---|---|---|---|---|---|---|---|---|---|---|---|
| 2040 BCE (?) - Unknown | Evidence from Correlation: Tephrochronology | |||||||||||||||||||
|
List of 2 Events for Episode 1 at Solfatara
| ||||||||||||||||||||
2080 BCE ± 75 years Confirmed Eruption Max VEI: 2
| Episode 1 | Eruption Episode | Monte Olibano-Accademia | |||||||||||||||||||||||||||||
|---|---|---|---|---|---|---|---|---|---|---|---|---|---|---|---|---|---|---|---|---|---|---|---|---|---|---|---|---|---|---|
| 2080 BCE ± 75 years - Unknown | Evidence from Correlation: Tephrochronology | |||||||||||||||||||||||||||||
|
List of 4 Events for Episode 1 at Monte Olibano-Accademia
| ||||||||||||||||||||||||||||||
2150 BCE ± 500 years Confirmed Eruption Max VEI: 5
| Episode 1 | Eruption Episode | Agnano Monte Spina | ||||||||||||||||||||||||||||||||||||||||||||||||||||||
|---|---|---|---|---|---|---|---|---|---|---|---|---|---|---|---|---|---|---|---|---|---|---|---|---|---|---|---|---|---|---|---|---|---|---|---|---|---|---|---|---|---|---|---|---|---|---|---|---|---|---|---|---|---|---|---|
| 2150 BCE ± 500 years - Unknown | Evidence from Isotopic: 14C (uncalibrated) | ||||||||||||||||||||||||||||||||||||||||||||||||||||||
|
List of 9 Events for Episode 1 at Agnano Monte Spina
| |||||||||||||||||||||||||||||||||||||||||||||||||||||||
2220 BCE ± 50 years Confirmed Eruption
| Episode 1 | Eruption Episode | Eastern NYT caldera, Paleoastroni 2 tephra | ||||||||||||||||||||||||||||||||||
|---|---|---|---|---|---|---|---|---|---|---|---|---|---|---|---|---|---|---|---|---|---|---|---|---|---|---|---|---|---|---|---|---|---|---|---|
| 2220 BCE ± 50 years - Unknown | Evidence from Isotopic: 14C (uncalibrated) | ||||||||||||||||||||||||||||||||||
|
List of 5 Events for Episode 1 at Eastern NYT caldera, Paleoastroni 2 tephra
| |||||||||||||||||||||||||||||||||||
2330 BCE ± 150 years Confirmed Eruption Max VEI: 3
| Episode 1 | Eruption Episode | Paleoastroni 1 tephra | ||||||||||||||||||||||||||||||||||
|---|---|---|---|---|---|---|---|---|---|---|---|---|---|---|---|---|---|---|---|---|---|---|---|---|---|---|---|---|---|---|---|---|---|---|---|
| 2330 BCE ± 150 years - Unknown | Evidence from Correlation: Tephrochronology | ||||||||||||||||||||||||||||||||||
|
List of 5 Events for Episode 1 at Paleoastroni 1 tephra
| |||||||||||||||||||||||||||||||||||
2440 BCE (?) Confirmed Eruption
| Episode 1 | Eruption Episode | Agnano-Monte Sant'Angelo | ||||||||||||||||||||||||||||||||||
|---|---|---|---|---|---|---|---|---|---|---|---|---|---|---|---|---|---|---|---|---|---|---|---|---|---|---|---|---|---|---|---|---|---|---|---|
| 2440 BCE (?) - Unknown | Evidence from Isotopic: 14C (uncalibrated) | ||||||||||||||||||||||||||||||||||
|
List of 5 Events for Episode 1 at Agnano-Monte Sant'Angelo
| |||||||||||||||||||||||||||||||||||
2500 BCE (?) Confirmed Eruption Max VEI: 4
| Episode 1 | Eruption Episode | Cigliano | ||||||||||||||||||||||||||||||||||
|---|---|---|---|---|---|---|---|---|---|---|---|---|---|---|---|---|---|---|---|---|---|---|---|---|---|---|---|---|---|---|---|---|---|---|---|
| 2500 BCE (?) - Unknown | Evidence from Correlation: Tephrochronology | ||||||||||||||||||||||||||||||||||
|
List of 5 Events for Episode 1 at Cigliano
| |||||||||||||||||||||||||||||||||||
2580 BCE ± 50 years Confirmed Eruption
| Episode 1 | Eruption Episode | Averno 1, Agnano 2 tephras | |||||||||||||||||||||||||||||
|---|---|---|---|---|---|---|---|---|---|---|---|---|---|---|---|---|---|---|---|---|---|---|---|---|---|---|---|---|---|---|
| 2580 BCE ± 50 years - Unknown | Evidence from Isotopic: 14C (uncalibrated) | |||||||||||||||||||||||||||||
|
List of 4 Events for Episode 1 at Averno 1, Agnano 2 tephras
| ||||||||||||||||||||||||||||||
2890 BCE ± 50 years Confirmed Eruption
| Episode 1 | Eruption Episode | East part of NYT caldera, Agnano 1 tephra | ||||||||||||||||||||||||
|---|---|---|---|---|---|---|---|---|---|---|---|---|---|---|---|---|---|---|---|---|---|---|---|---|---|
| 2890 BCE ± 50 years - Unknown | Evidence from Isotopic: 14C (uncalibrated) | ||||||||||||||||||||||||
|
List of 3 Events for Episode 1 at East part of NYT caldera, Agnano 1 tephra
| |||||||||||||||||||||||||
6300 BCE ± 50 years Confirmed Eruption
| Episode 1 | Eruption Episode | N part of NYT caldera (San Martino) | |||||||||||||||||||||||||||||||||||||||
|---|---|---|---|---|---|---|---|---|---|---|---|---|---|---|---|---|---|---|---|---|---|---|---|---|---|---|---|---|---|---|---|---|---|---|---|---|---|---|---|---|
| 6300 BCE ± 50 years - Unknown | Evidence from Isotopic: 14C (uncalibrated) | |||||||||||||||||||||||||||||||||||||||
|
List of 6 Events for Episode 1 at N part of NYT caldera (San Martino)
| ||||||||||||||||||||||||||||||||||||||||
6490 BCE (?) Confirmed Eruption Max VEI: 3 (?)
| Episode 1 | Eruption Episode | Eastern part of NYT caldera | ||||||||||||||||||||||||||||||||||||||||||||
|---|---|---|---|---|---|---|---|---|---|---|---|---|---|---|---|---|---|---|---|---|---|---|---|---|---|---|---|---|---|---|---|---|---|---|---|---|---|---|---|---|---|---|---|---|---|
| 6490 BCE (?) - Unknown | Evidence from Correlation: Tephrochronology | ||||||||||||||||||||||||||||||||||||||||||||
|
List of 7 Events for Episode 1 at Eastern part of NYT caldera
| |||||||||||||||||||||||||||||||||||||||||||||
6650 BCE ± 100 years Confirmed Eruption Max VEI: 4
| Episode 1 | Eruption Episode | Fondi di Baia, Sartania | |||||||||||||||||||||||||||||||||||||||
|---|---|---|---|---|---|---|---|---|---|---|---|---|---|---|---|---|---|---|---|---|---|---|---|---|---|---|---|---|---|---|---|---|---|---|---|---|---|---|---|---|
| 6650 BCE ± 100 years - Unknown | Evidence from Isotopic: 14C (uncalibrated) | |||||||||||||||||||||||||||||||||||||||
|
List of 6 Events for Episode 1 at Fondi di Baia, Sartania
| ||||||||||||||||||||||||||||||||||||||||
7590 BCE ± 50 years Confirmed Eruption
| Episode 1 | Eruption Episode | NE part of NYT caldera, Pisani 3 tephra | |||||||||||||||||||||||||||||
|---|---|---|---|---|---|---|---|---|---|---|---|---|---|---|---|---|---|---|---|---|---|---|---|---|---|---|---|---|---|---|
| 7590 BCE ± 50 years - Unknown | Evidence from Isotopic: 14C (uncalibrated) | |||||||||||||||||||||||||||||
|
List of 4 Events for Episode 1 at NE part of NYT caldera, Pisani 3 tephra
| ||||||||||||||||||||||||||||||
7980 BCE ± 500 years Confirmed Eruption Max VEI: 3
| Episode 1 | Eruption Episode | Soccavo, Minapoli, Pisani & other vents | |||||||||||||||||||||||||||||||||||||||
|---|---|---|---|---|---|---|---|---|---|---|---|---|---|---|---|---|---|---|---|---|---|---|---|---|---|---|---|---|---|---|---|---|---|---|---|---|---|---|---|---|
| 7980 BCE ± 500 years - Unknown | Evidence from Correlation: Tephrochronology | |||||||||||||||||||||||||||||||||||||||
|
List of 6 Events for Episode 1 at Soccavo, Minapoli, Pisani & other vents
| ||||||||||||||||||||||||||||||||||||||||
8480 BCE ± 100 years Confirmed Eruption Max VEI: 4
| Episode 1 | Eruption Episode | Agnano Pomici Principali tephra | |||||||||||||||||||||||||||||
|---|---|---|---|---|---|---|---|---|---|---|---|---|---|---|---|---|---|---|---|---|---|---|---|---|---|---|---|---|---|---|
| 8480 BCE ± 100 years - Unknown | Evidence from Isotopic: 14C (calibrated) | |||||||||||||||||||||||||||||
|
List of 4 Events for Episode 1 at Agnano Pomici Principali tephra
| ||||||||||||||||||||||||||||||
There is data available for 6 deformation periods. Expand each entry for additional details.
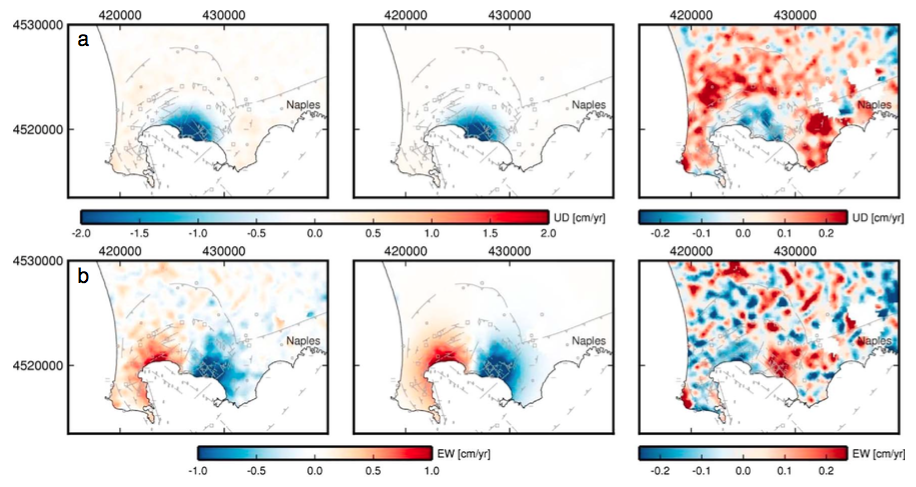
| Start Date: 2010 | Stop Date: 2013 | Direction: Uplift | Method: InSAR |
| Magnitude: Unknown | Spatial Extent: Unknown | Latitude: Unknown | Longitude: Unknown |
Remarks: Moderate uplift began in 2010 and substantially increased through 2012, reaching approximately 13 cm by 2013. | |||
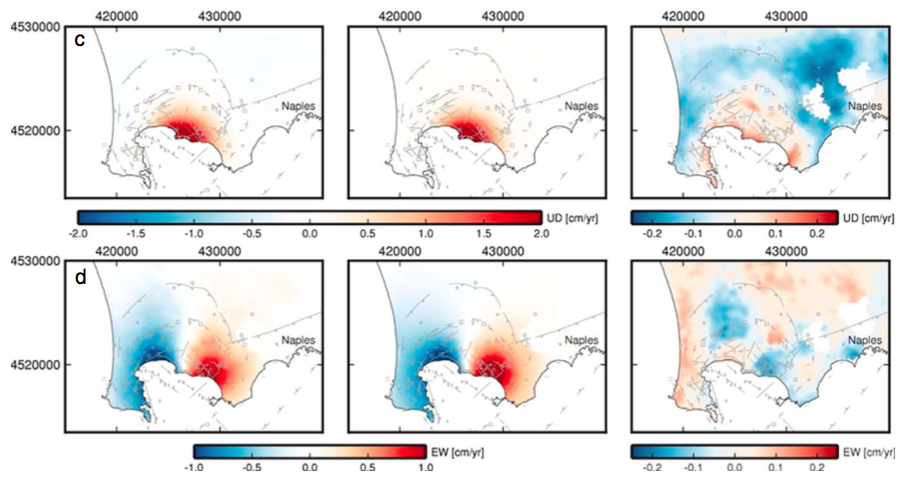 |
(c) Observed displacement rate in the vertical direction (left), in cm/yr, for the inflation period of 2007 through 2013; modeled displa- cement rate in the vertical direction, from inversion results (middle); and residual of observed and modeled displacements (right). (d) Observed displacement rate in the east-west direction (left), in cm/yr, for 2007 through 2013; modeled displacement rate in the east-west direction, from inversion results (middle); and residual of observed and modeled displacements (right). From: Samsonov et al. 2014. |
||
Reference List: Samsonov et al. 2014.
Full References:
Samsonov, S. V., Gonzalez, P. J., Tiampo, K. F., Camacho, A. G., & Fernandez, J., 2014. Spatiotemporal analysis of ground deformation at Campi Flegrei and Mt Vesuvius, Italy, observed by Envisat and Radarsat-2 InSAR during 2003-2013. In Mathematics of Planet Earth (pp. 377-382). Springer Berlin Heidelberg.
| Start Date: 2004 | Stop Date: 2006 | Direction: Uplift | Method: InSAR |
| Magnitude: 3.000 cm | Spatial Extent: Unknown | Latitude: Unknown | Longitude: Unknown |
Remarks: Campi Flegrei underwent an uplift event between 2004 and 2006. | |||
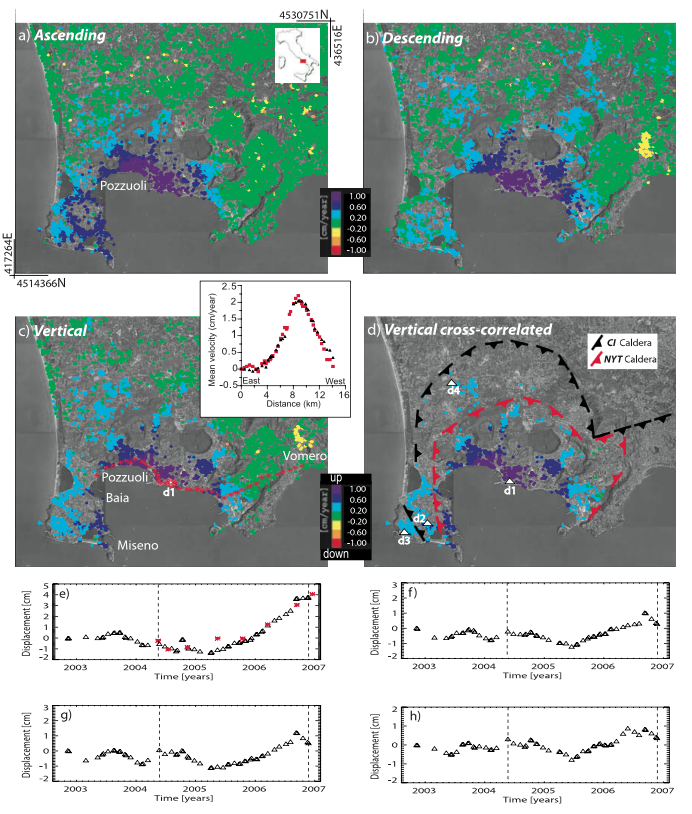 |
SBAS-DInSAR results. Mean deformation velocity maps computed from the (a) ascending and (b) descending data acquired between summer 2004 and November 2006, superimposed on an orthophoto of the Campi Flegrei caldera. (c) Mean vertical deformation velocity map computed on the spatial grid common to both SAR geometries, with the locations of the leveling benchmarks considered (red stars). The inset shows the comparison between the leveling velocity measurements (red stars) and the corresponding mean vertical deformation velocity computed from the SAR data (black triangles). (d) Same as Figure 1c but limited to pixels that correlate with the time series of the pixel labeled as d1, by using a 0.75 correlation threshold. The superimposed volcanological boundaries of the Neapolitan Yellow Tuff and Campanian Ignimbrite calderas are redrawn from Orsi et al. [1999]. (e?h) Plots of the vertical deformation time series relevant to the corresponding pixels identified in Figure 1d by the white triangles labeled as d1, d2, d3 and d4, respectively; the investigated summer 2004?November 2006 time interval is highlighted in the plots. Note also that in the plot shown in Figure 1e the SBAS-DInSAR data are compared with the leveling measurements (red stars); the location of that leveling benchmark is shown in Figure 1c. From: Trasatti et al. 2008. |
||
Reference List: Trasatti et al. 2008; Vilardo et al. 2010; Samsonov et al. 2014.
Full References:
Samsonov, S. V., Gonzalez, P. J., Tiampo, K. F., Camacho, A. G., & Fernandez, J., 2014. Spatiotemporal analysis of ground deformation at Campi Flegrei and Mt Vesuvius, Italy, observed by Envisat and Radarsat-2 InSAR during 2003-2013. In Mathematics of Planet Earth (pp. 377-382). Springer Berlin Heidelberg.
Trasatti, E., Casu, F., Giunchi, C., Pepe, S., Solaro, G., Tagliaventi, S., Berardino, P., Manzo, M., Pepe, A., Ricciardi, G.P. and Sansosti, E., 2008. The 2004–2006 uplift episode at Campi Flegrei caldera (Italy): Constraints from SBAS‐DInSAR ENVISAT data and Bayesian source inference. . Geophysical Research Letters, 35, L07308. https://doi.org/10.1029/2007GL033091
Vilardo, G., Isaia, R., Ventura, G., De Martino, P., & Terranova, C., 2010. InSAR Permanent Scatterer analysis reveals fault re-activation during inflation and deflation episodes at Campi Flegrei caldera. Remote Sensing of Environment, 114(10), 2373-2383.
| Start Date: 2000 Mar | Stop Date: 2000 Aug | Direction: Uplift | Method: InSAR |
| Magnitude: 4.000 cm | Spatial Extent: Unknown | Latitude: Unknown | Longitude: Unknown |
Remarks: Campi Flegrei underwent an uplift event from early spring to late summer 2000. | |||
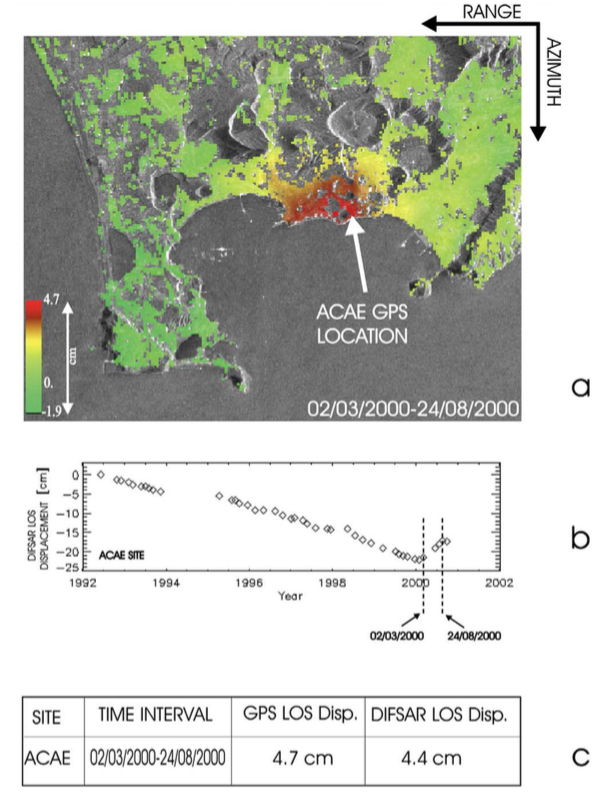 |
DIFSAR results. (a) Line of sight deformation map obtained from the descending ERS-2 acquisitions of March and August 2000. (b) Temporal evolution of the observed DIFSAR displacements, in the time interval June 1992-September 2000, for a point close to the location of the ACAE GPS station. (c) Comparison of GPS measurements (ACAE site), projected along the radar line of sight, and DIFSAR displacements in the time interval March-August 2000. From: Lanari et al. 2004. |
||
Reference List: Lanari et al. 2004; Samsonov et al. 2014.
Full References:
Lanari, R., Berardino, P., Borgstrom, S., Del Gaudio, C., De Martino, P., Fornaro, G., Guarino, S., Ricciardi, G.P., Sansosti, E. and Lundgren, P.,, 2004. The use of IFSAR and classical geodetic techniques for caldera unrest episodes: application to the Campi Flegrei uplift event of 2000. J. Volcanol. Geotherm. Res., 133: 247-260.
Samsonov, S. V., Gonzalez, P. J., Tiampo, K. F., Camacho, A. G., & Fernandez, J., 2014. Spatiotemporal analysis of ground deformation at Campi Flegrei and Mt Vesuvius, Italy, observed by Envisat and Radarsat-2 InSAR during 2003-2013. In Mathematics of Planet Earth (pp. 377-382). Springer Berlin Heidelberg.
| Start Date: 1992 Jun | Stop Date: 1999 Dec | Direction: Subsidence | Method: InSAR |
| Magnitude: 3.000 cm | Spatial Extent: Unknown | Latitude: Unknown | Longitude: Unknown |
Remarks: Campi Flegrei underwent continuous subsidence from 1992 to 1999. | |||
 |
(a) Observed displacement rate in the vertical direction (left), in cm/yr, for the subsidence period of 1993 through 1999; modeled displacement rate in the vertical direction, from inversion results (middle); and residual of observed and modeled displacements (right). (b) Observed displacement rate in the east-west direction (left), in cm/yr, for 1993 through 1999; modeled displacement rate in the east-west direction, from inversion results (middle); and residual of observed and modeled displacements (right). From: Samsonov et al. 2014. |
||
Reference List: Lundgren et al. 2001; Salvi et al. 2004; Vilardo et al. 2010; Samsonov et al. 2014.
Full References:
Lundgren, P., S. Usai, E. Sansosti, R. Lanari, M. Tesauro, G. Fornaro, and P. Berardino, 2001. Modeling surface deformation with synthetic aperture radar interferometry at Campi Flegrei caldera. J. Geophys. Res., 106, 19355-19367.
Salvi, S., Atzori, S., Tolomei, C., Allievi, J., Ferretti, A., Rocca, F., C. Prati, S. Stramondo, and Feuillet, N., 2004. Inflation rate of the Colli Albani volcanic complex retrieved by the permanent scatterers SAR interferometry technique. Geophysical Research Letters, 31, L12606. https://doi.org/10.1029/2004GL020253
Samsonov, S. V., Gonzalez, P. J., Tiampo, K. F., Camacho, A. G., & Fernandez, J., 2014. Spatiotemporal analysis of ground deformation at Campi Flegrei and Mt Vesuvius, Italy, observed by Envisat and Radarsat-2 InSAR during 2003-2013. In Mathematics of Planet Earth (pp. 377-382). Springer Berlin Heidelberg.
Vilardo, G., Isaia, R., Ventura, G., De Martino, P., & Terranova, C., 2010. InSAR Permanent Scatterer analysis reveals fault re-activation during inflation and deflation episodes at Campi Flegrei caldera. Remote Sensing of Environment, 114(10), 2373-2383.
| Start Date: 1983 | Stop Date: 1984 | Direction: Uplift | Method: Leveling |
| Magnitude: 150.000 cm | Spatial Extent: Unknown | Latitude: Unknown | Longitude: Unknown |
Reference List: Lundgren et al. 2001.
Full References:
Lundgren, P., S. Usai, E. Sansosti, R. Lanari, M. Tesauro, G. Fornaro, and P. Berardino, 2001. Modeling surface deformation with synthetic aperture radar interferometry at Campi Flegrei caldera. J. Geophys. Res., 106, 19355-19367.
| Start Date: 1969 | Stop Date: 1971 | Direction: Uplift | Method: Leveling |
| Magnitude: 150.000 cm | Spatial Extent: Unknown | Latitude: Unknown | Longitude: Unknown |
 |
From: . |
||
Reference List: Lundgren et al. 2001.
Full References:
Lundgren, P., S. Usai, E. Sansosti, R. Lanari, M. Tesauro, G. Fornaro, and P. Berardino, 2001. Modeling surface deformation with synthetic aperture radar interferometry at Campi Flegrei caldera. J. Geophys. Res., 106, 19355-19367.
There is no Emissions History data available for Campi Flegrei.
 The famous pillars of the Roman temple of Seraphis, in Pozzuoli, have served as unintended markers of periodic uplift of the Campi Flegrei caldera floor. Borings in the marble columns by marine organisms show that the location had sunk 11 m below sea level by 1000 CE and then rose 12 m by 1538, including rapid uplift of 4 m immediately prior to the 1538 eruption of Monte Nuovo. More recent periods of rapid uplift took place in 1970-72 and 1982-84.
 Bubbling mudpots are evidence of continued thermal activity at the Campi Flegrei caldera on the western outskirts of Naples, Italy.
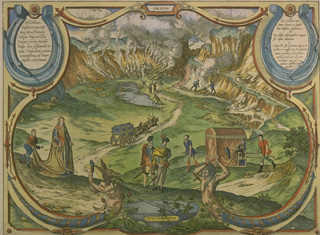 This 17th century sketch depicts visitors to Solfatara crater within the Campi Flegrei caldera. Active fumaroles steam along the crater walls. A small phreatic explosion took place at Solfatara in 1198 CE.
 This fanciful sketch depicts explosions at Monte Nuovo in 1538, the latest eruption in the Campi Flegrei caldera. The week-long eruption produced a new 100-m-high cinder cone, Monte Nuovo. Small pyroclastic flows during the opening stage of the eruption traveled a few hundred m from the cone. An explosion on the last day of the eruption killed 24 people who had climbed onto the cone.
  A Landsat satellite image shows the Campi Flegrei caldera north of the Bay of Naples. The 13-km-wide caldera, immediately west of the city of Naples (upper right), was created following massive explosive eruptions about 34,000 and 12,000 years ago. Subsequent eruptions formed numerous craters and cones within the caldera and along its margins. The most recent eruption created the Monte Nuovo tuff cone in 1538.
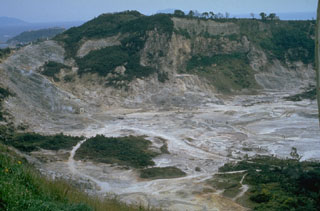 The Solfatara maar-diatreme in the Campi Flegrei caldera was formed during an explosive eruption about 3,850 years ago. The crater is still thermally active, releasing gas that includes H2O, CO2, and CO. A small phreatic eruption occurred at Solfatara in 1198 CE.
The maps shown below have been scanned from the GVP map archives and include the volcano on this page. Clicking on the small images will load the full 300 dpi map. Very small-scale maps (such as world maps) are not included. The maps database originated over 30 years ago, but was only recently updated and connected to our main database. We welcome users to tell us if they see incorrect information or other problems with the maps; please use the Contact GVP link at the bottom of the page to send us email.
The following 64 samples associated with this volcano can be found in the Smithsonian's NMNH Department of Mineral Sciences collections, and may be availble for research (contact the Rock and Ore Collections Manager). Catalog number links will open a window with more information.
| Catalog Number | Sample Description | Lava Source | Collection Date |
|---|---|---|---|
| NMNH 109081-1 | Sulfur | -- | -- |
| NMNH 109081-2 | Sulfur | -- | -- |
| NMNH 111123-1244 | Pantellerite | PANTELLERIA | -- |
| NMNH 111123-1245 | Pantellerite | PANTELLERIA | -- |
| NMNH 111123-1248 | Trachyte | -- | -- |
| NMNH 111123-1249 | Trachyte | -- | -- |
| NMNH 111123-1573 | Vulsinite | -- | -- |
| NMNH 111123-1997 | Basalt | PANTELLERIA | -- |
| NMNH 111123-1998 | Pantellerite | PANTELLERIA | -- |
| NMNH 111123-1999 | Trachyte | PANTELLERIA | -- |
| NMNH 111123-2000 | Pantellerite | PANTELLERIA | -- |
| NMNH 111123-2001 | Pantellerite | PANTELLERIA | -- |
| NMNH 111123-2002 | Trachyte | PANTELLERIA | -- |
| NMNH 111123-2003 | Pantellerite | PANTELLERIA | -- |
| NMNH 111123-2004 | Aegirine Pantellerite | PANTELLERIA | -- |
| NMNH 111123-2005 | Pantelleritic Trachyte | PANTELLERIA | -- |
| NMNH 111123-2006 | Basalt | PANTELLERIA | -- |
| NMNH 111123-2007 | Obsidian | -- | -- |
| NMNH 111123-2008 | Basalt | PANTELLERIA | -- |
| NMNH 111123-2009 | Pantelleritic Trachyte | PANTELLERIA | -- |
| NMNH 111123-2010 | Comendite | PANTELLERIA | -- |
| NMNH 111123-2011 | Pantellerite | PANTELLERIA | -- |
| NMNH 111123-261 | Sanidine-Oligoclase Trachyte | OLIBANA-MT | -- |
| NMNH 111123-934 | Peperino | -- | -- |
| NMNH 111123-937 | Trachyte | -- | -- |
| NMNH 111123-939 | Trachyte | -- | -- |
| NMNH 2029 | Basalt | -- | -- |
| NMNH 36314 | Trachyte | OLIBANO-MT | -- |
| NMNH 36327 | Trachyte | -- | -- |
| NMNH 36602 | Phonolite Volcanic Ash | NUOVO-MT | -- |
| NMNH 73002 | Trachyte | OLIBANO-MT | -- |
| NMNH 73003 | Trachyte | OLIBANO-MT | -- |
| NMNH 73014 | Sodalite Trachyte | PANTELLERIA | -- |
| NMNH 91982 | Trachytic Obsidian | -- | -- |
| NMNH 91982-1 | Trachyte Tuff | -- | -- |
| NMNH 91982-2 | Trachyte Tuff | -- | -- |
| NMNH 91983 | Trachytic Obsidian | -- | -- |
| NMNH 91983 | Trachytic Obsidian | -- | -- |
| NMNH 91985-1 | Trachyte | NUOVO-MT | -- |
| NMNH 91985-2 | Sodalite Trachyte | NUOVO-MT | -- |
| NMNH 91985-3 | Sodalite Trachyte | NUOVO-MT | -- |
| NMNH 91986 | Trachytic Obsidian | -- | -- |
| NMNH 91988-1 | Ponzaite | -- | -- |
| NMNH 91988-2 | Ponzaite | -- | -- |
| NMNH 91990-1 | Trachyte | -- | -- |
| NMNH 91990-2 | Acmite-Sodalite Trachyte | -- | -- |
| NMNH 91994-1 | Trachyte | -- | -- |
| NMNH 91994-2 | Trachyte | -- | -- |
| NMNH 91994-3 | Trachyte | -- | -- |
| NMNH 91996 | Trachyte | -- | -- |
| NMNH 91999 | Trachyte | -- | -- |
| NMNH 99118-1 | Phonolitic Trachyte | NUOVO-MT | -- |
| NMNH 99118-2 | Phonolite Trachyte | NUOVO-MT | -- |
| NMNH 99119 | Clay | NUOVO-MT | -- |
| NMNH 99120 | Trachyte | -- | -- |
| NMNH 99121-1 | Trachyte | OLIBANO-MT | -- |
| NMNH 99122 | Trachyte | -- | -- |
| NMNH 99123 | Trachyte | -- | -- |
| NMNH 99124 | Extrusive Volcanic Rock | -- | -- |
| NMNH 99125 | Peperino | -- | -- |
| NMNH 99126 | Obsidian | -- | -- |
| NMNH 99127-1 | Trachyte | -- | -- |
| NMNH 99127-2 | Trachyte | -- | -- |
| NMNH 99128 | Obsidian | -- | -- |
| Copernicus Browser | The Copernicus Browser replaced the Sentinel Hub Playground browser in 2023, to provide access to Earth observation archives from the Copernicus Data Space Ecosystem, the main distribution platform for data from the EU Copernicus missions. |
| MIROVA | Middle InfraRed Observation of Volcanic Activity (MIROVA) is a near real time volcanic hot-spot detection system based on the analysis of MODIS (Moderate Resolution Imaging Spectroradiometer) data. In particular, MIROVA uses the Middle InfraRed Radiation (MIR), measured over target volcanoes, in order to detect, locate and measure the heat radiation sourced from volcanic activity. |
| MODVOLC Thermal Alerts | Using infrared satellite Moderate Resolution Imaging Spectroradiometer (MODIS) data, scientists at the Hawai'i Institute of Geophysics and Planetology, University of Hawai'i, developed an automated system called MODVOLC to map thermal hot-spots in near real time. For each MODIS image, the algorithm automatically scans each 1 km pixel within it to check for high-temperature hot-spots. When one is found the date, time, location, and intensity are recorded. MODIS looks at every square km of the Earth every 48 hours, once during the day and once during the night, and the presence of two MODIS sensors in space allows at least four hot-spot observations every two days. Each day updated global maps are compiled to display the locations of all hot spots detected in the previous 24 hours. There is a drop-down list with volcano names which allow users to 'zoom-in' and examine the distribution of hot-spots at a variety of spatial scales. |
|
WOVOdat
Single Volcano View Temporal Evolution of Unrest Side by Side Volcanoes |
WOVOdat is a database of volcanic unrest; instrumentally and visually recorded changes in seismicity, ground deformation, gas emission, and other parameters from their normal baselines. It is sponsored by the World Organization of Volcano Observatories (WOVO) and presently hosted at the Earth Observatory of Singapore.
GVMID Data on Volcano Monitoring Infrastructure The Global Volcano Monitoring Infrastructure Database GVMID, is aimed at documenting and improving capabilities of volcano monitoring from the ground and space. GVMID should provide a snapshot and baseline view of the techniques and instrumentation that are in place at various volcanoes, which can be use by volcano observatories as reference to setup new monitoring system or improving networks at a specific volcano. These data will allow identification of what monitoring gaps exist, which can be then targeted by remote sensing infrastructure and future instrument deployments. |
| Volcanic Hazard Maps | The IAVCEI Commission on Volcanic Hazards and Risk has a Volcanic Hazard Maps database designed to serve as a resource for hazard mappers (or other interested parties) to explore how common issues in hazard map development have been addressed at different volcanoes, in different countries, for different hazards, and for different intended audiences. In addition to the comprehensive, searchable Volcanic Hazard Maps Database, this website contains information about diversity of volcanic hazard maps, illustrated using examples from the database. This site is for educational purposes related to volcanic hazard maps. Hazard maps found on this website should not be used for emergency purposes. For the most recent, official hazard map for a particular volcano, please seek out the proper institutional authorities on the matter. |
| IRIS seismic stations/networks | Incorporated Research Institutions for Seismology (IRIS) Data Services map showing the location of seismic stations from all available networks (permanent or temporary) within a radius of 0.18° (about 20 km at mid-latitudes) from the given location of Campi Flegrei. Users can customize a variety of filters and options in the left panel. Note that if there are no stations are known the map will default to show the entire world with a "No data matched request" error notice. |
| UNAVCO GPS/GNSS stations | Geodetic Data Services map from UNAVCO showing the location of GPS/GNSS stations from all available networks (permanent or temporary) within a radius of 20 km from the given location of Campi Flegrei. Users can customize the data search based on station or network names, location, and time window. Requires Adobe Flash Player. |
| DECADE Data | The DECADE portal, still in the developmental stage, serves as an example of the proposed interoperability between The Smithsonian Institution's Global Volcanism Program, the Mapping Gas Emissions (MaGa) Database, and the EarthChem Geochemical Portal. The Deep Earth Carbon Degassing (DECADE) initiative seeks to use new and established technologies to determine accurate global fluxes of volcanic CO2 to the atmosphere, but installing CO2 monitoring networks on 20 of the world's 150 most actively degassing volcanoes. The group uses related laboratory-based studies (direct gas sampling and analysis, melt inclusions) to provide new data for direct degassing of deep earth carbon to the atmosphere. |
| Large Eruptions of Campi Flegrei | Information about large Quaternary eruptions (VEI >= 4) is cataloged in the Large Magnitude Explosive Volcanic Eruptions (LaMEVE) database of the Volcano Global Risk Identification and Analysis Project (VOGRIPA). |
| EarthChem | EarthChem develops and maintains databases, software, and services that support the preservation, discovery, access and analysis of geochemical data, and facilitate their integration with the broad array of other available earth science parameters. EarthChem is operated by a joint team of disciplinary scientists, data scientists, data managers and information technology developers who are part of the NSF-funded data facility Integrated Earth Data Applications (IEDA). IEDA is a collaborative effort of EarthChem and the Marine Geoscience Data System (MGDS). |

