

AVO reported that unrest at Kanaga continued during 3-9 January; no new eruptive activity was evident in satellite and webcam images. Small daily earthquakes were detected until 2 January when a storm-related power failure took local monitoring data offline. Satellite radar images showed that large NW-SE-trending fractures intersecting the summit crater had likely formed around the time of the 18 December explosive event. The Volcano Alert Level remained at Advisory (the second level on a four-level scale) and the Aviation Color Code remained at Yellow (the second color on a four-color scale).
Source: US Geological Survey Alaska Volcano Observatory (AVO)
18 February 2012 eruption; new fissure
In our last report on Kanaga, issued in 1995 (BGVN 20:08), we discussed an eruption during January through mid-October 1994. In addition to a brief explosion in February 2012, more information from the Alaska Volcano Observatory (AVO) has come to our attention, some discussing events more than a decade ago. This information suggested either renewed low level eruptions or vigorous steaming from lava cooling in the summit crater.
What follows is condensed from reports, primarily by researchers at AVO, describing the time span from 1996 to 2012. Data for 2012 is in a separate subsection. The last section looks at Kanaga seismicity in terms of located earthquakes and MC, Magnitude of Completeness, a means of looking at seismic data quality, homogeneity, and consistency, and the smallest events reliably recorded in the cataloged data (Wiemer and Wyss, 2000).
Figures 1 and 2 comprise three maps showing, respectively, the location of Kanaga Island in the Aleutian Islands, a physical map of Kanaga Island showing the location of Kanaga volcano, and a geological map of the volcano.
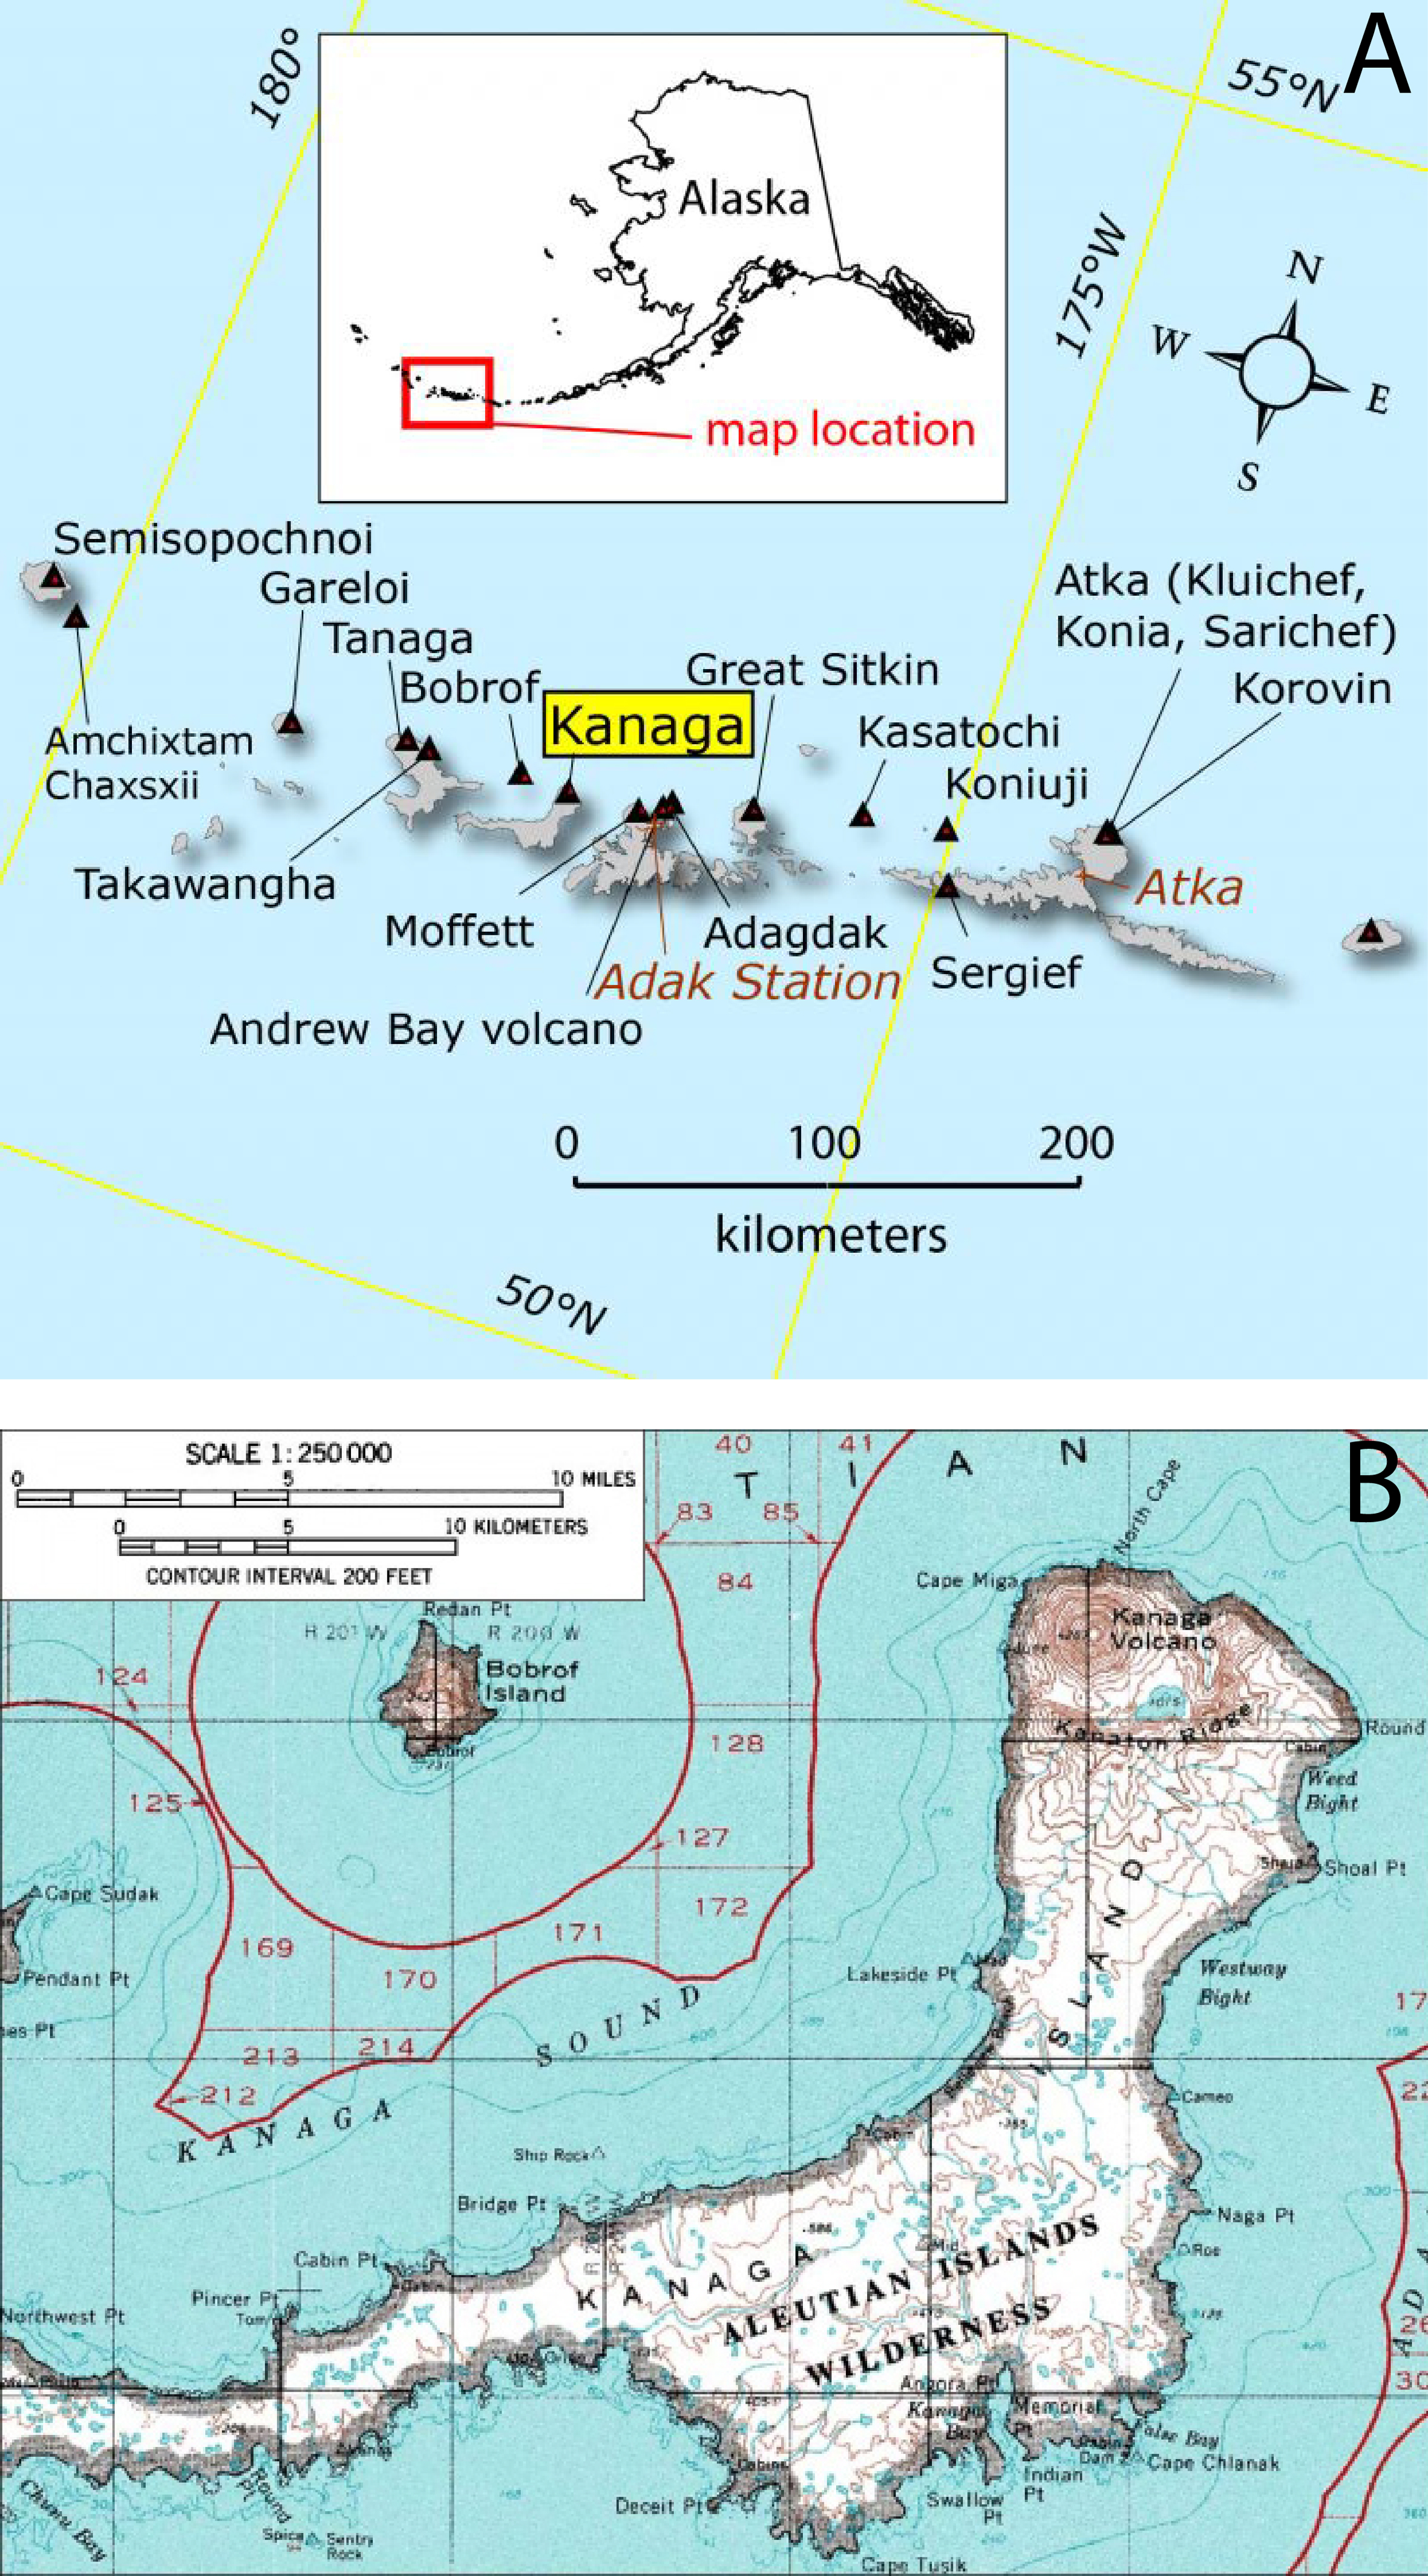 |
Figure 1. (a) Map of the western Aleutian Islands, Alaska, showing the location of Kanaga Island. Courtesy of AVO. (b) Topographic map of Kanaga Island showing Kanaga volcano on the northernmost portion of the island. Courtesy of U.S. Geological Survey (USGS) and Amar Andalkar. |
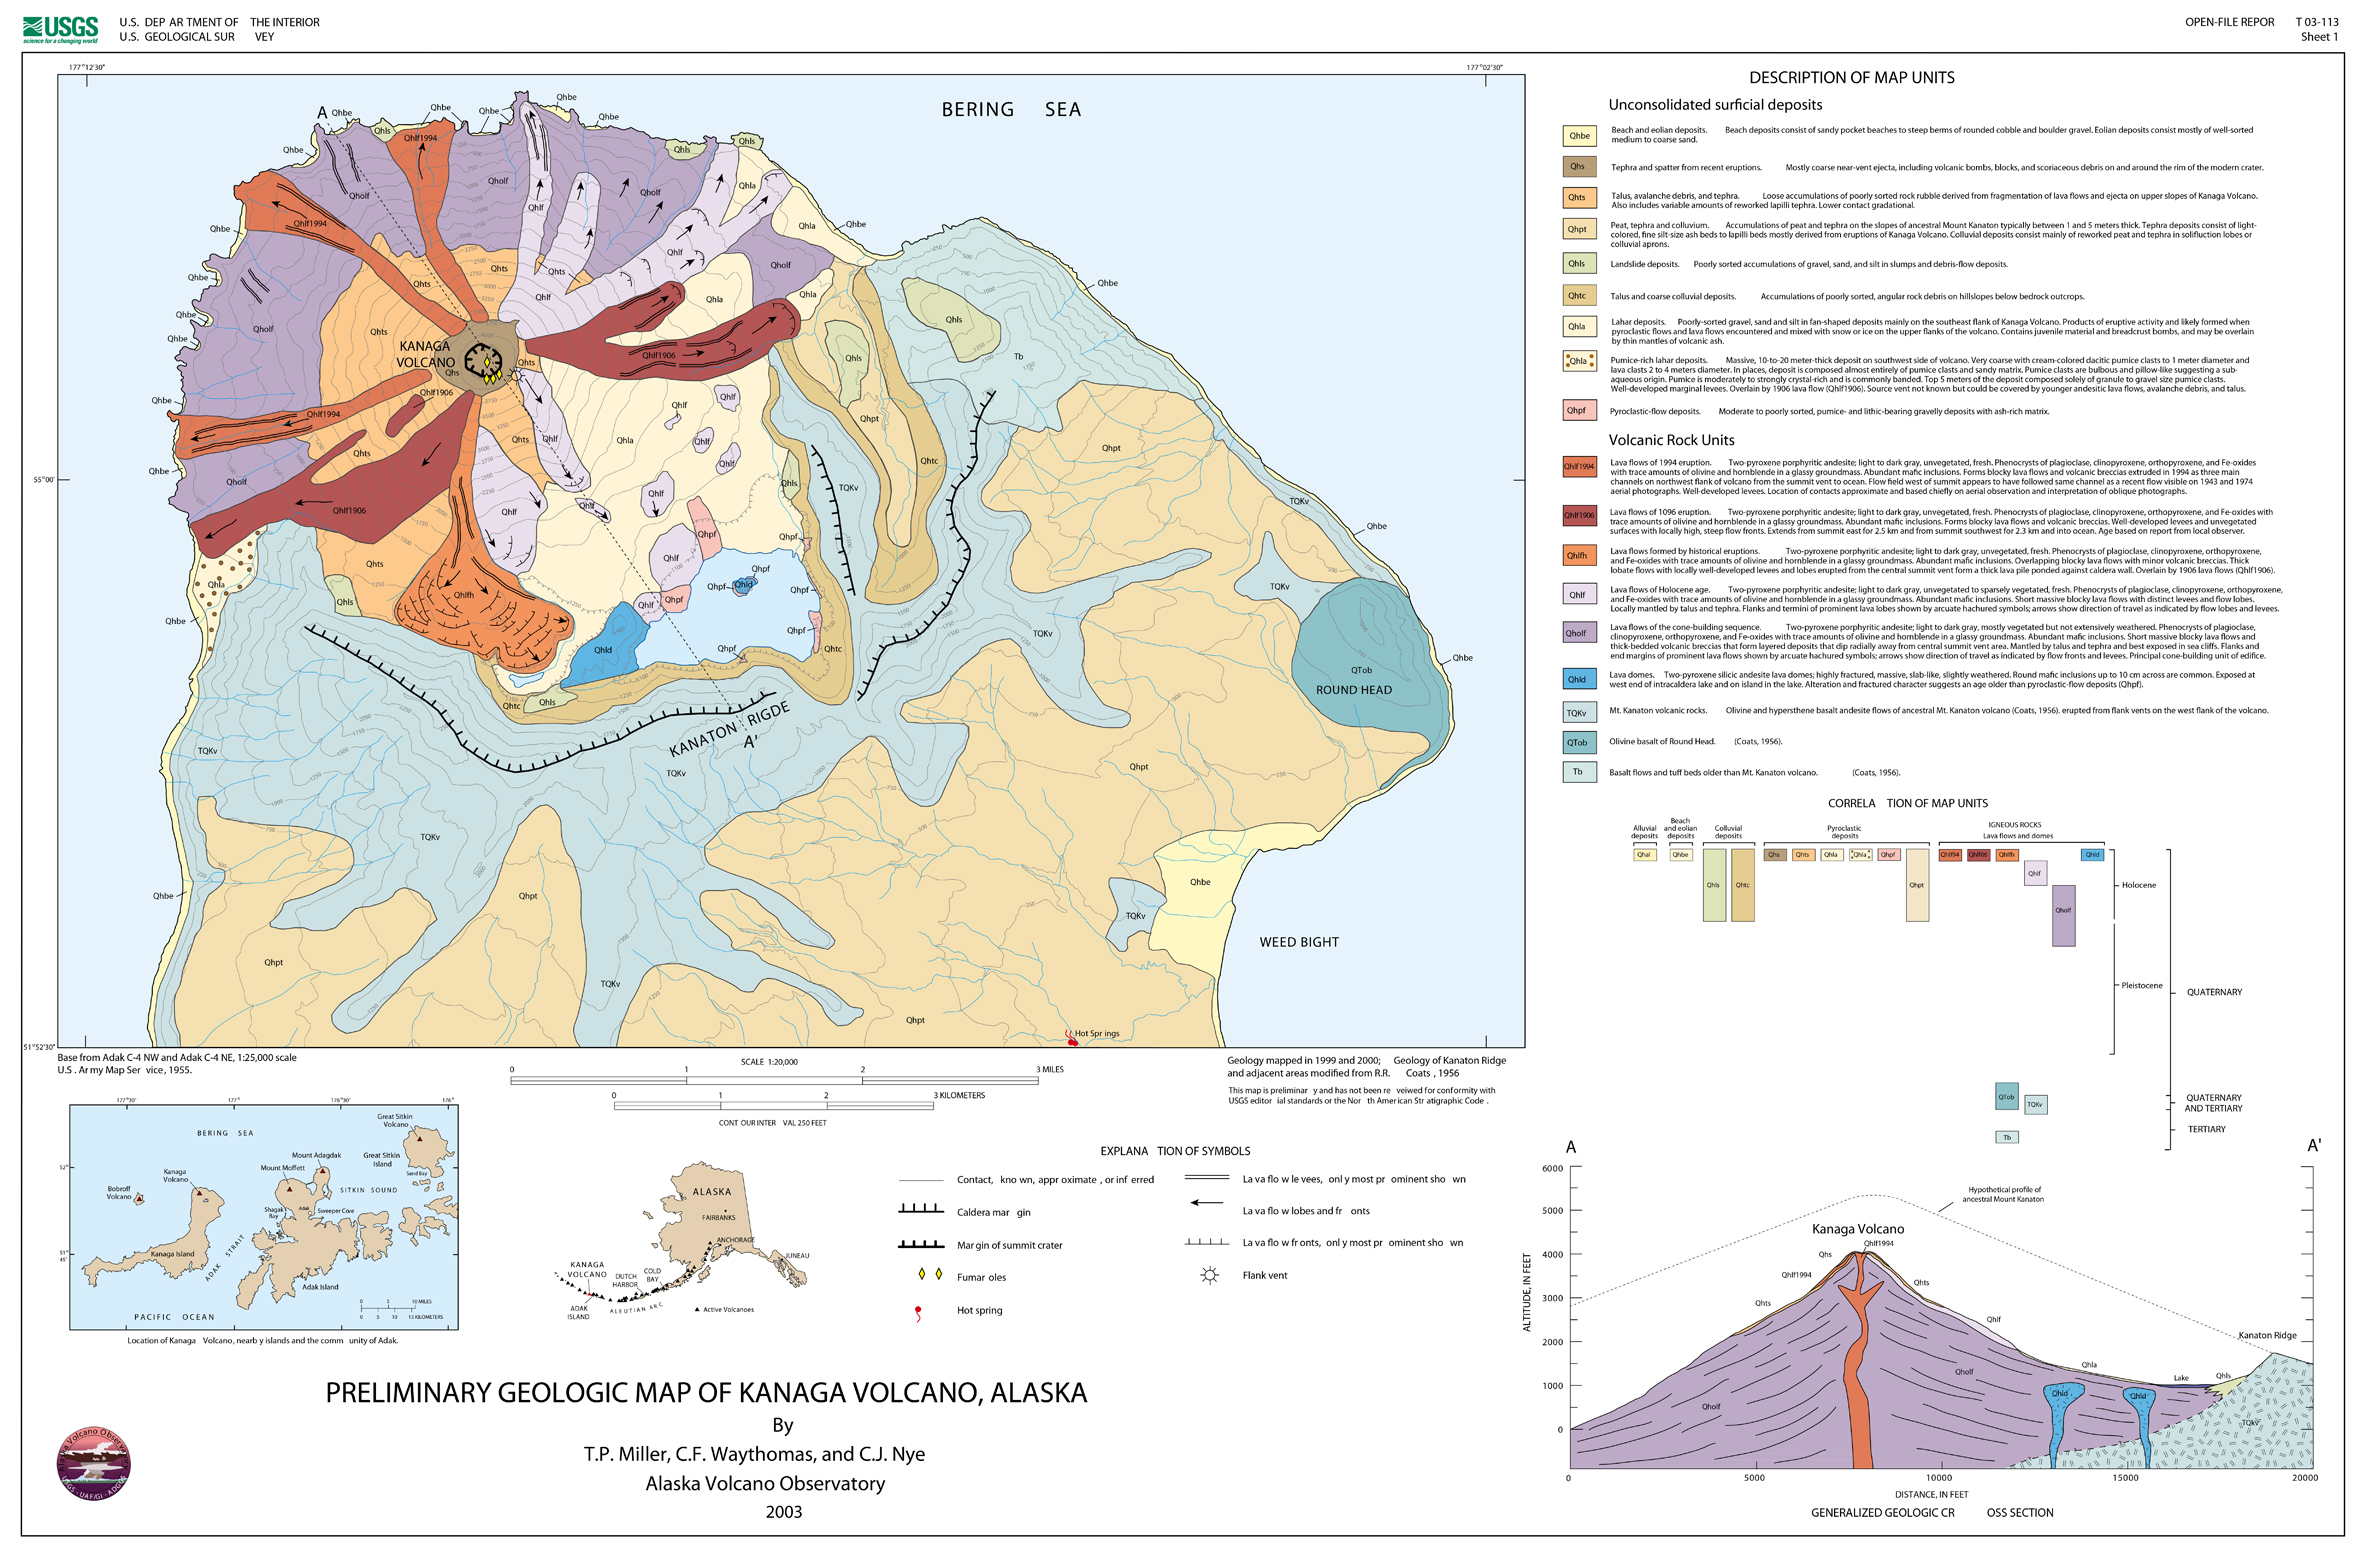 |
Figure 2. Preliminary geologic map showing Kanaga volcano. Notice that concentric to Kanaga to the SE is the arcuate Kanaton Ridge, inferred to be the remnant of Mount Kanaton, an ancestral volcano destroyed by structural collapse; see generalized geologic cross section in the lower right-hand side of the figure. Courtesy Miller and others (2003, Sheet 1). |
According to McGimsey and Neal (1997), a commercial airline crew noted a small, bluish brown cloud possibly containing some ash on 11 June 1996, "rising a few hundred feet above the summit of the volcano." Strong winds carried the cloud down the SE flank of the volcano, depositing ash that discolored the snow. The flight crew noted a sulfur odor upon descent into nearby Adak Island. A ground observer on Adak noted dark splotches on the E flank of Kanaga, but a ballistic origin for the pattern (i.e., volcanic bombs) was never confirmed. It should be noted that these observations occurred several days after an M 6 earthquake in the area, and extensive rockfalls and increased steaming had been observed at Gareloi and Kasatochi volcanoes E and W of Kanaga.
Kevin Bell, the captain of the RV Tiglax, watched Kanaga from a point off its N flank on 3 September 1996. He observed that the extent of lava flows was similar to that inferred from 1995 photographs. Small wisps of steam persisted along the upper reaches of the lava flow on the NW flank. Bell also saw material rolling down the steep flank of the volcano during the Summer and Fall of 1996.
Waythomas and others (2002) noted that ash clouds from Kanaga could interfere with the commercial airliners flying between East Asia and Alaska. Figure 3 shows a satellite image of Kanaga volcano taken 13 August 2002.
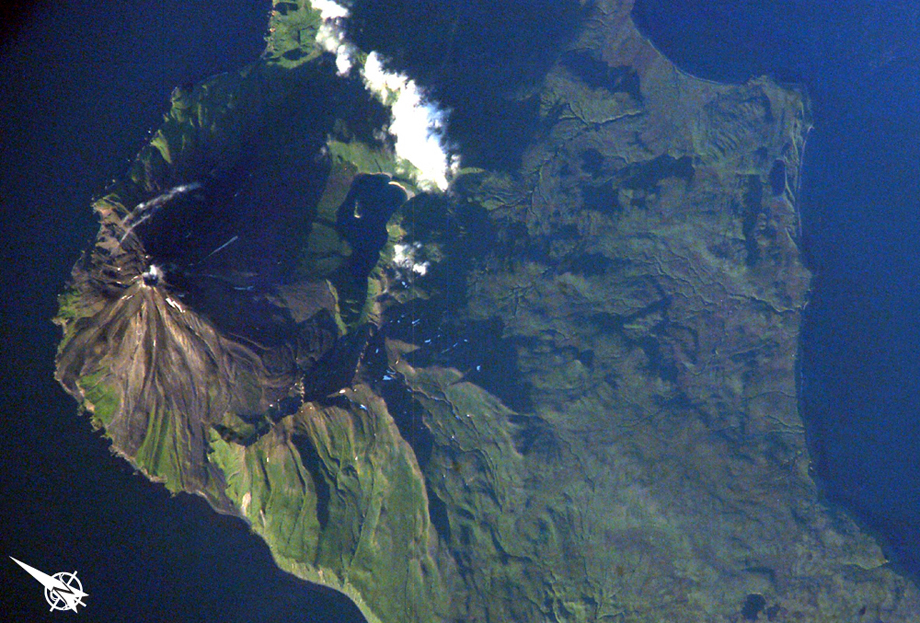 |
Figure 3. An astronaut's photograph acquired late in the day of 13 August 2002 of Kanaga volcano; N is approximately to the left. The volcano is known for its active fumaroles and hot springs (located, in this image, by fine steam plumes on the NE flank of the volcano). A small lake to the SE of the cone is situated on the floor of a larger, more ancient volcanic caldera. Astronaut photograph ISS005 E 10097, from NASA Earth Observatory; courtesy of the Earth Sciences and Image Analysis Laboratory at Johnson Space Center. |
Coombs and others (2007) described subaerial evidence for large-scale prehistoric collapse at Kanaga volcanic center and conducted submarine side-scan sonar profiling N of the volcano. These data reveal a hummocky seafloor topography suggestive of landslide debris.
2012 Activity. AVO detected volcanic tremor at Kanaga from 1523 to 1527 UTC on 18 February 2012. This was followed by numerous small earthquakes at Kanaga continuing for about an hour.
A possible weak ash cloud ~8 km in length, ~39 km NE of the volcano, was detected by the Advanced Very High Resolution Radiometer (AVHRR) aboard a polar-orbiting satellite, at 1535 UTC. The plume was observed as far as ~39 km NE of the volcano.
Because of the new unrest and possible explosive activity with the likely ash cloud, AVO raised the Alert Level to Advisory and the Aviation Color Code to Yellow. Somewhat elevated seismicity continued at Kanaga on 19 February 2012, but was not detectable on 20 February. Low amplitude tremor was detected on 25 February. On 2 March, citing continued background level seismicity, AVO returned Kanaga to Normal and the Aviation Color Code to Green.
Photographs taken by a local observer on 19 February showed a small steam plume rising from Kanaga's crater (figure 4), who thought that the two dark stripes extending down the flank possibly represent fresh ash and/or flowage deposits.
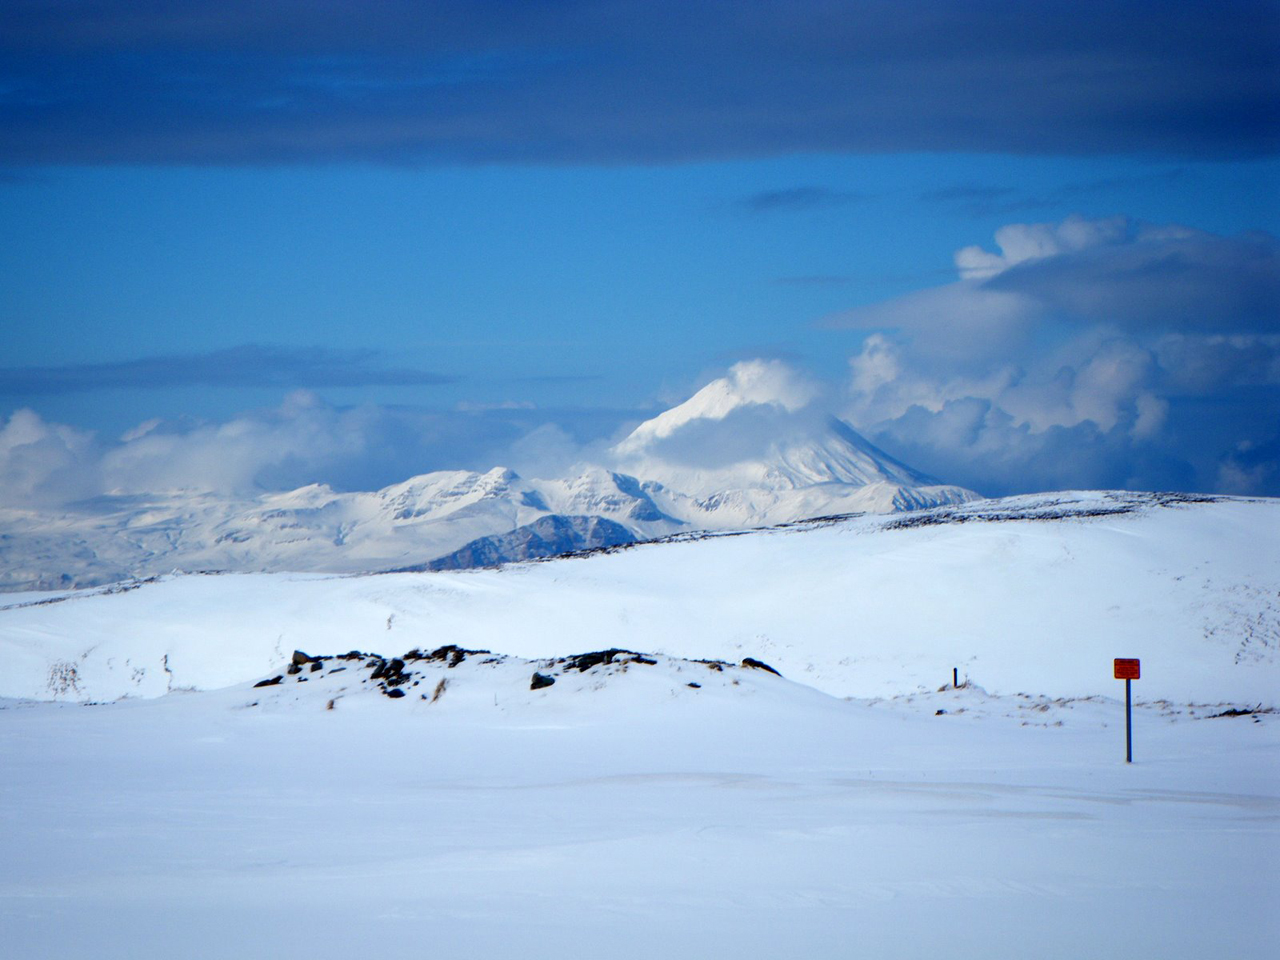 |
Figure 4. Kanaga volcano emitting a steam plume at 1226 on 19 February 2012. Photo taken from the White Alice site, ~3 km W of Adak, Alaska; courtesy of Marjorie Tillion, from AVO web site. |
Figures 5-7 show images and photographs of Kanaga taken in the weeks and months following the brief 18 February eruption. The fissure, which vented steam, developed sometime after October 2011.
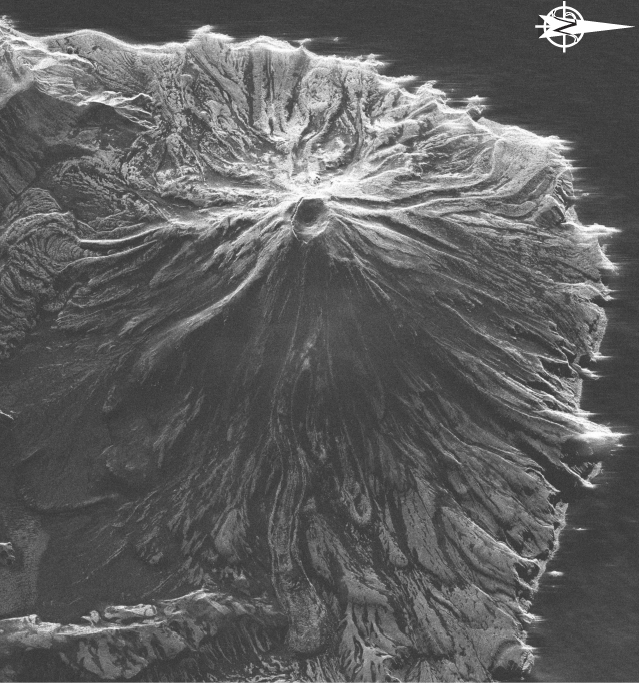 |
Figure 5. Radar image of Kanaga collected on 5 March 2012. N is to the right. AVO workers described an E-trending fissure crossing the S crater rim and continuing part way down the W flank. Total length of the fissure was estimated at ~600 m. It developed sometime after October 2011. As mentioned in text, a short duration explosive eruption occurred on 18 February 2012. It was unclear whether that 18 February activity and the development of the fissure were related. TerraSar-X image copyright ©2012 Infoterra GmbH courtesy of Zhong Lu and David Schneider AVO/USGS. |
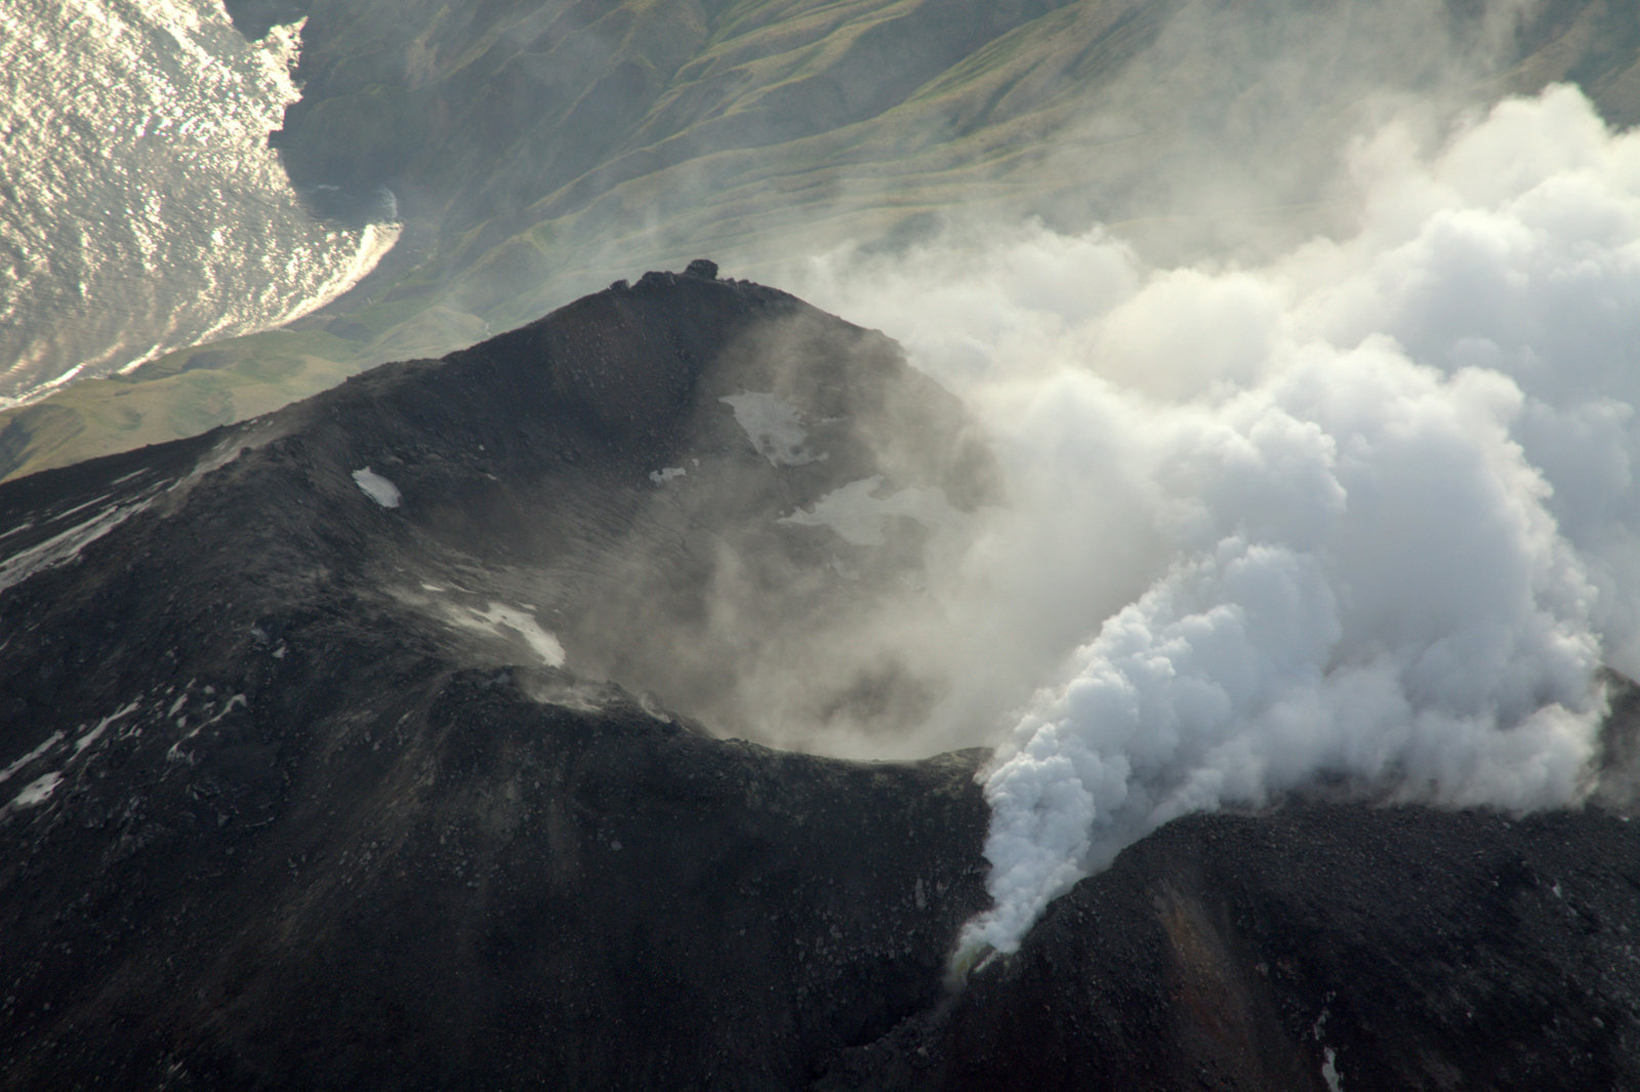 |
Figure 6. Aerial photograph taken at 1200 on 30 June 2012 of Kanaga's summit with a fissure emitting steam. Photograph by Cyrus Read; image courtesy of AVO/USGS. |
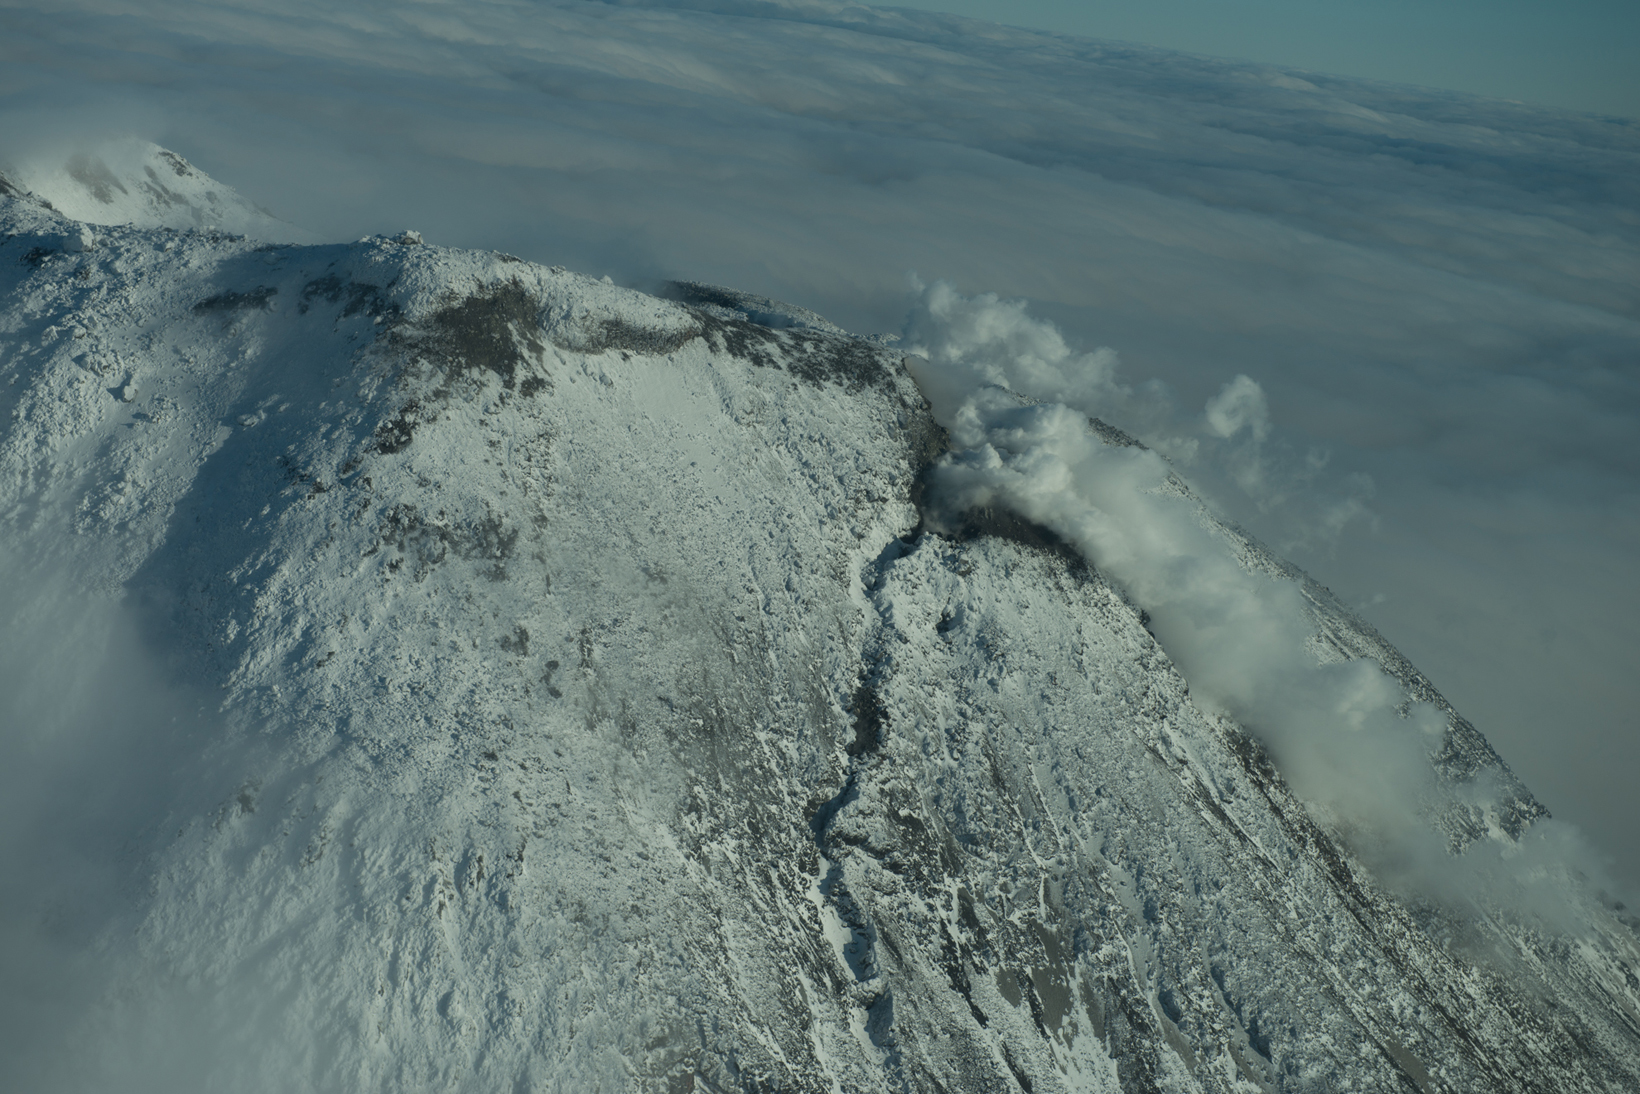 |
Figure 7. Aerial photograph of Kanaga looking E, taken November 2012. The steam discharged from the E-trending fissure on the S side of the dome Photograph courtesy of Roger Clifford. |
Located earthquakes enable computation of MC. Table 1 shows the annual number of located earthquakes recorded by the U.S. Geological Survey (USGS) within 20 km of the Kanaga volcanic center for the years of 2004-2011. References for this table came from USGS catalogs of earthquake hypocenters at Alaskan volcanoes are cited in a separate list below. The catalog for 2012 is not yet available. The first seismic monitoring station at Kanaga was installed in September 1999.
Table 1. Number of earthquakes for various years located for the Kanaga volcano seismograph subnetwork within 20 km of the volcanic center. The column of "Other" earthquakes refers to those outside the defined categories of VT and LP (including hybrid, regional-tectonic, teleseismic, shore-ice, calibrations, other non-seismic, and cause unknown). Compiled from the U.S. Geological Survey's annual Catalog of Earthquake Hypocenters at Alaskan Volcanoes.
| Year | Earthquakes Located | Volcano-tectonic (VT) | Low-frequency (LF) | Other |
| 2004 | 32 | 30 | 2 | 0 |
| 2005 | 42 | 42 | 0 | 0 |
| 2006 | 56 | 56 | 0 | 0 |
| 2007 | 48 | 48 | 0 | 0 |
| 2008 | 478 | 403 | 0 | 75 |
| 2009 | 28 | 26 | 0 | 2 |
| 2010 | 43 | 43 | 0 | 0 |
| 2011 | 21 | 21 | 0 | 0 |
According to Dixon and others (2009), the large number of earthquakes located at Kanaga in 2008 was the result of an M ~6.6 tectonic earthquake of 2 May 2008 and its aftershocks. That publication also includes a map with stations and epicenters, cross sections with hypocenters, and a plot of depth in a time series during 2011.
The USGS annual Catalog of earthquake hypocenters at Alaskan Volcanoes include a category for each volcano entitled Magnitude of Completeness (MC), defined as the magnitude at which 90% of the data can be modeled by a power law fit (Wiemer and Wyss, 2000). Below MC, some fraction of small earthquakes are missed by the network, for reasons such as: those earthquakes were too small to be reliably recorded; geophysicists decided to exclude events below some threshold; and for aftershocks and in the midst of various kinds of overriding signal or noise, smaller earthquakes may have been too small to be detected (eg. swamped by the coda of larger events).
According to Dixon and others (2012), Mc for AVO seismograph subnetworks using data from Kanaga (6 stations) for the period March 2002-December 2011 was 1.2. In practice, this means that 1.2 was the lowest magnitude at which all earthquakes in a space time frame are reliably detected. Approximately 25 located earthquakes are needed to calculate MC.
References. Coombs, M.L., White, S.W., and Scholl, D.W., 2007, Massive edifice failure at Aleutian arc volcanoes, Earth and Planetary Science Letters, v. 256, p. 403-418.
McGimsey, R.G., and Neal, C.A., 1997, 1996 Volcanic activity in Alaska and Kamchatka: Summary of events and response or the Alaska Volcano Observatory, U.S. Geological Survey Open File Report 97 433, 34p.
Miller, T.P., Waythomas, C.F., and Nye, C.J., 2003, Preliminary geologic map of Kanaga Volcano, Alaska, U.S. Geological Survey Open File Report 03-113, 1p.
Neal, C.A., McGimsey, R.G., Dixon, J.P., Cameron, C.E., Nuzhdaev, A.A., and Chibisova, M., 2011, 2008 Volcanic activity in Alaska, Kamchatka, and the Kurile Islands: Summary of events and response of the Alaska Volcano Observatory, U.S. Geological Survey Scientific Investigations Report 2010 5243, 94 p.
Waythomas, C.F., Miller, T.P., and Nye, C. J., 2001, Geology and Late Quaternary Eruptive History of Kanaga Volcano, a Calc Alkaline Stratovolcano in the Western Aleutian Islands, in Galloway, J.P. (ed), Alaska Studies by the U.S. Geological Survey in Alaska 2001, U.S. Geological Survey Professional Paper 1678, Chapter 15, pp.181-197.
Waythomas, C.F., Miller, T.P., and Nye, C. J., 2002, Preliminary volcano hazard assessment for Kanaga Volcano, Alaska, U.S. Geological Survey Open File Report 02 397, 27 p.
Wiemer, S and Wyss, M, 2000, Minimum Magnitude of Completeness in Earthquake Catalogs: Examples from Alaska, the Western United States, and Japan, Bulletin of the Seismological Society of America, vol. 90 no. 4, pp. 859 869 (DOI: 10.1785/0119990114).
References - Catalogs of earthquake hypocenters at Alaskan Volcanoes.
Dixon, J.P., Stihler, S.D., Power, J.A., Tytgat, G., Estes, S., Prejean, S., Sánchez, J.J., Sanches, R., McNutt, S.R., and Paskievitch, J., 2005, Catalog of Earthquake Hypocenters at Alaskan Volcanoes: January 1 through December 31, 2004, U.S. Geological Survey Open File Report 2005 1312, 74p.
Dixon, J.P., Stihler, S.D., Power, J.A., Tytgat, G., Estes, S., and McNutt, S.R., 2006, Catalog of earthquake hypocenters at Alaskan volcanoes: January 1 through December 31, 2005, U.S. Geological Survey Open File Report 2006 1264, 78 p.
Dixon, J.P., Stihler, S.D., Power, J.A., and Searcy, Cheryl, 2008, Catalog of earthquake hypocenters at Alaskan volcanoes: January 1 through December 31, 2006, U.S. Geological Survey Data Series 326, 79 p.
Dixon, J.P., Stihler, S.D., and Power, J.A., 2008, Catalog of Earthquake Hypocenters at Alaskan Volcanoes: January 1 through December 31, 2007, U.S. Geological Survey Data Series 367, 82p.
Dixon, J.P., and Stihler, S.D., 2009, Catalog of earthquake hypocenters at Alaskan volcanoes: January 1 through December 31, 2008, U.S. Geological Survey Data Series 467, 86 p.
Dixon, J.P., Stihler, S.D., Power, J.A., and Searcy, Cheryl, 2010, Catalog of earthquake hypocenters at Alaskan volcanoes: January 1 through December 31, 2009, U.S. Geological Survey Data Series 531, 84 p.
Dixon, J.P., Stihler, S.D., Power, J.A., and Searcy, C.K., 2011, Catalog of earthquake hypocenters at Alaskan Volcanoes: January 1 through December 31, 2010, U.S. Geological Survey Data Series 645, 82 p.
Dixon, J.P., Stihler, S.D., Power, J.A., and Searcy, C.K., 2012, Catalog of earthquake hypocenters at Alaskan Volcanoes: January 1 through December 31, 2011, U.S. Geological Survey Data Series 730, 82 p.
Information Contacts: Alaska Volcano Observatory (AVO), a joint program of theUnited States Geological Survey (USGS), theGeophysical Institute of the University of Alaska Fairbanks (UAFGI), and theState of Alaska Division of Geological and Geophysical Surveys (ADGGS), Anchorage, AK (URL: http://www.avo.alaska.edu); Christina A. Neal, USGS/AVO Anchorage, AK (URL: http://www.avo.alaska.edu); NASA Earth Observatory (URL: http://earthobservatory.nasa.gov/).
2024: January
2023: December
2012: February
AVO reported that unrest at Kanaga continued during 3-9 January; no new eruptive activity was evident in satellite and webcam images. Small daily earthquakes were detected until 2 January when a storm-related power failure took local monitoring data offline. Satellite radar images showed that large NW-SE-trending fractures intersecting the summit crater had likely formed around the time of the 18 December explosive event. The Volcano Alert Level remained at Advisory (the second level on a four-level scale) and the Aviation Color Code remained at Yellow (the second color on a four-color scale).
Source: US Geological Survey Alaska Volcano Observatory (AVO)
AVO reported that the rate of seismicity at Kanaga significantly declined after the explosion on 18 December and was slightly elevated with small daily earthquakes during 19-26 December. Satellite observations following the event showed a debris flow extending 1.5 km down the NW flank. Possible minor steaming was visible in a webcam image on 20 December. Weakly elevated surface temperatures were identified in satellite data during 23-26 December. The Volcano Alert Level remained at Advisory (the second level on a four-level scale) and the Aviation Color Code remained at Yellow (the second color on a four-color scale).
Source: US Geological Survey Alaska Volcano Observatory (AVO)
AVO reported that a small explosion at Kanaga was detected in local infrasound and seismic data at 2231 on 18 December, and was followed by elevated seismicity. No ash emissions were detected in partly cloudy satellite images. The next day the Volcano Alert Level was raised to Advisory (the second level on a four-level scale) and the Aviation Color Code was raised to Yellow (the second color on a four-color scale).
Source: US Geological Survey Alaska Volcano Observatory (AVO)
AVO reported that the level of unrest at Kanaga declined to background levels. On 2 March the Volcano Alert Level was lowered to Normal and the Aviation Color Code was lowered to Green.
Source: US Geological Survey Alaska Volcano Observatory (AVO)
AVO reported that no unusual activity was detected in seismic data or in partly-cloudy satellite images of Kanaga during 22-24 and 26-28 February. Low-level volcanic tremor was detected on 25 February. The Volcano Alert Level remained at Advisory and the Aviation Color Code remained at Yellow.
Source: US Geological Survey Alaska Volcano Observatory (AVO)
AVO reported possible explosive activity at Kanaga on 18 February. Volcanic tremor detected during 0623-0627 was followed by about an hour of numerous small seismic events. Satellite images showed a detached ash plume, 8 km in length, which drifted 39 km NE. AVO raised the Aviation Color Code to Yellow and the Volcano Alert Level to Advisory on 18 February. Elevated seismic activity continued on 19 February, and photographs taken by a local observer showed a small steam plume. Clouds prevented views of the volcano during 19-21 February.
Source: US Geological Survey Alaska Volcano Observatory (AVO)
Reports are organized chronologically and indexed below by Month/Year (Publication Volume:Number), and include a one-line summary. Click on the index link or scroll down to read the reports.
Summit-crater eruption generates steam and ash emissions
Pilots and ground observers reported low-level eruptive activity in late December through mid-January. On 29 December, a pilot reported that Kanaga was steaming more than usual; observers in the village of Adak . . . also saw the steaming. Several days later, FWS personnel climbing Mount Moffett near Adak smelled sulfur. On 7 January, Navy personnel in Adak reported increased steam emissions from numerous locations near the summit, with all snow gone from the summit area. The next day, steam was pouring out of the summit crater, the rim was dark, possibly blackened by ash, and sulfur smells were reported in Adak. Poor weather obscured the volcano until 13 January, when observers in Adak reported that the S flank was covered with ash and that steam was still rising from the summit crater. They also reported "dark smoke" coming from a fissure and a nearby vent on the SE flank; the "smoke" did not rise above the summit. During the week of 14-21 January, pilots reported low-level steam-and-ash emissions, with local ashfall on the flanks of the volcano. A plume extending SW was also detected on satellite imagery early in the week.
Information Contacts: AVO.
Low-level steam emissions with minor ash content
Low-level eruptive activity began in late December 1993. Unusual amounts of steam, ashfall on the flanks of the volcano, and sulfur smell in Adak . . . were reported through mid-January 1994. Pilots and observers in Adak also reported continued low-level emission of steam, and possibly minor ash, from Kanaga during the third week of January. Photographs taken by the U.S. Navy show two steam vents near the summit. Observers in Adak were unable to view Kanaga from 27 January through 18 February. However, the smell of sulfur was detected in early February.
Pilot reports indicated another eruption on 21 February with plume heights of 3.6-4.5 km, rising at times to 7.5 km altitude; ground observers reported a steam plume rising to 600-900 m altitude. Satellite data were inconclusive in detecting the plume.
Information Contacts: AVO; J. Lynch, SAB.
Intermittent steam-and-ash emissions
Intermittent venting of steam and ash continued in February and March. Observers in Adak . . . reported ash-rich plumes reaching hundreds of meters above the . . . summit on 18 February. Satellite images confirmed the presence of ash in the plume emitted from the cone. Continued minor, low-level steam-and-ash venting was reported by airline crews and ground observers on 21 February. Observers in Adak reported steam plumes coming from near-summit fumaroles on 4 March. Overcast conditions at the summit masked any possible ash emissions in late February and early March. Observations of fresh snowfall did not reveal any new ash deposits. Although ground observations from Adak were limited, a pilot reported a short-lived steam-and-ash burst on the afternoon of 10 March.
Information Contacts: AVO.
Intermittent low-level activity, steam-and-ash plume
Intermittent low-level activity continued in mid-March. Although ground observations from Adak . . . were limited due to poor weather, ground observers reported a moderate steam plume on the afternoon of 16 March and sulfur odors on 20 March. On 31 March, pilots and ground observers reported a vigorous steam plume containing minor ash that extended above the volcano to an estimated 3,050 m altitude. Local winds carried the plume to the N and NE, and light ashfall occurred on the flanks of the volcano. Satellite images revealed a warm spot . . . as well as a faint plume headed N, consistent with pilot reports. Observers in Adak reported no significant ashfall in March.
Residents of Adak reported that poor weather obscured Kanaga during the first half of April. The FAA and NWS logged no pilot reports of continuing eruptive activity at Kanaga through mid-April. Naval weather observers in Adak reported steam and ash rising a few hundred meters above the volcano on 12 April. Adak residents also reported a very strong sulfur smell during the second week of April.
Information Contacts: AVO.
Minor steam and ash eruptions
Low-level steam and ash eruptions continued from mid-April through mid-May, although poor weather often obscured the volcano. Observers in Adak . . . reported seeing steam, and possibly minor ash, rising a few hundreds of meters above the volcano early during the week of 15-22 April. On 28 April, FWS personnel in Adak observed and photographed a gray ash cloud erupting from the summit crater. The cloud did not rise much above the summit before strong winds carried the plume to the SW. On 5 May, U.S. Navy personnel in Adak observed steam clouds from the summit crater during a short break in the weather. Early in the week of 6-13 May, U.S. Navy and FWS personnel observed steam clouds rising from the summit crater to an estimated altitude of 1,800-2,400 m. They also observed a dark stripe extending down the SE flank from near the summit; a lack of steaming suggested that it was either a small mudflow or ash concentrated by snowmelt.
Information Contacts: AVO.
Low-level steam-and-ash emissions continue
Low-level steam and ash emissions continued through late May and the first half of June, although poor weather frequently prevented observations. On several occasions in late May a vigorous steam plume was observed rising through scattered clouds above the volcano. Observers in Adak . . . saw a steam plume over the volcano on 31 May and a gray plume rising 1,000-1,200 m on 9 June. Aerial photographs of the summit area taken by U.S. Navy personnel in late January show that the vent system extends beyond the summit onto the upper W flank, corroborating reports by ground observers during the last several months.
Information Contacts: AVO.
Incandescent material observed cascading down the NW flank
Several pilot reports received by the FAA during 10-17 June indicated steam plumes carrying small amounts of ash that reached 1.5-2 km altitude and drifted generally SE. Subsequent analysis of AVHRR satellite images, however, could not confirm the presence of ash. Poor weather precluded any ground observations from Adak . . . .
FWS personnel aboard the RV Tiglax observed continuing eruptive activity during the early morning hours (0145 -0245) of 20 June. From their location several hundred meters off the NW shoreline of Kanaga Island, crew members observed two distinct "streams" of incandescent material cascading down the NW flank, but were unsure if any debris reached the ocean. The upper flanks and summit were obscured by steam, and the exact origin of the incandescent streams could not be determined. Analysis of satellite images from near the time of these observations was hampered by cloud cover.
Information Contacts: AVO.
Steam-and-ash plume rises 4,500 m; enlarged hot spot on imagery
On the morning of 15 July a pilot observed steam plumes rising from multiple vents to ~600 m above the summit. FWS personnel in Adak . . . reported steam plumes during 16-22 July. A distinct hot spot . . . was seen on a satellite image from 0906 on 22 July. FWS personnel aboard the RV Tiglax observed incandescent flows on the flank of Kanaga during the night of 27-28 July; low-level steaming from the summit area was continuing. Also in late July the FWS crew saw a blocky lava flow entering the sea on the NW flank, forming a new headland and small cove. Pilots reported incandescent flows on the NW flank during the following week, and steam plumes to 1,500 m altitude. On 10 August the RV Tiglax passed within ~3 km of shore and the crew observed the two NW-flank lava flows for the first time during daylight. Steam was rising from where the flows were entering the sea, and a strong SO2 odor was detected. Satellite imagery again recorded hot spots . . . during 2-12 August.
At 0500 on 18 August, the FAA received a pilot report of "glowing" at the summit. Pilots reported a light gray, dense steam cloud at 0800 rising to 4,500 m above the summit that had a mushroom-shaped top and was trailing to the E. A satellite infrared image taken at 0836 showed a summit hot spot twice as large as that seen in recent weeks, suggesting an increase in heating associated with production of lava flows. Also visible in the image was a plume extending 15-20 km NE; enhancements of calibrated data suggested that the plume may have contained some ash. Throughout the day, pilots and FWS personnel in Adak observed an eruption cloud consisting of a white, dominantly steam portion, which rose to ~4,500 m altitude, and a vigorously roiling, gray, ash-bearing portion that rose to an estimated 2,400-3,000 m altitude. A loud rumbling, similar to the sound of a freight train, was heard in Adak all afternoon and into the evening. Prevailing winds carried the plume NE, and a light curtain of fallout was observed. Satellite images from 1133 and about 2000 on 18 August showed a plume drifting NE.
The summit hot spot, which on 18 August appeared to have doubled in size, persisted on a satellite image from 1004 on 19 August. No plume was visible that day, although cloud cover may have obscured it. FWS observers reported continued rumbling from the direction of the volcano. Kanaga continued to erupt minor amounts of ash during 20-21 August, interfering with local air traffic and dropping a light dusting of ash on the community of Adak. As of midday on 22 August, analysis of satellite imagery indicated a possible plume, containing minor ash, drifting generally ESE from the volcano over Adak. The FAA enforced a 24-km restricted flight zone around Kanaga until 1430 to minimize the possibility of aircraft encountering an ash cloud during instrument approach and departure. Poor weather obscured the volcano through the morning of 22 August. However, no ash cloud was seen from Adak as visibility improved through the day.
Pilots and other observers continued to report and photograph avalanches of hot fragmental debris cascading down the N flank of the volcano into the ocean. Although AVO has been unable to clearly discern the source of this material, it likely represents collapse of a growing lava dome or ejection of hot blocks of lava from near or within the summit crater. Based on the last eight months of activity, continuing episodes of ash eruption accompanied by avalanching of hot debris down the volcano's flanks can be expected. Depending on wind conditions and the size of a given eruptive episode, additional ashfall on Adak is possible.
. . . .The eruption has been characterized by intermittent, low-level steam and ash emissions producing plumes rarely rising over 3,000-4,500 m altitude and drifting a few tens of kilometers downwind. Although tracking of ash fallout is limited due to the remote location of Kanaga, it appears from satellite imagery that detectable fallout has been confined to within a few tens of kilometers of the volcano. On 22 August, AVO learned that several very light dustings of fine ash on the N portions of Adak had occurred over the past few months.
Information Contacts: AVO.
Minor ash emission
Eruptive activity continued in the second half of August with emissions of steam and minor amounts of ash on 20-21 August. A shift in wind direction produced light ashfall in Adak on 20 August and temporarily disrupted air traffic to Adak on the 22nd. Weather clouds frequently obscured Kanaga from late August through mid-September. Preliminary analysis suggests the ash is broadly similar in composition to other known tephras and lavas from Kanaga.
Observers reported white steam clouds rising to 600 m above the summit on 8 September; occasional low rumbling noises were also heard. Weather clouds obscured Kanaga for much of 16-30 September, but AVHRR satellite images indicated a steam plume extending ~50 km S of Kanaga on 22 September. . . . .
Information Contacts: AVO.
Minor ashfall observed and "hot spot" detected by satellite
Observers in Adak . . . reported little activity during the first half of October, when clouds obscured Kanaga. Minor ash fall was noted 3-5 km S of the volcano on 12 October. A white steam cloud was observed from Adak the next day rising 1,200-1,500 m above the summit, and no new ash deposits were seen on the flanks of the volcano, covered by fresh snowfall. AVHRR satellite imagery on 13 October revealed a "hot spot" at the summit, but no eruption cloud was observed. During the following week, a white steam cloud rose 900-1,200 m above the summit. The volcano was obscured by cloudy weather conditions from 21 October through 25 November.
Information Contacts: AVO.
Occasional mild steam plumes
As of 31 March, observers in Adak (33 km E) continued to report occasional mild steam plumes above the summit. Through 31 March no thermal anomaly had been detected since 13 October 1994 when eruptive activity that began in December 1993 apparently ceased (BGVN 18:12 and 19:11). That eruption was characterized by intermittent, low-level steam and ash emissions producing plumes rarely rising over 3,000-4,500 m altitude and drifting a few tens of kilometers downwind. There are no seismometers on Kanaga, located 965 km WSW of the tip of the Alaska Peninsula on Kanaga Island, and monitoring is done through a combination of satellite image analysis and observations by pilots and residents of Adak.
Information Contacts: Alaska Volcano Observatory (AVO), a cooperative program of a) U.S. Geological Survey, 4200 University Drive, Anchorage, AK 99508-4667, USA, b) Geophysical Institute, University of Alaska, PO Box 757320, Fairbanks, AK 99775-7320, USA, and c) Alaska Division of Geological & Geophysical Surveys, 794 University Ave., Suite 200, Fairbanks, AK 99709, USA.
Steaming, weak plumes, and minor ashfall
On 3 and 4 June steaming from the summit and from the 1994 avalanche deposits on the NW flank of Kanaga was observed by US Fish & Wildlife Service (USFWS) personnel. On 19 June a pilot observed a weak plume that rose ~300 m above the summit. He also described possible fresh ash or bare ground due to snow-melt on Kanaga's W side. On 20 June, another aviation report from a USFWS biologist noted a dirty haze or plume at an elevation no higher than the summit, extending ~25 km S from Kanaga. The upper flanks again appeared dark, as on 19 June. An AVHRR satellite image on 21 June showed a steam plume extending ~180 km N, accompanied by a weak thermal anomaly. On 23 June, the U.S. Navy Meteorologic Office in Adak (~33 km E) reported a thin dilute ash cloud rising ~30-60 m above the summit and drifting N. A light dusting of ash on the volcano was noted, and three active steam vents on the S side were observed.
An intermittent, mildly explosive eruption accompanied by lava extrusion within the summit crater occurred at Kanaga Volcano from January through mid-October, 1994. Although summit steam plumes have persisted since then, recent reports suggest renewed, low-level eruptive activity or, alternatively, especially vigorous steaming associated with cooling of lava in the summit crater.
Information Contacts: Alaska Volcano Observatory (AVO), a cooperative program of a) U.S. Geological Survey, 4200 University Drive, Anchorage, AK 99508-4667 USA, b) Geophysical Institute, University of Alaska, PO Box 757320, Fairbanks, AK 99775-7320, USA, and c) Alaska Division of Geological & Geophysical Surveys, 794 University Ave., Suite 200, Fairbanks, AK 99709, USA.
Minor steaming from the summit area
Clouds obscured the volcano during much of the second half of July, preventing ground and satellite observations. Observers on Adak got a brief view on 14 July and reported light steaming from the summit. On 20 July an AVO geologist on Adak viewed Kanaga for several hours. As has been reported intermittently by U.S. Fish and Wildlife Service (FWS) observers since last fall, fumaroles high on the E and SE flank steamed vigorously and a hazy plume of steam and possibly volcanic gas emanated from the summit crater and drifted a few kilometers downwind. In contrast to other mountain peaks of similar elevation, most of Kanaga was dark and snow-free. One snow patch just below the summit was mantled by debris. It is not known if material mantling the cone is the result of possible activity in late June or merely wind-reworking of material deposited during the extended 1994 eruption. Clouds again obscured Kanaga through the first half of August, but FWS personnel on Adak observed minor steaming from the summit crater during 12-25 August.
Information Contacts: Alaska Volcano Observatory (AVO), a cooperative program of a) U.S. Geological Survey, 4200 University Drive, Anchorage, AK 99508-4667 USA, b) Geophysical Institute, University of Alaska, PO Box 757320, Fairbanks, AK 99775-7320, USA, and c) Alaska Division of Geological & Geophysical Surveys, 794 University Ave., Suite 200, Fairbanks, AK 99709, USA.
18 February 2012 eruption; new fissure
In our last report on Kanaga, issued in 1995 (BGVN 20:08), we discussed an eruption during January through mid-October 1994. In addition to a brief explosion in February 2012, more information from the Alaska Volcano Observatory (AVO) has come to our attention, some discussing events more than a decade ago. This information suggested either renewed low level eruptions or vigorous steaming from lava cooling in the summit crater.
What follows is condensed from reports, primarily by researchers at AVO, describing the time span from 1996 to 2012. Data for 2012 is in a separate subsection. The last section looks at Kanaga seismicity in terms of located earthquakes and MC, Magnitude of Completeness, a means of looking at seismic data quality, homogeneity, and consistency, and the smallest events reliably recorded in the cataloged data (Wiemer and Wyss, 2000).
Figures 1 and 2 comprise three maps showing, respectively, the location of Kanaga Island in the Aleutian Islands, a physical map of Kanaga Island showing the location of Kanaga volcano, and a geological map of the volcano.
|
Figure 1. (a) Map of the western Aleutian Islands, Alaska, showing the location of Kanaga Island. Courtesy of AVO. (b) Topographic map of Kanaga Island showing Kanaga volcano on the northernmost portion of the island. Courtesy of U.S. Geological Survey (USGS) and Amar Andalkar. |
|
Figure 2. Preliminary geologic map showing Kanaga volcano. Notice that concentric to Kanaga to the SE is the arcuate Kanaton Ridge, inferred to be the remnant of Mount Kanaton, an ancestral volcano destroyed by structural collapse; see generalized geologic cross section in the lower right-hand side of the figure. Courtesy Miller and others (2003, Sheet 1). |
According to McGimsey and Neal (1997), a commercial airline crew noted a small, bluish brown cloud possibly containing some ash on 11 June 1996, "rising a few hundred feet above the summit of the volcano." Strong winds carried the cloud down the SE flank of the volcano, depositing ash that discolored the snow. The flight crew noted a sulfur odor upon descent into nearby Adak Island. A ground observer on Adak noted dark splotches on the E flank of Kanaga, but a ballistic origin for the pattern (i.e., volcanic bombs) was never confirmed. It should be noted that these observations occurred several days after an M 6 earthquake in the area, and extensive rockfalls and increased steaming had been observed at Gareloi and Kasatochi volcanoes E and W of Kanaga.
Kevin Bell, the captain of the RV Tiglax, watched Kanaga from a point off its N flank on 3 September 1996. He observed that the extent of lava flows was similar to that inferred from 1995 photographs. Small wisps of steam persisted along the upper reaches of the lava flow on the NW flank. Bell also saw material rolling down the steep flank of the volcano during the Summer and Fall of 1996.
Waythomas and others (2002) noted that ash clouds from Kanaga could interfere with the commercial airliners flying between East Asia and Alaska. Figure 3 shows a satellite image of Kanaga volcano taken 13 August 2002.
|
Figure 3. An astronaut's photograph acquired late in the day of 13 August 2002 of Kanaga volcano; N is approximately to the left. The volcano is known for its active fumaroles and hot springs (located, in this image, by fine steam plumes on the NE flank of the volcano). A small lake to the SE of the cone is situated on the floor of a larger, more ancient volcanic caldera. Astronaut photograph ISS005 E 10097, from NASA Earth Observatory; courtesy of the Earth Sciences and Image Analysis Laboratory at Johnson Space Center. |
Coombs and others (2007) described subaerial evidence for large-scale prehistoric collapse at Kanaga volcanic center and conducted submarine side-scan sonar profiling N of the volcano. These data reveal a hummocky seafloor topography suggestive of landslide debris.
2012 Activity. AVO detected volcanic tremor at Kanaga from 1523 to 1527 UTC on 18 February 2012. This was followed by numerous small earthquakes at Kanaga continuing for about an hour.
A possible weak ash cloud ~8 km in length, ~39 km NE of the volcano, was detected by the Advanced Very High Resolution Radiometer (AVHRR) aboard a polar-orbiting satellite, at 1535 UTC. The plume was observed as far as ~39 km NE of the volcano.
Because of the new unrest and possible explosive activity with the likely ash cloud, AVO raised the Alert Level to Advisory and the Aviation Color Code to Yellow. Somewhat elevated seismicity continued at Kanaga on 19 February 2012, but was not detectable on 20 February. Low amplitude tremor was detected on 25 February. On 2 March, citing continued background level seismicity, AVO returned Kanaga to Normal and the Aviation Color Code to Green.
Photographs taken by a local observer on 19 February showed a small steam plume rising from Kanaga's crater (figure 4), who thought that the two dark stripes extending down the flank possibly represent fresh ash and/or flowage deposits.
|
Figure 4. Kanaga volcano emitting a steam plume at 1226 on 19 February 2012. Photo taken from the White Alice site, ~3 km W of Adak, Alaska; courtesy of Marjorie Tillion, from AVO web site. |
Figures 5-7 show images and photographs of Kanaga taken in the weeks and months following the brief 18 February eruption. The fissure, which vented steam, developed sometime after October 2011.
|
Figure 5. Radar image of Kanaga collected on 5 March 2012. N is to the right. AVO workers described an E-trending fissure crossing the S crater rim and continuing part way down the W flank. Total length of the fissure was estimated at ~600 m. It developed sometime after October 2011. As mentioned in text, a short duration explosive eruption occurred on 18 February 2012. It was unclear whether that 18 February activity and the development of the fissure were related. TerraSar-X image copyright ©2012 Infoterra GmbH courtesy of Zhong Lu and David Schneider AVO/USGS. |
|
Figure 6. Aerial photograph taken at 1200 on 30 June 2012 of Kanaga's summit with a fissure emitting steam. Photograph by Cyrus Read; image courtesy of AVO/USGS. |
|
Figure 7. Aerial photograph of Kanaga looking E, taken November 2012. The steam discharged from the E-trending fissure on the S side of the dome Photograph courtesy of Roger Clifford. |
Located earthquakes enable computation of MC. Table 1 shows the annual number of located earthquakes recorded by the U.S. Geological Survey (USGS) within 20 km of the Kanaga volcanic center for the years of 2004-2011. References for this table came from USGS catalogs of earthquake hypocenters at Alaskan volcanoes are cited in a separate list below. The catalog for 2012 is not yet available. The first seismic monitoring station at Kanaga was installed in September 1999.
Table 1. Number of earthquakes for various years located for the Kanaga volcano seismograph subnetwork within 20 km of the volcanic center. The column of "Other" earthquakes refers to those outside the defined categories of VT and LP (including hybrid, regional-tectonic, teleseismic, shore-ice, calibrations, other non-seismic, and cause unknown). Compiled from the U.S. Geological Survey's annual Catalog of Earthquake Hypocenters at Alaskan Volcanoes.
| Year | Earthquakes Located | Volcano-tectonic (VT) | Low-frequency (LF) | Other |
| 2004 | 32 | 30 | 2 | 0 |
| 2005 | 42 | 42 | 0 | 0 |
| 2006 | 56 | 56 | 0 | 0 |
| 2007 | 48 | 48 | 0 | 0 |
| 2008 | 478 | 403 | 0 | 75 |
| 2009 | 28 | 26 | 0 | 2 |
| 2010 | 43 | 43 | 0 | 0 |
| 2011 | 21 | 21 | 0 | 0 |
According to Dixon and others (2009), the large number of earthquakes located at Kanaga in 2008 was the result of an M ~6.6 tectonic earthquake of 2 May 2008 and its aftershocks. That publication also includes a map with stations and epicenters, cross sections with hypocenters, and a plot of depth in a time series during 2011.
The USGS annual Catalog of earthquake hypocenters at Alaskan Volcanoes include a category for each volcano entitled Magnitude of Completeness (MC), defined as the magnitude at which 90% of the data can be modeled by a power law fit (Wiemer and Wyss, 2000). Below MC, some fraction of small earthquakes are missed by the network, for reasons such as: those earthquakes were too small to be reliably recorded; geophysicists decided to exclude events below some threshold; and for aftershocks and in the midst of various kinds of overriding signal or noise, smaller earthquakes may have been too small to be detected (eg. swamped by the coda of larger events).
According to Dixon and others (2012), Mc for AVO seismograph subnetworks using data from Kanaga (6 stations) for the period March 2002-December 2011 was 1.2. In practice, this means that 1.2 was the lowest magnitude at which all earthquakes in a space time frame are reliably detected. Approximately 25 located earthquakes are needed to calculate MC.
References. Coombs, M.L., White, S.W., and Scholl, D.W., 2007, Massive edifice failure at Aleutian arc volcanoes, Earth and Planetary Science Letters, v. 256, p. 403-418.
McGimsey, R.G., and Neal, C.A., 1997, 1996 Volcanic activity in Alaska and Kamchatka: Summary of events and response or the Alaska Volcano Observatory, U.S. Geological Survey Open File Report 97 433, 34p.
Miller, T.P., Waythomas, C.F., and Nye, C.J., 2003, Preliminary geologic map of Kanaga Volcano, Alaska, U.S. Geological Survey Open File Report 03-113, 1p.
Neal, C.A., McGimsey, R.G., Dixon, J.P., Cameron, C.E., Nuzhdaev, A.A., and Chibisova, M., 2011, 2008 Volcanic activity in Alaska, Kamchatka, and the Kurile Islands: Summary of events and response of the Alaska Volcano Observatory, U.S. Geological Survey Scientific Investigations Report 2010 5243, 94 p.
Waythomas, C.F., Miller, T.P., and Nye, C. J., 2001, Geology and Late Quaternary Eruptive History of Kanaga Volcano, a Calc Alkaline Stratovolcano in the Western Aleutian Islands, in Galloway, J.P. (ed), Alaska Studies by the U.S. Geological Survey in Alaska 2001, U.S. Geological Survey Professional Paper 1678, Chapter 15, pp.181-197.
Waythomas, C.F., Miller, T.P., and Nye, C. J., 2002, Preliminary volcano hazard assessment for Kanaga Volcano, Alaska, U.S. Geological Survey Open File Report 02 397, 27 p.
Wiemer, S and Wyss, M, 2000, Minimum Magnitude of Completeness in Earthquake Catalogs: Examples from Alaska, the Western United States, and Japan, Bulletin of the Seismological Society of America, vol. 90 no. 4, pp. 859 869 (DOI: 10.1785/0119990114).
References - Catalogs of earthquake hypocenters at Alaskan Volcanoes.
Dixon, J.P., Stihler, S.D., Power, J.A., Tytgat, G., Estes, S., Prejean, S., Sánchez, J.J., Sanches, R., McNutt, S.R., and Paskievitch, J., 2005, Catalog of Earthquake Hypocenters at Alaskan Volcanoes: January 1 through December 31, 2004, U.S. Geological Survey Open File Report 2005 1312, 74p.
Dixon, J.P., Stihler, S.D., Power, J.A., Tytgat, G., Estes, S., and McNutt, S.R., 2006, Catalog of earthquake hypocenters at Alaskan volcanoes: January 1 through December 31, 2005, U.S. Geological Survey Open File Report 2006 1264, 78 p.
Dixon, J.P., Stihler, S.D., Power, J.A., and Searcy, Cheryl, 2008, Catalog of earthquake hypocenters at Alaskan volcanoes: January 1 through December 31, 2006, U.S. Geological Survey Data Series 326, 79 p.
Dixon, J.P., Stihler, S.D., and Power, J.A., 2008, Catalog of Earthquake Hypocenters at Alaskan Volcanoes: January 1 through December 31, 2007, U.S. Geological Survey Data Series 367, 82p.
Dixon, J.P., and Stihler, S.D., 2009, Catalog of earthquake hypocenters at Alaskan volcanoes: January 1 through December 31, 2008, U.S. Geological Survey Data Series 467, 86 p.
Dixon, J.P., Stihler, S.D., Power, J.A., and Searcy, Cheryl, 2010, Catalog of earthquake hypocenters at Alaskan volcanoes: January 1 through December 31, 2009, U.S. Geological Survey Data Series 531, 84 p.
Dixon, J.P., Stihler, S.D., Power, J.A., and Searcy, C.K., 2011, Catalog of earthquake hypocenters at Alaskan Volcanoes: January 1 through December 31, 2010, U.S. Geological Survey Data Series 645, 82 p.
Dixon, J.P., Stihler, S.D., Power, J.A., and Searcy, C.K., 2012, Catalog of earthquake hypocenters at Alaskan Volcanoes: January 1 through December 31, 2011, U.S. Geological Survey Data Series 730, 82 p.
Information Contacts: Alaska Volcano Observatory (AVO), a joint program of theUnited States Geological Survey (USGS), theGeophysical Institute of the University of Alaska Fairbanks (UAFGI), and theState of Alaska Division of Geological and Geophysical Surveys (ADGGS), Anchorage, AK (URL: http://www.avo.alaska.edu); Christina A. Neal, USGS/AVO Anchorage, AK (URL: http://www.avo.alaska.edu); NASA Earth Observatory (URL: http://earthobservatory.nasa.gov/).
This compilation of synonyms and subsidiary features may not be comprehensive. Features are organized into four major categories: Cones, Craters, Domes, and Thermal Features. Synonyms of features appear indented below the primary name. In some cases additional feature type, elevation, or location details are provided.
Cones |
||||
| Feature Name | Feature Type | Elevation | Latitude | Longitude |
| Kanaton | Shield volcano | 792 m | ||
| Round Head | Cone | 344 m | 51° 54' 0" N | 177° 4' 0" W |
|
|
||||||||||||||||||||||||
There is data available for 18 confirmed Holocene eruptive periods.
2023 Dec 18 - 2023 Dec 18 Confirmed Eruption
| Episode 1 | Eruption Episode | ||||
|---|---|---|---|---|
| 2023 Dec 18 - 2023 Dec 18 | Evidence from Observations: Reported | |||
2012 Feb 18 - 2012 Feb 18 Confirmed Eruption Max VEI: 2
| Episode 1 | Eruption Episode | E-W fissure at summit crater | |||||||||||||||||||||||||||||||||||||||||||||||||||||||||||
|---|---|---|---|---|---|---|---|---|---|---|---|---|---|---|---|---|---|---|---|---|---|---|---|---|---|---|---|---|---|---|---|---|---|---|---|---|---|---|---|---|---|---|---|---|---|---|---|---|---|---|---|---|---|---|---|---|---|---|---|---|
| 2012 Feb 18 - 2012 Feb 18 | Evidence from Observations: Reported | |||||||||||||||||||||||||||||||||||||||||||||||||||||||||||
|
List of 10 Events for Episode 1 at E-W fissure at summit crater
| ||||||||||||||||||||||||||||||||||||||||||||||||||||||||||||
[ 1996 Jun 11 ] Uncertain Eruption
| Episode 1 | Eruption Episode | ||||||||||||||||||||
|---|---|---|---|---|---|---|---|---|---|---|---|---|---|---|---|---|---|---|---|---|
| 1996 Jun 11 - Unknown | Evidence from Unknown | |||||||||||||||||||
|
List of 2 Events for Episode 1
| ||||||||||||||||||||
1995 Jun 19 (?) - 1995 Jun 23 (?) Confirmed Eruption Max VEI: 2 (?)
| Episode 1 | Eruption Episode | |||||||||||||||||||||||||
|---|---|---|---|---|---|---|---|---|---|---|---|---|---|---|---|---|---|---|---|---|---|---|---|---|---|
| 1995 Jun 19 (?) - 1995 Jun 23 (?) | Evidence from Observations: Reported | ||||||||||||||||||||||||
|
List of 3 Events for Episode 1
| |||||||||||||||||||||||||
1994 Jan 5 ± 4 days - 1994 Nov 26 ± 4 days Confirmed Eruption Max VEI: 2
| Episode 1 | Eruption Episode | |||||||||||||||||||||||||||||||||||
|---|---|---|---|---|---|---|---|---|---|---|---|---|---|---|---|---|---|---|---|---|---|---|---|---|---|---|---|---|---|---|---|---|---|---|---|
| 1994 Jan 5 ± 4 days - 1994 Nov 26 ± 4 days | Evidence from Observations: Reported | ||||||||||||||||||||||||||||||||||
|
List of 5 Events for Episode 1
| |||||||||||||||||||||||||||||||||||
1942 Confirmed Eruption Max VEI: 1
| Episode 1 | Eruption Episode | ||||||||||||||||||||
|---|---|---|---|---|---|---|---|---|---|---|---|---|---|---|---|---|---|---|---|---|
| 1942 - Unknown | Evidence from Observations: Reported | |||||||||||||||||||
|
List of 2 Events for Episode 1
| ||||||||||||||||||||
[ 1933 ] Discredited Eruption
1906 May Confirmed Eruption
| Episode 1 | Eruption Episode | Summit, upper SW flank | ||||||||||||||||||||||||
|---|---|---|---|---|---|---|---|---|---|---|---|---|---|---|---|---|---|---|---|---|---|---|---|---|---|
| 1906 May - Unknown | Evidence from Observations: Reported | ||||||||||||||||||||||||
|
List of 3 Events for Episode 1 at Summit, upper SW flank
| |||||||||||||||||||||||||
1904 Confirmed Eruption Max VEI: 0
| Episode 1 | Eruption Episode | Upper south flank ? | |||||||||||||||||||
|---|---|---|---|---|---|---|---|---|---|---|---|---|---|---|---|---|---|---|---|---|
| 1904 - Unknown | Evidence from Observations: Reported | |||||||||||||||||||
|
List of 2 Events for Episode 1 at Upper south flank ?
| ||||||||||||||||||||
[ 1829 ] Uncertain Eruption
| Episode 1 | Eruption Episode | |||||||||||||||
|---|---|---|---|---|---|---|---|---|---|---|---|---|---|---|---|
| 1829 - Unknown | Evidence from Unknown | ||||||||||||||
|
List of 1 Events for Episode 1
| |||||||||||||||
[ 1827 ] Uncertain Eruption
| Episode 1 | Eruption Episode | |||||||||||||||
|---|---|---|---|---|---|---|---|---|---|---|---|---|---|---|---|
| 1827 - Unknown | Evidence from Unknown | ||||||||||||||
|
List of 1 Events for Episode 1
| |||||||||||||||
[ 1790 - 1791 ] Discredited Eruption
1783 (?) - 1787 (?) Confirmed Eruption
| Episode 1 | Eruption Episode | ||||||||||||||||||||
|---|---|---|---|---|---|---|---|---|---|---|---|---|---|---|---|---|---|---|---|---|
| 1783 (?) - 1787 (?) | Evidence from Observations: Reported | |||||||||||||||||||
|
List of 2 Events for Episode 1
| ||||||||||||||||||||
[ 1768 ] Discredited Eruption
[ 1763 ] Uncertain Eruption
| Episode 1 | Eruption Episode | ||||
|---|---|---|---|---|
| 1763 - Unknown | Evidence from Unknown | |||
1400 ± 50 years Confirmed Eruption
| Episode 1 | Eruption Episode | T11 tephra | ||||||||||||||||||||||||
|---|---|---|---|---|---|---|---|---|---|---|---|---|---|---|---|---|---|---|---|---|---|---|---|---|---|
| 1400 ± 50 years - Unknown | Evidence from Isotopic: 14C (calibrated) | ||||||||||||||||||||||||
|
List of 3 Events for Episode 1 at T11 tephra
| |||||||||||||||||||||||||
1150 ± 100 years Confirmed Eruption
| Episode 1 | Eruption Episode | T10 tephra | ||||||||||||||||||||||||
|---|---|---|---|---|---|---|---|---|---|---|---|---|---|---|---|---|---|---|---|---|---|---|---|---|---|
| 1150 ± 100 years - Unknown | Evidence from Isotopic: 14C (calibrated) | ||||||||||||||||||||||||
|
List of 3 Events for Episode 1 at T10 tephra
| |||||||||||||||||||||||||
0850 ± 200 years Confirmed Eruption
| Episode 1 | Eruption Episode | T9 tephra | ||||||||||||||||||||||||
|---|---|---|---|---|---|---|---|---|---|---|---|---|---|---|---|---|---|---|---|---|---|---|---|---|---|
| 0850 ± 200 years - Unknown | Evidence from Isotopic: 14C (calibrated) | ||||||||||||||||||||||||
|
List of 3 Events for Episode 1 at T9 tephra
| |||||||||||||||||||||||||
0200 ± 150 years Confirmed Eruption
| Episode 1 | Eruption Episode | T8 tephra | ||||||||||||||||||||||||
|---|---|---|---|---|---|---|---|---|---|---|---|---|---|---|---|---|---|---|---|---|---|---|---|---|---|
| 0200 ± 150 years - Unknown | Evidence from Isotopic: 14C (calibrated) | ||||||||||||||||||||||||
|
List of 3 Events for Episode 1 at T8 tephra
| |||||||||||||||||||||||||
1550 BCE ± 100 years Confirmed Eruption
| Episode 1 | Eruption Episode | T7 tephra | |||||||||||||||||||
|---|---|---|---|---|---|---|---|---|---|---|---|---|---|---|---|---|---|---|---|---|
| 1550 BCE ± 100 years - Unknown | Evidence from Isotopic: 14C (calibrated) | |||||||||||||||||||
|
List of 2 Events for Episode 1 at T7 tephra
| ||||||||||||||||||||
1900 BCE ± 300 years Confirmed Eruption
| Episode 1 | Eruption Episode | T6 tephra | ||||||||||||||||||||||||
|---|---|---|---|---|---|---|---|---|---|---|---|---|---|---|---|---|---|---|---|---|---|---|---|---|---|
| 1900 BCE ± 300 years - Unknown | Evidence from Isotopic: 14C (calibrated) | ||||||||||||||||||||||||
|
List of 3 Events for Episode 1 at T6 tephra
| |||||||||||||||||||||||||
2150 BCE ± 200 years Confirmed Eruption
| Episode 1 | Eruption Episode | T5 tephra | ||||||||||||||||||||||||
|---|---|---|---|---|---|---|---|---|---|---|---|---|---|---|---|---|---|---|---|---|---|---|---|---|---|
| 2150 BCE ± 200 years - Unknown | Evidence from Isotopic: 14C (calibrated) | ||||||||||||||||||||||||
|
List of 3 Events for Episode 1 at T5 tephra
| |||||||||||||||||||||||||
2300 BCE ± 150 years Confirmed Eruption
| Episode 1 | Eruption Episode | T4 tephra | |||||||||||||||||||
|---|---|---|---|---|---|---|---|---|---|---|---|---|---|---|---|---|---|---|---|---|
| 2300 BCE ± 150 years - Unknown | Evidence from Isotopic: 14C (calibrated) | |||||||||||||||||||
|
List of 2 Events for Episode 1 at T4 tephra
| ||||||||||||||||||||
4700 BCE ± 150 years Confirmed Eruption
| Episode 1 | Eruption Episode | T3 tephra | ||||||||||||||||||||||||
|---|---|---|---|---|---|---|---|---|---|---|---|---|---|---|---|---|---|---|---|---|---|---|---|---|---|
| 4700 BCE ± 150 years - Unknown | Evidence from Isotopic: 14C (calibrated) | ||||||||||||||||||||||||
|
List of 3 Events for Episode 1 at T3 tephra
| |||||||||||||||||||||||||
7300 BCE ± 500 years Confirmed Eruption
| Episode 1 | Eruption Episode | T2 tephra | ||||||||||||||||||||||||
|---|---|---|---|---|---|---|---|---|---|---|---|---|---|---|---|---|---|---|---|---|---|---|---|---|---|
| 7300 BCE ± 500 years - Unknown | Evidence from Isotopic: 14C (calibrated) | ||||||||||||||||||||||||
|
List of 3 Events for Episode 1 at T2 tephra
| |||||||||||||||||||||||||
There is data available for 1 deformation periods. Expand each entry for additional details.
| Start Date: 2004 | Stop Date: 2009 | Direction: Subsidence | Method: InSAR |
| Magnitude: Unknown | Spatial Extent: 6.00 km | Latitude: Unknown | Longitude: Unknown |
Remarks: Subsidence of 1993-1995 lava flows on the western flank of the volcano is due to thermoelastic contraction of the flows. | |||
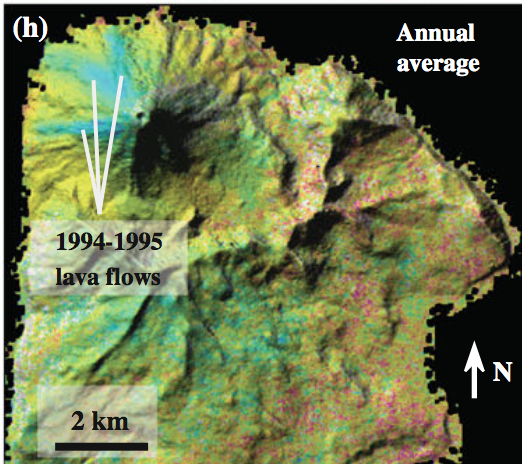 |
Average deformation image produced by stacking all available InSAR images from this track (Envisat track 101). A full cycle of colors (i.e., one interferometric fringe) represents 2.83 cm of surface displacement along the LOS From: Lu and Dzurisin 2014. |
||
Reference List: Lu and Dzurisin 2014.
Full References:
Lu Z, Dzurisin D, 2014. InSAR imaging of Aleutian volcanoes: monitoring a volcanic arc from space. Springer-Verlag Berlin Heidelberg. https://doi.org/10.1007/978-3-642-00348-6
There is no Emissions History data available for Kanaga.
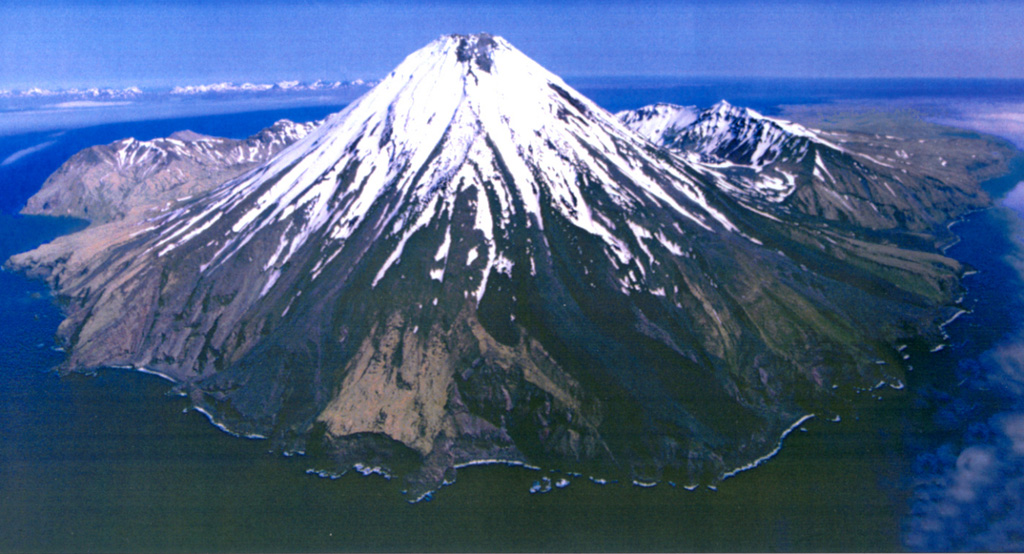
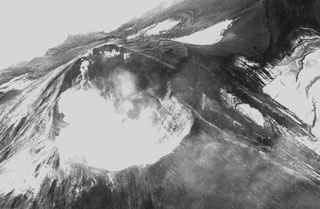 The Kanaga summit crater of is seen here in 1942. Both explosive and effusive eruptions have been recorded, and in 1906 lava flows reached the sea along the SW coast. In 1994 lava flows reached the NW coast. Kanaga is constructed within the Kanaton caldera.
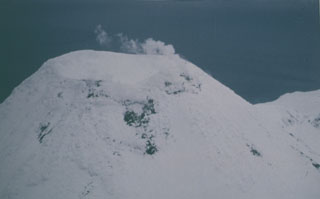 This March 1987 view from the W shows typical emission from the summit crater of Kanaga.
 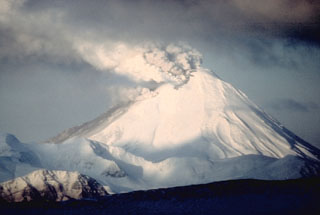 A gas-and-ash plume, seen here from the E, rises from a fissure across the summit of Kanaga on 27 January 1994. Eruptive activity began in mid-1993 and continued intermittently through most of 1995. Ash fell on the village of Adak 25 km to the E on at least one occasion. On 27-28 July incandescent lava flows were first visible on the flank and by the end of the month they reached the NW coast.
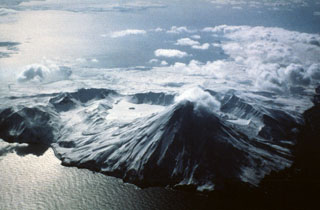 The arcuate ridge in the center of the photo is the southern rim of Kanaton caldera that contains a snow-covered lake in the SE part (center) with a small island. The post-caldera Kanaga cone is in the foreground. Recent lava flows descend the flanks, particularly on the SW, S, and E.
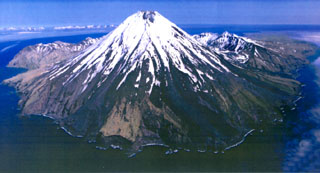 Kanaga is situated within the Kanaton caldera at the northern tip of Kanaga Island. The caldera rim forms a 760-m-high arcuate ridge, which can be seen S and E (left) of Kanaga. The two flows that reach the coast on either side of the sea cliffs in the lower center were produced during an eruptive period from mid-1993 through 1995.
The maps shown below have been scanned from the GVP map archives and include the volcano on this page. Clicking on the small images will load the full 300 dpi map. Very small-scale maps (such as world maps) are not included. The maps database originated over 30 years ago, but was only recently updated and connected to our main database. We welcome users to tell us if they see incorrect information or other problems with the maps; please use the Contact GVP link at the bottom of the page to send us email.
The following 51 samples associated with this volcano can be found in the Smithsonian's NMNH Department of Mineral Sciences collections, and may be availble for research (contact the Rock and Ore Collections Manager). Catalog number links will open a window with more information.
| Catalog Number | Sample Description | Lava Source | Collection Date |
|---|---|---|---|
| NMNH 118212-1 | Scoriaceous tephra | -- | 20 Sep 2015 |
| NMNH 118212-10 | Volcanic Ash | -- | 20 Sep 2015 |
| NMNH 118212-11 | Fine ash | -- | 20 Sep 2015 |
| NMNH 118212-12 | Tephra | -- | 20 Sep 2015 |
| NMNH 118212-13 | Lapilli tephra | -- | 20 Sep 2015 |
| NMNH 118212-14 | Basalt | -- | 21 Sep 2015 |
| NMNH 118212-15 | Andesite | -- | 21 Sep 2015 |
| NMNH 118212-16 | Inclusion | -- | 21 Sep 2015 |
| NMNH 118212-17 | Inclusion | -- | 21 Sep 2015 |
| NMNH 118212-18 | Inclusion | -- | 22 Sep 2015 |
| NMNH 118212-19 | Inclusion | -- | 21 Sep 2015 |
| NMNH 118212-2 | Pumiceous tephra | -- | 20 Sep 2015 |
| NMNH 118212-20 | Inclusion | -- | 22 Sep 2015 |
| NMNH 118212-21 | Inclusion | -- | 22 Sep 2015 |
| NMNH 118212-22 | Basalt | -- | -- |
| NMNH 118212-23 | Andesite | -- | 22 Sep 2015 |
| NMNH 118212-24 | Inclusion | -- | 22 Sep 2015 |
| NMNH 118212-25 | Inclusion | -- | 22 Sep 2015 |
| NMNH 118212-26 | Inclusion | -- | 22 Sep 2015 |
| NMNH 118212-27 | Inclusion | -- | 22 Sep 2015 |
| NMNH 118212-28 | Basalt | -- | -- |
| NMNH 118212-29 | Lapilli tephra | -- | 20 Sep 2015 |
| NMNH 118212-3 | Inclusion | -- | 21 Sep 2015 |
| NMNH 118212-30 | Lapilli tephra | -- | 20 Sep 2015 |
| NMNH 118212-31 | Basalt | -- | -- |
| NMNH 118212-32 | Pumiceous tephra | -- | 20 Sep 2015 |
| NMNH 118212-33 | Pumiceous tephra | -- | 20 Sep 2015 |
| NMNH 118212-34 | Pumiceous tephra | -- | 20 Sep 2015 |
| NMNH 118212-35 | Pumice | -- | 20 Sep 2015 |
| NMNH 118212-36 | Basaltic Andesite | -- | 20 Sep 2015 |
| NMNH 118212-37 | Andesite | -- | 21 Sep 2015 |
| NMNH 118212-38 | Inclusion | -- | 21 Sep 2015 |
| NMNH 118212-39 | Andesite | -- | 21 Sep 2015 |
| NMNH 118212-4 | Inclusion | -- | 21 Sep 2015 |
| NMNH 118212-40 | Inclusion | -- | 21 Sep 2015 |
| NMNH 118212-41 | Andesite | -- | 21 Sep 2015 |
| NMNH 118212-42 | Inclusion | -- | 21 Sep 2015 |
| NMNH 118212-43 | Andesite | -- | 22 Sep 2015 |
| NMNH 118212-44 | Basaltic Andesite | -- | 21 Sep 2015 |
| NMNH 118212-45 | Volcanic Breccia | -- | 21 Sep 2015 |
| NMNH 118212-46 | Block | -- | 21 Sep 2015 |
| NMNH 118212-47 | Block | -- | 21 Sep 2015 |
| NMNH 118212-48 | Block | -- | 21 Sep 2015 |
| NMNH 118212-49 | Block | -- | 22 Sep 2015 |
| NMNH 118212-5 | Inclusion | -- | 22 Sep 2015 |
| NMNH 118212-50 | Block | -- | 22 Sep 2015 |
| NMNH 118212-51 | Inclusion | -- | 21 Sep 2015 |
| NMNH 118212-6 | Coarse ash | -- | 20 Sep 2015 |
| NMNH 118212-7 | Lapilli tephra | -- | 20 Sep 2015 |
| NMNH 118212-8 | Volcanic Ash | -- | 20 Sep 2015 |
| NMNH 118212-9 | Tephra | -- | 20 Sep 2015 |
| Alaska Volcano Observatory (Link to Kanaga) | The Alaska Volcano Observatory (AVO) is a joint program of the U.S. Geological Survey (USGS), the Geophysical Institute of the University of Alaska Fairbanks (UAFGI), and the State of Alaska Division of Geological and Geophysical Surveys (ADGGS). AVO was formed in 1988, and uses federal, state, and university resources to monitor and study Alaska's hazardous volcanoes, to predict and record eruptive activity, and to mitigate volcanic hazards to life and property. |
| Copernicus Browser | The Copernicus Browser replaced the Sentinel Hub Playground browser in 2023, to provide access to Earth observation archives from the Copernicus Data Space Ecosystem, the main distribution platform for data from the EU Copernicus missions. |
| MIROVA | Middle InfraRed Observation of Volcanic Activity (MIROVA) is a near real time volcanic hot-spot detection system based on the analysis of MODIS (Moderate Resolution Imaging Spectroradiometer) data. In particular, MIROVA uses the Middle InfraRed Radiation (MIR), measured over target volcanoes, in order to detect, locate and measure the heat radiation sourced from volcanic activity. |
| MODVOLC Thermal Alerts | Using infrared satellite Moderate Resolution Imaging Spectroradiometer (MODIS) data, scientists at the Hawai'i Institute of Geophysics and Planetology, University of Hawai'i, developed an automated system called MODVOLC to map thermal hot-spots in near real time. For each MODIS image, the algorithm automatically scans each 1 km pixel within it to check for high-temperature hot-spots. When one is found the date, time, location, and intensity are recorded. MODIS looks at every square km of the Earth every 48 hours, once during the day and once during the night, and the presence of two MODIS sensors in space allows at least four hot-spot observations every two days. Each day updated global maps are compiled to display the locations of all hot spots detected in the previous 24 hours. There is a drop-down list with volcano names which allow users to 'zoom-in' and examine the distribution of hot-spots at a variety of spatial scales. |
|
WOVOdat
Single Volcano View Temporal Evolution of Unrest Side by Side Volcanoes |
WOVOdat is a database of volcanic unrest; instrumentally and visually recorded changes in seismicity, ground deformation, gas emission, and other parameters from their normal baselines. It is sponsored by the World Organization of Volcano Observatories (WOVO) and presently hosted at the Earth Observatory of Singapore.
GVMID Data on Volcano Monitoring Infrastructure The Global Volcano Monitoring Infrastructure Database GVMID, is aimed at documenting and improving capabilities of volcano monitoring from the ground and space. GVMID should provide a snapshot and baseline view of the techniques and instrumentation that are in place at various volcanoes, which can be use by volcano observatories as reference to setup new monitoring system or improving networks at a specific volcano. These data will allow identification of what monitoring gaps exist, which can be then targeted by remote sensing infrastructure and future instrument deployments. |
| Volcanic Hazard Maps | The IAVCEI Commission on Volcanic Hazards and Risk has a Volcanic Hazard Maps database designed to serve as a resource for hazard mappers (or other interested parties) to explore how common issues in hazard map development have been addressed at different volcanoes, in different countries, for different hazards, and for different intended audiences. In addition to the comprehensive, searchable Volcanic Hazard Maps Database, this website contains information about diversity of volcanic hazard maps, illustrated using examples from the database. This site is for educational purposes related to volcanic hazard maps. Hazard maps found on this website should not be used for emergency purposes. For the most recent, official hazard map for a particular volcano, please seek out the proper institutional authorities on the matter. |
| IRIS seismic stations/networks | Incorporated Research Institutions for Seismology (IRIS) Data Services map showing the location of seismic stations from all available networks (permanent or temporary) within a radius of 0.18° (about 20 km at mid-latitudes) from the given location of Kanaga. Users can customize a variety of filters and options in the left panel. Note that if there are no stations are known the map will default to show the entire world with a "No data matched request" error notice. |
| UNAVCO GPS/GNSS stations | Geodetic Data Services map from UNAVCO showing the location of GPS/GNSS stations from all available networks (permanent or temporary) within a radius of 20 km from the given location of Kanaga. Users can customize the data search based on station or network names, location, and time window. Requires Adobe Flash Player. |
| DECADE Data | The DECADE portal, still in the developmental stage, serves as an example of the proposed interoperability between The Smithsonian Institution's Global Volcanism Program, the Mapping Gas Emissions (MaGa) Database, and the EarthChem Geochemical Portal. The Deep Earth Carbon Degassing (DECADE) initiative seeks to use new and established technologies to determine accurate global fluxes of volcanic CO2 to the atmosphere, but installing CO2 monitoring networks on 20 of the world's 150 most actively degassing volcanoes. The group uses related laboratory-based studies (direct gas sampling and analysis, melt inclusions) to provide new data for direct degassing of deep earth carbon to the atmosphere. |
| Large Eruptions of Kanaga | Information about large Quaternary eruptions (VEI >= 4) is cataloged in the Large Magnitude Explosive Volcanic Eruptions (LaMEVE) database of the Volcano Global Risk Identification and Analysis Project (VOGRIPA). |
| EarthChem | EarthChem develops and maintains databases, software, and services that support the preservation, discovery, access and analysis of geochemical data, and facilitate their integration with the broad array of other available earth science parameters. EarthChem is operated by a joint team of disciplinary scientists, data scientists, data managers and information technology developers who are part of the NSF-funded data facility Integrated Earth Data Applications (IEDA). IEDA is a collaborative effort of EarthChem and the Marine Geoscience Data System (MGDS). |