
IG reported that deformation data showed continued inflation after 20 March, indicating that the volume of the magma intrusion below Cerro Azul's SSE flank had increased. Seismicity decreased after 25 March possibly signifying a halt in the intrusion.
Source: Instituto Geofísico-Escuela Politécnica Nacional (IG-EPN)
Eruption (29 May-11 June 2008) of lava in caldera and from fissures on SE side
Equador's Instituto Geofísico (IG) reported that Cerro Azul began to erupt late on the night of 29 May 2008. The report was based on satellite data, network seismic data, and eye-witness reports. In repose for 10 years (BGVN 23:08), this shield volcano forms the extreme SW end of the elongate island (figure 2). Cerro Azul contains a 4 x 5 km summit crater. The eruption from the SE flank (figure 3) prevailed during 29 May to 11 June and with few exceptions emitted lava flows with `a`a textured surfaces. The flows reached 2-3 km wide and up to 10 km long. Some lava also emerged from a vent in the NE wall of the caldera. Eruptions appeared to have ceased during 2 June, breaking the time line into two eruptive phases.
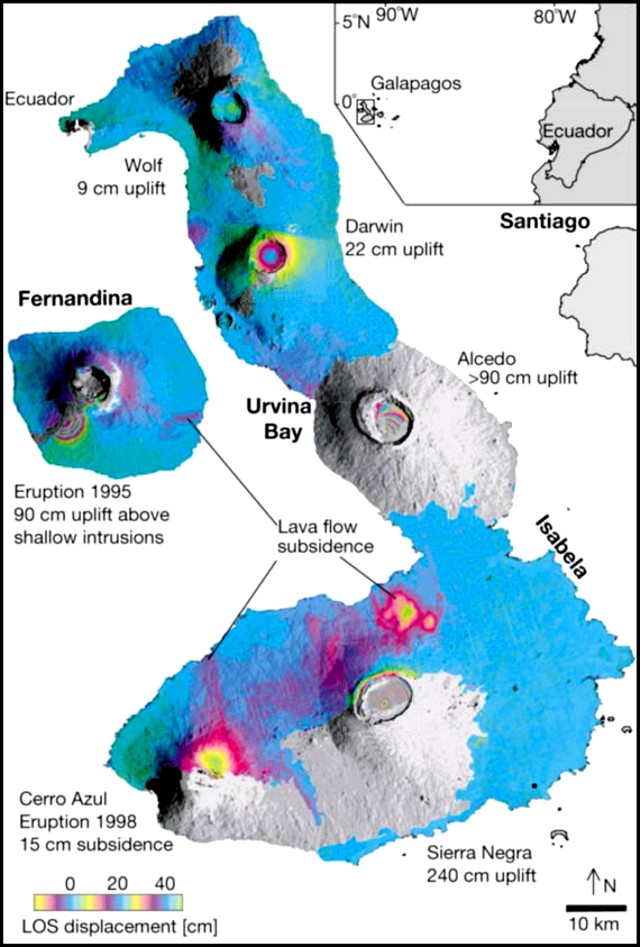 |
Figure 2. Satellite radar interferometry (InSAR) maps showing line-of-sight (LOS) ground displacements in centimeters for Fernandina and Isabela islands. For Cerro Azul (and the volcanoes Darwin, Alcedo, and Sierra Negra) the InSAR data covered 6.4 years, 1992-1998. To produce the interferograms, the phase difference between radar echoes from two satellite passes is calculated. Index map shows the Galapágos islands (~ 1,000 km W of mainland Ecuador). Maps are from Amelung and others (2000). |
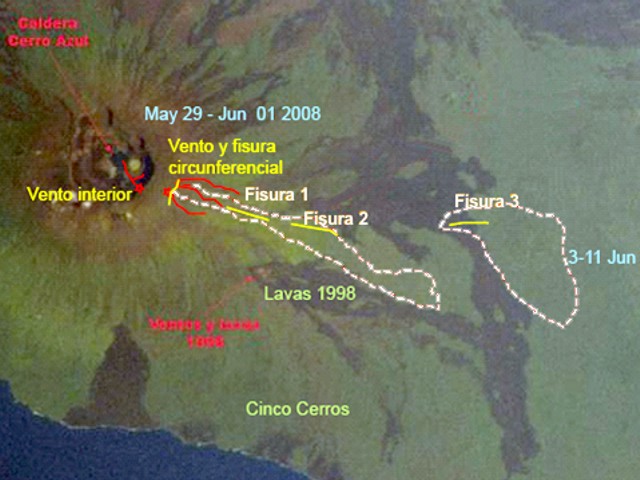 |
Figure 3. Annotated satellite image of Cerro Azul showing first-order estimates of fissure vents, the approximate margins of frequently complex flow fields, as well as eruption dates. The base image is from before the 2008 eruption. The 2008 flows generally followed similar routes as those during the SE-flank eruptions of 1978 and 1998. N is towards the top right; for scale, the distance from the crater rim to the sea directly W is ~ 8 km. Background image, Image Science and Analysis Laboratory, NASA-Johnson Space Center. Annotations and fieldwork by Andrés Gorki Ruiz, Patricio Ramón, and Nathalie Vigoroux. |
The first eruptive phase involved a rapid emission of lava during 29 May-1 June. Outside the caldera, the eruptive fissures were oriented in directions either tangential (circumferential) or radial to the volcano's symmetry. During this first phase, on 30 May, lava also extruded inside the summit caldera (figure 3).
The second eruptive phase emitted lavas over nine days (3-11 June). The lavas escaped from a separate fissure at a lower elevation than the first and oriented radially ("fissura 3" on figure 3). The flatter terrain near fissure 3 led to lavas forming an equant flow field. This contrasted with the first-phase lavas, which erupted on higher, steeper ground where they developed elongate distribution patterns.
A seismic station in the Galapagos (PAYG) suggested that activity began at 2143 hours on 29 May (local time). Signal amplitude emerged slowly at first (figure 4). Starting about an hour after that and for the next 7 hours the station registered 40 earthquakes near Cerro Azul.
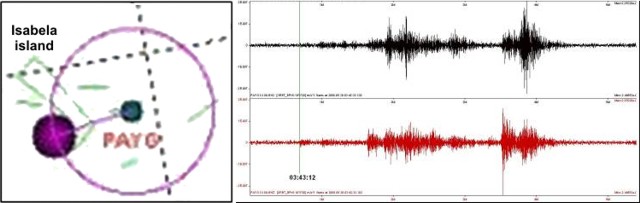 |
Figure 4. Seismic data portraying Cerro Azul's earthquakes and eruption. The left panel shows a map of the islands and station PAYG to the E, where the large dot (left) represents an epicenter near the caldera. The right panel shows the seismic traces associated with the initial signals associated with the eruption (upper is orthogonal horizontal and the lower, vertical). The vertical line at left represents 03:43:12 local time on 30 May. Courtesy of IG. |
The largest, M ~ 3.7, took place at 0051 on 30 May (local time), centered in the N caldera at shallow depth. Satellite thermal anomalies measured by MODIS/ MODVOLC showed a hot spot on the S flank at 2300 (local time). At the same time a red glow was observed in the direction of the volcano from Puerto Villamil, the capitol of Isabela Island ~ 50 km E.
According to IG, a satellite image from a Volcanic Ash Advisory Center (VAAC) showed an emission column at 0715 on 30 May 2008, probably with a low ash content, extending 140 km NW from the volcano. On the morning of 31 May, a white plume ~ 2 km high, with no visible ash, could be seen rising above the cloud cover from a point on the coast SE of the eruption site. Cloud cover then prevented further observation of the plume.
Vent areas. Aerial images taken by scientists of the Galápagos National Park on 30 May 2008 between 1400 and 1600 revealed an absence of radial fissures at that time. Lava from the higher elevation circumferential vents covered the area located at ~ 1 km elevation. Fissures 1 and 2 were therefore thought to have formed sometime between the afternoon of 30 May and morning of 1 June.
IG reports indicated that in late May into early June field visits were made by Gorki Ruiz, Oscar Carvajal, Freddy Mosquera, and Nathalie Vigouroux (and possibly others). According to Dennis Geist, they encountered sometimes foggy conditions. They inspected the area of initial eruption from Cinco Cerros, and made some key observations (figure 3) and photographs (figures 5 and 6).
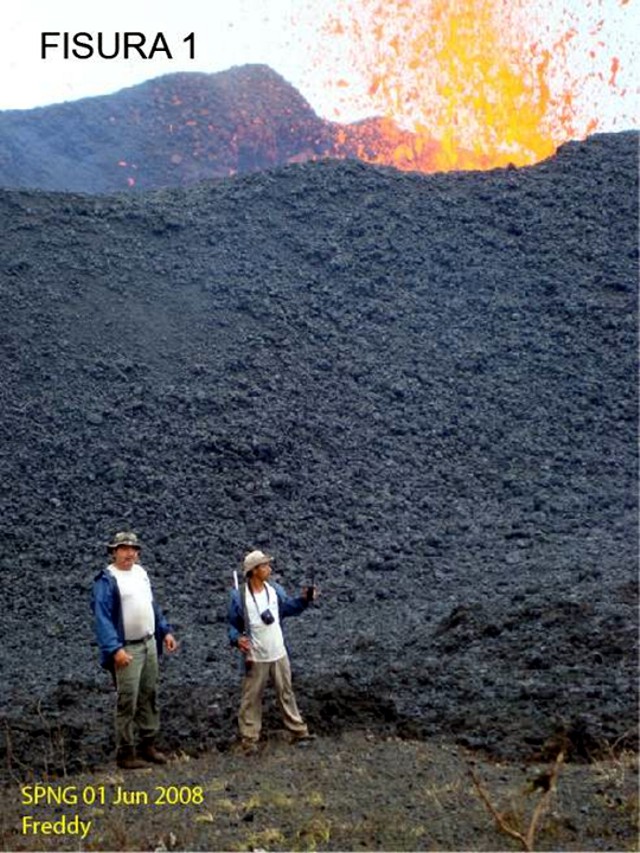 |
Figure 5. Lava spewing from part of the uppermost fissure of Cerro Azul on 1 June 2008. Photo by IG. |
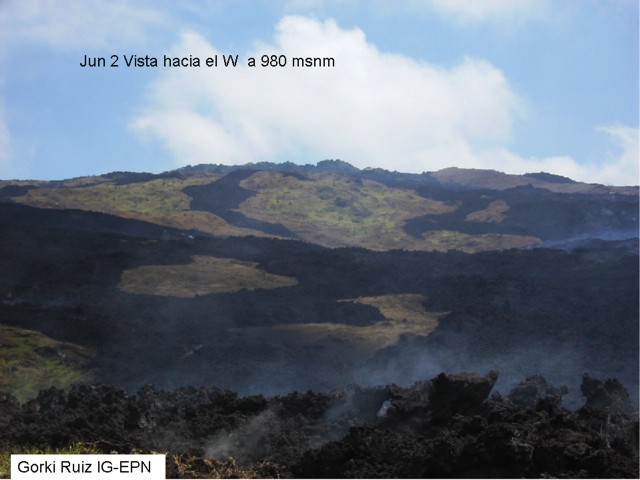 |
Figure 6. A view at Cerro Azul on 2 June 2008 looking W from 980 m elevation, showing the complexity of some of the flow fields in the vicinity. The foreground captures the rough-textured `a`a surface. Courtesy of Ruiz, IG. |
Fissure 1 emitted multiple lava flows; some of these reached 15 m thick. Fissure 2 lay farther out on the SE flank in an area of lower slope.
The circumferential fissure emitted six separate lava flows, some up to 5 m thick. These descended rapidly down the SE flank. Scientists were able to visit the new lava flows at an elevation of ~ 1,100 m on 2 June 2008. One of the lava flows was thin (under 1 m) with variable plagioclase and minor amounts of olivine (or pyroxene) crystals. At ~ 1,000-m elevation the flows from the circumferential fissure were overlain by tephra and lava from the upper radial fissure (fissure 1). At this location, the slope of the terrain lessened and the morphology changed to more blocky `a`a. There, the flows piled up behind the flow front.
The size of the cones built up by lava fountaining on the upper radial fissure decreased with distance from the summit. The lowest cone, at ~ 800 m elevation, was under 5 m high and emitted a small pahoehoe flow that extended a few ten's of meters downslope, but with little to no tephra.
The onset of the second eruptive phase was reported in various ways. MODVOLC alerts and related thermal images showed new hot spots at the SE end of the volcano on 3 June. They later increased in intensity and migrated E. On the night of 4 June, observers at Cinco Cerros saw a red glow. Observers on a 4 June flight spotted fissure 3. As shown below, on 5 June a huge increase in MODIS thermal anomalies occurred.
When seen on 4 and 5 June, fissure 3 emitted a lava curtain hundreds of meters long. Aerial observations suggested the height of lava fountaining was ~ 60 m with large blocks also thrown that high. The venting fed a SE-directed lava flow. Owing to the relatively flat terrain found in the saddle between Cerro Azul and Sierra Negra volcanoes, the lava flow appeared to be progressing very slowly. Part of the new flow spread over portions of the 1998 flow. A plume ~ 50 km long moving N was visible from the airplane, as well as in satellite images.
Sulfur-dioxide fluxes. Simon Carn provided satellite information on sulfur dioxide (SO2) burdens measured from the Ozone Monitoring Instrument (OMI) on NASA's Aura satellite (figures 7 and 8). The SO2 fluxes were measured once per day from 29 May to 8 June 2008. The map shown is for 31 May (UTC), the day with highest flux, ~ 35,000 tons/day. In general, the plumes blew SW from the source. The histogram (figure 7) indicates the daily SO2 fluxes emitted during this eruption period, with the highest flux on 31 May. Low fluxes occurred during 2-4 June, corresponding with the eruptive lull of 2 June.
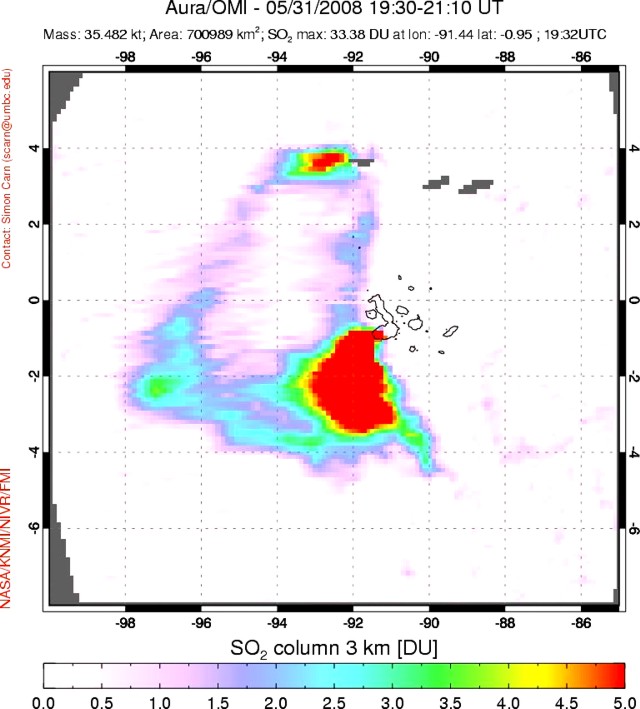 |
Figure 7. One of several available maps of sulfur dioxide (SO2) plumes measured from Aura/OMI satellite images. Data acquisition for this map occurred during 1930-2110 on 31 May UTC. Gray areas indicate regions where meteorological clouds may be obscuring the satellite view of the lower atmosphere. Courtesy of Simon Carn. |
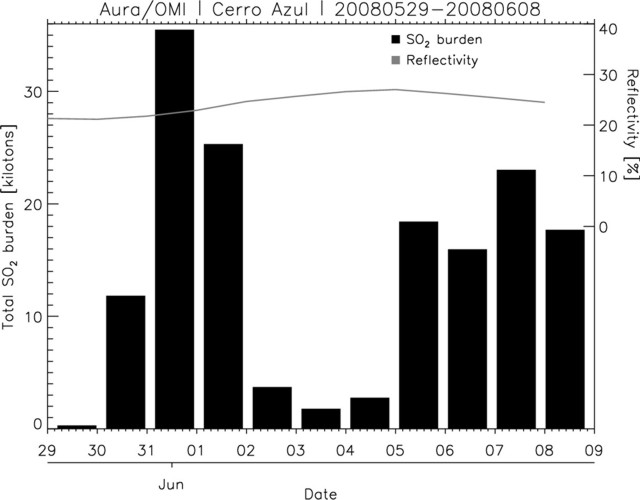 |
Figure 8. Histogram showing daily sulfur dioxide (SO2) burdens measured by the Ozone Monitoring Instrument (OMI) on NASA's Aura satellite between 29 May and 8 June 2008 UTC. These burdens were calculated based on an assumed SO2 altitude of 3 km and should be considered preliminary estimates. Courtesy of Simon Carn. |
Satellite thermal anomalies. The most recent previous eruption of the volcano took place in September 1998 (BGVN 23:08 and 23:09). In accord with the 10-year quiet period, thermal anomalies at Cerro Azul were absent at least as far back as 1 January 2000 and onward through 29 May 2008. The current eruption's anomalies appeared during 30 May-17 June 2008 (table 1) and were distributed broadly around lavas associated with fissure 3. There was a 90-pixel anomaly at 0420 on 5 June 2008; later that day there were only 5 pixels.
Table 1. MODVOLC thermal anomalies measured by MODIS instruments at Cerro Azul from 30 May through 17 June 2008. All anomalies were located E of the crater, with the farthest seen ~ 28 km due E. Courtesy of the Hawai'i Institute of Geophysics and Planetology (HIGP) Thermal Alerts System.
| Date (UTC) | Time (UTC) | Number of pixels | Satellite |
| 30 May 2008 | 0500 | 6 | Terra |
| 30 May 2008 | 0755 | 12 | Aqua |
| 31 May 2008 | 0405 | 14 | Terra |
| 31 May 2008 | 0700 | 4 | Aqua |
| 31 May 2008 | 1625 | 5 | Terra |
| 01 Jun 2008 | 0445 | 9 | Terra |
| 01 Jun 2008 | 0745 | 14 | Aqua |
| 03 Jun 2008 | 0435 | 7 | Terra |
| 04 Jun 2008 | 0815 | 25 | Aqua |
| 04 Jun 2008 | 1600 | 8 | Terra |
| 05 Jun 2008 | 0420 | 90 | Terra |
| 05 Jun 2008 | 0720 | 41 | Aqua |
| 05 Jun 2008 | 1645 | 14 | Terra |
| 05 Jun 2008 | 1940 | 5 | Aqua |
| 06 Jun 2008 | 0505 | 1 | Terra |
| 07 Jun 2008 | 0410 | 3 | Terra |
| 09 Jun 2008 | 0355 | 2 | Terra |
| 09 Jun 2008 | 1620 | 2 | Terra |
| 10 Jun 2008 | 0440 | 17 | Terra |
| 10 Jun 2008 | 0735 | 5 | Aqua |
| 10 Jun 2008 | 1700 | 2 | Terra |
| 12 Jun 2008 | 0430 | 3 | Terra |
| 12 Jun 2008 | 0725 | 4 | Aqua |
| 14 Jun 2008 | 0415 | 1 | Terra |
| 14 Jun 2008 | 1935 | 1 | Aqua |
| 16 Jun 2008 | 0405 | 1 | Terra |
| 17 Jun 2008 | 0445 | 1 | Terra |
| 17 Jun 2008 | 0745 | 5 | Aqua |
Environmental concerns and a bathymetric map. According to Galapagos National Park officials on 3 June 2008 (as reported by Agence France-Presse, AFP) the lava did not affect the islands' famed giant tortoises. Isabela, the largest island in the archipelago, is home to rare and unique flora and fauna, including the Galapagos giant tortoise, which can reach more than 230 kg in mass and live more than 100 years. The Galapagos archipelago, which consists of about 30 islands, islets, and standing rocks, is a UNESCO World Heritage Site. In 2007, UNESCO declared the archipelago's environment in danger due to the increase of tourism and the introduction of invasive species. The archipelago has a population of ~ 40,000.
William Chadwick has merged all available datasets (as of 1994) for bathymetry in the Galápagos region. Cerro Azul sits adjacent a steep drop-off to the W, with water adjacent the shore reaching ~ 3.5 km depth. In contrast, much of the island cluster is on a broad shallow platform. Chadwick offers this compiled map on his website (see Information Contacts).
Reference. Amelung, F., Jónsson1, S., Zebker, H., and Segall, P., 2007, Widespread uplift and 'trapdoor' faulting on Galápagos volcanoes observed with radar interferometry: Nature, v. 407, p. 993-996 (26 October 2000).
Information Contacts: Andres "Gorki" Ruiz, Freddy Mosquera, and Patricio Ramón, Instituto Geofísico, Escuela Politécnica Nacional(IG), AP 17-01-2759, Quito, Ecuador (URL: http://www.igepn.edu.ec/); Nathalie Vigouroux, Department of Earth Sciences, Simon Fraser University, Burnaby, Canada; Oscar Carvajal, The Galápagos National Park Service, Isla Santa Cruz, Galápagos, Ecuador; Dennis Geist and Gorki Ruiz, Geological Sciences, Box 3022, University of Idaho, Moscow ID 83844; Simon Carn, Joint Center for Earth Systems Technology, University of Maryland Baltimore Campus (UMBC), 1000 Hilltop Circle, Baltimore, MD 21250 (URL: http://so2.umbc.edu/); Hawai'i Institute of Geophysics and Planetology (HIGP) Thermal Alerts System, School of Ocean and Earth Science and Technology (SOEST), School of Ocean and Earth Science and Technology (SOEST), Univ. of Hawai'i, 2525 Correa Road, Honolulu, HI 96822, USA (URL: http://modis.higp.hawaii.edu/); William Chadwick, CIMRS, Oregon State University, NOAA/PMEL VENTS Program, Hatfield Marine Science Center, 2115 S.E. OSU Dr., Newport, OR 97365 (URL for map: https://www.pmel.noaa.gov/eoi/staff/chadwick/galapagos.html).
2017: March
| April
2008: May
| June
IG reported that deformation data showed continued inflation after 20 March, indicating that the volume of the magma intrusion below Cerro Azul's SSE flank had increased. Seismicity decreased after 25 March possibly signifying a halt in the intrusion.
Source: Instituto Geofísico-Escuela Politécnica Nacional (IG-EPN)
IG reported that increased seismicity at Cerro Azul began on 15 February and was characterized by the presence of volcano-tectonic events. A 1-hour-long swarm occurred the next day, and then afterwards only sporadic events were detected, some of which were located in the Sierra Negra volcano region. Sporadic events located at Sierra Negra continued to be detected during 8-13 March. A 30-minute-long swarm was recorded on 18 March. Earthquakes became more frequent and intense on 19 March, and another swarm occurred during 0700-1800 on 20 March; earthquake locations migrated SW, to the SE part of Cerro Azul during 19-20 March. Another swarm was detected during 1915-2200 on 21 March, with most magnitudes between 2.4 and 3, though the highest was 3.6.
Deformation during 8-20 March was detected in satellite data, characterized by 14 cm of inflation at the SE flank and 11.2 cm of deflation at the summit. Deformation and seismic data suggested the emplacement of a sill 3.5-6.3 km below the SE flank.
Source: Instituto Geofísico-Escuela Politécnica Nacional (IG-EPN)
According to news articles, a bulletin issued from Galápagos National Park indicated that eruptive activity from Cerro Azul decreased considerably during 16-17 June and on 18 June incandescent material was no longer ejected.
Source: EFE News Service
Based on field observations, the IG reported on 5 June that the initial eruption on 29 May from the SE flank of Cerro Azul issued from three fissures. Six 'a'a lava flows up to 5 m thick flowed rapidly from a fissure near the caldera; one of the flows reached the next fissure at a lower elevation. A 1-km-long fissure in the central part of the flank emitted multiple lava flows up to 15 m thick. Activity at a third fissure at the lower flank, also about 1 km in length, produced cones and several lava flows.
On 3 June, new thermal anomalies on the SE flank detected in satellite imagery increased in intensity and migrated E in later images. Incandescence in the same area was also noted by ground observers. On 4 June an overflight confirmed the presence of a new vent. A fissure about 400-500 m long emitted lava flows that traveled towards the S coast of Isabela. Blocks were ejected about 60 m above the vents. A VAAC report indicated that an eruption plume drifted 50 km N. On 5 June, thermal anomalies were present on satellite imagery.
Source: Instituto Geofísico-Escuela Politécnica Nacional (IG-EPN)
Based on information from the Galápagos National Park, observations of satellite imagery, and seismicity, the IG reported that Cerro Azul started to erupt on 29 May from several points along a radial fissure on the SE flank in the Cinco Cerros area. A thermal anomaly was present on satellite imagery at about the same time incandescence was seen through cloudiness in the direction of the volcano from ground observations. On 30 May, a plume, possibly with low ash content, was seen on satellite imagery drifting NW. An overflight and further observations revealed that lava flows traveled about 10 km down the SE flank over older flows from eruptions in 1978 and 1998. According to a news article, the lava flows were active during 29 May-1 June and burned vegetation on the flanks of the volcano.
Sources: Instituto Geofísico-Escuela Politécnica Nacional (IG-EPN); Agence France-Presse (AFP)
Reports are organized chronologically and indexed below by Month/Year (Publication Volume:Number), and include a one-line summary. Click on the index link or scroll down to read the reports.
Tremors precede reports of smoke and vapor emissions
Card 0739 (02 September 1969) Shallow earthquakes
Two shallow shocks dated 30 August 1969 are reported because of the possibility of a relation to the 1968 Fernandina caldera collapse.
First event. Time: 01 hours 26 minutes 41.5 seconds GMT. Distance: Approximately 90 km from Santa Cruz. Depth: Approximately 15 km. Magnitude: 6-7 on Richter scale. Intensity Felt: About 4 on the Modified MM scale. Direction: 5 minutes NE or NW (short periods and long periods E or W; cannot give corect direction due to galvanometer in repair); all waves are compression. Aftershock Time: 02 hours 00 minutes 37.5 seconds GMT 30 AUgust 1969.
Second event. Time: 05 hours 57 minutes 36 seconds GMT 30 AUgust 1969. Distance and depth same as for first event. Magnitude: Approximately 4-5 on the Richter scale. Intensity Felt: No reports. Aftershock Time: 06 hours 17 minutes 53.5 seconds. Distance and depth same as before.
Card 0744 (04 September 1969) Data about first 30 August earthquake
Magnitude: 5.5 Richter scale. Origin Time: 012627 Z 30 August 1969. Approximate Coordinates: 00.8°S latitude, 90.5°W longitude. Location: 70-80 km SW of Santa Cruz.
Card 0748 (12 September 1969) Intermittent emissions; recent tremors were accompanied by explosion sounds
Radio report from the Galapagos Islands on 12 September states: "Cable report from Isle Isabela 'Intermittent smoke and vapor has been seen to be rising over volcano Cerro Azul.' Report from Floreana [town] that tremors last week accompanied by explosive sounds. Epicenter agrees with distance of earthquakes recorded at Santa Cruz. The initial shock was recorded at seismological stations at Quito, Ecuador, and Lima, Perú."
Information Contacts:
Card 0739 (02 September 1969) Rolf Sievers, Santa Cruz, Galapagos Islands, Ecuador; Roger Perry, Charles Darwin Research Station, Galapagos Islands, Ecuador.
Card 0744 (04 September 1969) Carl Von Hake, Seismology Division, ESSA, U.S. Coast and Geodetic Survey.
Card 0748 (12 September 1969) Forrest Nelson, Santa Cruz, Galapagos Islands, Ecuador.
Eruption underway on E flank
At 2000 on 2 February red glow was sighted from a fishing boat E of Isla Isabela. The source has since been confirmed as two small craters on the E flank of Cerro Azul. Red glow was seen from CDRS, [110] km to the E, at 0100 on 5 February. By this date, two groups were investigating the eruption on foot and a more detailed report will be included next month.
Information Contacts: H. Hoeck, CDRS, Galápagos.
Flank fissure eruption continuing after full month
The eruption was at an elevation of approximately 300 m on the E flank of Cerro Azul, a young shield volcano. The earliest report of activity is from fishing boats that were anchored in Iguana Cove, 5 km W of the volcano's caldera, on the night of 29 January. They experienced substantial ashfall overnight, but the first reported glow seen from the village of Villamil, 23 km E of the eruption, was not until two nights later. The eruption site was seen on the morning of 2 February by Howard Snell and Hans Kruuk, who landed on the S coast that afternoon and reached a good viewing position 3-4 km from the vent on 3 February. Lava fountaining reached 300 m above the 20-50-m new crater rim, and fed a lava flow moving SE toward the sea. The main vent was 6 km E of the caldera center, near the low point between Cerro Azul and Sierra Negra volcanoes. This area was the site of recent eruptions (apparently in 1952 or the 1940's) that fed lava flows toward the sea both to the NW and SE, forming a narrow lava barrier on the otherwise vegetated low landscape between the two volcanoes. The main 1979 vent was several hundred meters into this older lava, and the new flow moved SE along the SW margin of the older flow. The flow front advanced an estimated 1-2 km during the night of 4-5 February. Another vent, roughly 400-500 m E of the main one, was recognized on February 6 or 7 and appeared to be a later development.
Cloud cover over the eruption area is normally heavy and was particularly bad during the eruption. On the first clear day (8 February), Snell described a "thunderhead" cloud to an estimated 5-7 km above the vent with substantial amounts of tephra being carried downwind. No other cloud data have been reported. Snell's last view of the eruption was 10 February, when fountaining remained vigorous and the flow had traveled an estimated 8 km toward the sea. Geologist Patricio Ramón reached the eruption site that day and reported that the eruption was from a radial fissure 600-700 m long, with lava flowing from its full length. Four principal vents were active, but the main one described by Snell was the most vigorous. Eruptive intensity declined during the next 5 days. Although quite active on 14 February, there was a strong decrease on the 15th when Ramón left to return to CDRS. During Ramón's time at the eruption, the flow advanced no closer to the sea, remaining 5-6 km from the shore, but became much broader. Snell estimated that the maximum flow width was approximately 1 km whereas it was 3-4 km wide when Ramón left nearly a week later.
There were no reports of the eruption for the following 2 weeks (the site is not directly visible from the SE side of Sierra Negra, the only inhabited part of Isla Isabela, and is distant from all normal tour routes in the archipelago), but on the night of 28 February Captain Bernardo of the San Juan observed red glow over the eruption site. On 4 March the weather was clear and an eruptive cloud was seen by Snell and H. Hoeck from the opposite side of Cerro Azul, roughly 15 km away on the NW coast.
Further Reference. De Roy Moore, T., 1980, The awakening volcano: Pacific Discovery, v. 33, no. 4, p. 25-31.
Information Contacts: H. Snell, P. Ramón, and H. Hoeck, CDRS, Galápagos.
Flank and caldera fissure eruption; helicopter tortoise-rescue
New eruptive activity at Cerro Azul on Isabela Island was first recognized on 15 September by a satellite-based monitoring system (GOES Hotspot Monitoring System) under development by the Hawaii Space Grant Consortium. The first visual observations were from the town of Villamil, 55 km E of the volcano, and were reported to the Charles Darwin Research Station (CDRS) on Santa Cruz Island around 1800 that day. The eruption was from a radial fissure on the SE slope with at least two vents in the summit caldera. The last recorded eruption of Cerro Azul, in 1979, was from a vent very close to the current radial fissure, with lesser activity in the caldera. The region is uninhabited by humans, but is close to nesting zones of endangered Galápagos tortoises. We expect to publish a more complete report in next month's Bulletin.
Fissure eruption. The eruption began just after local noon on 15 September. A thermal anomaly appeared on a satellite image at 1246 that was not on the previous image at 1215. Eight earthquakes were recorded from 1229 to 1304 by the new multi-island Galápagos network (see BGVN 22:08); these and one epicenter the next day plotted on the volcano's E flank. The hypocenters of these earthquakes occurred at depths of less than ~7 km.
During an overflight at midday on 17 September observers estimated the fissure as ~1 km long, oriented roughly E-W, and at an elevation of 620-640 m on the volcano's SE slopes. The erupting fissure discharged three constant lava fountains, along with other intermittent fountains, to heights of 200-300 m. The principal lava flow extended ~8 km E by 1230 on 17 September.
Observers on an overflight at 1146 on 18 September noted that the flow had progressed another 2.3 km. The flow consisted of cooled levees surrounding a central, fast-flowing river of lava that was orange along most of its length. No lava tunnels were seen. The flow front moved at an average rate of 168 m/hour until 17 September, but slowed to ~100 m/hour when it reached flatter terrain. The flow averaged 500 m wide, broadening slightly at the volcano's base. Lava had covered no more than 5 km2 by 1330 on 17 September. Small fires associated with the flow did not appear to be spreading. By 18 September, new lava had reached older flows that extend N-S between Cerro Azul and Sierra Negra volcano. The flow then turned S and was 7.6 km from the sea by late on 18 September.
Activity within the caldera. Caldera eruptions likely began sometime between noon on 16 September and the morning of 17 September, but this remains to be confirmed. At 1230 on 17 September two lava flows, each <2 km long, had reached the ephemeral caldera lake. The lava flows in the caldera covered an area of ~4 km2. The steam cloud generated where the lava flows entered the lake looked like a narrow thunderhead reaching 2,600 m as measured by airplane altimeter. Lava from a fissure on a bench along the S caldera wall reached the lake where a pre-existing tuff ring was visible on satellite images. The tuff ring contains another lake, but no lava reached it. Lava from a vent on the caldera floor reached the lake from the opposite direction. No glowing lava was visible in the caldera, but observers flying directly over on 17 September (at ~2,100 m altitude) noticed a strong smell of sulfur.
Threat to tortoises. Human activities have severely reduced populations of two types of Galápagos tortoises. In the past, island residents and whaling crews hunted the tortoises to near extinction. For the last 100 years these populations have been unable to recover due to introduced species (dogs, pigs, and ants) that prey upon nests and hatchlings. One of these two tortoise species has been reduced to fewer than 100 individuals.
The Galápagos National Park Service and CDRS decided to remove tortoises from the affected region, incorporating adults from the more endangered species into their captive breeding and repatriation program. An initial helicopter operation was completed on 1 October, but seven tortoises were apparently killed by lava or associated fires. The 11 tortoises removed were only about half the number needed to establish a serious restoration program. The operation lacks funding for continued access to a helicopter. As a result, another 10 tortoises must be carried out by hand over rugged terrain consisting of aa lava covered by dense thorny vegetation. Adults can weigh up to 225 kg and can travel up to 7 km from shore.
Information Contacts: Howard L. Snell, Charles Darwin Research Station, Puerto Ayora, Galápagos, Ecuador (URL: http://www.darwinfoundation.org/); The Galápagos National Park Service, Isla Santa Cruz, Galápagos, Ecuador; Peter Mouginis-Mark and Luke Flynn, GOES Hotspot Monitoring System, Hawaii Institute of Geophysics and Planetology, University of Hawaii, 2525 Correa Road, Honolulu, Hawaii 96822 (URL: http://modis.higp.hawaii.edu/); Instituto Geofísico, Escuela Politécnica Nacional, AP 17-01-2759, Quito, Ecuador.
Flank and caldera eruptions continue
This eruption began between 1229 and 1304 on 15 September (BGVN 23:08). The event was first recognized by University of Hawaii scientists monitoring thermal images from the GOES-8 geostationary satellite. A dominant plume reaching over 150 km SW developed between 1345 and 1545 on 15 September, and a minor plume trended NW carried by the prevailing surface winds. Overflights revealed two new vents in the summit caldera, and a flank fissure eruption 8 km SE of the caldera (figure 1).
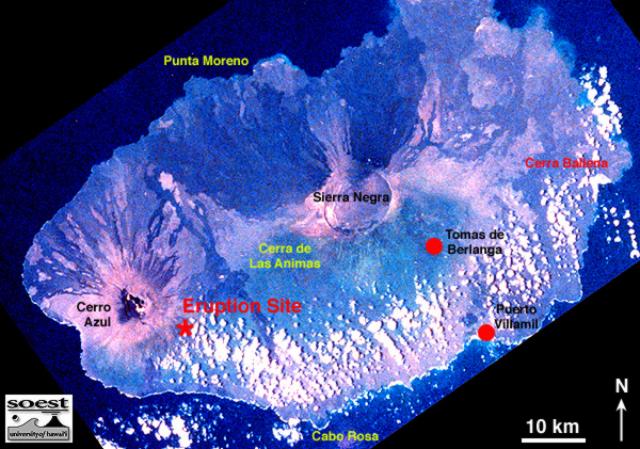 |
Figure 1. Photograph of the S part of Isabela Island, taken from the Space Shuttle in 1983, showing the site of the September 1998 flank eruption. Puerto Villamil and the scientific station at Tomas de Berlanga (or Santo Tomas) are the only inhabited locations on the island. White zones over the island are clouds. Courtesy of the GOES Hotspot Monitoring System. |
The first scientists reaching the volcano were from Ecuador's Instituto Geofísico-Escuela Politécnica Nacional (IG-EPN) and ORSTOM. They described the flank eruption site as a SE-directed radial fissure, 400-500 m long, and between 680 and 630 m elevation. Lava fountaining (to ~200 m) built an elongate cinder cone 50 m high during the team's 19-25 September observations. The main cone was breeched on the E, issuing flows that traveled over 8 km E before turning S toward the sea. During the night of 24-25 September a break in the main cone fed a new flow to the SE. All were 3-5-m-thick aa flows, and the longest ended 2 km from the coast.
University of Idaho graduate student Rachel Ellisor arrived on the night of 22 September, and described additional details of the flank eruption, including a smaller cone (NW of the main cone) with low fountains feeding a flow moving more directly S toward the sea. This flow was sampled daily; its velocity ranged from 0.001 to 10-20 km/hour and its thickness was described as 2-3 m at the front but 10-12 m in the interior. Gas clouds billowed from the fissure's SE end, and fountains issued from the main vent.
Ellisor took a 1 October overflight and described the intracaldera flows. One issued from a small vent (20-30 m high) on the S bench and flowed NW onto the caldera floor, while a larger cone (~60 m high) on the W caldera floor fed flows eastward into the shallow lake. Intracaldera activity had ended by 1 October.
Returning to the flank eruption, Ellisor reported that three large cones (60-80 m high) had been built in a N-S orientation. The mid-September flows (to the E, then S) had stagnated on the coastal flats, and their thickness was estimated at 5-15 m (interior) to 1-3 m (fronts). Increased activity on 6 October fed new flows building a channel system directly S of the main fissure. Ellisor's most recent report was dated 13 October, but GOES-8 images showed a thermal anomaly continuing through 4 November, the eruption's 51st day.
During 19-25 September, scientists from IG-EPN and ORSTOM installed three digital and one analog seismic station between the coast and the active vent. The distance between end stations was 8.5 km. Seismic signals registered during the study were composed of permanent tremor with an amplitude of 20 µm/s (2.4 km from the vent) and with a dominant frequency of 1.6 Hz. No rock-fall or long-period events were registered. One station 4 km from the vent continued working after the group returned to Quito.
Information Contacts: P. Samaniego, F. Desmulier, J.P. Metaxian, M. Ruiz, and M. Vaca, Instituto Geofísico, Escuela Politécnica Nacional, AP 17-01-2759, Quito, Ecuador; ORSTOM (L'Institut Français de Recherche Scientifique pour le Développement en Coopération), AP 17-11-6596, Quito, Ecuador (URL: http://www.ird.fr/); Rachel Ellisor and Dennis Geist, Dept. of Geology and Geological Engineering, University of Idaho, Moscow, ID 83843 USA (URL: https://www.uidaho.edu/sci/geology/); Peter Mouginis-Mark and Luke Flynn, GOES Hotspot Monitoring System, Hawaii Institute of Geophysics and Planetology, University of Hawaii, 2525 Correa Road, Honolulu, Hawaii 96822 USA (URL: http://modis.higp.hawaii.edu/).
Eruption (29 May-11 June 2008) of lava in caldera and from fissures on SE side
Equador's Instituto Geofísico (IG) reported that Cerro Azul began to erupt late on the night of 29 May 2008. The report was based on satellite data, network seismic data, and eye-witness reports. In repose for 10 years (BGVN 23:08), this shield volcano forms the extreme SW end of the elongate island (figure 2). Cerro Azul contains a 4 x 5 km summit crater. The eruption from the SE flank (figure 3) prevailed during 29 May to 11 June and with few exceptions emitted lava flows with `a`a textured surfaces. The flows reached 2-3 km wide and up to 10 km long. Some lava also emerged from a vent in the NE wall of the caldera. Eruptions appeared to have ceased during 2 June, breaking the time line into two eruptive phases.
|
Figure 2. Satellite radar interferometry (InSAR) maps showing line-of-sight (LOS) ground displacements in centimeters for Fernandina and Isabela islands. For Cerro Azul (and the volcanoes Darwin, Alcedo, and Sierra Negra) the InSAR data covered 6.4 years, 1992-1998. To produce the interferograms, the phase difference between radar echoes from two satellite passes is calculated. Index map shows the Galapágos islands (~ 1,000 km W of mainland Ecuador). Maps are from Amelung and others (2000). |
|
Figure 3. Annotated satellite image of Cerro Azul showing first-order estimates of fissure vents, the approximate margins of frequently complex flow fields, as well as eruption dates. The base image is from before the 2008 eruption. The 2008 flows generally followed similar routes as those during the SE-flank eruptions of 1978 and 1998. N is towards the top right; for scale, the distance from the crater rim to the sea directly W is ~ 8 km. Background image, Image Science and Analysis Laboratory, NASA-Johnson Space Center. Annotations and fieldwork by Andrés Gorki Ruiz, Patricio Ramón, and Nathalie Vigoroux. |
The first eruptive phase involved a rapid emission of lava during 29 May-1 June. Outside the caldera, the eruptive fissures were oriented in directions either tangential (circumferential) or radial to the volcano's symmetry. During this first phase, on 30 May, lava also extruded inside the summit caldera (figure 3).
The second eruptive phase emitted lavas over nine days (3-11 June). The lavas escaped from a separate fissure at a lower elevation than the first and oriented radially ("fissura 3" on figure 3). The flatter terrain near fissure 3 led to lavas forming an equant flow field. This contrasted with the first-phase lavas, which erupted on higher, steeper ground where they developed elongate distribution patterns.
A seismic station in the Galapagos (PAYG) suggested that activity began at 2143 hours on 29 May (local time). Signal amplitude emerged slowly at first (figure 4). Starting about an hour after that and for the next 7 hours the station registered 40 earthquakes near Cerro Azul.
|
Figure 4. Seismic data portraying Cerro Azul's earthquakes and eruption. The left panel shows a map of the islands and station PAYG to the E, where the large dot (left) represents an epicenter near the caldera. The right panel shows the seismic traces associated with the initial signals associated with the eruption (upper is orthogonal horizontal and the lower, vertical). The vertical line at left represents 03:43:12 local time on 30 May. Courtesy of IG. |
The largest, M ~ 3.7, took place at 0051 on 30 May (local time), centered in the N caldera at shallow depth. Satellite thermal anomalies measured by MODIS/ MODVOLC showed a hot spot on the S flank at 2300 (local time). At the same time a red glow was observed in the direction of the volcano from Puerto Villamil, the capitol of Isabela Island ~ 50 km E.
According to IG, a satellite image from a Volcanic Ash Advisory Center (VAAC) showed an emission column at 0715 on 30 May 2008, probably with a low ash content, extending 140 km NW from the volcano. On the morning of 31 May, a white plume ~ 2 km high, with no visible ash, could be seen rising above the cloud cover from a point on the coast SE of the eruption site. Cloud cover then prevented further observation of the plume.
Vent areas. Aerial images taken by scientists of the Galápagos National Park on 30 May 2008 between 1400 and 1600 revealed an absence of radial fissures at that time. Lava from the higher elevation circumferential vents covered the area located at ~ 1 km elevation. Fissures 1 and 2 were therefore thought to have formed sometime between the afternoon of 30 May and morning of 1 June.
IG reports indicated that in late May into early June field visits were made by Gorki Ruiz, Oscar Carvajal, Freddy Mosquera, and Nathalie Vigouroux (and possibly others). According to Dennis Geist, they encountered sometimes foggy conditions. They inspected the area of initial eruption from Cinco Cerros, and made some key observations (figure 3) and photographs (figures 5 and 6).
|
Figure 5. Lava spewing from part of the uppermost fissure of Cerro Azul on 1 June 2008. Photo by IG. |
|
Figure 6. A view at Cerro Azul on 2 June 2008 looking W from 980 m elevation, showing the complexity of some of the flow fields in the vicinity. The foreground captures the rough-textured `a`a surface. Courtesy of Ruiz, IG. |
Fissure 1 emitted multiple lava flows; some of these reached 15 m thick. Fissure 2 lay farther out on the SE flank in an area of lower slope.
The circumferential fissure emitted six separate lava flows, some up to 5 m thick. These descended rapidly down the SE flank. Scientists were able to visit the new lava flows at an elevation of ~ 1,100 m on 2 June 2008. One of the lava flows was thin (under 1 m) with variable plagioclase and minor amounts of olivine (or pyroxene) crystals. At ~ 1,000-m elevation the flows from the circumferential fissure were overlain by tephra and lava from the upper radial fissure (fissure 1). At this location, the slope of the terrain lessened and the morphology changed to more blocky `a`a. There, the flows piled up behind the flow front.
The size of the cones built up by lava fountaining on the upper radial fissure decreased with distance from the summit. The lowest cone, at ~ 800 m elevation, was under 5 m high and emitted a small pahoehoe flow that extended a few ten's of meters downslope, but with little to no tephra.
The onset of the second eruptive phase was reported in various ways. MODVOLC alerts and related thermal images showed new hot spots at the SE end of the volcano on 3 June. They later increased in intensity and migrated E. On the night of 4 June, observers at Cinco Cerros saw a red glow. Observers on a 4 June flight spotted fissure 3. As shown below, on 5 June a huge increase in MODIS thermal anomalies occurred.
When seen on 4 and 5 June, fissure 3 emitted a lava curtain hundreds of meters long. Aerial observations suggested the height of lava fountaining was ~ 60 m with large blocks also thrown that high. The venting fed a SE-directed lava flow. Owing to the relatively flat terrain found in the saddle between Cerro Azul and Sierra Negra volcanoes, the lava flow appeared to be progressing very slowly. Part of the new flow spread over portions of the 1998 flow. A plume ~ 50 km long moving N was visible from the airplane, as well as in satellite images.
Sulfur-dioxide fluxes. Simon Carn provided satellite information on sulfur dioxide (SO2) burdens measured from the Ozone Monitoring Instrument (OMI) on NASA's Aura satellite (figures 7 and 8). The SO2 fluxes were measured once per day from 29 May to 8 June 2008. The map shown is for 31 May (UTC), the day with highest flux, ~ 35,000 tons/day. In general, the plumes blew SW from the source. The histogram (figure 7) indicates the daily SO2 fluxes emitted during this eruption period, with the highest flux on 31 May. Low fluxes occurred during 2-4 June, corresponding with the eruptive lull of 2 June.
|
Figure 7. One of several available maps of sulfur dioxide (SO2) plumes measured from Aura/OMI satellite images. Data acquisition for this map occurred during 1930-2110 on 31 May UTC. Gray areas indicate regions where meteorological clouds may be obscuring the satellite view of the lower atmosphere. Courtesy of Simon Carn. |
|
Figure 8. Histogram showing daily sulfur dioxide (SO2) burdens measured by the Ozone Monitoring Instrument (OMI) on NASA's Aura satellite between 29 May and 8 June 2008 UTC. These burdens were calculated based on an assumed SO2 altitude of 3 km and should be considered preliminary estimates. Courtesy of Simon Carn. |
Satellite thermal anomalies. The most recent previous eruption of the volcano took place in September 1998 (BGVN 23:08 and 23:09). In accord with the 10-year quiet period, thermal anomalies at Cerro Azul were absent at least as far back as 1 January 2000 and onward through 29 May 2008. The current eruption's anomalies appeared during 30 May-17 June 2008 (table 1) and were distributed broadly around lavas associated with fissure 3. There was a 90-pixel anomaly at 0420 on 5 June 2008; later that day there were only 5 pixels.
Table 1. MODVOLC thermal anomalies measured by MODIS instruments at Cerro Azul from 30 May through 17 June 2008. All anomalies were located E of the crater, with the farthest seen ~ 28 km due E. Courtesy of the Hawai'i Institute of Geophysics and Planetology (HIGP) Thermal Alerts System.
| Date (UTC) | Time (UTC) | Number of pixels | Satellite |
| 30 May 2008 | 0500 | 6 | Terra |
| 30 May 2008 | 0755 | 12 | Aqua |
| 31 May 2008 | 0405 | 14 | Terra |
| 31 May 2008 | 0700 | 4 | Aqua |
| 31 May 2008 | 1625 | 5 | Terra |
| 01 Jun 2008 | 0445 | 9 | Terra |
| 01 Jun 2008 | 0745 | 14 | Aqua |
| 03 Jun 2008 | 0435 | 7 | Terra |
| 04 Jun 2008 | 0815 | 25 | Aqua |
| 04 Jun 2008 | 1600 | 8 | Terra |
| 05 Jun 2008 | 0420 | 90 | Terra |
| 05 Jun 2008 | 0720 | 41 | Aqua |
| 05 Jun 2008 | 1645 | 14 | Terra |
| 05 Jun 2008 | 1940 | 5 | Aqua |
| 06 Jun 2008 | 0505 | 1 | Terra |
| 07 Jun 2008 | 0410 | 3 | Terra |
| 09 Jun 2008 | 0355 | 2 | Terra |
| 09 Jun 2008 | 1620 | 2 | Terra |
| 10 Jun 2008 | 0440 | 17 | Terra |
| 10 Jun 2008 | 0735 | 5 | Aqua |
| 10 Jun 2008 | 1700 | 2 | Terra |
| 12 Jun 2008 | 0430 | 3 | Terra |
| 12 Jun 2008 | 0725 | 4 | Aqua |
| 14 Jun 2008 | 0415 | 1 | Terra |
| 14 Jun 2008 | 1935 | 1 | Aqua |
| 16 Jun 2008 | 0405 | 1 | Terra |
| 17 Jun 2008 | 0445 | 1 | Terra |
| 17 Jun 2008 | 0745 | 5 | Aqua |
Environmental concerns and a bathymetric map. According to Galapagos National Park officials on 3 June 2008 (as reported by Agence France-Presse, AFP) the lava did not affect the islands' famed giant tortoises. Isabela, the largest island in the archipelago, is home to rare and unique flora and fauna, including the Galapagos giant tortoise, which can reach more than 230 kg in mass and live more than 100 years. The Galapagos archipelago, which consists of about 30 islands, islets, and standing rocks, is a UNESCO World Heritage Site. In 2007, UNESCO declared the archipelago's environment in danger due to the increase of tourism and the introduction of invasive species. The archipelago has a population of ~ 40,000.
William Chadwick has merged all available datasets (as of 1994) for bathymetry in the Galápagos region. Cerro Azul sits adjacent a steep drop-off to the W, with water adjacent the shore reaching ~ 3.5 km depth. In contrast, much of the island cluster is on a broad shallow platform. Chadwick offers this compiled map on his website (see Information Contacts).
Reference. Amelung, F., Jónsson1, S., Zebker, H., and Segall, P., 2007, Widespread uplift and 'trapdoor' faulting on Galápagos volcanoes observed with radar interferometry: Nature, v. 407, p. 993-996 (26 October 2000).
Information Contacts: Andres "Gorki" Ruiz, Freddy Mosquera, and Patricio Ramón, Instituto Geofísico, Escuela Politécnica Nacional(IG), AP 17-01-2759, Quito, Ecuador (URL: http://www.igepn.edu.ec/); Nathalie Vigouroux, Department of Earth Sciences, Simon Fraser University, Burnaby, Canada; Oscar Carvajal, The Galápagos National Park Service, Isla Santa Cruz, Galápagos, Ecuador; Dennis Geist and Gorki Ruiz, Geological Sciences, Box 3022, University of Idaho, Moscow ID 83844; Simon Carn, Joint Center for Earth Systems Technology, University of Maryland Baltimore Campus (UMBC), 1000 Hilltop Circle, Baltimore, MD 21250 (URL: http://so2.umbc.edu/); Hawai'i Institute of Geophysics and Planetology (HIGP) Thermal Alerts System, School of Ocean and Earth Science and Technology (SOEST), School of Ocean and Earth Science and Technology (SOEST), Univ. of Hawai'i, 2525 Correa Road, Honolulu, HI 96822, USA (URL: http://modis.higp.hawaii.edu/); William Chadwick, CIMRS, Oregon State University, NOAA/PMEL VENTS Program, Hatfield Marine Science Center, 2115 S.E. OSU Dr., Newport, OR 97365 (URL for map: https://www.pmel.noaa.gov/eoi/staff/chadwick/galapagos.html).
This compilation of synonyms and subsidiary features may not be comprehensive. Features are organized into four major categories: Cones, Craters, Domes, and Thermal Features. Synonyms of features appear indented below the primary name. In some cases additional feature type, elevation, or location details are provided.
Cones |
||||
| Feature Name | Feature Type | Elevation | Latitude | Longitude |
| Animas, Cerro de las | Cone | |||
|
|
||||||||||||||||||||||||
There is data available for 14 confirmed Holocene eruptive periods.
2008 May 29 - 2008 Jun 17 Confirmed Eruption Max VEI: 1 (?)
| Episode 1 | Eruption Episode | Summit and SE flank | ||||||||||||||||||||||||||||||||||
|---|---|---|---|---|---|---|---|---|---|---|---|---|---|---|---|---|---|---|---|---|---|---|---|---|---|---|---|---|---|---|---|---|---|---|---|
| 2008 May 29 - 2008 Jun 17 | Evidence from Observations: Reported | ||||||||||||||||||||||||||||||||||
|
List of 5 Events for Episode 1 at Summit and SE flank
| |||||||||||||||||||||||||||||||||||
1998 Sep 15 - 1998 Oct 21 Confirmed Eruption Max VEI: 1
| Episode 1 | Eruption Episode | N & W caldera floor, SE flank (630-680 m) | |||||||||||||||||||||||||||||||||||||||
|---|---|---|---|---|---|---|---|---|---|---|---|---|---|---|---|---|---|---|---|---|---|---|---|---|---|---|---|---|---|---|---|---|---|---|---|---|---|---|---|---|
| 1998 Sep 15 - 1998 Oct 21 | Evidence from Observations: Reported | |||||||||||||||||||||||||||||||||||||||
|
List of 6 Events for Episode 1 at N & W caldera floor, SE flank (630-680 m)
| ||||||||||||||||||||||||||||||||||||||||
1979 Jan 29 - 1979 Mar 4 (in or after) Confirmed Eruption Max VEI: 2 (?)
| Episode 1 | Eruption Episode | East flank (300 m) and summit | ||||||||||||||||||||||||||||||||||
|---|---|---|---|---|---|---|---|---|---|---|---|---|---|---|---|---|---|---|---|---|---|---|---|---|---|---|---|---|---|---|---|---|---|---|---|
| 1979 Jan 29 - 1979 Mar 4 (in or after) | Evidence from Observations: Reported | ||||||||||||||||||||||||||||||||||
|
List of 5 Events for Episode 1 at East flank (300 m) and summit
| |||||||||||||||||||||||||||||||||||
[ 1968 Jun 12 ] Uncertain Eruption
| Episode 1 | Eruption Episode | North flank? | |||||||||||||||||||
|---|---|---|---|---|---|---|---|---|---|---|---|---|---|---|---|---|---|---|---|---|
| 1968 Jun 12 - Unknown | Evidence from Unknown | |||||||||||||||||||
|
List of 2 Events for Episode 1 at North flank?
| ||||||||||||||||||||
1959 Jun 29 - 1959 Jul 31 (?) Confirmed Eruption Max VEI: 2 (?)
| Episode 1 | Eruption Episode | East flank | ||||||||||||||||||||||||
|---|---|---|---|---|---|---|---|---|---|---|---|---|---|---|---|---|---|---|---|---|---|---|---|---|---|
| 1959 Jun 29 - 1959 Jul 31 (?) | Evidence from Observations: Reported | ||||||||||||||||||||||||
|
List of 3 Events for Episode 1 at East flank
| |||||||||||||||||||||||||
1951 Jul 2 ± 182 days Confirmed Eruption
| Episode 1 | Eruption Episode | ||||
|---|---|---|---|---|
| 1951 Jul 2 ± 182 days - Unknown | Evidence from Observations: Reported | |||
1949 (?) Confirmed Eruption Max VEI: 0
| Episode 1 | Eruption Episode | ||||||||||||||||||||
|---|---|---|---|---|---|---|---|---|---|---|---|---|---|---|---|---|---|---|---|---|
| 1949 (?) - Unknown | Evidence from Observations: Reported | |||||||||||||||||||
|
List of 2 Events for Episode 1
| ||||||||||||||||||||
1948 Jun 30 ± 30 days Confirmed Eruption Max VEI: 0
| Episode 1 | Eruption Episode | ||||||||||||||||||||
|---|---|---|---|---|---|---|---|---|---|---|---|---|---|---|---|---|---|---|---|---|
| 1948 Jun 30 ± 30 days - Unknown | Evidence from Observations: Reported | |||||||||||||||||||
|
List of 2 Events for Episode 1
| ||||||||||||||||||||
1943 Apr 13 ± 2 days - 1943 May 11 (?) Confirmed Eruption Max VEI: 3
| Episode 1 | Eruption Episode | Caldera ring fracture | |||||||||||||||||||||||||||||
|---|---|---|---|---|---|---|---|---|---|---|---|---|---|---|---|---|---|---|---|---|---|---|---|---|---|---|---|---|---|---|
| 1943 Apr 13 ± 2 days - 1943 May 11 (?) | Evidence from Observations: Reported | |||||||||||||||||||||||||||||
|
List of 4 Events for Episode 1 at Caldera ring fracture
| ||||||||||||||||||||||||||||||
1940 Confirmed Eruption Max VEI: 0
| Episode 1 | Eruption Episode | East flank (Cerro de Las Animas) | |||||||||||||||||||
|---|---|---|---|---|---|---|---|---|---|---|---|---|---|---|---|---|---|---|---|---|
| 1940 - Unknown | Evidence from Observations: Reported | |||||||||||||||||||
|
List of 2 Events for Episode 1 at East flank (Cerro de Las Animas)
| ||||||||||||||||||||
1932 Confirmed Eruption Max VEI: 1 (?)
| Episode 1 | Eruption Episode | |||||||||||||||
|---|---|---|---|---|---|---|---|---|---|---|---|---|---|---|---|
| 1932 - Unknown | Evidence from Observations: Reported | ||||||||||||||
|
List of 1 Events for Episode 1
| |||||||||||||||
1850 (after) Confirmed Eruption Max VEI: 1
| Episode 1 | Eruption Episode | ||||||||||||||||||||
|---|---|---|---|---|---|---|---|---|---|---|---|---|---|---|---|---|---|---|---|---|
| 1850 (after) - Unknown | Evidence from Isotopic: Cosmic Ray Exposure | |||||||||||||||||||
|
List of 2 Events for Episode 1
| ||||||||||||||||||||
1250 (after) Confirmed Eruption Max VEI: 0
| Episode 1 | Eruption Episode | ||||||||||||||||||||
|---|---|---|---|---|---|---|---|---|---|---|---|---|---|---|---|---|---|---|---|---|
| 1250 (after) - Unknown | Evidence from Isotopic: Cosmic Ray Exposure | |||||||||||||||||||
|
List of 2 Events for Episode 1
| ||||||||||||||||||||
0550 BCE ± 1300 years Confirmed Eruption Max VEI: 0
| Episode 1 | Eruption Episode | ||||||||||||||||||||
|---|---|---|---|---|---|---|---|---|---|---|---|---|---|---|---|---|---|---|---|---|
| 0550 BCE ± 1300 years - Unknown | Evidence from Isotopic: Cosmic Ray Exposure | |||||||||||||||||||
|
List of 2 Events for Episode 1
| ||||||||||||||||||||
0950 BCE ± 900 years Confirmed Eruption Max VEI: 0
| Episode 1 | Eruption Episode | ||||||||||||||||||||
|---|---|---|---|---|---|---|---|---|---|---|---|---|---|---|---|---|---|---|---|---|
| 0950 BCE ± 900 years - Unknown | Evidence from Isotopic: Cosmic Ray Exposure | |||||||||||||||||||
|
List of 2 Events for Episode 1
| ||||||||||||||||||||
There is data available for 2 deformation periods. Expand each entry for additional details.
| Start Date: 1997 Oct | Stop Date: 1998 Nov | Direction: Subsidence | Method: InSAR |
| Magnitude: 26.000 cm | Spatial Extent: Unknown | Latitude: Unknown | Longitude: Unknown |
Remarks: co-eruptive | |||
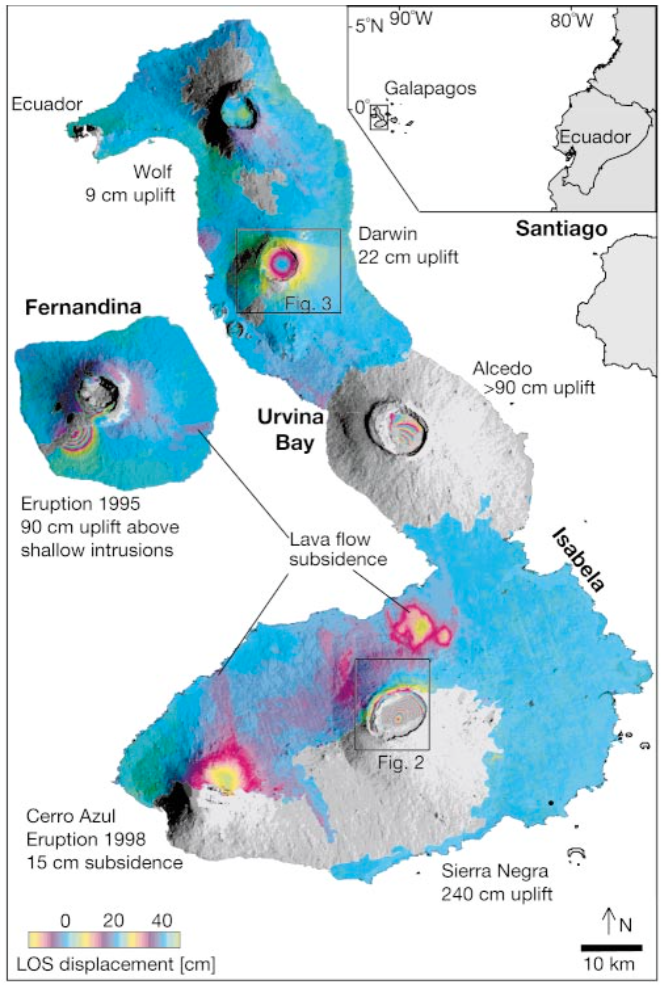 |
Observed deformation at Isabela and Fernandina (main image), the westernmost islands in the GalaA?pagos archipelago (inset). The map shows line-of sight (LOS) ground displacements towards the European radar satellites ERS-1 and ERS-2, produced from interferograms spanning 5 years from 1992 to 1997 (Ecuador, Wolf, Fernandina) and 6.4 years from 1992 to 1998 (Darwin, Alcedo, Sierra Negra and Cerro Azul; Table 1). The radar echoes are reduced to interferograms by calculating the phase difference between images from two satellite passes22?24. The topographic contribution to the observed phase was removed using a digital elevation model25. The interferometric phase, which is measured modulo 2p, is unwrapped to26 produce LOS displacement, and presented here so that each colour-cycle represents 20 cm displacement. The incidence angle of the ERS radars is 23V from vertical. Areas where the interferometric coherence is lost, presumably because of dense vegetation, are shown grey. Also shown is the maximum uplift at each volcano, assuming that displacements are vertical. All the volcanoes actively deformed during the observation period except Ecuador volcano. The 1995 Fernandina eruption occurred on the southwest ?ank. The 1998 Cerro Azul eruption occurred inside the summit caldera and on the vegetated southeast ?ank4. From: Amelung et al. 2000. |
||
Reference List: Amelung et al. 2000.
Full References:
Amelung F, Jónsson S, Zebker H, Segall P, 2000. Widespread uplift and "trap-door" faulting on Galápagos volcanoes observed with radar interferometry. Nature, 407, 993-996. https://doi.org/10.1038/35039604
| Start Date: 1992 | Stop Date: 1997 Oct | Direction: Uplift | Method: InSAR |
| Magnitude: 13.000 cm | Spatial Extent: Unknown | Latitude: Unknown | Longitude: Unknown |
Reference List: Amelung et al. 2000.
Full References:
Amelung F, Jónsson S, Zebker H, Segall P, 2000. Widespread uplift and "trap-door" faulting on Galápagos volcanoes observed with radar interferometry. Nature, 407, 993-996. https://doi.org/10.1038/35039604
There is data available for 3 emission periods. Expand each entry for additional details.
| Start Date: 2008 May 30 | Stop Date: 2008 May 30 | Method: Satellite (Aura OMI) |
| SO2 Altitude Min: 3 km | SO2 Altitude Max: 3 km | Total SO2 Mass: 157 kt |
Data Details
| Date Start | Date End | Assumed SO2 Altitude | SO2 Algorithm | SO2 Mass |
| 20080530 | 3.0 | 157.000 |
| Start Date: 1998 Sep 15 | Stop Date: 1998 Sep 15 | Method: Satellite (Earth Probe TOMS) |
| SO2 Altitude Min: 15 km | SO2 Altitude Max: 15 km | Total SO2 Mass: 714 kt |
Data Details
| Date Start | Date End | Assumed SO2 Altitude | SO2 Algorithm | SO2 Mass |
| 19980915 | 15.0 | 714.000 |
| Start Date: 1979 Feb 01 | Stop Date: 1979 Feb 01 | Method: Satellite (Nimbus-7 TOMS) |
| SO2 Altitude Min: 2 km | SO2 Altitude Max: 2 km | Total SO2 Mass: 358 kt |
Data Details
| Date Start | Date End | Assumed SO2 Altitude | SO2 Algorithm | SO2 Mass |
| 19790201 | 2.0 | 358.000 |
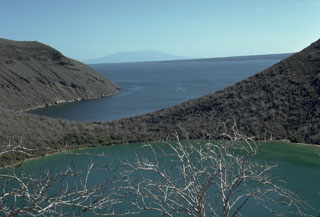 The smallest of at least four nested craters on Tagus tuff cone, located on the SW flank of Darwin volcano, is filled by a small lake. The ridge at the upper left is the SE rim of the tuff cone, which is breached by Tagus Cove, one of the most renowned anchorages in the Galápagos archipelago. Cerro Azul shield volcano rises in the distance at the southern end of Isabela Island.
 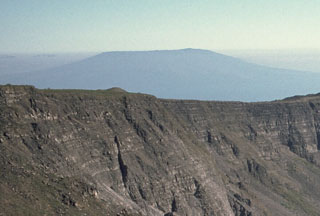 Cerro Azul volcano at the SW tip of J-shaped Isabela Island rises in the distance above the rim of Fernandina caldera. The flat-topped shield volcano is truncated by a deep, steep-walled 4 x 5 km summit caldera. A prominent cinder cone is located at the ENE side of the caldera and youthful lava flows cover its floor. Numerous spatter cones dot the western flanks. Fresh-looking lava flows, many erupted from circumferential fissures, descend the NE and NW flanks. Historical eruptions date back only to 1932.
 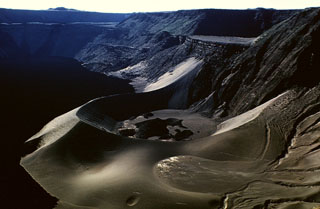 A large tuff cone occupies the ENE side of the summit caldera of Cerro Azul volcano at the SW tip of Isabela Island. A small caldera bench is seen above the cone at the upper right, and a larger bench on the northern side of the caldera is outlined by the light-colored line below the horizon at the upper left. The 4 x 5 km wide caldera is one of the smallest of the Galápagos shield volcanoes, but its 650 m depth makes it one of the deepest. Youthful dark-colored lava flows at the left cover much of the caldera floor.
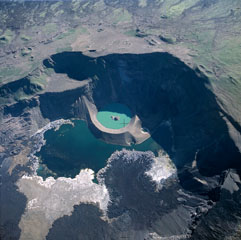 A near vertical aerial photo shows the caldera of Cerro Azul with north to the lower left. The lava flow extending into the caldera lake from the bottom of the image was erupted in September 1998. Lava flows were erupted in September and October 1998 from vents on the south caldera bench and west caldera floor. Another vent from a radial fissure at 630-680 m elevation on the SE flank produced a lava flow that reached to within about 2 km of the ocean.
 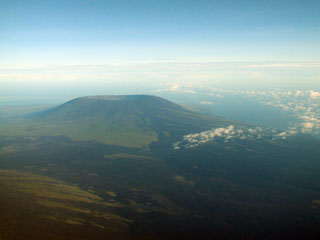 The caldera of Cerro Azul volcano is seen from the east, with the slopes of Sierra Negra volcano in the foreground. The steep-walled 4 x 5 km nested summit caldera complex is 650 m deep. Dark-colored, fresh-looking lava flows erupted from NE flank vents can be seen at the right, and a SE flank fissure erupted in 1998, producing a lava flow that reached to within 2 km of the coast.
 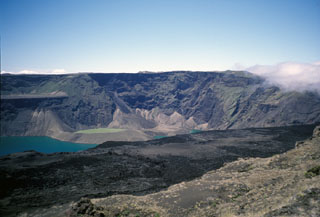 A view from the west caldera rim of Cerro Azul shows a caldera bench covered with young lava flows in the foreground and part of the blue caldera floor lake and a tuff cone filled with greenish lake water. The photo was taken in July 1998, shortly before an eruption in September 1998 from vents on the south caldera bench and the west caldera floor.
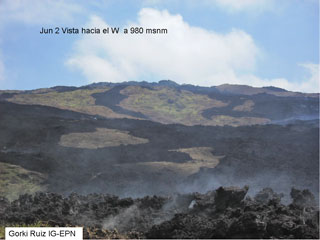 A view at Cerro Azul on June 2, 2008 looking west from 980 m elevation, shows lava flows from a May to June 2008 eruption. From May 29 to June 1, lava flows were emitted from fissures in the summit caldera and on the east flank. Beginning June 3, lava flows were erupted from fissures lower on the east flank. Eruptive activity from Cerro Azul decreased considerably during June 16-17 and on June 18 incandescent material was no longer ejected.
 The Global Volcanism Program has no maps available for Cerro Azul.
The following 17 samples associated with this volcano can be found in the Smithsonian's NMNH Department of Mineral Sciences collections, and may be availble for research (contact the Rock and Ore Collections Manager). Catalog number links will open a window with more information.
| Catalog Number | Sample Description | Lava Source | Collection Date |
|---|---|---|---|
| NMNH 118119-55 | Basalt | -- | -- |
| NMNH 118119-56 | Basalt | -- | -- |
| NMNH 118119-57 | Basalt | -- | -- |
| NMNH 118119-58 | Basalt | -- | -- |
| NMNH 118119-59 | Igneous Rock | -- | -- |
| NMNH 118119-60 | Gabbro | -- | -- |
| NMNH 118119-61 | Olivine Basalt | -- | -- |
| NMNH 118119-62 | Tephra | -- | -- |
| NMNH 118119-63 | Igneous Rock | -- | -- |
| NMNH 118119-64 | Igneous Rock | -- | -- |
| NMNH 118119-65 | Diorite | -- | -- |
| NMNH 118119-66 | Basalt | -- | -- |
| NMNH 118119-67 | Basalt | -- | -- |
| NMNH 118119-68 | Olivine Basalt | -- | -- |
| NMNH 118119-69 | Picrite | -- | -- |
| NMNH 118119-70 | Tuff | -- | -- |
| NMNH 118119-71 | Picrite | -- | -- |
| Copernicus Browser | The Copernicus Browser replaced the Sentinel Hub Playground browser in 2023, to provide access to Earth observation archives from the Copernicus Data Space Ecosystem, the main distribution platform for data from the EU Copernicus missions. |
| MIROVA | Middle InfraRed Observation of Volcanic Activity (MIROVA) is a near real time volcanic hot-spot detection system based on the analysis of MODIS (Moderate Resolution Imaging Spectroradiometer) data. In particular, MIROVA uses the Middle InfraRed Radiation (MIR), measured over target volcanoes, in order to detect, locate and measure the heat radiation sourced from volcanic activity. |
| MODVOLC Thermal Alerts | Using infrared satellite Moderate Resolution Imaging Spectroradiometer (MODIS) data, scientists at the Hawai'i Institute of Geophysics and Planetology, University of Hawai'i, developed an automated system called MODVOLC to map thermal hot-spots in near real time. For each MODIS image, the algorithm automatically scans each 1 km pixel within it to check for high-temperature hot-spots. When one is found the date, time, location, and intensity are recorded. MODIS looks at every square km of the Earth every 48 hours, once during the day and once during the night, and the presence of two MODIS sensors in space allows at least four hot-spot observations every two days. Each day updated global maps are compiled to display the locations of all hot spots detected in the previous 24 hours. There is a drop-down list with volcano names which allow users to 'zoom-in' and examine the distribution of hot-spots at a variety of spatial scales. |
|
WOVOdat
Single Volcano View Temporal Evolution of Unrest Side by Side Volcanoes |
WOVOdat is a database of volcanic unrest; instrumentally and visually recorded changes in seismicity, ground deformation, gas emission, and other parameters from their normal baselines. It is sponsored by the World Organization of Volcano Observatories (WOVO) and presently hosted at the Earth Observatory of Singapore.
GVMID Data on Volcano Monitoring Infrastructure The Global Volcano Monitoring Infrastructure Database GVMID, is aimed at documenting and improving capabilities of volcano monitoring from the ground and space. GVMID should provide a snapshot and baseline view of the techniques and instrumentation that are in place at various volcanoes, which can be use by volcano observatories as reference to setup new monitoring system or improving networks at a specific volcano. These data will allow identification of what monitoring gaps exist, which can be then targeted by remote sensing infrastructure and future instrument deployments. |
| Volcanic Hazard Maps | The IAVCEI Commission on Volcanic Hazards and Risk has a Volcanic Hazard Maps database designed to serve as a resource for hazard mappers (or other interested parties) to explore how common issues in hazard map development have been addressed at different volcanoes, in different countries, for different hazards, and for different intended audiences. In addition to the comprehensive, searchable Volcanic Hazard Maps Database, this website contains information about diversity of volcanic hazard maps, illustrated using examples from the database. This site is for educational purposes related to volcanic hazard maps. Hazard maps found on this website should not be used for emergency purposes. For the most recent, official hazard map for a particular volcano, please seek out the proper institutional authorities on the matter. |
| IRIS seismic stations/networks | Incorporated Research Institutions for Seismology (IRIS) Data Services map showing the location of seismic stations from all available networks (permanent or temporary) within a radius of 0.18° (about 20 km at mid-latitudes) from the given location of Cerro Azul. Users can customize a variety of filters and options in the left panel. Note that if there are no stations are known the map will default to show the entire world with a "No data matched request" error notice. |
| UNAVCO GPS/GNSS stations | Geodetic Data Services map from UNAVCO showing the location of GPS/GNSS stations from all available networks (permanent or temporary) within a radius of 20 km from the given location of Cerro Azul. Users can customize the data search based on station or network names, location, and time window. Requires Adobe Flash Player. |
| DECADE Data | The DECADE portal, still in the developmental stage, serves as an example of the proposed interoperability between The Smithsonian Institution's Global Volcanism Program, the Mapping Gas Emissions (MaGa) Database, and the EarthChem Geochemical Portal. The Deep Earth Carbon Degassing (DECADE) initiative seeks to use new and established technologies to determine accurate global fluxes of volcanic CO2 to the atmosphere, but installing CO2 monitoring networks on 20 of the world's 150 most actively degassing volcanoes. The group uses related laboratory-based studies (direct gas sampling and analysis, melt inclusions) to provide new data for direct degassing of deep earth carbon to the atmosphere. |
| Large Eruptions of Cerro Azul | Information about large Quaternary eruptions (VEI >= 4) is cataloged in the Large Magnitude Explosive Volcanic Eruptions (LaMEVE) database of the Volcano Global Risk Identification and Analysis Project (VOGRIPA). |
| EarthChem | EarthChem develops and maintains databases, software, and services that support the preservation, discovery, access and analysis of geochemical data, and facilitate their integration with the broad array of other available earth science parameters. EarthChem is operated by a joint team of disciplinary scientists, data scientists, data managers and information technology developers who are part of the NSF-funded data facility Integrated Earth Data Applications (IEDA). IEDA is a collaborative effort of EarthChem and the Marine Geoscience Data System (MGDS). |

