The Observatório Vulcanológico de Cabo Verde (OVCV) reported that on 8 February the eruption at Fogo had ended; sulfur dioxide emissions were almost undetectable on 8 February and continued to remain so at least through 11 February. During that period, pahoehoe flows remained stagnant and only minor fumarolic activity was present at the edge of the new crater. In addition, since 7 February, temperatures of the fumaroles and of an area at the base of the cone had decreased significantly.
Source: Universidade of Cabo Verde
November 2014-February 2015 eruption destroys two villages, lava displaces over 1000 people
The 25-km-wide island of Fogo in the Cape Verde Islands, 750 km W of Dakar, Senegal, is a single massive stratovolcano with a 9-km-wide summit caldera (Cha Caldera) that is breached to the east. A steep-sided central cone, Pico, rises more than a kilometer above the caldera floor, and is capped by a 500-m-wide, 150-m-deep summit crater; it was apparently almost continuously active from the time of Portuguese settlement in 1500 CE until around 1760. Several lava flows that erupted during the eighteenth and nineteenth centuries reached the eastern coast below the breached caldera rim (BGVN 20:03, figure 1). Lava flows in 1951 and 1995 were contained within the W half of the Cha Caldera, as were the flows from the November 2014-February 2015 eruption (figure 16) described below. Information for this report comes from the Toulouse Volcanic Ash Advisory Center (VAAC), the Observatório Vulcanológico de Cabo Verde (OVCV), and satellite and news data from several sources.
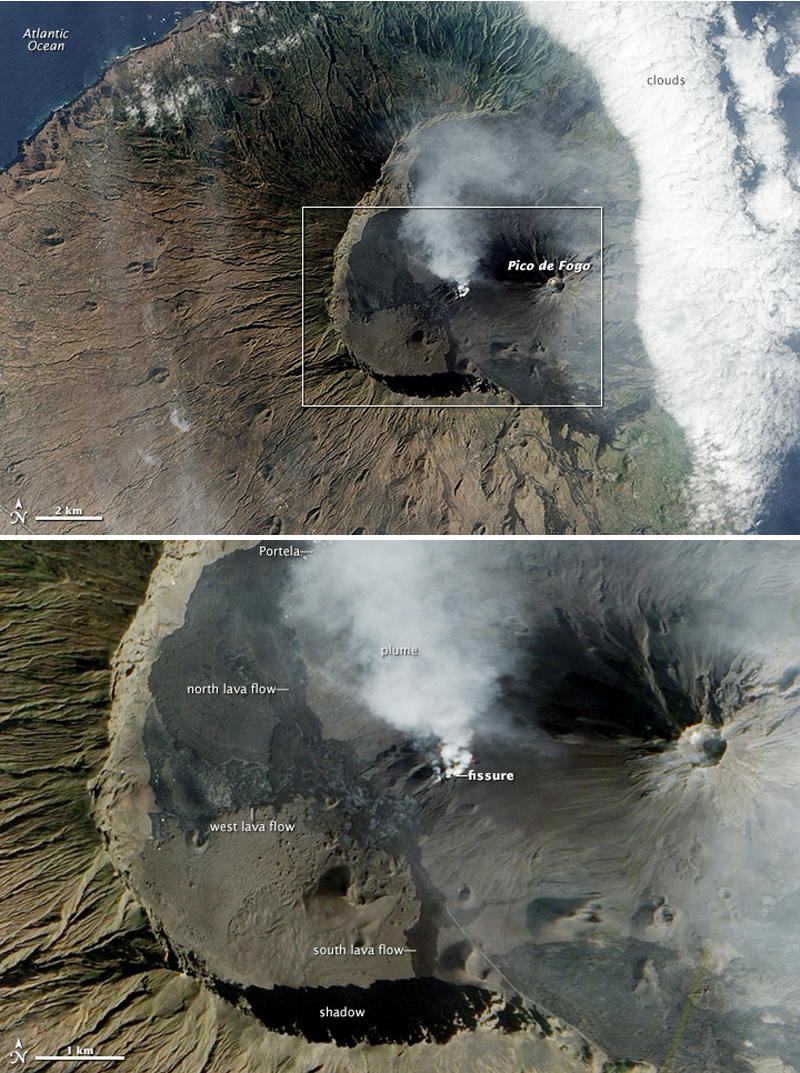 |
Figure 16. The Advanced Land Imager (ALI) on the Earth-Observing 1 (EO-1) satellite captured this image on 24 December 2014 of the eruption at Fogo that began on 23 November 2014. The top image offers a broad view of the island's most distinctive feature: Cha Caldera. The nine-kilometer wide caldera has a western wall that towers a kilometer above the crater floor. The eastern half of the crater wall is gone, erased by an ancient collapse. The lower image shows a more detailed view of the caldera. The volcanic plume streams from a fissure at the SW base of Pico de Fogo, the island's highest point. Both of the villages destroyed by the eruption, Portela and Bangaeira, were located within the caldera. In late November, lava poured into Portela; by 8 December it had entered Bangaeira. The volcanic plume obscures the remains of the two villages, but the white roofs of a few structures are visible on the upper left side of the image. In addition to the north flow that affected the villages, the 2014 eruption also produced flows that moved S and W. Courtesy of NASA Earth Observatory. |
The April-May 1995 eruption produced lava flows from a vent at the SW base of the Pico cone (BGVN 20:05, figure 3) that flowed SW and NW from the vent. They cut off the main access road to the larger villages of Portela and Bangaeira along the NW side of the caldera, but the approximately 1,300 residents from the various communities within the caldera were all safely evacuated, and the villages were spared. Effusive activity produced Strombolian fountains, pyroclastic material, ash plumes, and both pahoehoe and aa lava flows. The lava flows destroyed the small settlement of Boca de Fonte (population 56) near the caldera wall about 2 km W of the eruption center, and reached to within 300 m of Portela village. By the time it was over at the end of May 1995, new lava flows covered about 6.3 km2 of land, and ranged from one to over twenty meters thick.
The most recent eruption at Fogo began with lava flows emerging from a similar fissure vent at the base of Pico on 23 November 2014 (figure 17), and continued through 8 February 2015 according to OVCV; the flows covered about 4 km2 of land. The villages of Portela and Bangaeira, located 4-5 km NW of Pico with a combined population of about 1,000 residents, were not spared during the 2014-15 eruption as they had been in 1995; both villages were largely destroyed (figure 18), although their inhabitants were safely rescued. The eruption began from a fissure near the 1995 vent, but it soon emerged from multiple vents along the fissure with Strombolian activity (figure 19), explosions, lava fountains, and ash emissions.
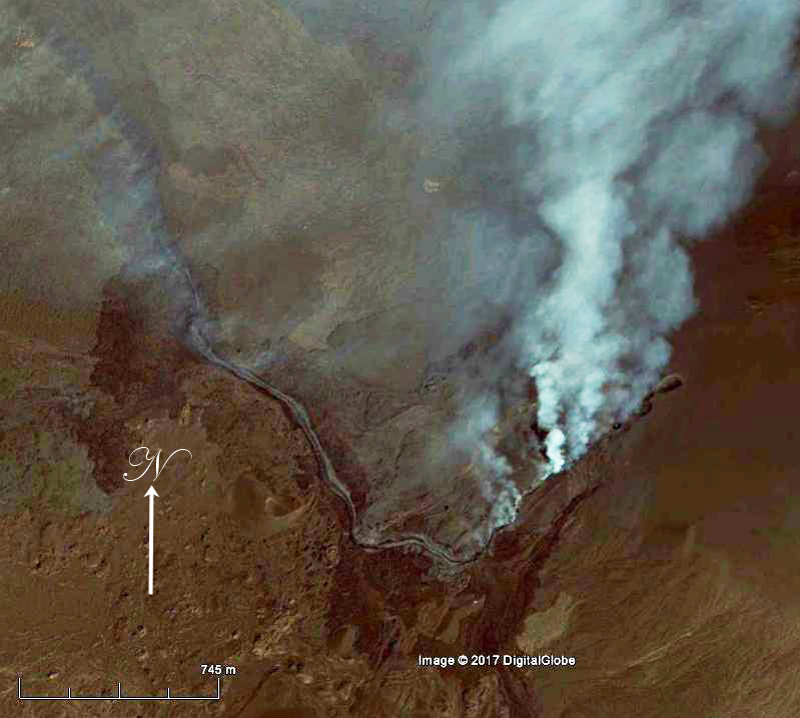 |
Figure 17. Lava and gas emerge from a fissure at Fogo on 24 November 2014, one day after the eruption began in this satellite image used by Google Earth. The fissure is located at the SW base of Pico, the cone within the Cha Caldera. Image copyright by DigitalGlobe, courtesy of Google Earth. |
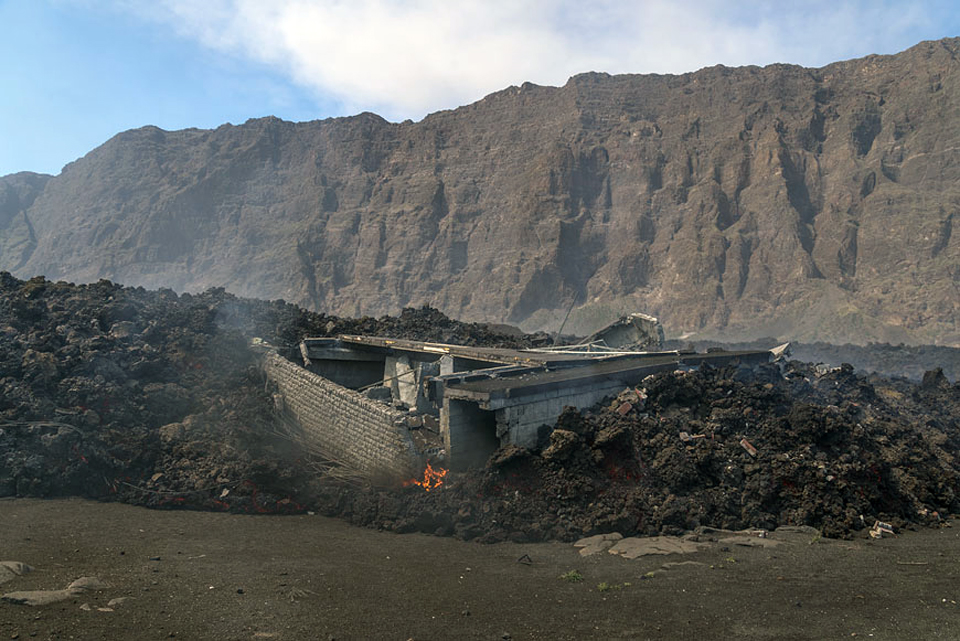 |
Figure 18. The villages of Portela and Bangaeira were destroyed by the lava flows at Fogo during late November 2014-February 2015. This image of a home in Portela trapped in a lava flow was taken between 30 November and 3 December 2014. Photo copyright by Martin Rietze, used with permission. |
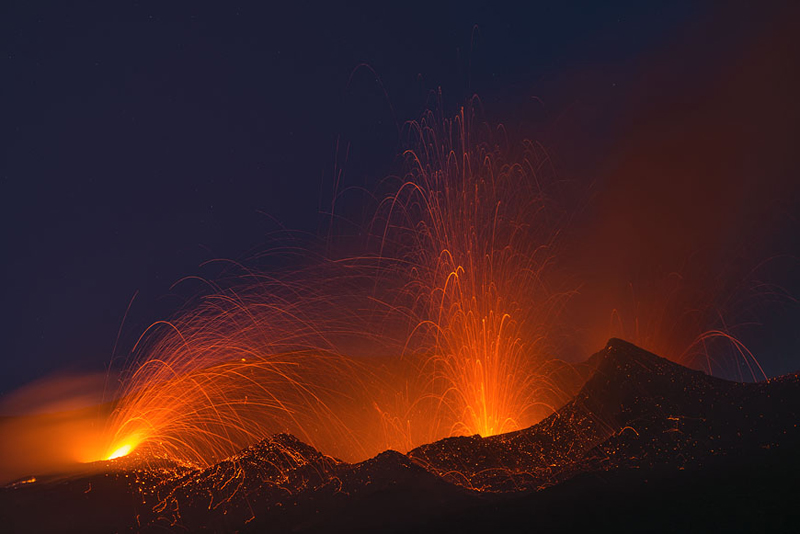 |
Figure 19. Strombolian activity at dawn on 30 November 2014 from multiple fissure vents at Fogo. Copyright by Martin Rietze, used with permission. |
The lava flows consisted of three primary lobes that traveled NNW, S, and W (BGVN 39:11, figure 8). During the earliest days of the eruption in late November, lava flowed to the NNW destroying much of Portela (figure 20 and 21) and to the S from the main fissure. The flow to the S ceased after 30 November.
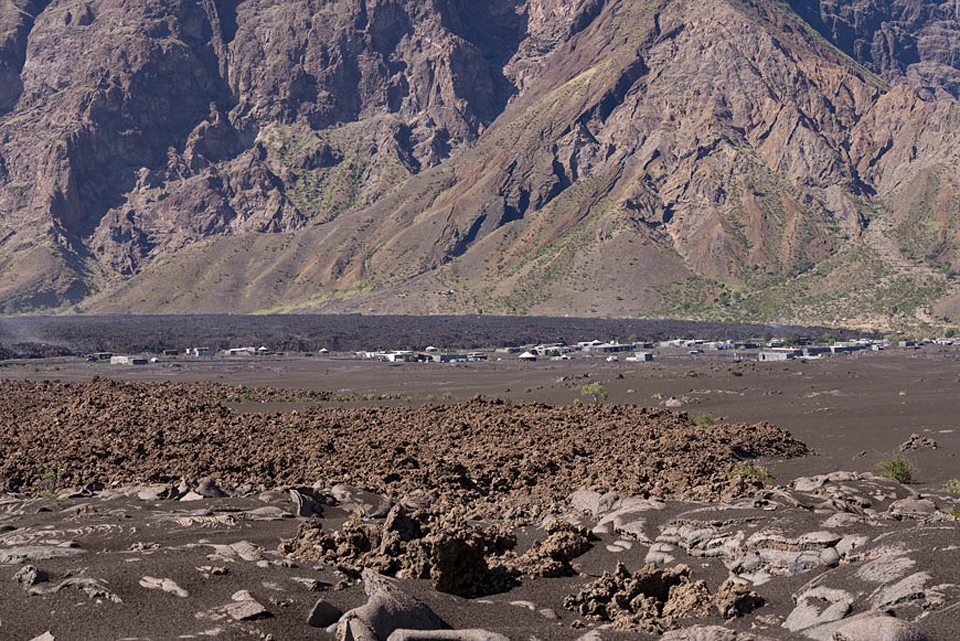 |
Figure 20. Lava advances NNW on the community of Portela at Fogo sometime during 30 November-3 December 2014. Photo copyright by Martin Rietze, used with permission. |
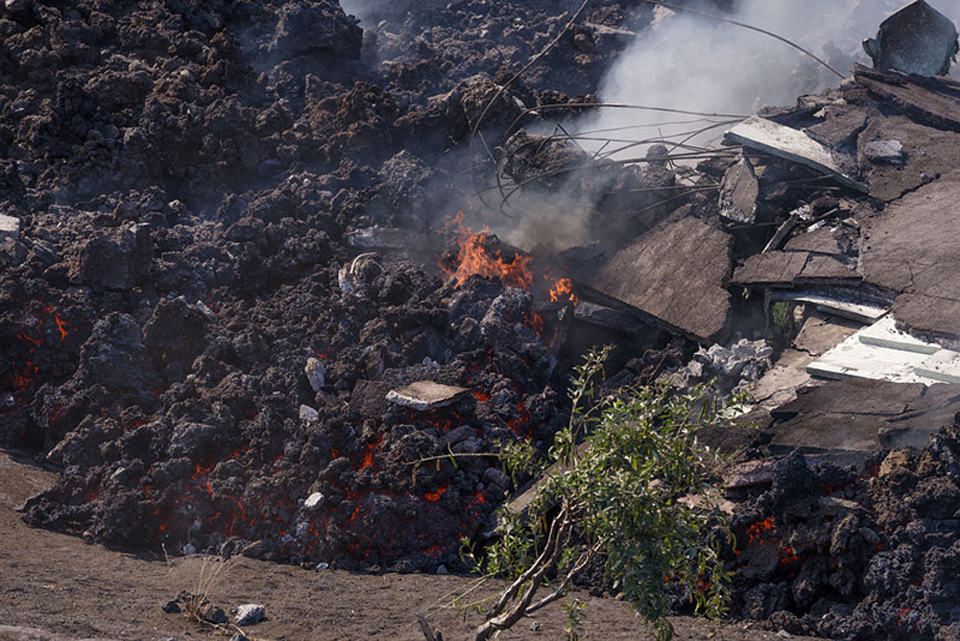 |
Figure 21. A lava flow consumes a house in the village of Portela at Fogo on 30 November 2014. Copyright by Martin Rietze, used with permission. |
The main flows continued NNW into the first week of December; they destroyed the remaining structures in Portela and caused extensive damage in Bangaeira and at the Parque Natural de Fogo headquarters (figures 22 and 23). A third lobe flowed to the W of the fissure during the second half of December, reaching the base of the 1-km-high caldera rim where it damaged farms and infrastructure in the small village of Ilhéu de Losna (see figure 16). The lava had ceased advancing by early January.
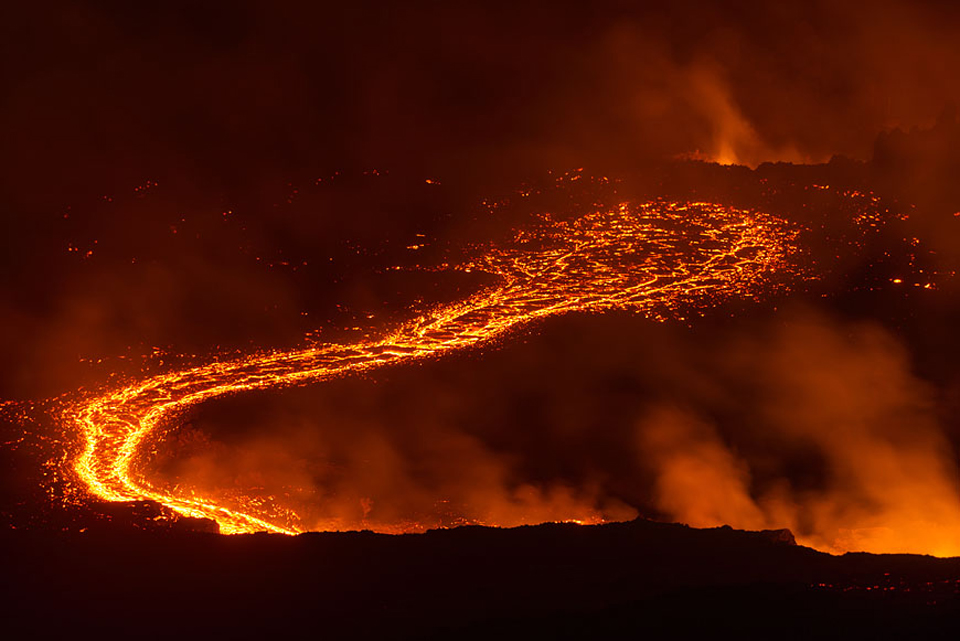 |
Figure 22. Lava flow on 1 December 2014 at Fogo emerges from a fissure vent. Photo copyright by Martin Rietze, used with permission. |
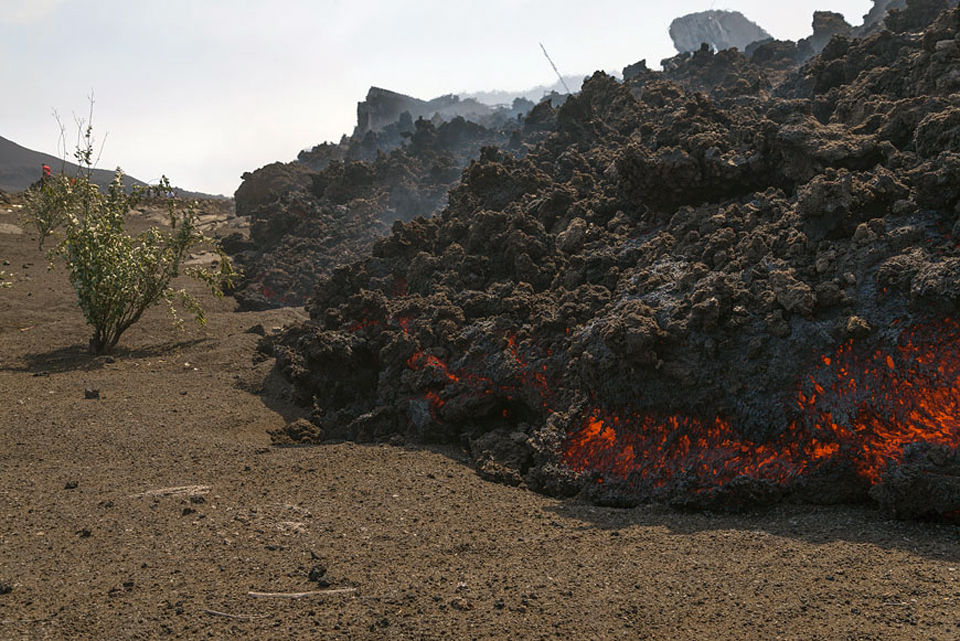 |
Figure 23. Advancing lava flow with blocky (aa) texture at Fogo during 30 November-3 December 2014. Photo copyright by Martin Rietze, used with permission. |
The MODVOLC thermal alert system issued eight thermal alerts from the lava flows (figure 24) on 23 November 2014. Tens of alerts were reported almost daily through 19 December, with a peak of 46 alerts on 30 November. For the rest of December, as many as 10 alerts a day were recorded. By January 2015, they became more intermittent, with no more than three alerts issued in any day, and they occurred on only 11 days of the month. The final two thermal alerts were recorded on 7 February 2015.
 |
Figure 24. A cascade of lava flows from a fissure vent at Fogo during 30 November-3 December 2014. Photo copyright by Martin Rietze, used with permission. |
Ash emissions from the fissure vents were intermittent throughout the eruption (figures 25). The first major plume on 24 November 2014 was reported by the Toulouse VAAC as consisting largely of SO2, with very little ash. It rose to 9.1 km altitude, drifted 220 km NW, and caused minor ashfall on the flanks of the volcano. After the initial plume of mostly SO2, ash emissions from the vent were generally below 3.9 km altitude and limited to the immediate area of the island (figure 26).
 |
Figure 25. Residents flee with their belongings as ash emissions and lava flows emerge from multiple vents on the SW flank of Pico cone at Fogo during the last week of November 2014. Photo by Joao Relvas/Lusa, courtesy of The Observador, published on 30 November 2014. |
 |
Figure 26. Ash explosion and incandescent material erupted from a fissure vent during 30 November-3 December 2014. Photo copyright by Martin Rietze, used with permission. |
Ash was reported rising to 2 km above the summit (4.8 km altitude) on 2 December (figure 27), and ashfall was reported near San Felipe (17 km SW). Ash and SO2 emissions decreased in mid-December; the next plume was reported on 21 December rising 800 m above the summit. Additional plumes during 30 December-2 January rose 400-900 m above the cone and occasionally sent tephra up to 40 m away. Several explosions of gas-and-ash plumes during 8-12 January produced plumes that rose up to 2 km above the summit and drifted E or SE. The largest plume, on 12 January, was very dense and dark-gray, it rose 2 km and drifted E; tephra was also ejected 50 m above the crater and was observed by people in San Felipe and other parts of the island.
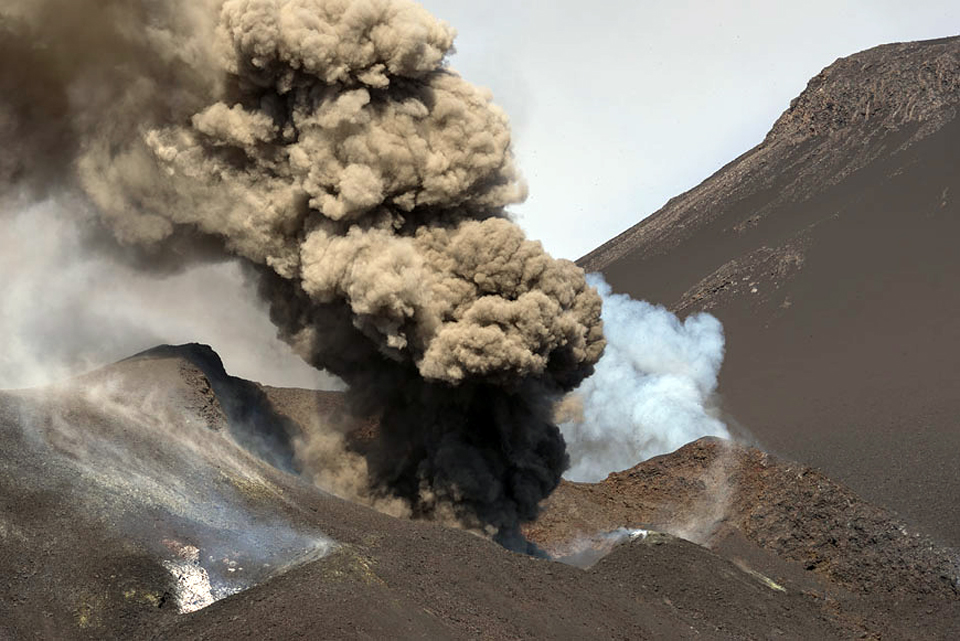 |
Figure 27. Ash emission on 2 December 2014 from the fissure vent at Fogo. The plume was reported at 2 km above the summit of Pico. Photograph copyright by Martin Rietze, used with permission. |
Satellite data on SO2 flux from Fogo corroborated the VAAC reports of the high SO2 content in the emissions, especially during the first two weeks of the eruption when Dobson Unit (DU) values greater than 2 were recorded several times, and the plume areas covered several hundred thousand square kilometers (figure 28).
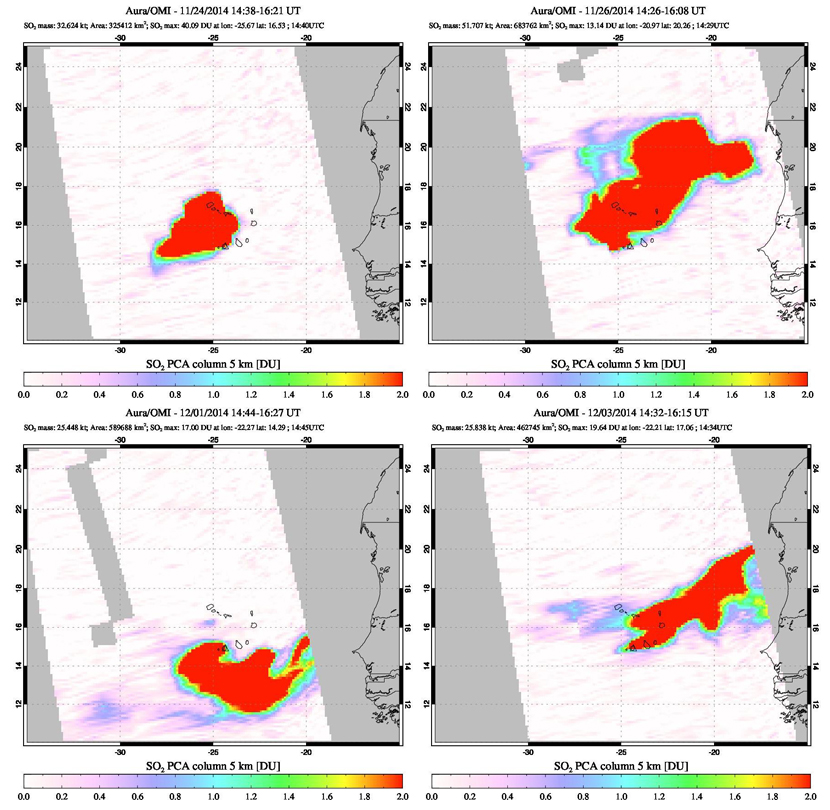 |
Figure 28. Sulfur dioxide plumes measured with the Aura Instrument on the OMI satellite show substantial amounts of SO2 released from Fogo during the eruption of November 2014-February 2015. Top Left: The SO2 plume captured on 24 November covered over 325,000 km2 and registered over 40 Dobson Units (DU), a measure of the molecular density of SO2 in the atmosphere; Top Right: the plume on 26 November covered almost 700,000 km2 and drifted N and E; Lower Left: on 1 December the 590,000 km2 plume drifted in multiple directions from the vent; Lower Right: on 3 December the large plume drifted NE and registered at almost 20 DU. Courtesy of NASA Goddard Space Flight Center. |
Information Contacts: Toulouse Volcanic Ash Advisory Center (VAAC), Météo-France, 42 Avenue Gaspard Coriolis, F-31057 Toulouse cedex, France (URL: http://www.meteo.fr/vaac/); Observatório Vulcanológico de Cabo Verde (OVCV), Departamento de Ciência e Tecnologia, Universidade de Cabo Verde (Uni-CV), Campus de Palmarejo, Praia, Cape Verde (URL: https://www.facebook.com/pages/Observatorio-Vulcanologico-de-Cabo-Verde-OVCV/175875102444250); Hawai'i Institute of Geophysics and Planetology (HIGP), MODVOLC Thermal Alerts System, School of Ocean and Earth Science and Technology (SOEST), Univ. of Hawai'i, 2525 Correa Road, Honolulu, HI 96822, USA (URL: http://modis.higp.hawaii.edu/); NASA Earth Observatory, EOS Project Science Office, NASA Goddard Space Flight Center, Goddard, Maryland, USA (URL: http://earthobservatory.nasa.gov/); NASA Goddard Space Flight Center (NASA/GSFC), Global Sulfur Dioxide Monitoring Page, Atmospheric Chemistry and Dynamics Laboratory, 8800 Greenbelt Road, Goddard, Maryland, USA (URL: https://so2.gsfc.nasa.gov/); Google Earth (URL: https://www.google.com/earth/); The Observador (URL: http://observador.pt/2014/11/30/erupcoes-vulcanicas-da-ilha-fogo-evoluem-para-estado-critico/); Martin Rietze, Photographer (URL: http://www.mrietze.com/web13/Fogo_f14.htm).
2015: January
| February
2014: November
| December
The Observatório Vulcanológico de Cabo Verde (OVCV) reported that on 8 February the eruption at Fogo had ended; sulfur dioxide emissions were almost undetectable on 8 February and continued to remain so at least through 11 February. During that period, pahoehoe flows remained stagnant and only minor fumarolic activity was present at the edge of the new crater. In addition, since 7 February, temperatures of the fumaroles and of an area at the base of the cone had decreased significantly.
Source: Universidade of Cabo Verde
The Observatório Vulcanológico de Cabo Verde (OVCV) reported that on 8 January the eruption at Fogo decreased in intensity; a small light-colored gas plume rose at most 100 m from the craters. Some explosions, following banging noises, were felt in areas 1 km away. Periodic explosions continued the next day and at 1530 a dark gas-and-ash plume rose 1.2 km and drifted SE. On 10 January light-colored, dense plumes rose at 800-1,200 m. Explosions on 11 January produced light-colored gas plumes that rose as high as1.5 km. On 12 January gas-and-ash plumes rose 800-1,000 m. In the afternoon a strong explosion was followed by smaller explosions and accompanying crashing noises that lasted for 2 hours. A very dense and dark-gray ash plume rose 2 km and drifted E, and was observed by people in S Philip and other parts of the island. At 1900 tephra was ejected 50 m above the crater. The lava-flow fronts to the N and S of Ilhéu de Losna were stagnant, while a few outbreaks were observed in Portela and Bangaeira.
Source: Universidade of Cabo Verde
Based on gas-monitoring efforts of the Instituto Vulcanológico de Canárias (INVOLCAN) and data from the Toulouse VAAC, the Observatório Vulcanológico de Cabo Verde (OVCV) reported that sulfur dioxide emission rates at Fogo were 1,201-1,368 tons per day during 30-31 December and 1-2 January. A gas plume rose 700-900 m above the cone during 30-31 December and drifted N; on 31 December tephra was ejected 30-40 m away and ash was present on the plume. A lava front near S Ilhéu de Losna had been stagnant for a few days while one near the N part of the town advanced at a reduced speed, overtaking a road and parts of some housing. Temperatures of the lava fronts continued to gradually decrease. During 1-2 January a gas plume rose 400-600 m above the cone and tephra was occasionally ejected 20-25 m away.
Source: Universidade of Cabo Verde
According to news articles the eruption from Fogo's Pico cone inside the Cha Caldera continued during 17-23 December. On 21 December gas emissions increased and the eruption plume rose 800 m. Lava continued to erupt from the main vents. By 22 December parts of the road in Ilhéu de Losna were overtaken by lava, as well as agricultural fields, a vineyard, and about a dozen homes (one remained by 23 December).
Source: Fogo News
According to news articles the rate of lava output from Fogo's Pico cone inside the Cha Caldera had decreased on 9 December and remained low through 14 December. Gas and ash emissions also decreased and were almost absent by 14 December. Even though output was low, the remaining buildings in the town of Bangaeira were overtaken by lava.
Source: Fogo News
According to news articles the eruption from Fogo's Pico cone inside the Cha Caldera continued during 3-9 December. The eruption became more intense on 6 December with lava flows traveling at a rate of 30 meters per hour. By that afternoon 20 houses in the N half of Portela had been destroyed, and authorities ordered a complete evacuation of the area. The third access road that allowed for residents to retrieve property was being covered by lava. Later that day lava reached the town of Bangaeira. More than half of Bangaeira was inundated by the very fluid lava and by the evening only a few houses remained. Flights from the island to a few other locations were cancelled due to ash emissions. By 8 December about 90% of Bangaeira and 95% of Portela were overtaken by the flows which, and as noted by the article, destroyed 100 years of town history. After moving through the towns the lava-flow front was about 300 m wide. By 8 December the almost 1,500 residents of the caldera had been evacuated, with 848 of them in shelters. Lava-flow advancement slowed on 9 December.
Source: Fogo News
According to news articles the eruption from Fogo's Pico cone inside the Cha Caldera continued during 26 November-2 December. In the morning of 30 November the eruption intensified; lava traveled at a rate of 20 m/hour and caused the closure of the only alternative route between the national park and Portela, the main town in the caldera. Authorities warned all residents in the caldera to evacuate. Lava destroyed almost 25 homes, a large area of agricultural land, the Parque Natural do Fogo museum, and other infrastructure. By 2 December there were two lava fronts. After about 24 hours of minimal advancement, the rate of advancement increased; lava overtook several more houses, a school, and a hotel.
Sources: Observador; Fogo News
According to news articles an eruption from Fogo's Pico cone inside the Cha Caldera began in the morning on 23 November after increased activity detected in the previous weeks and felt earthquakes by residents the night before. The eruption started at a vent on the WSW base of Pico cone, near or at where explosions originated in 1995, and then rose from multiple vents. The activity was characterized by explosions, lava fountains, and ash emissions. About 700 people evacuated from Chã das Caldeiras and the local airport closed. During the afternoon on 24 November workers removed items from the national park headquarters and by the evening lava had overtaken the building. Lava flows had crossed a main road and taken down communication poles. The Toulouse VAAC noted that a cloud observed in satellite images composed mainly of sulfur dioxide drifted over 220 km NW at an altitude of 9.1 km (30,000 ft) a.s.l. Ash in the cloud was detected at lower altitudes. By 25 November the lava flow was 4 km long.
Sources: Darwin Volcanic Ash Advisory Centre (VAAC); BBC News; Boston
Reports are organized chronologically and indexed below by Month/Year (Publication Volume:Number), and include a one-line summary. Click on the index link or scroll down to read the reports.
New eruption on 2 April generates lava flows within the caldera
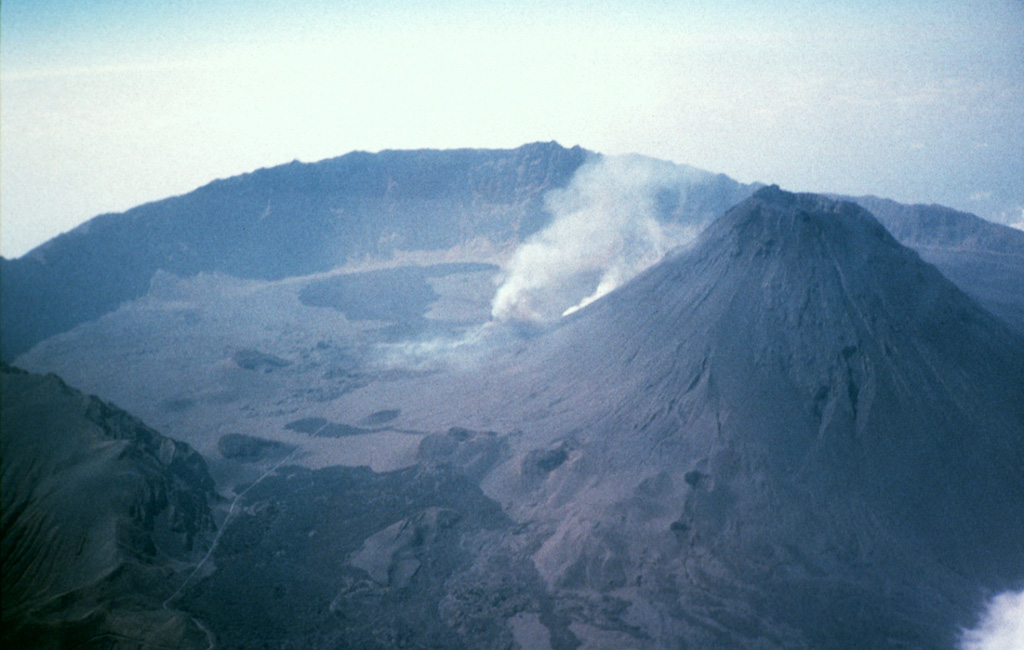
A fissure eruption that began the night of 2-3 April produced lava flows from the base of the Pico cone, located within the 8-km-diameter Cha Caldera (figure 1). This cone, also called Fogo Peak, has a crater ~500 m in diameter and 180 m deep. Caldera residents felt weak intermittent earthquakes as early as 25 March. After 0100 on 2 April the earthquakes increased in frequency, and felt events occurred at 0700 and 1500. At about 2015 residents felt a stronger earthquake that caused dishes to fall from cupboard shelves and may have opened a 200-m-long crack on the flanks of the cone.
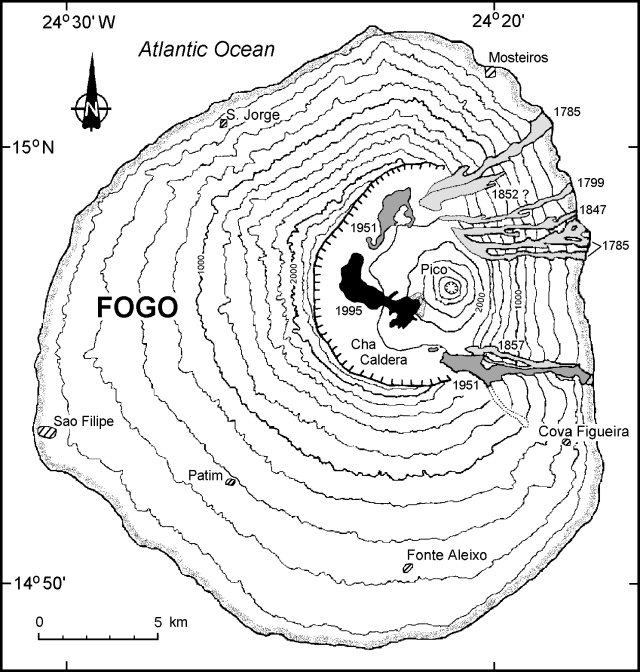 |
Figure 1. Topographic map of Fogo Island showing historical lava flows (shaded), current lava flows through 11 April (solid), and selected towns (hatched). Modified from Neumann van Padang and others (1967). |
Residents in Sao Filipe, ~15 km WSW of the vent, noticed a red glow around 2300 on the night of 2 April, probably the beginning of the eruption. Other residents reported that eruptive vents on the flank of Pico opened at 0006 on 3 April. Initially there was a burst or jetting of gas followed by ejection of large blocks. This Strombolian activity was followed by a "curtain of fire" that fed a lava flow, which cut off the main road to Portela village by 0200 (figure 2). By 0500 on 3 April, fine dark ash had begun to fall in areas close to the volcano. Around the same time, an eruption cloud to a height of 2,500 m was formed. Witnesses told reporters that the volcano was "spewing out smoke and flames." The head of the Cape Verde Red Cross stated that high flames could be seen and that "a pall of black smoke was hanging over the island."
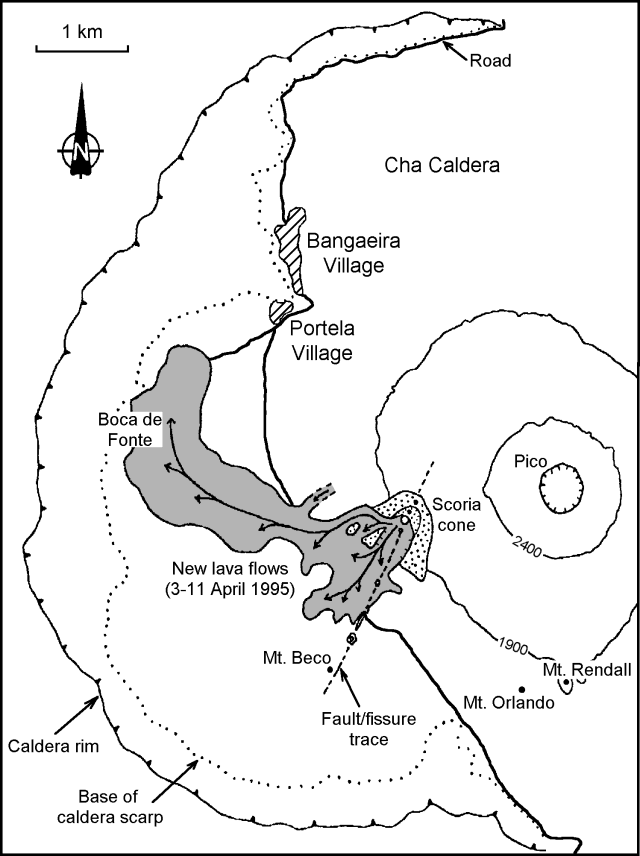 |
Figure 2. Map of Fogo caldera showing lava flows from the current eruption. Courtesy of João Gaspar, Universidade dos Açores. |
During the night of 2-3 April, several residents evacuated to the N coast. Once ashfall began, more caldera residents and some people in the eastern villages of Corvo, Achada Grande, Relva, Tintiera, Cova Matinho, Cova Figueira, and Estância Roque also evacuated to the coastal towns of Mosteiros (~9 km N of the summit) or Sao Filipe. Police officials reported that all of the ~1,300 people living within the caldera had managed to get out on foot and had been accounted for by noon on 3 April.
Under the supervision of the National Defense Minister, a Crisis Cabinet was created by the Cape Verde Government. About 60 Cape Verde Army soldiers were sent to the island and an emergency communications system was installed. Food and medicine were provided, and evacuation centers (schools, private institutions, and tent camps) were established to hold up to 5,600 people. Official reports indicated that almost 1,000 persons were sheltered in the Army camps at Sao Filipe, Patim, Achada Furna, and Mosteiros. During the first days of the eruption local authorities, Cape Verde soldiers, and volunteers, helped caldera residents save their belongings. Nobody was killed, and only 20 people needed medical assistance during the evacuation, including children with respiratory problems. Although numbers are uncertain, as many as 5,000 people may have been displaced during this eruption. As of 16 April, Portela residents continued to remove belongings by foot.
Around noon on 3 April some teachers who had driven from Sao Filipe to Mosteiros told geologist Veronica Carvalho Martins (U.S. Embassy in Cape Verde) of sandy ashfall along the road on the E side of the island just below the caldera; they also reported sounds "like an old stove." During a flight W of the caldera soon afterwards, Martins observed a high mushroom-shaped ash column rising from the caldera. Martins later saw a long fissure vent with lava fountains feeding an already well-developed flow that was moving W across a road towards the caldera wall and curving N. A vent SE of the fissure exhibited continuous strong ejection of brownish pyroclastic material, while to the NW a smaller vent was intermittently ejecting similar material.
João Gaspar (Universidade dos Açores) and colleagues from Cape Verde (ISE and IICT) reported that on 3 April a thick cloud of dark ash and vapor 2,500-5,000 m high could be seen from Santiago Island, ~60 km ENE. Early that morning three small vents were observed inside the caldera along the SW part of a N30°E fissure that crossed the main road within the caldera (figure 2). Fine dark ash and small pahoehoe lavas were produced, and large plastic bombs (1-4 m in diameter) were projected distances of 500 m. That afternoon the fissure reached 2 km in length, and four new vents opened in its NE section. Activity increased during the night of 3-4 April with the emission of more lava flows, but decreased the following morning. One Cape Verde official said that the lava was moving at a speed of 60 m/hour. Gaspar reported that explosive activity was centered at the NE vents, but strong fumarolic activity continued along the main fissure. Lava fountains reached ~ 400 m high and a cloud of dark ash and gases rose 2,000 m. A scoria cone with a crater open to the SW formed and produced aa lava flows with thicknesses of 3-10 m measured at different fronts.
Effusive activity remained intense on 4 April, but ejection of pyroclastic fragments had decreased significantly. Television pictures showed a lava "stream" coming from the fissure and, in the morning, a mantle of aa lava covering the central part of the caldera. Portuguese television and other press coverage on the evening of 5 April indicated that activity had decreased.
In the following days the lava flow reached the settlement of Boca de Fonte near the caldera wall ~2 km W of the eruption center, and by 9 April it had destroyed at least 5 houses (possibly 10), the main water reservoir, and several square kilometers of fertile land used to grow coffee, wine grapes, fruits, maize, tapioca, and beans. Reluctant farmers with cattle in the caldera were ordered to leave their homes or face arrest on 8 April. A TSF Radio correspondent reported on 9 April that the lava flow moving into Boca de Fonte was advancing at a rate of 10-14 m/hour, twice as fast as the day before. However, the flow slowed to 4-5 m/hour on the 10th. Weak tremor had been felt on the caldera floor since the start of the eruption. On 10 April the seismicity increased, and earthquakes with Mercalli intensities of III-IV occurred, probably due to obstruction of the main vent, where lava fountaining stopped briefly.
Richard Moore and Frank Trusdell (U.S. Geological Survey) arrived on 10 April to assess the volcanic hazards and advise the Government of Cape Verde. With the help of Martins, they installed a seismograph ~1 km S of the erupting vent. The seismograph recorded continuous tremor, indicative of the ongoing eruption, as well as microearthquakes (M
Gaspar noted that on 11 April two main lava rivers had velocities of 5-6 m/s near the vent. One lobe moved towards the W and fed the flow-front moving towards Portela and Bangaeira villages. The other more active lobe was directed SW into the Cova Tina depression. The USGS team observed relatively low-volume eruptions of gas-rich spatter slowly building a cone, and lava cascading rapidly down the W flank of Pico being directed W and SW by high levees. The N flow-front, near Portela, stagnated during 10-11 April. At 1830 on 11 April, advancing flows were confined to the S part of the caldera, where two small lobes were moving W at a rate of ~15-20 m/hour, travelling S of the flows erupted the previous week.
During the morning of 12 April eruptive activity consisted of Strombolian gas-rich spatter ejection; volumetric output remained relatively low. At 1549 activity changed to Hawaiian-type fire fountains that typically rose 100-120 m above the vent, slowly building a scoria cone 100 m high. A new lava flow that started on 12 April overrode the first flow, which had stagnated ~1 km SW of Portela. This flow quickly traveled 3 km from the vent in the general direction of Portela, but remained entirely on top of the first flow. All other lava flows were inactive at 1900 on 12 April. Preliminary estimates of erupted volume through 12 April ranged from 50 to 75 x 106 m3 of lava.
Although volumetric output remained low, Hawaiian-type fire fountains continued on 13 April and a flow confined to a 3-m-wide channel cascaded down the W flank of the new cone. That channel continued to feed a sluggish aa flow moving W then N. The cinder and spatter cone reached a height of 120 m. The overriding lava flow only moved N another 46 m; most of the additional lava was expended covering the first flow. The added mass on top of the first flow also caused it to spread laterally.
Activity on 14 April continued unabated, increasing the height of the new cone to 130 m. The E lobe of the second flow reactivated and moved 470 m N during 13-14 April. At 1900 on 14 April the second flow was within 235 m of the distal end of the first flow, and lateral spreading was occurring at the flow margins. At this time the distal portion of the first lobe showed signs of renewed movement, induced by pressure from the overriding aa flow. The thick aa flow continued to spread slowly W the next day; maximum lateral spreading S of Boca de Fonte was ~3 m. The new E lobe of the second flow advanced an additional 6 m and stopped. At 1700 on 15 April the most active part of the overriding flow was on its NW side. Much of the lava production apparently went towards thickening the central part of the flow, estimated to be 16 m thick. At 1800 on 15 April spatter fountains were ~100 m high and cinder was falling as far as 2 km S of the vent.
Activity remained generally constant on 16 April, with fire fountains typically rising 100-120 m; the scoria cone stood 140 m tall. Estimates of lava-channel dimensions and speeds through 16 April yielded an erupted lava volume of 2.5-8 x 10⁶ m3/day. The flow-front became remobilized at 1535 on 16 April, and by 1700 had moved 38 m beyond and NE of the distal end of the first flow. At that time the lava front was ~534 m from the nearest house in Portela. A lava temperature of 1,056°C was measured with a thermocouple in a spiny aa breakout near the terminus of the flow. From a few hundred meters away, USGS geologists watched the roof of a small house burn; it was buried soon thereafter. There was also considerable lateral spreading of the flow S of Boca de Fonte on 16 April. In this area, the flow-front monitor lines showed westward movement of 19-26.5 m. At 1800 the flow was still active and 41-72 m E of the Portela access road. Thickness at the margins of the active flows ranged from 1 to 20 m. The greater thicknesses are a strong indication that a breakout of spiny pahoehoe or aa can be expected, advancing the flow.
Fogo Island (476 km2), with a population of ~33,000, consists of a single massive volcano with an 8-km-wide caldera breached to the E; the W rim rises 700 m above the caldera floor. The central cone in the caldera, the highest point in the Cape Verde Islands, was apparently almost continuously active from the time of Portuguese settlement in 1500 A.D. until around 1760. Later historical lava flows reached the E coast. The last eruption was during June-August 1951 from caldera vents S and NW of the central cone. That eruption, also preceded by earthquakes, began with ejection of pyroclastic material that formed Mt. Rendall and Mt. Orlando (figure 2).
Reference. Neumann van Padang, M., Richards, A.F., Machado, F., Bravo, T., Baker, P.E., and LeMaitre, R.W., 1967, Catalogue of active volcanoes of the world including solfatara fields, part XXI, Atlantic Ocean: Rome, IAVCEI, 128 p.
Information Contacts: J. Gaspar and N. Wallenstein, Universidad dos Açores; A. Mota Gomes, Instituto Superior de Educação de Cabo Verde (ISE), Cape Verde; F. Costa and E. Correia, Centro de Geografia do Instituto de Investigação Cientifica de Tropical (IICT), [Portugal]; R. Moore, USGS; F. Trusdell, USGS Hawaiian Volcano Observatory; V. Carvalho Martins, U.S. Embassy, Cape Verde; UNDHA; Reuters; UPI; LUSA News Agency, RTP Internacional Television, Channel 1 Television, and TSF Radio, Lisbon.
Fire fountains continue but lava extrusion rate declines
On 2-3 April a fissure eruption began on Fogo Island from the SW flank of Pico cone (Fogo Peak) within the 8-km-diameter Cha Caldera (BGVN 20:03). During the initial stage of the eruption there was a burst or jetting of gas, followed by ejection of large blocks and fire fountaining. A lava flow cut off the main road to local villages by the morning of 3 April, and ash fell on the island. Approximately 1,300 residents in the caldera were evacuated.
Volcanologists from the United States, Portugal, and France were requested by the Cape Verdean government to help monitor and evaluate the activity. João Gaspar (Universidade dos Açores) and colleagues observed the activity until 11 April. U.S. Geological Survey (USGS) volcanologists, assisted by Cape Verdean geologists, installed a seismic station and monitored the eruption during 10-25 April. Additional information about the vent activity during 14-19 April was provided by Henry Gaudru and members of the Société Volcanologique Européenne who visited the volcano. François Le Guern (CNRS France) monitored the volcano on 25-27 April.
Summary of activity, 3-16 April. Detailed activity reports through 16 April have already been published (BGVN 20:03). Seven vents were active on the first day of the eruption, with fire-fountains feeding pahoehoe lava flows, ejection of volcanic bombs, and a gas-and-ash plume 2,000 m high. A scoria cone was soon built, from which lava flows were directed SW before turning NW towards the caldera wall. As the main aa flow approached the caldera scarp it turned N, covering the settlement of Boca de Fonte by 9 April and approaching Portela and Bangaeira (see map in BGVN 20:03). Less vigorous fire fountaining continued on 12-16 April, and fed new lava flows on top of the previous aa flow. There were occasional periods of Strombolian spatter ejections. By late on 16 April the remobilized flow-front was ~4 km from the source vent and only a little more than 500 m from the nearest house in Portela.
Activity during 17-25 April. Except where noted otherwise, the following observations are from the USGS team and their Cape Verdean colleagues. Activity continued on 17 April with little change at the vent. Spatter fountains rose 100-150 m, and the cone was ~150 m high. Volcanic tremor amplitude remained moderate to strong. The N end of the aa flow advanced ~150 m during 16-17 April, to ~420 m SW of the nearest house in Portela, and the E side of the flow moved 20-50 m ENE. The W side of the flow advanced >100 m and by 1430 had crushed half of the winery at Boca de Fonte. After these breakouts blocked the access road a new road was created through agricultural fields, forcing residents rescuing belongings to walk an additional 500 m. Flow movement was barely perceptible after 1430 and largely restricted to short spiny pahoehoe and aa oozes at flow margins, although lava output at the vent was unchanged.
Between 1630 and 2030 on 17 April, Gaudru noted that Strombolian explosions were less vigorous and that the main lava channel had widened from 2-3 m to 5-6 m because of lava-block obstructions. The W flank of the cone was also covered by cinders. Explosive activity increased at 1900, sending incandescent ejecta 150-200 m above the rim of the cone. A flame visible behind the E part of the cone was apparently coming from a small vent on the upper E flank. At 2000 explosions began ejecting material >300 m W instead of vertically.
Tremor amplitude began to increase around 0650 on 18 April, and at 0740 became continuous at about twice the previous amplitude. Eruptive style changed from fire fountaining to Strombolian activity, with spatter discharged by loud gas bursts every 3-8 seconds. Lava production increased during the morning; by noon the lava was largely pahoehoe in the upper 300 m of the channel. Estimated channel dimensions and the speed of lava in it yielded production rates of 4-8.5 x 10⁶ m3/day. Microearthquakes were intermittent, with three larger events (all M <1) at 1314 and 1803 on 18 April, and at 0426 on 19 April.
Seismograph records showed that activity during 0110-0320 and 0426-0610 on 19 April was characterized by strong explosive bursts, which were interpreted to be vent clearing episodes after pieces of the cone and newly erupted spatter closed the conduit. After 0610 the seismicity indicated a return to fire-fountaining. A favorable wind direction permitted a close approach to the vent and lava channel to verify the volume estimate, but the lava appeared somewhat more viscous/sluggish. There was no measureable movement at the edges of the aa flow on 19 April after <3 m of movement the day before, however, lava continued ponding in its channel near the middle of the flow.
Observations made by Gaudru from 1230 on 18 April until 1230 on 19 April indicated that activity remained strong with incandescent fragments rising >200 m and loud detonations. Explosions every 1-2 seconds, accompanied by earthquakes, ejected particles ranging in size up to >1 m3. Gas outbursts were more intense, and black plumes hovered over the active cone. Partial obstruction of the crater caused a larger explosion at 1745 on 18 April that sent gas and cinders 500-600 m high. After several seconds of quiet, stronger explosive activity began again with sounds that shook the ground. The upper E flank crater sent an intermittent orange-red flame 10-15 m high for several hours during this period, higher than previous days. Eruptive activity observed by the Gaudru group became more regular at 0100 on 19 April, when an intense episode began that sent lava fountains >300 m high for several hours. Explosive activity began again at dawn that lasted throughout the morning of 19 April.
Tremor amplitude on 19 April changed from moderate-strong to moderate around 1500, when Strombolian activity reverted back to fire fountains. Fire fountain heights diminished somewhat on 20 April, rising generally 20-50 m above the vent. Intermittent Strombolian activity continued with more energetic bursts that sent viscous lava clots >160 m high. A full lava channel 200 m W of the vent appeared much like it did the day before. A new aa lobe was moving sluggishly on top of the earlier flow, and by 1700 its distal end was ~600 m from the N end of the flow, nearest to Portela.
Strong Strombolian activity on 21 April produced loud bursts of viscous spatter 50-150 m high. A levee formed on top of the spillway adjacent to the vent behind which fountains rose 10-20 m, often interrupted by explosions. Lava exited through a hole in the bottom of the levee into a W-flank channel roofed over in two places. At the bottom of the spillway the lava entered a sinuous channel, moving W and NW on top of the previously emplaced flow; this channel remained full all day. The volume of lava erupted was similar to values for the past several days, 4-8 x 10⁶ m3/day. The 160-m-high cinder cone was no longer increasing significantly in height, but impact craters as large as 5 m wide and 1 m deep, created by fall of spatter bombs 0.5-2 m across, littered its flanks and parts of the cinder-mantled caldera floor up to 200 from the vent. As is common during eruptions of viscous mafic lava, the inner walls of the cone collapsed into the conduit, resulting in explosive vent-clearing episodes. The overriding aa flow on the E side of the N flow moved another 6 m N during 21 April.
Volcanic tremor on 21-22 April continued at moderate to strong levels, punctuated by frequent sonic bursts. Noisy Strombolian bursts sent clots of spatter over the top of the cone and onto its flanks. The volume of lava flowing into the channel was similar to that of 21 April. At noon, lava from a new crack on the N flank of the cone flowed 150 m N and soon stagnated. The aa flow advanced 2 m W near the new end of the road (150 m S of Boca de Fonte), and ~3 m NE on the E side of the N flow. Most of the volume of lava was concentrated in an aa lobe that was very slowly overriding the earlier flow. This lobe locally was at least 15 m thick and covered an estimated 75% of the existing flow field.
Activity on 23 April was spectacular. Deafening explosions from four discrete vents rocked the caldera all day; at times the ground was in continuous motion from concussion waves. The overriding aa lobe only moved ~4 m N on the E side of the main aa flow. However, early in the afternoon a new vent opened at the NW base of the cone. By 1700 lava was flowing W from this vent, and by 1807 spatter ejected to heights of 10-15 m was visible. Pahoehoe lava flowed on top of older aa and soon joined the large stagnating aa channel 500-700 m from the main cone. For the preceding 4 days the seismograph had recorded sonic bursts and microseisms. It was believed that shock waves associated with the bursts caused several fractures on the cone. One of these cracks provided a new pathway for lava to exit the cone, thus robbing the main channel of most of its lava. Strong volcanic tremor was interrupted by frequent sonic bursts.
Moderate to strong tremor continued on 24 April. At the main cone in the morning, Strombolian bursts every few seconds sent spatter fragments onto the cone's flanks. In the afternoon, the intense sonic bursts and Strombolian activity that had characterized the past few days were absent. A gray-black plume, laden with fine-grained (<1 mm) juvenile particles and volcanic gases, rose to heights approaching 1.5 km above the caldera floor. Lava in relatively low volumes continued to erupt from the NW base of the cone, moving horizontally from the cone into a tear-shaped cavity. Once the lava reached the surface, degassing occurred, at times intensely enough to drive low-level Strombolian activity. The amount of visible degassing rivaled the plume from the main vent. The depression and lava chute were 25-35 m long and 1-2 m wide. Lava moving at 1 m/s then spilled out of the chute and entered a channel, which was 3-5 m wide, with a speed of 6 m/minute. The flow in the chute and lava channel was initially pahoehoe, changing to aa with increasing distance. The new lava channel joined the former channel, now stagnant in its upper part, 500-700 m below the cone. This new channel caused the hydraulic head within the main cone to be lowered, resulting in decreased Strombolian activity.
By 25 April the lava extrusion rate slowed to ~250,000 m3/day, and tremor amplitude was somewhat diminished. Spatter generally was not visible within the cone and only rarely did isolated fragments clear its top. However, lava that had ponded in the aa channel advanced on the S side of the earlier large flow. This advance, which probably began late on 24 April, moved as much as 0.5 m/minute during the afternoon. Most of the new lobe was aa, with minor pahoehoe. The thermocouple temperature was 1,065°C (steady for several minutes) in the pahoehoe. At about 1500-1700 loud explosions at vents within the main cone increased in frequency, although spatter output did not change.
Activity in late April-early May. At the request of the Cape Verde government, the French Embassy in Praia and the Ministere de l' Environnement in Paris arranged for François Le Guern (CNRS) to observe the activity during 25-27 April. Incandescent scoria fountains rose 50 m over the crater 5-10 times/day followed by quiet periods. Sometimes explosions with black ash or transparent brown or blue haze lasted a few tens of minutes. Lava output was estimated to be 1 x 10⁶ m3/day on 26 April with a lava front 300 m long, decreasing by 10-15% on the following days. On 27 April lava advanced <0.5 m/hour.
From late April through 2 May a team from the International Federation of Red Cross and Red Crescent Societies reported that lava continued to flow from the crater, though at a much reduced rate, and had already covered 5 km2 of cultivated land including five houses and a winery that was a major source of income for the displaced. At that time the flow was contained inside the existing banks of lava. News reports indicated that after a period of non-explosive emissions and weak lava flow production, the eruption strengthened slightly on 7 May with greater lava output. On 8 May the United Nations coordinator in Praia reported decreased activity with some explosions and moderate to strong tremor. The lava emission rate was relatively low, coming from vents at the NW base of the cone.
Displaced persons and future plans. Apart from the destruction to outlying buildings, the villages themselves remained intact but largely deserted in early May. During the day there was regular foot traffic as people removed items of use to the camps, including livestock. The Red Cross of Cape Verde has volunteers in four camps containing 157 families. The camps are: Sao Filipe, population 534 (including 313 children); Patim, population 88 (53 children); Achada Furna, population 156 (90 children); and Mosteiros, population 90 (55 children). Adding the ~150 people living with friends and relatives, the total number of displaced person comes to 1,014. These numbers fluctuate as people return to the area and re-evacuate following felt earthquakes.
With emergency needs met, government officials believe that the focus should be on the resettlement of displaced persons. The United Nations DHA-Disaster Mitigation Branch was focusing on civil protection preparedness planning for future volcanic eruptions and other natural disasters.
On 10 May, at the request of the Cape Verde government, a team of four geologists and two students from the Universidade dos Açores went to Fogo to study the eruption. Their objectives are to monitor the progress of the eruption and to begin research related to gas release and the risks of contamination of public water supplies.
Information Contacts: R. Moore, U.S. Geological Survey, Mail Stop 903, Federal Center Box 25046, Denver, CO 80225 USA; Frank Trusdell, U.S. Geological Survey, Hawaiian Volcano Observatory, Hawaii National Park, HI 96718, USA; Veronica Carvalho Martins, U.S. Embassy, Rua Hoji Ya Henda 81, C.P. 201, Praia, Cape Verde; Arrigo Querido and Helena Tatiana Osorio, INGRH Servicos Estudos Hidrologicos, C.P. 367, Praia, Cape Verde; François LeGuern, CNRS Centre des Faibles Radioactivités, 91190 Gif-sur-Yvette, France; João Gaspar and Nicolau Wallenstein, Departamento Geociências, Universidad dos Açores, rue da Mae de Deus 58, 9500 Ponta Delgada, Açores, Portugal; Henry Gaudru, Christine Pittet, Patrick Barois, and Marc Sagot, Société Volcanologique Européenne (SVE), C.P. 1, 1211 Geneva 17, Switzerland; United Nations Department of Humanitarian Affairs, Palais des Nations, 1211 Geneva 10, Switzerland; International Federation of Red Cross and Red Crescent Societies, C.P. 372, 1211 Geneva 19, Switzerland.
Increased explosive activity; intense fumarolic emissions
Eruptive activity that began at Fogo on 2 April generated lava flows throughout the month (BGVN 20:03 and 20:04). Approximately 1,300 people evacuated from the Cha Caldera following fire fountaining from a fissure on the SW flank of the Pico cone. Lava flows covered the small settlement of Boca de Fonte (figure 3) by 9 April, and were ~500 m from Portela village a week later.
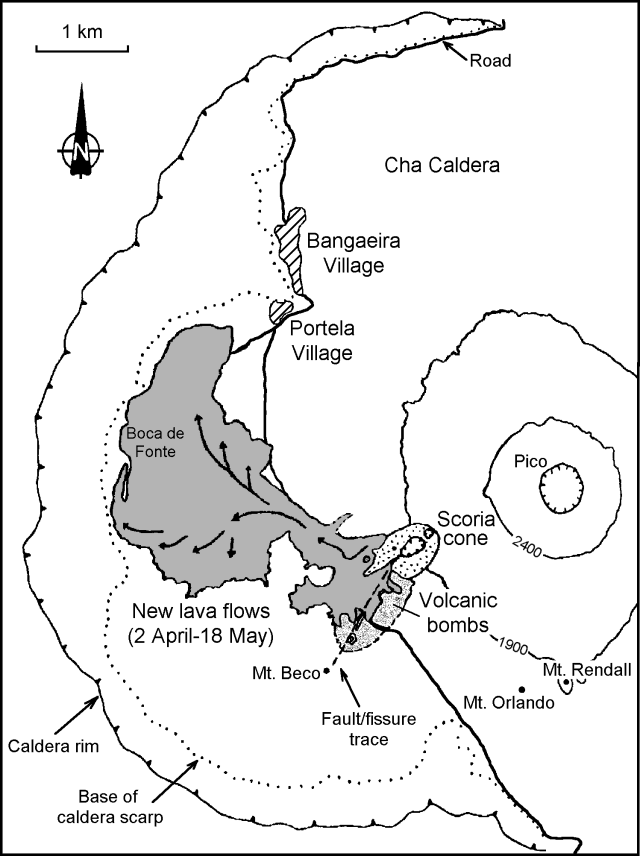 |
Figure 3. Map of Fogo (Cha Caldera) showing lava flows from the current eruption as of 18 May 1995. Courtesy of João Gaspar, Universidade dos Açores. |
Cape Verde scientists reported on 19 April that all of the flow-fronts had stopped, explosive activity had decreased, and emission of pyroclastic material was intermittent. By that time a small pit formed near the W flank of the scoria cone and sent pahoehoe lava W on top of the first aa flows. West of Monte Saia these new lava flows spread laterally and overrode the N and S margins of the earlier aa flows. On 10 May three more houses were covered by flows S of Boca de Fonte. Fumarolic activity from late April through early May remained intense along the main NE-SW fault. Inhalation of volcanic gases caused throat and eye irritations, headaches, and other complaints.
Following a request by the Cape Verde government, volcanologists from Azores University arrived at Fogo on 11 May to assess public health problems related to the eruption. Until 14 May pahoehoe and toothpaste lava flows continued advancing S of Boca de Fonte and towards Portela village, while gases rose continuously from the main vents. On 14 May at 1600 the activity increased and an ash cloud rose 500 m. Measurements made the next day at the end of a lava tube 2 km W of the main vent showed lava velocities of 2 m/minute. Ropy pahoehoe lavas formed at this stage. The lava flow-front 10 m away from the lava tube had a velocity of 2 m/hour. Starting at 1900, and continuing for at least 5 hours, explosions in the scoria cone crater ejected blocks to heights of 30 m; most fell near the crater rim.
Several profiles were made of the caldera on 16 May to evaluate CO2soil degassing using colorimetric tubes fixed in a 1-m-long probe. Values obtained 70 cm below the ground surface were always less than 2%. Ground temperatures changed from 67 to 115°C inside the SW craters where some explosions took place in the beginning of the eruption. Sulfur deposits could be observed in this section of the main fissure, but fumarolic activity was already very weak.
On the morning of 17 May dense clouds of gas and dust were released from the scoria cone while all the lava fronts appeared to be stationary. Through the afternoon explosive activity increased and strong explosions gave rise to discontinuous projections of spatter that reached 50 m high. Due to the explosions some large blocks of the crater wall collapsed and clouds of orange and red dust rose ~100 m. Streams of gases flowed down the SW slope of the scoria cone and reached the caldera wall on 18 May. People in the caldera felt nose and throat irritations more than 2 km from the main vents, making it impossible to approach without a gas mask. A strong sulfur smell was reported as far as Patim village, 8 km SW. On this day atmospheric samples were collected near the scoria cone. Chemical analysis of water from springs at Mosteiros (~9 km N) and wells in Sao Filipe (~15 km WSW) showed no contamination of the reservoirs by magmatic components.
Since the beginning of the eruption, lava flows have covered ~4.3 km2 of productive land, and preliminary data indicate an erupted volume of 22-35 x 106 m3. Boca de Fonte (population 56) was completely destroyed, and flow-fronts were 300 m from Portela as of 18 May. About 1,000 persons remain in shelters at Army camps in Sao Filipe, Patim, Achada Furna, and Mosteiros. During this eruption nobody was killed, but several needed medical assistance, mainly for respiratory problems due to inhalation of volcanic gas and dust.
Information Contacts: J.L. Gaspar, T. Ferreira, R. Coutinho, and G. Queiroz, Departamento Geociências, Universidad dos Açores, rue da Mae de Deus 58, 9500 Ponta Delgada, Açores, Portugal; A. Mota Gomes, Instituto Superior de Educação de Cabo Verde (ISE), Cape Verde.
Eruption of 2 April through 28 May covered over 6 square kilometers of land
The eruption that began on 2 April (BGVN 20:04 and 20:05) ended on or about 28 May, according to V. Martins. New lava flows covered ~6.3 km2 of land. The total volume of lava extruded was ~60-100 x 106 m3, assuming lava flow thicknesses of ~9-15 m; the known range was from 1 to >20 m. Based on six major-element XRF analyses, the lava flow erupted during the first night (3 April) was determined to be a differentiated kaersutite-bearing phonotephrite (IUGS system), whereas later lava flows and spatter were more primitive tephrite basanite.
Fogo Island consists of a single massive volcano with an 8-km-wide caldera breached to the E. The central cone was apparently almost continuously active from the time of Portuguese settlement in 1500 A.D. until around 1760. The June-August 1951 eruption from caldera vents S and NW of the central cone began with ejection of pyroclastic material.
Information Contacts: Richard Moore, U.S. Geological Survey, Mail Stop 903, Federal Center Box 25046, Denver, CO 80225 USA; Frank Trusdell, U.S. Geological Survey, Hawaiian Volcano Observatory, Hawaii National Park, HI 96718, USA; Veronica Carvalho Martins, U.S. Embassy, Rua Hoji Ya Henda 81, C.P. 201, Praia, Cape Verde; Arrigo Querido, INGRH Servicos Estudos Hidrologicos, C.P. 367, Praia, Cape Verde.
Eruption of 23 November 2014 and aftermath
This Bulletin report covers from June 1995 through February 2015. The interval's major volcanic event began on 23 November 2014 with the eruption of lavas. Fogo continued erupting through 8 February 2015, when the Observatório Vulcanológico de Cabo Verde (OVCV) stated that the eruption ceased. The last eruption ended in May 1995 (BGVN 20:11). There was limited information for the multi-year interval between that eruption and the one in 2014. The data for this report came from two key sources: OVCV (generally posted on their Facebook page) and Fogo News (numerous articles). Although the island of Fogo is ~25 km across and the greatest population density resides in coastal cities (red labels, figure 4), a small population also resides in the summit caldera where the venting took place. The spreading lava from the 2014 eruption covered ~4 km2 but did not escape the caldera. A pre-eruption satellite image (figure 5) labels villages within Fogo's summit caldera (Cha caldera). The intracaldera cone Pico (Pico do Fogo) is also the highest point on the island. The villages of Portela and Bangaeira sat 4-5 km NW of Pico and had a collective population of ~1,000 residents in 2009. Lavas overrode both these villages during the 2014 eruption and buried the main N-S road across the caldera. Later maps and images show various aspects of the intra-caldera lavas.
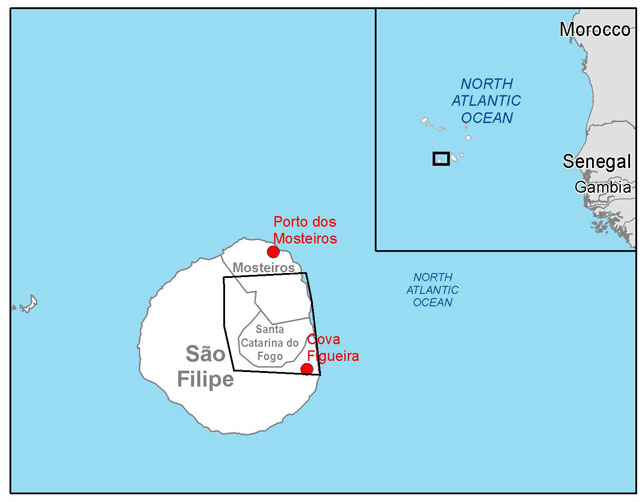 |
Figure 4. (Upper right) Index map showing Cape Verde islands with respect to the W edge of Africa and highlighting the island of Fogo (in black rectangle). (Below) Map of the island of Fogo showing some key towns and political subdivisions. Taken from Copernicus (2015). |
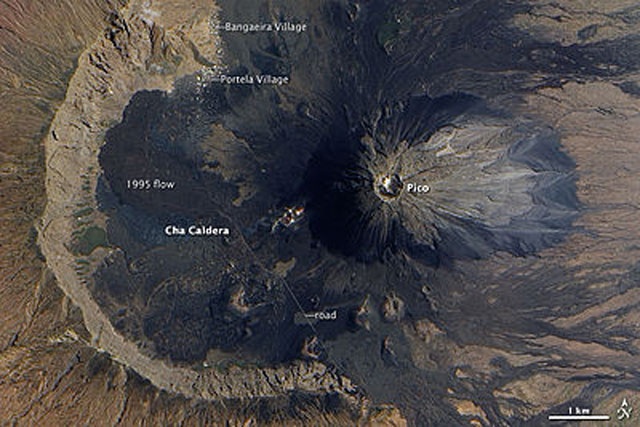 |
Figure 5. Image of Fogo's caldera captured by the Advanced Land Imager on NASA's EO-1 satellite on 10 June 2009. The summit area (Pico) is engulfed on the W by an 8-km-wide caldera (Cha caldera). The caldera's W crater wall, the headwall of a massive E-facing lateral-collapse structure, towers 1 km above the crater floor. At its base within the caldera lay the villages of Portela and Bangaeira, which were severely damaged if not destroyed by the 2014 eruption. Courtesy of NASA Earth Observatory-1 Team (NASA image created by Jesse Allen, using EO-1 ALI data provided by the NASA EO-1 Team; caption partially derived from information provided by Holli Riebeek). |
Overview on the 2014 eruption. The 23 November 2014 eruption started at 1000 local time (LT). In years prior to the eruption, the CO2 fluxes remained low and fairly stable. During the interval from 23 November 2009 to April 2014, background CO2 typically stayed well below 150 tons per day (t/d). During the March-November 2014 interval emissions increased to fluxes of ~327 t/d. Residents felt earthquakes the night before the eruption. Lava streamed from a fissure in the caldera on Pico's outer WSW flank. The initial fissure vent emerged in a location near to the vent of the 1995 eruption, though materials apparently began to vent at multiple points along the fissure. Most of the available photos showed strombolian and perhaps vulcanian activity that fed lava flows (figures 6 and 7), but news reports also indicated explosions, lava fountains, and ash emissions. An ash plume from the eruption was visible 90 km W, at the capital, Praia, on the neighboring island of Santiago (Farge, 2014). Orders were issued to evacuate the villages of Portela and Bangaeira (Caesar, 2014), and to evacuate the Parque Natural de Fogo, a large park covering much of the central part of the island (Fogo News).
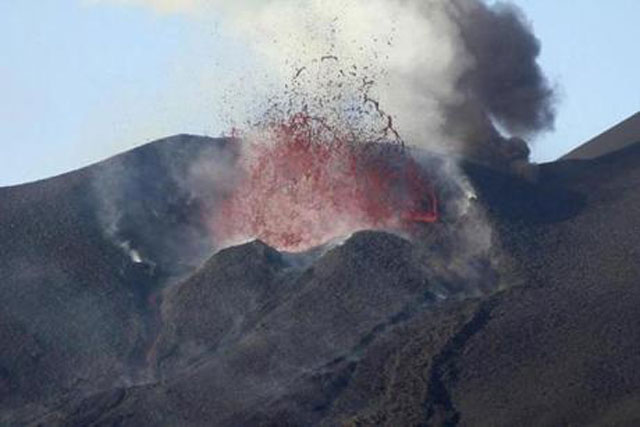 |
Figure 6. A press photo taken on 28 November 2014 illustrating strombolian activity with spatter emerging from the fissure vent. Note the edifice constructed around the fissure vent area, the lava flowing around this edifice, and the rising plume. Courtesy of Boston.com; photo by Saulo Montrond (Reuters). |
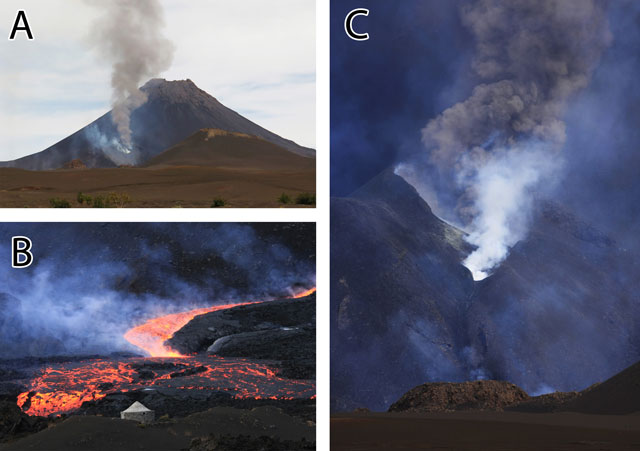 |
Figure 7. Mário Moreira, a geophysicist at the Instituto Superior de Engenharia de Lisboa, Portugal, provided photos illustrating aspects of the 2014 Fogo eruption. (A) The fissure at the base of the Pico cone releasing a thin plume at an unstated time. (B) As seen at 2000 LT on 5 December 2014, an advancing molten-surfaced lava flow. There is a building with peaked roof in the foreground of the photo, providing an aid to gauge the scale of the lava flow. (C) Several vents opened along the original fissure, which developed a crater-shaped morphology. Courtesy of Mário Moreira. |
On 24 November, according to the Toulouse Volcanic Ash Advisory Center (VAAC), a plume from Fogo mainly composed of sulfur dioxide extended over 220 km NW at ~9 km altitude. Lower altitude clouds contained ash.
An overview of the lava flow dispersal from the eruption is presented below, as a map with emplacement dates depicting the advancing flows (figure 8). The map was created on 25 December 2014, comparatively late in the eruption. The original map has been cropped to emphasize the lava flows, thus leaving Pico outside the area of view. At the scale of this map the summit would reside at the apex of the curving contours located along map's E margin (a spot off the map to the right and in the midst of the words "09 Dec.") The fissure vent resides in the spur of lava trending SW from the margin of Pico cone. The late stage advances seen in figure 8 (darkest red colors) roughly tripled the length of the W-trending lobe. A video on the Azores Volcanological & Geothermal Observatory website showed news footage of lava flows, which were steep-sided, rough-surfaced, and perhaps ~2-10 m high in some scenes.
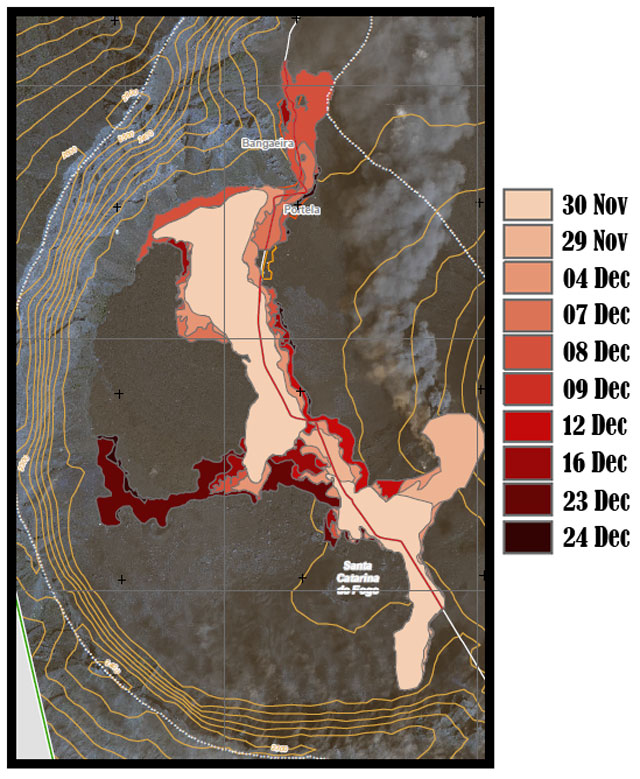 |
Figure 8. A map produced on 25 December 2015 that summarizes the emplacement chronology of the Fogo lava flows. The dates of the flow mapping range from 29 November 2014 to 24 December 2012 and are keyed by color. Dates in the legend reflect estimates made based on satellite imagery. The data was not validated with in situ observations. The N-S distance between the horizontal lines across the map are ~2.5 km. Cropped and with simplified legend after Copernicus (2015). |
That web page, and one called Culture Volcan presented an annotated still photo (figure 9) that highlighted the three lobes and the eruptive source. A key point is near the terminal end of the W lobe and the foot of the headwall, where there was a rural agricultural area with houses called Ilhéu de Losna. Culture Volcan noted damaged to farms and other infrastructure in that area. A photo not shown here showed an impressive pahoehoe lava flow that appeared to be crossing one of the farms.
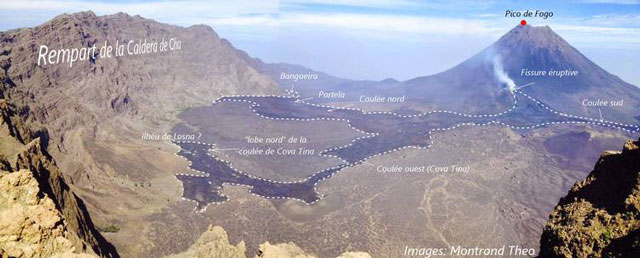 |
Figure 9. An annotated photo of the Cha caldera, with white dashes to accentuate flow margins, taken looking ~NNE along the curving headwall. Portela and Bangaeira appear in the distance. The photo was posted on 27 December 2014. The labels are in Portuguese and translate as follows: Cha caldera headwall or rampart ("Rempart de la Caldera de Cha"); N ("nord"); S ("sud"); W ("oust"); lava flow ("coulee"), eruptive fissure ("Fissure eruptive"). Photo credit to Montrond Theo (Involcan). Credit for editing and annotations to Culture Volcan. Posted as on the website of the Azores Volcanological & Geothermal Observatory. |
An OVCV report noted that the eruption ended 8 February 2015 (a total of 77 days); and some ash columns approached 6 km in altitude. They estimated some lava flows grew as thick as 18-20 m.
Silva and others (2015) discussed the 2014 eruption chronology and presented the most complete (though still preliminary) picture of lava flow advance rates. The eruption vented on the E flank of the "1995 Pico Novo vent with the appearance of four eruptive vents" discharging gases, pyroclastic rocks, and lava. The N-directed lobe of lava associated with the destruction of Portela village included both aa and pahoehoe types. These advanced with average speeds of 1-3 to 8-10 m/hour with some cases of up to 20 m/hour (~0.3 m/min). At the vent, an initial hawaiian stage of fissure eruptions gave way to a later strombolian stage. The vent's main crater grew by the coalescence of small craters; three small vents released aa lava flows. One or two lava tubes developed. The site emitted loud explosions and strong rumbling.
A pahoehoe lava flow developed along the far end of the W-directed lobe (in the Ilhéu de Losna region, figure 9). It advanced at an average speed of 0.5 m/min. The flow here buried vineyards, other crops, and houses.
Uni-CV (Universidade de Cabo Verde) also reported that during 30-31 December, a gas-and-ash plume extended to 700-800 m above the cone drifting N and tephra was ejected 30-40 m above the vent's cone. The lava front near Ilhéu de Losna (to the W of Pico do Fogo) had stopped, while the N-directed lava front near the N part of the villages continued to flow slowly over roads and buildings. Uni-CV noted that the temperatures of the lava fronts gradually decreased. According to Uni-CV (2015), during 1-11 January 2015, dense plumes rose to 400-1,500 m above the cone and tephra rose 200-400 m above the vent. During 8-12 January, explosions were followed by noises or bangs. On 12 January 2015, continuous explosions began at 0945, growing stronger, followed by eruptive pulses. A dense, dark plume rose 2 km in height and drifted E.
On 3 February 2015 OVCV scientists saw a bluish white discoloration of the air in the caldera, which they judged as the presence of ash. Explosions were heard 1 to 4 times per minute. The ash plume rose to 0.8-1.0 km above the vent area. Rock and spatter discharged. Beginning at 1310 on 6 February 2015 scientists heard explosions at a rate of 2 to 3 per minute. The observers saw eruptive columns of brownish color that consisted of gases, tephra, and spatter that rose to 400-600 m in height above the vent. During 1345 to 1545, explosions intensified, sending out larger pyroclasts, and eruptive columns achieved heights above the crater of 1.2-1.5 km. The clouds blew NE and formed dense ash clouds. Around 1700 there occurred intervals of lowered intensity lasting a few minutes. A more energetic episode took place at 1745 on the 6th.
The 9 March 2015 report on the Uni-CV website contained numerous photos and thermal infrared images from fieldwork during early to middle February 2014. The photos showed numerous views of near vent lavas highlighting both their varied surface textures (from highly fragmental to smooth) along with temperatures up to ~700°C (measured on the basis of emissivity, atmospheric attenuation, and various inputs and assumptions in the processessing in the FLIR-brand camera). A satellite view highlights the 2014 vent area and its location perhaps ten's of meters E of the 1995 vent. Both the 2014 and 1995 vents trended NE. Other field photos revealed elongate cones constructed around the 2014 fissure vents. The inner rims of those vent-engulfing cones were encrusted with sulfur.
OVCV reported that on 8 February the eruption at Fogo had ended. SO2 emissions were almost undetectable on 8 February and continued to remain so at least through 11 February. During that period, the lava front had not moved, and only minor fumarolic activity was present at the edge of the new crater. Lava flow temperatures had dropped.
News, human impacts, and photos revealing diverse lava flow morphology. According to Fogo News, by 25 November the lava flow, which was more than 4 km in length, had destroyed much of Portella, Bangaeira and the park headquarters. Furthermore, the local (Fogo island) airport closed. Lava destroyed utility poles, hindering communications. Fogo News added that the Cape Verde government responded to the situation by creating a crisis cabinet.
On 30 November, the eruption, although quieter for a few days, resumed at dawn, according to Agencia Lusa (2014). Lava also closed the only alternative route between the Parque Natural de Fogo and the village of Portela. Travelling at ~20 m per hour, the flow destroyed dozens of homes, a large area of agricultural land, and the museum of the Parque.
A Fogo News story noted that by 2 December, the lava flow passing through Portela had destroyed the primary school, the Pedra Brabo hotel, and several additional houses. After 24 hours of remaining stagnant, the flow began again on 2 December, reportedly moving at ~9 m per hour. Furthermore, ashfall over pastures affected local livestock, especially goats. Ash emissions caused the cancellation of some flights from the island. The news also mentioned that on 6 December the lava flow rate had increased. By 8 December, the article said that about 90% of Bangaeira and 95% of Portela had been overtaken by the lava flow. After moving through the towns, the lava-flow front was ~300 m wide.
Based on a Fogo News article, Fogo volcanism decreased on 9 December. The lava flow stopped ~3.5 km from the settlement of Fernão Gomes (~5 km directly N of Pico do Fogo and just short of a steep downward slope to the towns of Cutelo Alto and Fonsaco, on the NE coast of Fogo). Gas and ash emissions also decreased and were mostly absent by 14 December. Even though the fissure vent's output was apparently low, the remaining buildings in the town of Bangaeira were overtaken by lava.
Fogo News noted that by 10 December volcanic ash had contaminated many water sources and ash had reached N of Sao Felipe on the W coast of Fogo, ~17 km SW of Pico do Fogo. As a result, the government flew in bottles of potable water.
The lava flow morphology as well as the societal impact is revealed below through a tiny sampling of available photos. The BBC (2014), and many news outlets prepared galleries on the Fogo eruption. Martin Rietze (2014) and Richard Roscoe documented portions of the eruption. Chrys Chrystello (2014) uploaded two videos to Youtube. The first one, posted on 24 November 2014, depicts plumes released from fissures and people evacuating their homes. The second one, posted on 26 November, showed evacuation, the movement of the lava flow across the caldera, and activity at night. Not depicted here are several photos and videos posted by OVCV (on its Facebook page).
Figure 10 shows three press photos posted online on 2 December. According to the captions, Portela village residents sat in the foreground, meaning that they watched as the lava flow advanced over their community. They also tried to salvage materials from the destroyed infrastructure.
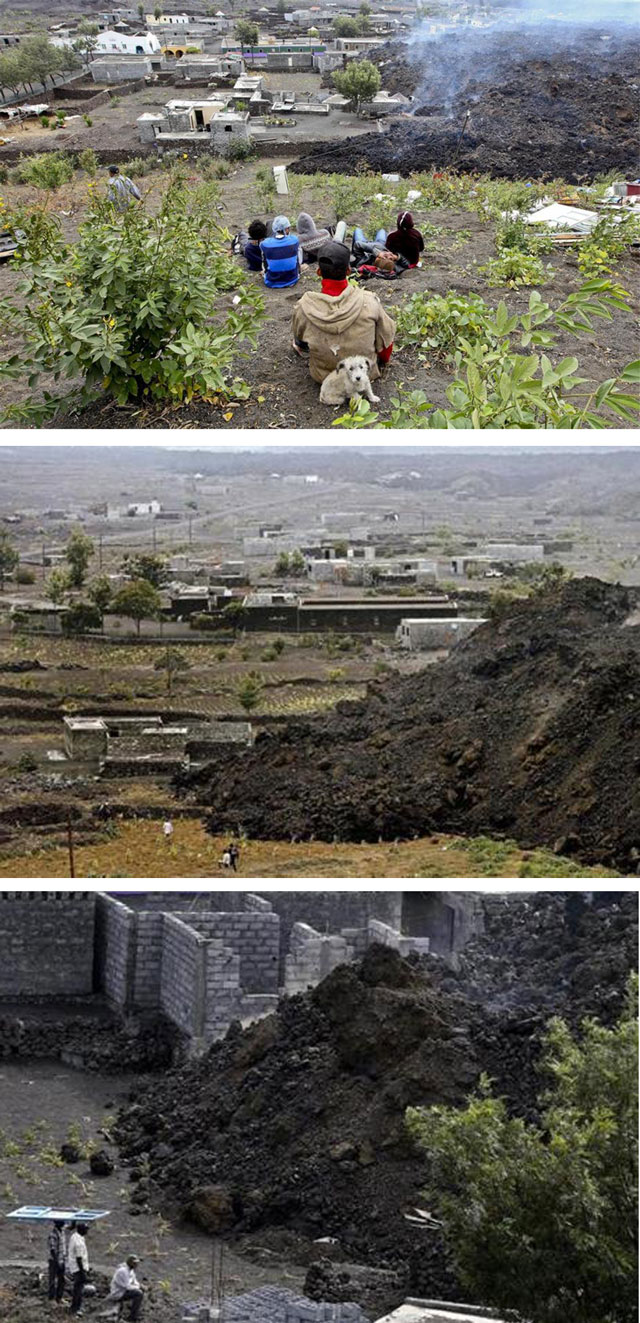 |
Figure 10. Three press photos relating to the human dimensions of the Fogo eruption. The buildings, about to be destroyed, also give a sense of the size and scope of the hackly surfaced lavas. The three photos were undated, but were posted online on 2 December 2014. Courtesy of Boston.com. Photo credit (all photos) to Joao Relvas/EPA. |
Judging from the photos in figure 10, the thicker areas of lava stood higher than single story buildings. In these photos the encroaching lava front and the flow tops both appear strongly fragmental in nature, composed of blocks of diverse sizes. The lower photo in figure 10 suggests that the depicted flow front had angles of repose up to on the order of ~45 degrees. In the various photos of figure 10, the molten component of the lava flow, is not clearly apparent on the flow's exposed surface or sprouting out of the fragmental flow.
Figure 11, by contrast, depicts a compact lava flow that is clearly composed of a comparatively thin body that came right through the wall and large door in this building. The flow surface, in this case, is nearly devoid of fragmental material and the comparatively smooth upper surfaces contrast with those in the lava flows seen in figure 10. The article also noted a lack of injuries or deaths from the eruption, despite the obvious catastrophic destruction
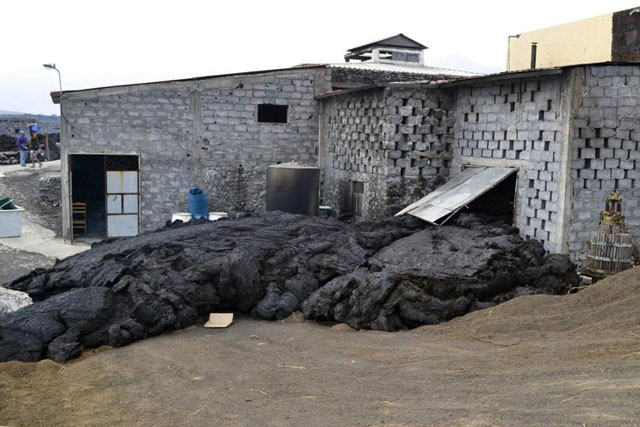 |
Figure 11. A photo from the Fogo eruption. Smith (2014) stated that, "Lava began to ravage the only building left standing in the village of Portela on the island of Fogo, Cape Verde." Photo credit: Nicolau Centeio/EPA. |
Although, there were no fatalities, 1,076 people were displaced by the 2014 eruption. Map Action (2014), a UK-based charity, issued a map of the Fogo refugee situation (figure 12). They said that, by 11 December, the lava had covered a few square kilometers and that there were three Internally Displaced Person (IDP) shelters existing in areas well outside the caldera.
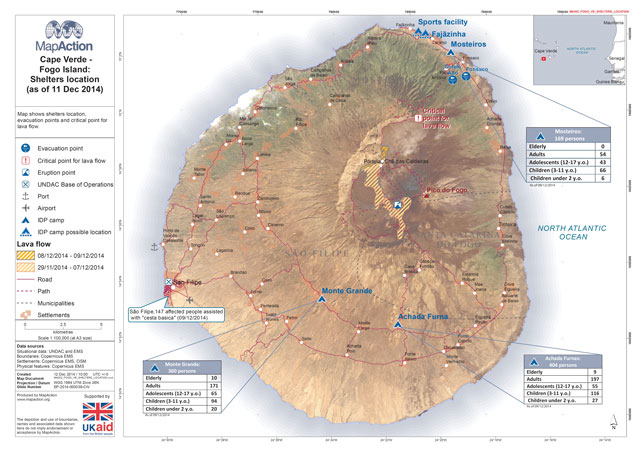 |
Figure 12. Map stating conditions as of 11 December 2014. By this point, Portela and Bangaeira had both been invaded by the lava flows. The vent producing the lava is the blue square in the center; the Pico cone's summit area is shown as a red triangle. The lava flow during 29 November to 7 December (light orange slashed region) reached ~5 km in length. During 8-9 December, an area of new lava flows stretched another ~1 km in length (darker orange slashed region). There were three official IDP shelters (blue tents): Mosteiros (169 inhabitants), Achada das Furnas (404 inhabitants), and Monte Grande (360 inhabitants). Source: Map Action (2014). |
In an assessment report that was released on 16 December 2014, Relief Web said that: "A volcan[ic] eruption [on] Fogo Island, in Cabo [Cape] Verde, began on 23 November and continues as of 16 December 2014. The eruption has had direct impact on the people living in Chã das Caldeiras, the volcano crater area. 1076 people have been evacuated from the area, of which 929 have been relocated in temporary accommodation [centers] and in houses built in the aftermath of the 1995 eruption, while the remaining are sheltered in host families' homes. The affected people are a predominantly rural community, whose subsistence largely depends on agriculture and livestock. As of 16 December, national authorities report that lava has destroyed over 230 buildings, including the national park headquarters, wine and jam production facilities, a primary school, a hotel, churches, 100% of Portela and Bangaeira infrastructure, as well as more than 429 hectares [4.29 km2] of land, of which 120 hectares [1.2 km2] were agricultural land, resulting in great material and economic loss for the affected people and leaving many without a source of income."
During March 2015 online news sources showed residents in the process of road construction and building excavation.
Technical data. The average daily value of carbon dioxide fluxes at Fogo from 23 November 2009 through 2014 was compiled by four groups (figure 13). The fluxes steadily increased during the interval. Values were typically well below 150 tons per day (t/d) and had a long-term trend near 117 t/d. In March 2014, fluxes increased to 327 metric tons per day (t/d). The CO2 fluxes wavered and reached a high of ~350 t/d by a few days before the eruption. According to OVCV, the increase in CO2 suggested that pressure in Fogo's volcanic hydrothermal system had escalated, and that an eruption would soon occur.
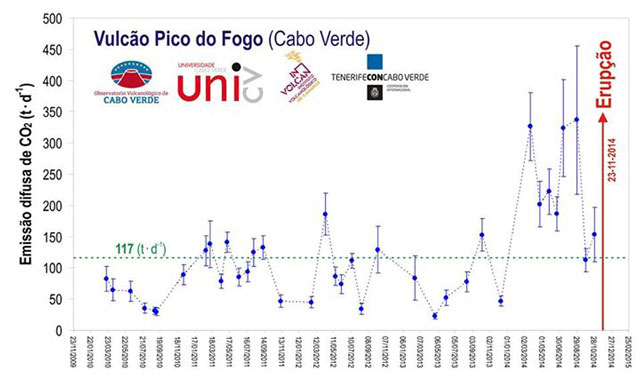 |
Figure 13. Diffuse CO2 fluxes at Fogo in metric tons per day (t/d) from 23 November 2009 to 23 November 2014. The red arrow depicts the date of the eruption ("Erupção"), 23 November 2014. The computation of the blue errors bars and the measurement techniques were unspecified (although similar measurements for late November behavior noted below stemmed from mini-DOAS measurements). Courtesy of OVCV, Uni-CV, Instituto Volcanológico de Canarias (INVOLCAN), and Tenerife con Cabo Verde (joint between Tenerife, Canary Islands and Cape Verde). |
Soil-gas radon measurements were taken during 20-21 April 2013 by project MAKAVOL (which is run jointly by the government of Tenerife, Canary Islands and the University of Cape Verde [Uni-CV]). According to the first measurements from the geochemical station FOGO-1 in Cha caldera, the soil-gas radon (222Rn) emissions were in the range of 20-160 Bq/m3, only slightly more than the natural amount in the atmosphere (~37 Bq/m3). Bulletin editors found few if any additional radon measurements leading up to the 2014 eruption.
Between 23 November 2014 through 10 January 2015, INVOLCAN (2015) published a chart showing the weekly average of daily SO2 fluxes from Fogo (figure 14). A substantial atmospheric SO2 increase from 23 November through the first week of December 2014 was also depicted on OMI satellite imagery (see separate section below), when SO2 fluxes reached a peak of ~25 kilotons (kt). The Uni-CV (2015) also reported in situ measurements of SO2 levels; they fluctuated between 869 and 2430 t/d, during 30-31 December 2014 and 1-2 January 2015.
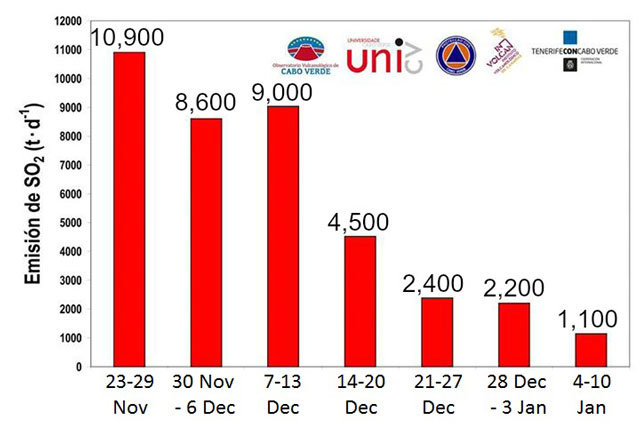 |
Figure 14. Weekly average of daily SO2 emissions ("Emisión de SO2") from Fogo, based on optical remote sensing technology (mini-DOAS). The SO2 peaked at 10,900 t/d during the eruption's first week (23-29 November). Courtesy of INVOLCAN (2015), with minor revisions by Bulletin editors. |
The mini-DOAS optical remote sensing in figure 14 was also used in late November to measure the gas content of plumes, according to the OVCV. Their measurements indicated the eruption around this time released 12,000 t/d of SO2, 23,000 t/d of H2O, and 10,000 t/d of CO2 . On 30 November, the molar ratios of CO2:SO2 and H2O:SO2 were 1:5 and 8:5, respectively. According to Hernández and others (2015), other molar ratios were CO2:H2O = 0.3 and SO2:H2S = 7.5. (For more details on pre-eruption gas emissions, see Dionis and others (2015).)
According to a report by Uni-CV discussing the 8-11 February 2015 interval, their data on sulfur dioxide (SO2) monitoring were provided for civil protection, to help improve crisis management. They requested that their data not be reproduced except for reporting by the team involved in the data collection (INVOLCAN / ITER and Uni-CV). That said, we provide a brief summary and cite a few broad comments. SO2 fluxes emerging from the vent dropped to near zero during 8-11 February, one factor in determining the end of the eruption the 8th. Those low fluxes were measured by vehicle-mounted mini-DOAS insturments. From 28 November the team, with interagency support, conducted 366 measurements. One or more field trips to the vent area described conditions there during early and middle February.
According to the Uni-CV report issued 9 March 2015, during 25 January to 1 February 2015 the SO2 flux decreased. Shortly after that the fluxes rose somewhat (to several hundred tons per day
After 7 February 2015, temperatures in the vent area of both the fumaroles and at the base of the cone had decreased significantly (table 1). The temperature difference at the two distances are a well known effect associated with absorption of infrared energy as it passes through the atmosphere.
Table 1. The temperatures of the cone base and the fumaroles from 7 to 9 February 2015. Courtesy of Uni-CV (2015).
| Date | Sensors | Temperature at cone's base (°C) | Temperature of fumarole (°C) |
| 07 Feb 2015 | ~2 km away | 288 | 144 |
| 08 Feb 2015 | ~2 km away | 92 | 138 |
| 09 Feb 2015 | ~2 km away | 89 | 136 |
| 07 Feb 2015 | ~1 km away | 309 | 175 |
| 08 Feb 2015 | ~1 km away | 138 | 165 |
| 09 Feb 2015 | ~1 km away | 132 | 169 |
MODVOLC. MODIS thermal infrared sensors, aboard the Aqua and Terra satellites and processed by the MODVOLC algorithm, found hotspots infrequently at Fogo between 2001 and mid-2014; these hotspots were on the N flanks of Fogo, and thus were probably not associated with volcanic activity. On 23 November 2014, the number of hotspots increased dramatically. Hotspots were recorded daily, and many had a large number of pixels (for example, 19 pixels from the Aqua satellite on 25 November 2014). By the end of December 2014, the number of hotspots declined. During January 2015, hotspots were recorded on a total of 11 days. Only one hotspot was observed in February (7 February), and none in March.
Satellite-based SO2 emissions. Based on the OMI satellite, the 23 November eruption caused a substantial atmospheric SO2 mass increase through the first week of December 2014 (figure 15). Total SO2 mass reached a peak of ~25 kilotons.
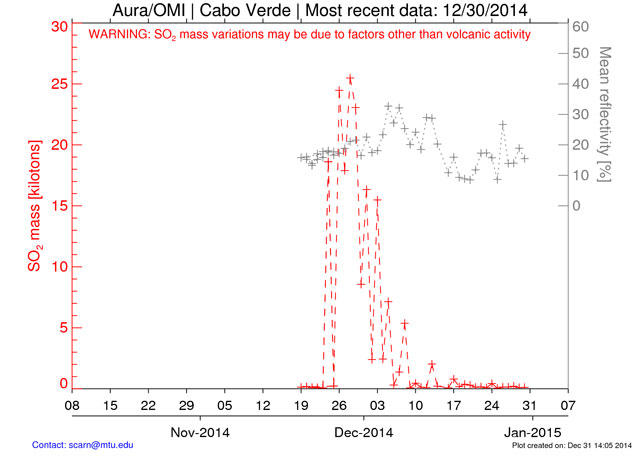 |
Figure 15. Preliminary OMI satellite data on daily total SO2 masses in the atmosphere between 8 November 2014 and 31 December 2014. According to the chart, the SO2 peaked between 26 November and 3 December at ~25 kt. These automated measurements could have been overestimated or underestimated based on factors such as cloud cover, row anomalies, and the altitude of the plume. Courtesy of Simon Carn and the NASA MEASURES website. |
References. Agência Lusa, 2014, Erupções vulcânicas da ilha do Fogo evoluem para "estado crítico", 30 November 2014, Observador (URL: http://observador.pt/2014/11/30/erupcoes-vulcanicas-da-ilha-fogo-evoluem-para-estado-critico/) [accessed in March 2015]
BBC, 2014, In pictures: Pico do Fogo volcano in Cape Verde erupts, 2 December 2014, British Broadcasting Company (URL: http://www.bbc.com/news/world-africa-30291041) [accessed in March 2015]
Caesar, Chris, 2014, Cape Verde Evacuations Are Underway Following Volcano Eruption, 23 November 2014, Boston.com (URL: http://www.boston.com/news/local/massachusetts/2014/11/23/cape-verde-evacuations-are-underway-following-volcano-eruption/MqqLEMCSab9qYGqlw1F5qL/story.html) [accessed in March 2015]
Chrystello, Chrys, 2014, YouTube (URL: https://www.youtube.com/user/chryschrystello/) [accessed in March 2015]
Copernicus, 2015, Fogo Island-Cape Verde, Volcanic eruption 23 November 2014 (23/11/2014) [Grading map, detail 01, Monit 12, Activation ID, EMSR-111, Product number 01FogoIsland, v1.]. Copernicus, (URL: emergency.copernicus.eu/mapping/)
Dionis, SM; Melián, G; Rodríguez, F; Hernández, PA; Padrón, E; Pérez, NM; Barrancos, J; Padilla, G; Sumino, H; Fernandes, P; Bandomo, Z; Silva, S; Pereira, J; Semedo, H, 2015, Diffuse volcanic gas emission and thermal energy release from the summit crater of Pico do Fogo, Cape Verde, 27 January 2015, Bulletin of Volcanology (URL: http://link.springer.com/article/10.1007/s00445-014-0897-4) [accessed in April 2015]
Farge, Emma, 2014, Cape Verde orders evacuation after Fogo volcano erupts, 23 November 2014, Reuters (URL: http://www.reuters.com/article/2014/11/23/us-caboverde-volcano-idUSKCN0J70SN20141123) [accessed in March 2015]
Hernández, PA; Melián, G; Dionis, SM; Barrancos, J; Padilla, G; Padrón, E; Silva, S; Fernandes, P; Cardoso, N; Pérez, NM; Rodríguez, F; Asensio-Ramos, M; Calvo, D; Semedo, H; Alfama, V, 2015, Chemical composition of volcanic gases emitted during the 2014-15 Fogo eruption, Cape Verde, EGU General Assembly 2015 (URL: http://meetingorganizer.copernicus.org/EGU2015/EGU2015-9577.pdf) [accessed in April 2015]
INVOLCAN, 2015, Nota de Prensa: Científicos del INVOLCAN continúan en Cabo Verde colaborando en el seguimiento de la erupción de Fogo, 11 January 2015 (URL: http://www.involcan.org/wp-content/uploads/2015/02/11_01_2015_Nota-de-prensa.pdf) [accessed in April 2015]
Lusa, 2014, Erupção na ilha cabo-verdiana do Fogo era "previsível", 23 November 2014, Diário de Notícias (URL: http://www.dn.pt/inicio/globo/interior.aspx?content_id=4256685) [accessed in March 2015]
Map Action, 2014, Cape Verde - Fogo Island: Shelters location (as of 11 Dec 2014), 16 December 2014 (URL: http://mapaction.org/map-catalogue/mapdetail/3671.html) [accessed in March 2015]
Rietze, Martin, 2014, Youtube, (URL: https://www.youtube.com/channel/UC5LzAA_nyNWEUfpcUFOCpJw) [accessed in March 2015]
Roscoe, Richard, 2015, Fogo Volcano, Photovolcanica (URL: http://photovolcanica.com/VolcanoInfo/Fogo/Fogo.html, https://www.youtube.com/user/Photovolcanica) [accessed in March 2015]
Silva, S, Cardoso, N., Alfama, V., Cabral, J., Semedo, H., Pérez, NM, Dionis, S, Hernández, PA, Barrancos, J, Melián, GV, Pereira, JM, and Rodríguez, F., 2015, Chronology of the 2014 volcanic eruption on the island of Fogo, Cape Verde; Geophysical Research Abstracts, Vol. 17, EGU 2015-13378 (Poster), 2015 EGU General Assembly 2015
Smith, Jennifer, 2014, Local Cape Verdeans join to support volcano victims--'Catastrophic' destruction by volcano spurs those in Mass. to help victims, The Boston Globe (URL: www.bostonglobe.com)
Uni-CV, 2015, Fórum para reconstrução da ilha do Fogo, Universidade de Cabo Verde (URL: http://www.unicv.edu.cv/index.php/arquivo-destaque/4038-2-dia-da-erupcao-equipa-da-uni-cv-faz-relatorio-do-desenvolver-da-erupcao) [accessed in March 2015]
Information Contacts: Observatório Vulcanológico de Cabo Verde (OVCV), Departamento de Ciência e Tecnologia, Universidade de Cabo Verde (Uni-CV), Campus de Palmarejo, Praia, Cape Verde (URL: https://www.facebook.com/pages/Observatorio-Vulcanologico-de-Cabo-Verde-OVCV/175875102444250); Universidade de Cabo Verde (Uni-CV), Av. Santo Antao, Praia, Cape Verde (URL: http://www.unicv.edu.cv/); Copernicus (The European Earth Observation Programme) (URL: http://emergency.copernicus.eu/); Cabildo Insular de Tenerife, Plaza de España, 1, 38003 Santa Cruz de Tenerife, Spain (URL: http://www.tenerife.es/); Instituto Volcanológico de Canarias (INVOLCAN), Parque Taoro, 22 38400, Puerto de la Cruz, Tenerife, Spain (URL: http://www.involcan.org/); Toulouse Volcanic Ash Advisory Centre (VAAC) (URL: http://www.meteo.fr/vaac/); Montrand Theo (URL: https://www.facebook.com/montrond.theo); Volcanological and Geothermal Observatory of the Azores, Ladeira da Mãe de Deus, 9501-855 Ponta Delgada, Portugal (URL: http://www.uac.pt/); Culture Volcan (URL: http://laculturevolcan.blogspot.com/2014/12/leruption-du-volcan-fogo-pourrait-etre.html); Mário Moreira, Instituto Superior de Engenharia de Lisboa, Portugal; Hawai’i Institute of Geophysics and Planetology (HIGP), MODVOLC alerts team, University of Hawai’i at Manoa, 1680 East-West Road, Post 602, Honolulu, HI 96822, USA (URL: http://modis.higp.hawaii.edu/); NASA MEASURES, Goddard Space Flight Center (URL: https://so2.gsfc.nasa.gov/); and Simon Carn, Department of Geological and Mining Engineering and Sciences, Michigan Technological University, Houghton, MI 49931 USA (URL: https://so2.gsfc.nasa.gov/); Fogo News (URL: http://www.fogonews.com/); and Boston.com (URL: http://www.bostonglobe.com/).
November 2014-February 2015 eruption destroys two villages, lava displaces over 1000 people
The 25-km-wide island of Fogo in the Cape Verde Islands, 750 km W of Dakar, Senegal, is a single massive stratovolcano with a 9-km-wide summit caldera (Cha Caldera) that is breached to the east. A steep-sided central cone, Pico, rises more than a kilometer above the caldera floor, and is capped by a 500-m-wide, 150-m-deep summit crater; it was apparently almost continuously active from the time of Portuguese settlement in 1500 CE until around 1760. Several lava flows that erupted during the eighteenth and nineteenth centuries reached the eastern coast below the breached caldera rim (BGVN 20:03, figure 1). Lava flows in 1951 and 1995 were contained within the W half of the Cha Caldera, as were the flows from the November 2014-February 2015 eruption (figure 16) described below. Information for this report comes from the Toulouse Volcanic Ash Advisory Center (VAAC), the Observatório Vulcanológico de Cabo Verde (OVCV), and satellite and news data from several sources.
|
Figure 16. The Advanced Land Imager (ALI) on the Earth-Observing 1 (EO-1) satellite captured this image on 24 December 2014 of the eruption at Fogo that began on 23 November 2014. The top image offers a broad view of the island's most distinctive feature: Cha Caldera. The nine-kilometer wide caldera has a western wall that towers a kilometer above the crater floor. The eastern half of the crater wall is gone, erased by an ancient collapse. The lower image shows a more detailed view of the caldera. The volcanic plume streams from a fissure at the SW base of Pico de Fogo, the island's highest point. Both of the villages destroyed by the eruption, Portela and Bangaeira, were located within the caldera. In late November, lava poured into Portela; by 8 December it had entered Bangaeira. The volcanic plume obscures the remains of the two villages, but the white roofs of a few structures are visible on the upper left side of the image. In addition to the north flow that affected the villages, the 2014 eruption also produced flows that moved S and W. Courtesy of NASA Earth Observatory. |
The April-May 1995 eruption produced lava flows from a vent at the SW base of the Pico cone (BGVN 20:05, figure 3) that flowed SW and NW from the vent. They cut off the main access road to the larger villages of Portela and Bangaeira along the NW side of the caldera, but the approximately 1,300 residents from the various communities within the caldera were all safely evacuated, and the villages were spared. Effusive activity produced Strombolian fountains, pyroclastic material, ash plumes, and both pahoehoe and aa lava flows. The lava flows destroyed the small settlement of Boca de Fonte (population 56) near the caldera wall about 2 km W of the eruption center, and reached to within 300 m of Portela village. By the time it was over at the end of May 1995, new lava flows covered about 6.3 km2 of land, and ranged from one to over twenty meters thick.
The most recent eruption at Fogo began with lava flows emerging from a similar fissure vent at the base of Pico on 23 November 2014 (figure 17), and continued through 8 February 2015 according to OVCV; the flows covered about 4 km2 of land. The villages of Portela and Bangaeira, located 4-5 km NW of Pico with a combined population of about 1,000 residents, were not spared during the 2014-15 eruption as they had been in 1995; both villages were largely destroyed (figure 18), although their inhabitants were safely rescued. The eruption began from a fissure near the 1995 vent, but it soon emerged from multiple vents along the fissure with Strombolian activity (figure 19), explosions, lava fountains, and ash emissions.
|
Figure 17. Lava and gas emerge from a fissure at Fogo on 24 November 2014, one day after the eruption began in this satellite image used by Google Earth. The fissure is located at the SW base of Pico, the cone within the Cha Caldera. Image copyright by DigitalGlobe, courtesy of Google Earth. |
|
Figure 18. The villages of Portela and Bangaeira were destroyed by the lava flows at Fogo during late November 2014-February 2015. This image of a home in Portela trapped in a lava flow was taken between 30 November and 3 December 2014. Photo copyright by Martin Rietze, used with permission. |
|
Figure 19. Strombolian activity at dawn on 30 November 2014 from multiple fissure vents at Fogo. Copyright by Martin Rietze, used with permission. |
The lava flows consisted of three primary lobes that traveled NNW, S, and W (BGVN 39:11, figure 8). During the earliest days of the eruption in late November, lava flowed to the NNW destroying much of Portela (figure 20 and 21) and to the S from the main fissure. The flow to the S ceased after 30 November.
|
Figure 20. Lava advances NNW on the community of Portela at Fogo sometime during 30 November-3 December 2014. Photo copyright by Martin Rietze, used with permission. |
|
Figure 21. A lava flow consumes a house in the village of Portela at Fogo on 30 November 2014. Copyright by Martin Rietze, used with permission. |
The main flows continued NNW into the first week of December; they destroyed the remaining structures in Portela and caused extensive damage in Bangaeira and at the Parque Natural de Fogo headquarters (figures 22 and 23). A third lobe flowed to the W of the fissure during the second half of December, reaching the base of the 1-km-high caldera rim where it damaged farms and infrastructure in the small village of Ilhéu de Losna (see figure 16). The lava had ceased advancing by early January.
|
Figure 22. Lava flow on 1 December 2014 at Fogo emerges from a fissure vent. Photo copyright by Martin Rietze, used with permission. |
|
Figure 23. Advancing lava flow with blocky (aa) texture at Fogo during 30 November-3 December 2014. Photo copyright by Martin Rietze, used with permission. |
The MODVOLC thermal alert system issued eight thermal alerts from the lava flows (figure 24) on 23 November 2014. Tens of alerts were reported almost daily through 19 December, with a peak of 46 alerts on 30 November. For the rest of December, as many as 10 alerts a day were recorded. By January 2015, they became more intermittent, with no more than three alerts issued in any day, and they occurred on only 11 days of the month. The final two thermal alerts were recorded on 7 February 2015.
|
Figure 24. A cascade of lava flows from a fissure vent at Fogo during 30 November-3 December 2014. Photo copyright by Martin Rietze, used with permission. |
Ash emissions from the fissure vents were intermittent throughout the eruption (figures 25). The first major plume on 24 November 2014 was reported by the Toulouse VAAC as consisting largely of SO2, with very little ash. It rose to 9.1 km altitude, drifted 220 km NW, and caused minor ashfall on the flanks of the volcano. After the initial plume of mostly SO2, ash emissions from the vent were generally below 3.9 km altitude and limited to the immediate area of the island (figure 26).
|
Figure 25. Residents flee with their belongings as ash emissions and lava flows emerge from multiple vents on the SW flank of Pico cone at Fogo during the last week of November 2014. Photo by Joao Relvas/Lusa, courtesy of The Observador, published on 30 November 2014. |
|
Figure 26. Ash explosion and incandescent material erupted from a fissure vent during 30 November-3 December 2014. Photo copyright by Martin Rietze, used with permission. |
Ash was reported rising to 2 km above the summit (4.8 km altitude) on 2 December (figure 27), and ashfall was reported near San Felipe (17 km SW). Ash and SO2 emissions decreased in mid-December; the next plume was reported on 21 December rising 800 m above the summit. Additional plumes during 30 December-2 January rose 400-900 m above the cone and occasionally sent tephra up to 40 m away. Several explosions of gas-and-ash plumes during 8-12 January produced plumes that rose up to 2 km above the summit and drifted E or SE. The largest plume, on 12 January, was very dense and dark-gray, it rose 2 km and drifted E; tephra was also ejected 50 m above the crater and was observed by people in San Felipe and other parts of the island.
|
Figure 27. Ash emission on 2 December 2014 from the fissure vent at Fogo. The plume was reported at 2 km above the summit of Pico. Photograph copyright by Martin Rietze, used with permission. |
Satellite data on SO2 flux from Fogo corroborated the VAAC reports of the high SO2 content in the emissions, especially during the first two weeks of the eruption when Dobson Unit (DU) values greater than 2 were recorded several times, and the plume areas covered several hundred thousand square kilometers (figure 28).
|
Figure 28. Sulfur dioxide plumes measured with the Aura Instrument on the OMI satellite show substantial amounts of SO2 released from Fogo during the eruption of November 2014-February 2015. Top Left: The SO2 plume captured on 24 November covered over 325,000 km2 and registered over 40 Dobson Units (DU), a measure of the molecular density of SO2 in the atmosphere; Top Right: the plume on 26 November covered almost 700,000 km2 and drifted N and E; Lower Left: on 1 December the 590,000 km2 plume drifted in multiple directions from the vent; Lower Right: on 3 December the large plume drifted NE and registered at almost 20 DU. Courtesy of NASA Goddard Space Flight Center. |
Information Contacts: Toulouse Volcanic Ash Advisory Center (VAAC), Météo-France, 42 Avenue Gaspard Coriolis, F-31057 Toulouse cedex, France (URL: http://www.meteo.fr/vaac/); Observatório Vulcanológico de Cabo Verde (OVCV), Departamento de Ciência e Tecnologia, Universidade de Cabo Verde (Uni-CV), Campus de Palmarejo, Praia, Cape Verde (URL: https://www.facebook.com/pages/Observatorio-Vulcanologico-de-Cabo-Verde-OVCV/175875102444250); Hawai'i Institute of Geophysics and Planetology (HIGP), MODVOLC Thermal Alerts System, School of Ocean and Earth Science and Technology (SOEST), Univ. of Hawai'i, 2525 Correa Road, Honolulu, HI 96822, USA (URL: http://modis.higp.hawaii.edu/); NASA Earth Observatory, EOS Project Science Office, NASA Goddard Space Flight Center, Goddard, Maryland, USA (URL: http://earthobservatory.nasa.gov/); NASA Goddard Space Flight Center (NASA/GSFC), Global Sulfur Dioxide Monitoring Page, Atmospheric Chemistry and Dynamics Laboratory, 8800 Greenbelt Road, Goddard, Maryland, USA (URL: https://so2.gsfc.nasa.gov/); Google Earth (URL: https://www.google.com/earth/); The Observador (URL: http://observador.pt/2014/11/30/erupcoes-vulcanicas-da-ilha-fogo-evoluem-para-estado-critico/); Martin Rietze, Photographer (URL: http://www.mrietze.com/web13/Fogo_f14.htm).
This compilation of synonyms and subsidiary features may not be comprehensive. Features are organized into four major categories: Cones, Craters, Domes, and Thermal Features. Synonyms of features appear indented below the primary name. In some cases additional feature type, elevation, or location details are provided.
Synonyms |
||||
| Vulcao | Grande, Pico | ||||
Cones |
||||
| Feature Name | Feature Type | Elevation | Latitude | Longitude |
| Armarelo, Monte | Cone | |||
| Orlando, Mount | Cone | |||
| Pico | Cone | 2829 m | 14° 57' 0" N | 24° 21' 0" W |
| Rendall, Mount | Cone | |||
Craters |
||||
| Feature Name | Feature Type | Elevation | Latitude | Longitude |
| Cha | Caldera | |||
|
|
||||||||||||||||||||||||
There is data available for 12 confirmed Holocene eruptive periods.
2014 Nov 23 - 2015 Feb 8 Confirmed Eruption Max VEI: 2
| Episode 1 | Eruption Episode | WSW base of Pico | |||||||||||||||||||||||||||||||||||||||||||||||||||||||||||||||||||||||||||||||||||||||||||||||||||||||||||||||||||||||||||||||||||||||||||||||||||||||||||||||||||||||||||||||||||||||||||||||||||||||||||||||||||||||||||||||||||||||||||||||
|---|---|---|---|---|---|---|---|---|---|---|---|---|---|---|---|---|---|---|---|---|---|---|---|---|---|---|---|---|---|---|---|---|---|---|---|---|---|---|---|---|---|---|---|---|---|---|---|---|---|---|---|---|---|---|---|---|---|---|---|---|---|---|---|---|---|---|---|---|---|---|---|---|---|---|---|---|---|---|---|---|---|---|---|---|---|---|---|---|---|---|---|---|---|---|---|---|---|---|---|---|---|---|---|---|---|---|---|---|---|---|---|---|---|---|---|---|---|---|---|---|---|---|---|---|---|---|---|---|---|---|---|---|---|---|---|---|---|---|---|---|---|---|---|---|---|---|---|---|---|---|---|---|---|---|---|---|---|---|---|---|---|---|---|---|---|---|---|---|---|---|---|---|---|---|---|---|---|---|---|---|---|---|---|---|---|---|---|---|---|---|---|---|---|---|---|---|---|---|---|---|---|---|---|---|---|---|---|---|---|---|---|---|---|---|---|---|---|---|---|---|---|---|---|---|---|---|---|---|---|---|---|---|---|---|---|---|---|---|---|---|
| 2014 Nov 23 - 2015 Feb 8 | Evidence from Observations: Reported | |||||||||||||||||||||||||||||||||||||||||||||||||||||||||||||||||||||||||||||||||||||||||||||||||||||||||||||||||||||||||||||||||||||||||||||||||||||||||||||||||||||||||||||||||||||||||||||||||||||||||||||||||||||||||||||||||||||||||||||||
|
List of 46 Events for Episode 1 at WSW base of Pico
| ||||||||||||||||||||||||||||||||||||||||||||||||||||||||||||||||||||||||||||||||||||||||||||||||||||||||||||||||||||||||||||||||||||||||||||||||||||||||||||||||||||||||||||||||||||||||||||||||||||||||||||||||||||||||||||||||||||||||||||||||
1995 Apr 2 - 1995 May 26 Confirmed Eruption Max VEI: 2
| Episode 1 | Eruption Episode | WSW flank of Pico | ||||||||||||||||||||||||||||||||||||||||||||||||||||||||||||||||
|---|---|---|---|---|---|---|---|---|---|---|---|---|---|---|---|---|---|---|---|---|---|---|---|---|---|---|---|---|---|---|---|---|---|---|---|---|---|---|---|---|---|---|---|---|---|---|---|---|---|---|---|---|---|---|---|---|---|---|---|---|---|---|---|---|---|
| 1995 Apr 2 - 1995 May 26 | Evidence from Observations: Reported | ||||||||||||||||||||||||||||||||||||||||||||||||||||||||||||||||
|
List of 11 Events for Episode 1 at WSW flank of Pico
| |||||||||||||||||||||||||||||||||||||||||||||||||||||||||||||||||
1951 Jun 12 - 1951 Aug 21 Confirmed Eruption Max VEI: 2
| Episode 1 | Eruption Episode | Northwest and south caldera floor | ||||||||||||||||||||||||||||||||||||||||||||
|---|---|---|---|---|---|---|---|---|---|---|---|---|---|---|---|---|---|---|---|---|---|---|---|---|---|---|---|---|---|---|---|---|---|---|---|---|---|---|---|---|---|---|---|---|---|
| 1951 Jun 12 - 1951 Aug 21 | Evidence from Observations: Reported | ||||||||||||||||||||||||||||||||||||||||||||
|
List of 7 Events for Episode 1 at Northwest and south caldera floor
| |||||||||||||||||||||||||||||||||||||||||||||
1909 Confirmed Eruption
| Episode 1 | Eruption Episode | ||||
|---|---|---|---|---|
| 1909 - Unknown | Evidence from Observations: Reported | |||
1857 Jun 27 - 1857 Dec 15 Confirmed Eruption Max VEI: 2
| Episode 1 | Eruption Episode | SSE caldera floor | ||||||||||||||||||||||||||||||||||
|---|---|---|---|---|---|---|---|---|---|---|---|---|---|---|---|---|---|---|---|---|---|---|---|---|---|---|---|---|---|---|---|---|---|---|---|
| 1857 Jun 27 - 1857 Dec 15 | Evidence from Observations: Reported | ||||||||||||||||||||||||||||||||||
|
List of 5 Events for Episode 1 at SSE caldera floor
| |||||||||||||||||||||||||||||||||||
1852 Feb 19 - 1852 Mar 30 (?) Confirmed Eruption Max VEI: 2
| Episode 1 | Eruption Episode | NNW caldera floor | |||||||||||||||||||||||||||||
|---|---|---|---|---|---|---|---|---|---|---|---|---|---|---|---|---|---|---|---|---|---|---|---|---|---|---|---|---|---|---|
| 1852 Feb 19 - 1852 Mar 30 (?) | Evidence from Observations: Reported | |||||||||||||||||||||||||||||
|
List of 4 Events for Episode 1 at NNW caldera floor
| ||||||||||||||||||||||||||||||
1847 Apr 9 - 1847 May 2 (?) Confirmed Eruption Max VEI: 2
| Episode 1 | Eruption Episode | North caldera floor | ||||||||||||||||||||||||||||||||||||||||||||
|---|---|---|---|---|---|---|---|---|---|---|---|---|---|---|---|---|---|---|---|---|---|---|---|---|---|---|---|---|---|---|---|---|---|---|---|---|---|---|---|---|---|---|---|---|---|
| 1847 Apr 9 - 1847 May 2 (?) | Evidence from Observations: Reported | ||||||||||||||||||||||||||||||||||||||||||||
|
List of 7 Events for Episode 1 at North caldera floor
| |||||||||||||||||||||||||||||||||||||||||||||
1816 Dec 31 ± 365 days Confirmed Eruption
| Episode 1 | Eruption Episode | ||||
|---|---|---|---|---|
| 1816 Dec 31 ± 365 days - Unknown | Evidence from Observations: Reported | |||
1799 Jun 2 - 1799 Jun 28 Confirmed Eruption Max VEI: 2
| Episode 1 | Eruption Episode | North caldera floor | |||||||||||||||||||||||||||||||||||||||
|---|---|---|---|---|---|---|---|---|---|---|---|---|---|---|---|---|---|---|---|---|---|---|---|---|---|---|---|---|---|---|---|---|---|---|---|---|---|---|---|---|
| 1799 Jun 2 - 1799 Jun 28 | Evidence from Observations: Reported | |||||||||||||||||||||||||||||||||||||||
|
List of 6 Events for Episode 1 at North caldera floor
| ||||||||||||||||||||||||||||||||||||||||
1785 Jan 24 - 1785 Feb 25 Confirmed Eruption Max VEI: 2
| Episode 1 | Eruption Episode | North caldera floor | |||||||||||||||||||||||||||||||||||||||
|---|---|---|---|---|---|---|---|---|---|---|---|---|---|---|---|---|---|---|---|---|---|---|---|---|---|---|---|---|---|---|---|---|---|---|---|---|---|---|---|---|
| 1785 Jan 24 - 1785 Feb 25 | Evidence from Observations: Reported | |||||||||||||||||||||||||||||||||||||||
|
List of 6 Events for Episode 1 at North caldera floor
| ||||||||||||||||||||||||||||||||||||||||
1769 Apr (in or after) Confirmed Eruption
| Episode 1 | Eruption Episode | SW side | |||||||||||||||||||
|---|---|---|---|---|---|---|---|---|---|---|---|---|---|---|---|---|---|---|---|---|
| 1769 Apr (in or after) - Unknown | Evidence from Observations: Reported | |||||||||||||||||||
|
List of 2 Events for Episode 1 at SW side
| ||||||||||||||||||||
1500 - 1761 (?) Confirmed Eruption Max VEI: 1
| Episode 1 | Eruption Episode | Pico | ||||||||||||||||||||||||
|---|---|---|---|---|---|---|---|---|---|---|---|---|---|---|---|---|---|---|---|---|---|---|---|---|---|
| 1500 - 1761 (?) | Evidence from Observations: Reported | ||||||||||||||||||||||||
|
List of 3 Events for Episode 1 at Pico
| |||||||||||||||||||||||||
There is data available for 1 deformation periods. Expand each entry for additional details.
| Start Date: 1993 Jun 23 | Stop Date: 1995 Nov 03 | Direction: Subsidence | Method: InSAR |
| Magnitude: 10.000 cm | Spatial Extent: Unknown | Latitude: Unknown | Longitude: Unknown |
Remarks: Co-eruptive subsidence associated with 1995 eruption explained by a two-segment feeder dike | |||
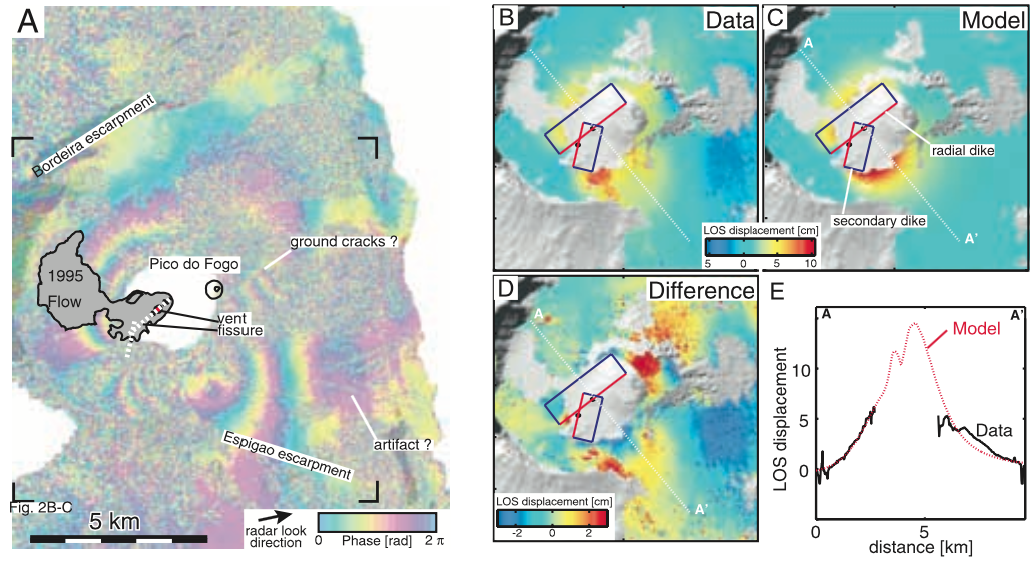 |
(a) June 1993?Nov. 1995 interferogram of Fogo volcano. (b) unwrapped phase, (c) best-fitting model, (d) difference between data and model predictions. (e) profile. Surface projection of best-fitting dislocation model is also shown (red lines denote dislocation upper edges). From: Amelung and Day 2002. |
||
Reference List: Amelung and Day 2002.
Full References:
Amelung F, Day S, 2002. InSAR observations of the 1995 Fogo, Cape Verde, eruption: Implications for the effects of collapse events upon island volcanoes. Geophysical Research Letters, 29(12), 1606. https://doi.org/10.1029/2001GL013760
There is data available for 1 emission periods. Expand each entry for additional details.
| Start Date: 2014 Nov 23 | Stop Date: 2014 Nov 23 | Method: Satellite (Aura OMI) |
| SO2 Altitude Min: 9 km | SO2 Altitude Max: 9 km | Total SO2 Mass: 382 kt |
Data Details
| Date Start | Date End | Assumed SO2 Altitude | SO2 Algorithm | SO2 Mass |
| 20141123 | 9.0 | 382.000 |
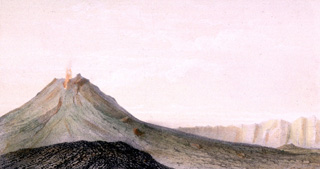 The steep-sided Pico stratovolcano is the most prominent feature within a large 9-km-wide caldera that is breached to the east. Cha caldera, whose rim appears at the right, is located asymmetrically NE of the center of the Cape Verde island of Fogo. Pico is capped by a 500-m-wide, 150-m-deep summit crater. Pico was apparently in almost continuous activity from the time of Portuguese settlement in 1500 CE until around 1760. Later historical lava flows, some from vents on the caldera floor, reached the eastern coast.
 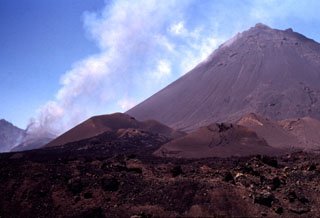 A steep-sided central cone, Pico do Fogo, rises more than 1 km above the floor of the Cha caldera. The island of Fogo is a massive stratovolcano, truncated by a 9-km-wide caldera that is breached to the east. Pico was apparently in almost continuous activity from the time of Portuguese settlement in 1500 CE until around 1760 CE. It is seen here in 1995 during an explosive and effusive eruption from a vent on its lower western flank (left). A plume of ash and steam is visible from the vent. Fogo erupted again in 2014-2015, when lava flows destroyed the intra-caldera villages of Portela and Bangaeira.
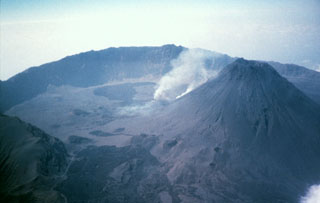 The 9-km-wide Cha caldera, open to the east, truncates the summit of Fogo stratovolcano. An ash plume (center) rises from an active vent on the western flank of the steep-sided Pico central cone (right). Pico is more than 1 km high and capped by an approximately 500-m-wide, 100-m-deep summit crater. Numerous historical eruptions have occurred from the summit of Pico and from its flanks in Cha caldera.
The Global Volcanism Program has no maps available for Fogo.
There are no samples for Fogo in the Smithsonian's NMNH Department of Mineral Sciences Rock and Ore collection.
| Copernicus Browser | The Copernicus Browser replaced the Sentinel Hub Playground browser in 2023, to provide access to Earth observation archives from the Copernicus Data Space Ecosystem, the main distribution platform for data from the EU Copernicus missions. |
| MIROVA | Middle InfraRed Observation of Volcanic Activity (MIROVA) is a near real time volcanic hot-spot detection system based on the analysis of MODIS (Moderate Resolution Imaging Spectroradiometer) data. In particular, MIROVA uses the Middle InfraRed Radiation (MIR), measured over target volcanoes, in order to detect, locate and measure the heat radiation sourced from volcanic activity. |
| MODVOLC Thermal Alerts | Using infrared satellite Moderate Resolution Imaging Spectroradiometer (MODIS) data, scientists at the Hawai'i Institute of Geophysics and Planetology, University of Hawai'i, developed an automated system called MODVOLC to map thermal hot-spots in near real time. For each MODIS image, the algorithm automatically scans each 1 km pixel within it to check for high-temperature hot-spots. When one is found the date, time, location, and intensity are recorded. MODIS looks at every square km of the Earth every 48 hours, once during the day and once during the night, and the presence of two MODIS sensors in space allows at least four hot-spot observations every two days. Each day updated global maps are compiled to display the locations of all hot spots detected in the previous 24 hours. There is a drop-down list with volcano names which allow users to 'zoom-in' and examine the distribution of hot-spots at a variety of spatial scales. |
|
WOVOdat
Single Volcano View Temporal Evolution of Unrest Side by Side Volcanoes |
WOVOdat is a database of volcanic unrest; instrumentally and visually recorded changes in seismicity, ground deformation, gas emission, and other parameters from their normal baselines. It is sponsored by the World Organization of Volcano Observatories (WOVO) and presently hosted at the Earth Observatory of Singapore.
GVMID Data on Volcano Monitoring Infrastructure The Global Volcano Monitoring Infrastructure Database GVMID, is aimed at documenting and improving capabilities of volcano monitoring from the ground and space. GVMID should provide a snapshot and baseline view of the techniques and instrumentation that are in place at various volcanoes, which can be use by volcano observatories as reference to setup new monitoring system or improving networks at a specific volcano. These data will allow identification of what monitoring gaps exist, which can be then targeted by remote sensing infrastructure and future instrument deployments. |
| Volcanic Hazard Maps | The IAVCEI Commission on Volcanic Hazards and Risk has a Volcanic Hazard Maps database designed to serve as a resource for hazard mappers (or other interested parties) to explore how common issues in hazard map development have been addressed at different volcanoes, in different countries, for different hazards, and for different intended audiences. In addition to the comprehensive, searchable Volcanic Hazard Maps Database, this website contains information about diversity of volcanic hazard maps, illustrated using examples from the database. This site is for educational purposes related to volcanic hazard maps. Hazard maps found on this website should not be used for emergency purposes. For the most recent, official hazard map for a particular volcano, please seek out the proper institutional authorities on the matter. |
| IRIS seismic stations/networks | Incorporated Research Institutions for Seismology (IRIS) Data Services map showing the location of seismic stations from all available networks (permanent or temporary) within a radius of 0.18° (about 20 km at mid-latitudes) from the given location of Fogo. Users can customize a variety of filters and options in the left panel. Note that if there are no stations are known the map will default to show the entire world with a "No data matched request" error notice. |
| UNAVCO GPS/GNSS stations | Geodetic Data Services map from UNAVCO showing the location of GPS/GNSS stations from all available networks (permanent or temporary) within a radius of 20 km from the given location of Fogo. Users can customize the data search based on station or network names, location, and time window. Requires Adobe Flash Player. |
| DECADE Data | The DECADE portal, still in the developmental stage, serves as an example of the proposed interoperability between The Smithsonian Institution's Global Volcanism Program, the Mapping Gas Emissions (MaGa) Database, and the EarthChem Geochemical Portal. The Deep Earth Carbon Degassing (DECADE) initiative seeks to use new and established technologies to determine accurate global fluxes of volcanic CO2 to the atmosphere, but installing CO2 monitoring networks on 20 of the world's 150 most actively degassing volcanoes. The group uses related laboratory-based studies (direct gas sampling and analysis, melt inclusions) to provide new data for direct degassing of deep earth carbon to the atmosphere. |
| Large Eruptions of Fogo | Information about large Quaternary eruptions (VEI >= 4) is cataloged in the Large Magnitude Explosive Volcanic Eruptions (LaMEVE) database of the Volcano Global Risk Identification and Analysis Project (VOGRIPA). |
| EarthChem | EarthChem develops and maintains databases, software, and services that support the preservation, discovery, access and analysis of geochemical data, and facilitate their integration with the broad array of other available earth science parameters. EarthChem is operated by a joint team of disciplinary scientists, data scientists, data managers and information technology developers who are part of the NSF-funded data facility Integrated Earth Data Applications (IEDA). IEDA is a collaborative effort of EarthChem and the Marine Geoscience Data System (MGDS). |

