Recently Published Bulletin Reports
Agung (Indonesia) Three eruptive events reported in April, May, and December 2022
Tengger Caldera (Indonesia) Minor ash emission in December 2023; persistent weak thermal anomaly in the Bromo crater
Saunders (United Kingdom) Persistent thermal anomalies from the summit crater lava lake during February 2023-January 2024
Shishaldin (United States) New eruption with significant Strombolian explosions, ash plumes, and ashfall
Ioto (Japan) New eruption with discolored water, ejecta, and floating pumice during October-December 2023
Purace (Colombia) Gas-and-ash emission on 16 November 2023
Suwanosejima (Japan) Eruption plumes, crater incandescence, and occasional explosions during July-October 2023
Etna (Italy) Strombolian explosions, lava fountains, and lava flows during July-August 2023
Aira (Japan) Explosions, ash plumes, ash fall, and crater incandescence during July-October 2023
Nishinoshima (Japan) Gray emissions during October 2023
Kilauea (United States) Strong lava fountains, lava flows, and spatter at Halema’uma’u during January-September 2023
Tinakula (Solomon Islands) Continued lava flows and thermal activity during June through November 2023
Agung (Indonesia) — January 2024  Cite this Report
Agung
Indonesia
8.343°S, 115.508°E; summit elev. 2997 m
All times are local (unless otherwise noted)
Three eruptive events reported in April, May, and December 2022
Mount Agung, located on the E end of the island of Bali, Indonesia, rises above the SE rim of the Batur caldera. The summit area extends 1.5 km E-W, with the highest point on the W and a steep-walled 800-m-wide crater on the E. Recorded eruptions date back to the early 19th century. A large and deadly explosive and effusive eruption occurred during 1963-64, which was characterized by voluminous ashfall, pyroclastic flows, and lahars that caused extensive damage and many fatalities. More recent activity was documented during November 2017-June 2019 that consisted of multiple explosions, significant ash plumes, lava flows at the summit crater, and incandescent ejecta. This report covers activity reported during April-May 2022 and December 2022 based on data from the Darwin Volcanic Ash Advisory Center (VAAC).
Activity during 2022 was relatively low and mainly consisted of a few ash plumes during April-May and December. An ash plume on 3 April rising to 3.7 km altitude (700 m above the summit) and drifting N was reported in a Darwin VAAC notice based on a ground report, with ash seen in HIMAWARI-8 visible imagery. Another ash plume was reported at 1120 on 27 May that rose to 5.5 km altitude (2.5 m above the summit); the plume was not visible in satellite or webcam images due to weather clouds. An eruption was reported based on seismic data at 0840 on 13 December, with an estimated plume altitude of 3.7 km; however, no ash was seen using satellite imagery in clear conditions before weather clouds obscured the summit.
Geologic Background. Symmetrical Agung stratovolcano, Bali's highest and most sacred mountain, towers over the eastern end of the island. The volcano, whose name means "Paramount," rises above the SE rim of the Batur caldera, and the northern and southern flanks extend to the coast. The summit area extends 1.5 km E-W, with the high point on the W and a steep-walled 800-m-wide crater on the E. The Pawon cone is located low on the SE flank. Only a few eruptions dating back to the early 19th century have been recorded in historical time. The 1963-64 eruption, one of the largest in the 20th century, produced voluminous ashfall along with devastating pyroclastic flows and lahars that caused extensive damage and many fatalities.
Information Contacts: Darwin Volcanic Ash Advisory Centre (VAAC), Bureau of Meteorology, Northern Territory Regional Office, PO Box 40050, Casuarina, NT 0811, Australia (URL: http://www.bom.gov.au/info/vaac/).
Tengger Caldera (Indonesia) — February 2024 Cite this Report
Tengger Caldera
Indonesia
7.942°S, 112.95°E; summit elev. 2329 m
All times are local (unless otherwise noted)
Minor ash emission in December 2023; persistent weak thermal anomaly in the Bromo crater
Tengger Caldera, located at the N end of a volcanic massif in Indonesia’s East Java, consists of five overlapping stratovolcanoes. The youngest and only active cone in the 16-km-wide caldera is Bromo, which typically produces gas-and-steam plumes, occasional ash plumes and explosions, and weak thermal signals (BGVN 44:05, 47:01). This report covers activity during January 2022-December 2023, consisting of mostly white gas-and-steam emissions and persistent weak thermal anomalies. Information was provided by the Pusat Vulkanologi dan Mitigasi Bencana Geologi (PVMBG, also known as Indonesian Center for Volcanology and Geological Hazard Mitigation, CVGHM) and satellite imagery. The Alert Level remained at 2 (on a scale of 1-4), and visitors were warned to stay at least 1 km from the crater.
Activity was generally low during the reporting period, similar to that in 2021. According to almost daily images from MAGMA Indonesia (a platform developed by PVMBG), white emissions and plumes rose from 50 to 900 m above the main crater during this period (figure 24). During several days in March and June 2022, white plumes reached heights of 1-1.2 km above the crater.
After an increase in activity at 2114 on 3 February 2023, a PVMBG team that was sent to observe white emissions rising as high as 300 m during 9-12 February and heard rumbling noises. A sulfur dioxide odor was also strong near the crater and measurements indicated that levels were above the healthy (non-hazardous) threshold of 5 parts per million; differential optical absorption spectroscopy (DOAS) measurements indicated an average flux of 190 metric tons per day on 11 February. Incandescence originating from a large fumarole in the NNW part of the crater was visible at night. The team observed that vegetation on the E caldera wall was yellow and withered. The seismic network recorded continuous tremor and deep and shallow volcanic earthquakes.
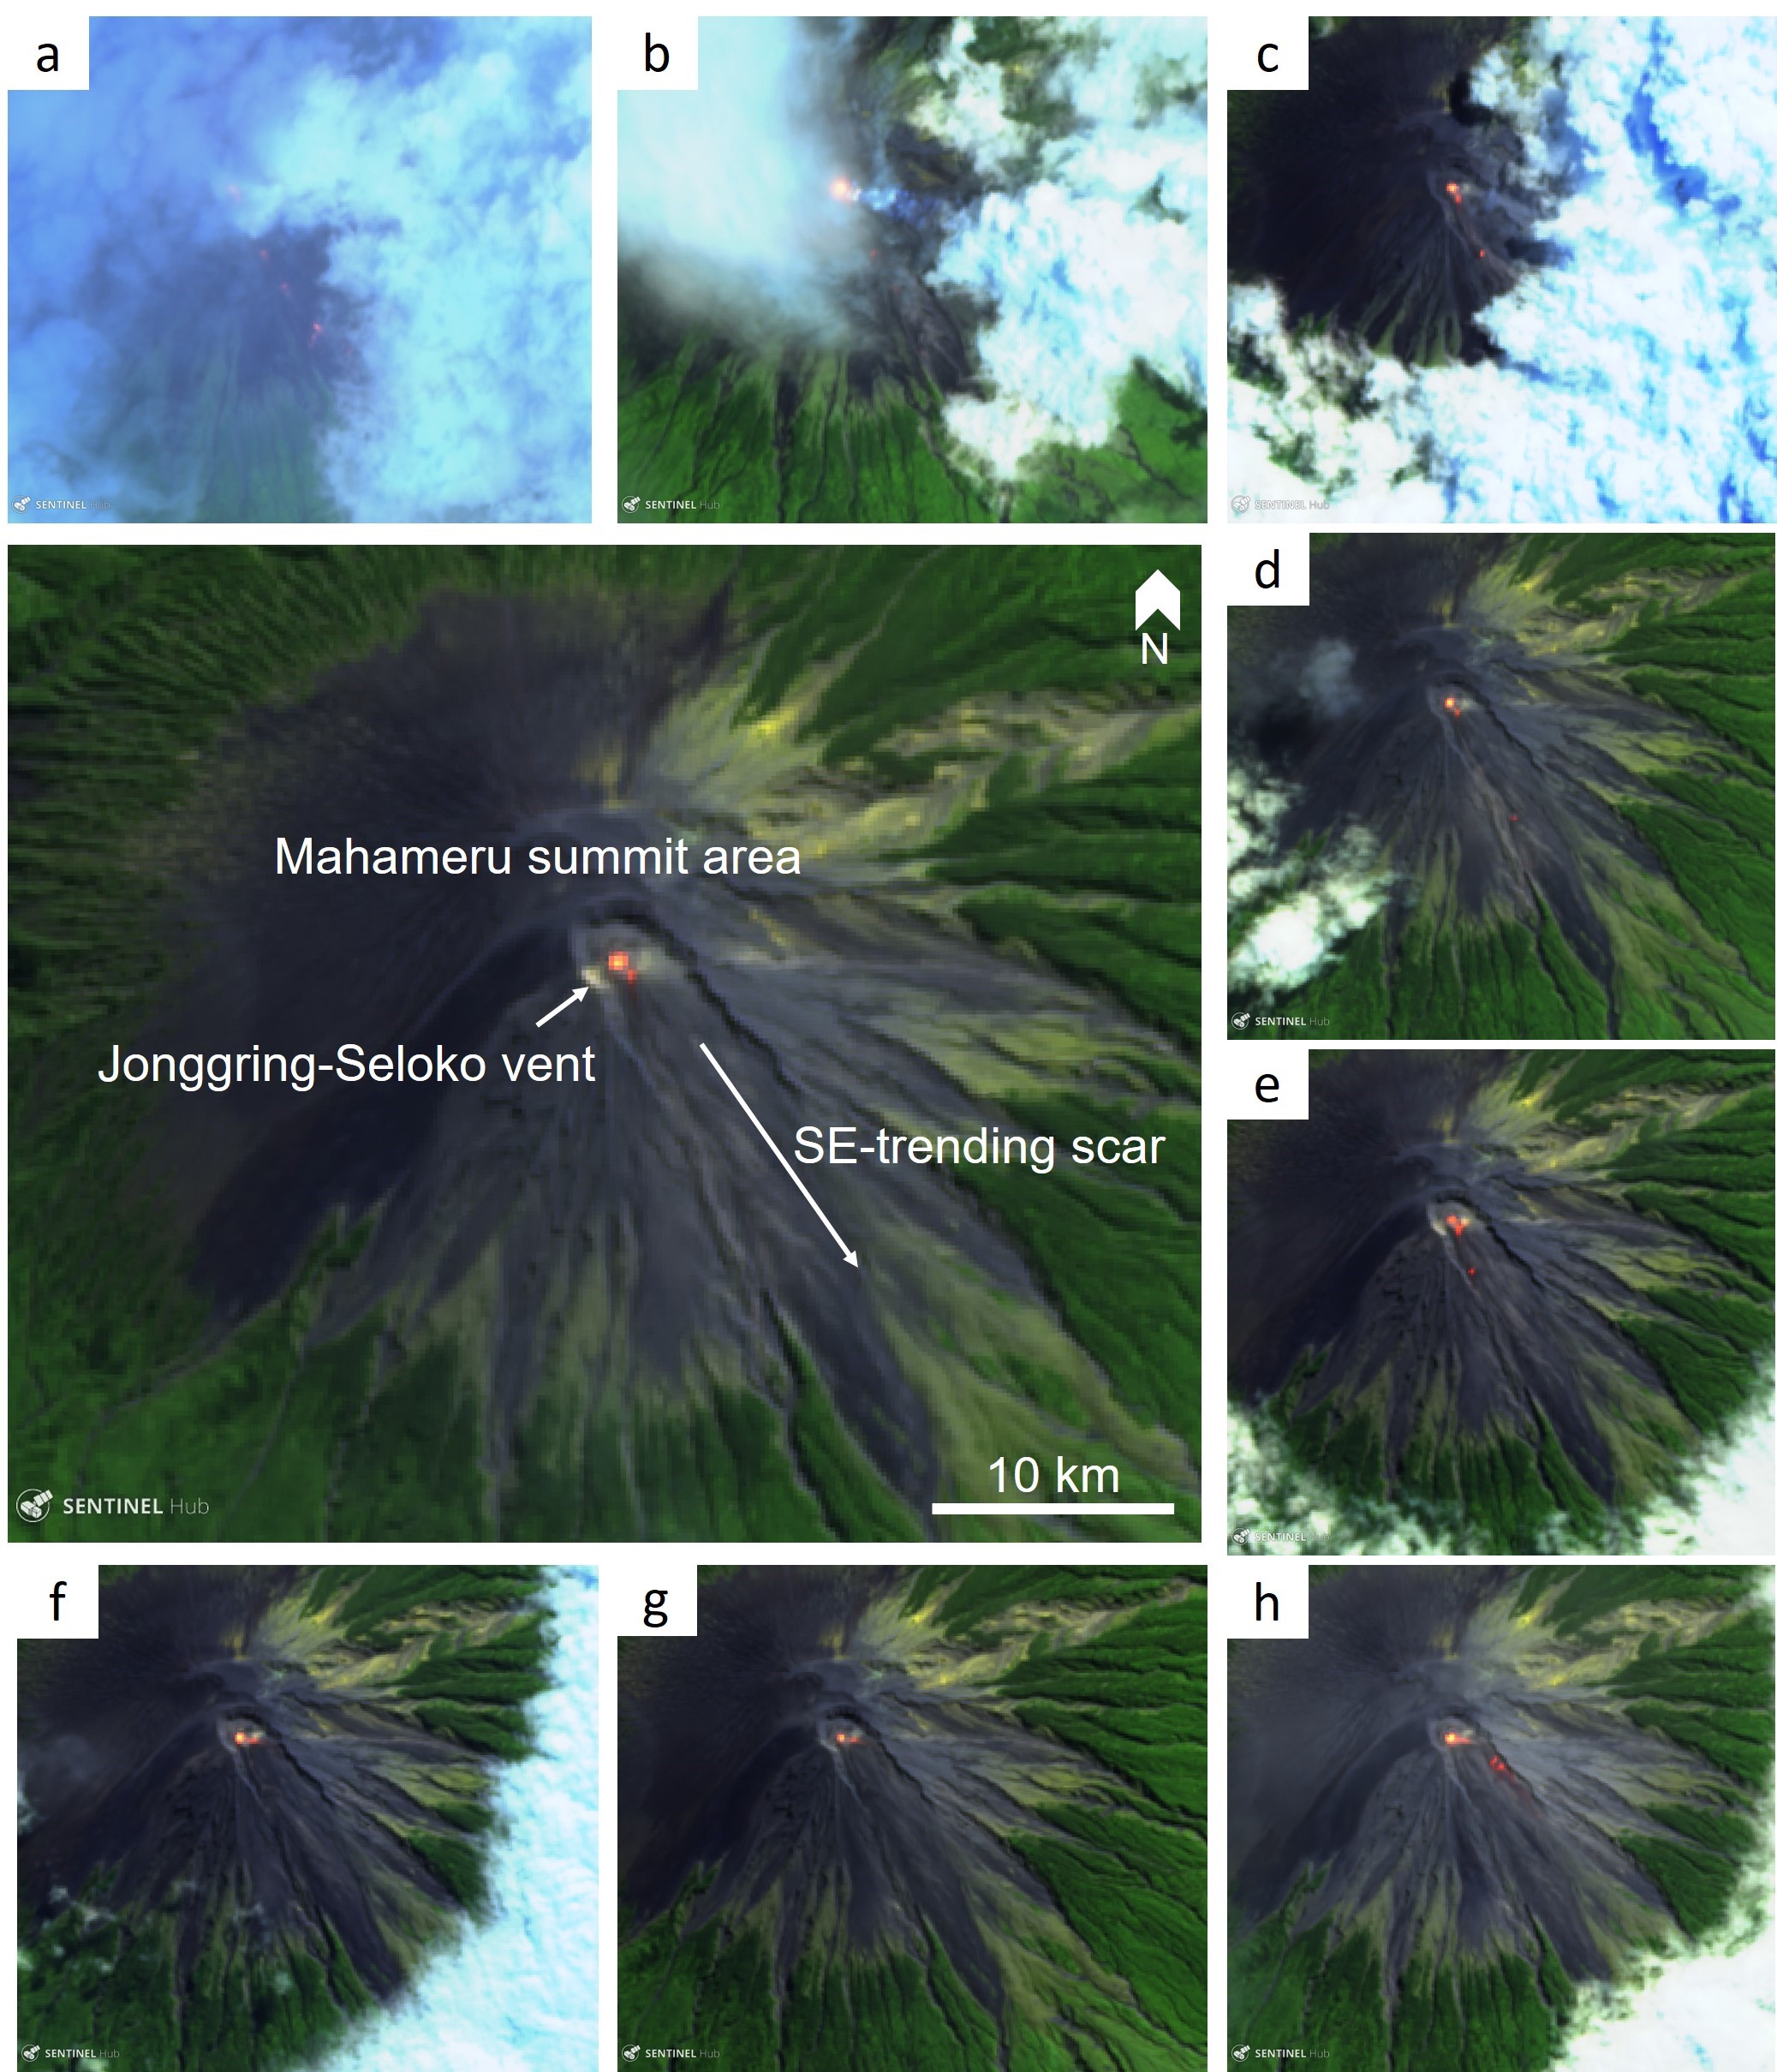
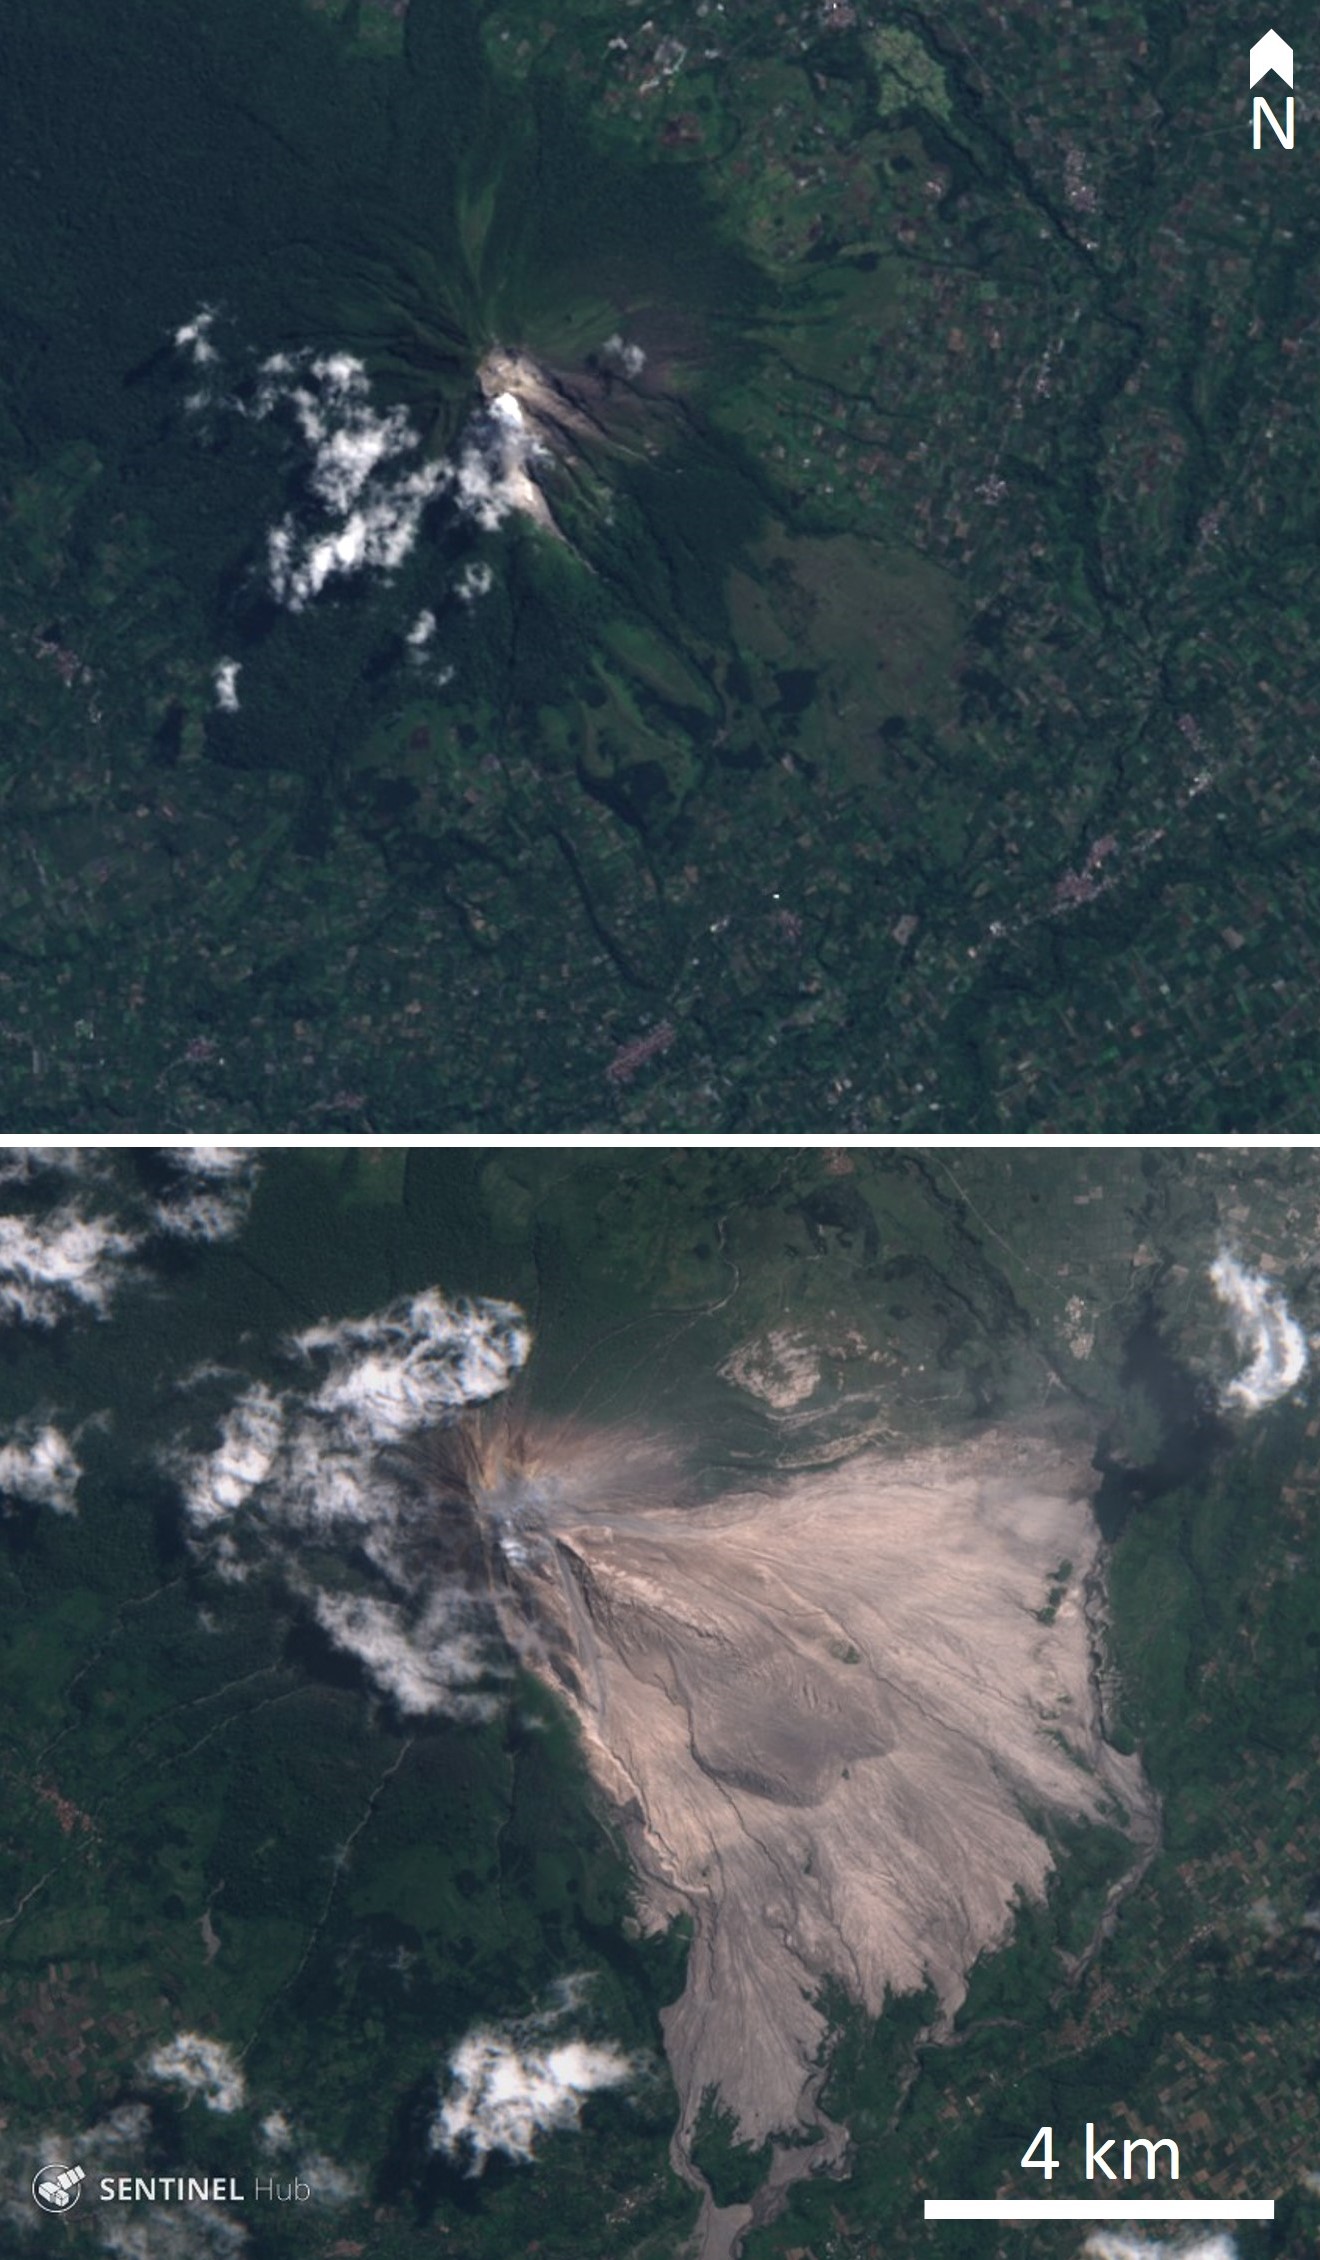
According to a PVMBG press release, activity increased on 13 December 2023 with white, gray, and brown emissions rising as high as 900 m above Bromo’s crater rim and drifting in multiple directions (figure 25). The report noted that tremor was continuous and was accompanied in December by three volcanic earthquakes. Deformation data indicated inflation in December. There was no observable difference in the persistent thermal anomaly in the crater between 11 and 16 December 2023.
All clear views of the Bromo crater throughout this time, using Sentinel-2 infrared satellite images, showed a weak persistent thermal anomaly; none of the anomalies were strong enough to cause MODVOLC Thermal Alerts. A fire in the SE part of the caldera in early September 2023 resulted in a brief period of strong thermal anomalies.
Geologic Background. The 16-km-wide Tengger caldera is located at the northern end of a volcanic massif extending from Semeru volcano. The massive volcanic complex dates back to about 820,000 years ago and consists of five overlapping stratovolcanoes, each truncated by a caldera. Lava domes, pyroclastic cones, and a maar occupy the flanks of the massif. The Ngadisari caldera at the NE end of the complex formed about 150,000 years ago and is now drained through the Sapikerep valley. The most recent of the calderas is the 9 x 10 km wide Sandsea caldera at the SW end of the complex, which formed incrementally during the late Pleistocene and early Holocene. An overlapping cluster of post-caldera cones was constructed on the floor of the Sandsea caldera within the past several thousand years. The youngest of these is Bromo, one of Java's most active and most frequently visited volcanoes.
Information Contacts: Pusat Vulkanologi dan Mitigasi Bencana Geologi (PVMBG, also known as Indonesian Center for Volcanology and Geological Hazard Mitigation, CVGHM), Jalan Diponegoro 57, Bandung 40122, Indonesia (URL: http://www.vsi.esdm.go.id/); MAGMA Indonesia, Kementerian Energi dan Sumber Daya Mineral (URL: https://magma.esdm.go.id/v1); Copernicus Browser, Copernicus Data Space Ecosystem, European Space Agency (URL: https://dataspace.copernicus.eu/browser/); Hawai'i Institute of Geophysics and Planetology (HIGP) - MODVOLC Thermal Alerts System, School of Ocean and Earth Science and Technology (SOEST), Univ. of Hawai'i, 2525 Correa Road, Honolulu, HI 96822, USA (URL: http://modis.higp.hawaii.edu/).
Saunders (United Kingdom) — February 2024 Cite this Report
Saunders
United Kingdom
57.8°S, 26.483°W; summit elev. 843 m
All times are local (unless otherwise noted)
Persistent thermal anomalies from the summit crater lava lake during February 2023-January 2024
Saunders is one of eleven islands that comprise the South Sandwich Islands in the South Atlantic. The active Mount Michael volcano has been in almost continuous eruption since November 2014 (BGVN 48:02). Recent activity has resulted in intermittent thermal anomalies and gas-and-steam emissions (BGVN 47:03, 48:02). Visits are infrequent due to its remote location, and cloud cover often prevents satellite observations. Satellite thermal imagery and visual observation of incandescence during a research expedition in 2019 (BGVN 28:02 and 44:08) and a finding confirmed by a National Geographic Society research team that summited Michael in November 2022 reported the presence of a lava lake.
Although nearly constant cloud cover during February 2023 through January 2024 greatly limited satellite observations, thermal anomalies from the lava lake in the summit crater were detected on clear days, especially around 20-23 August 2023. Anomalies similar to previous years (eg. BGVN 48:02) were seen in both MIROVA (Middle InfraRed Observation of Volcanic Activity) data from MODIS instruments and in Sentinel 2 infrared imagery. The only notable sulfur dioxide plume detected near Saunders was on 25 September 2023, with the TROPOMI instrument aboard the Sentinel-5P satellite.
Geologic Background. Saunders Island consists of a large central volcanic edifice intersected by two seamount chains, as shown by bathymetric mapping (Leat et al., 2013). The young Mount Michael stratovolcano dominates the glacier-covered island, while two submarine plateaus, Harpers Bank and Saunders Bank, extend north. The symmetrical Michael has a 500-m-wide summit crater and a remnant of a somma rim to the SE. Tephra layers visible in ice cliffs surrounding the island are evidence of recent eruptions. Ash clouds were reported from the summit crater in 1819, and an effusive eruption was inferred to have occurred from a N-flank fissure around the end of the 19th century and beginning of the 20th century. A low ice-free lava platform, Blackstone Plain, is located on the north coast, surrounding a group of former sea stacks. A cluster of cones on the SE flank, the Ashen Hills, appear to have been modified since 1820 (LeMasurier and Thomson, 1990). Analysis of satellite imagery available since 1989 (Gray et al., 2019; MODVOLC) suggests frequent eruptive activity (when weather conditions allow), volcanic clouds, steam plumes, and thermal anomalies indicative of a persistent, or at least frequently active, lava lake in the summit crater. Due to this observational bias, there has been a presumption when defining eruptive periods that activity has been ongoing unless there is no evidence for at least 10 months.
Information Contacts: MIROVA (Middle InfraRed Observation of Volcanic Activity), a collaborative project between the Universities of Turin and Florence (Italy) supported by the Centre for Volcanic Risk of the Italian Civil Protection Department (URL: http://www.mirovaweb.it/); NASA Global Sulfur Dioxide Monitoring Page, Atmospheric Chemistry and Dynamics Laboratory, NASA Goddard Space Flight Center (NASA/GSFC), 8800 Greenbelt Road, Goddard MD 20771, USA (URL: https://so2.gsfc.nasa.gov/); Copernicus Browser (URL: https://dataspace.copernicus.eu/browser).
Shishaldin (United States) — December 2023 Cite this Report
Shishaldin
United States
54.756°N, 163.97°W; summit elev. 2857 m
All times are local (unless otherwise noted)
New eruption with significant Strombolian explosions, ash plumes, and ashfall
Shishaldin is located on the eastern half of Unimak Island, one of the Aleutian Islands. Frequent explosive activity, primarily consisting of Strombolian ash eruptions from the small summit crater, but sometimes producing lava flows, has been recorded since the 18th century. The previous eruption ended in May 2020 and was characterized by intermittent thermal activity, increased seismicity and surface temperatures, ash plumes, and ash deposits (BGVN 45:06). This report covers a new eruption during July through November 2023, which consisted of significant explosions, ash plumes, ashfall, and lava fountaining. Information comes from daily, weekly, and special reports from the Alaska Volcano Observatory (AVO) and various satellite data. AVO monitors the volcano using local seismic and infrasound sensors, satellite data, web cameras, and remote infrasound and lightning networks.
AVO reported that intermittent tremor and low-frequency earthquakes had gradually become more regular and consistent during 10-13 July. Strongly elevated surface temperatures at the summit were identified in satellite images during 10-13 July. On 11 July AVO raised the Aviation Color Code (ACC) to Yellow (the second color on a four-color scale) and Volcano Alert Level (VAL) to Advisory (the second level on a four-level scale) at 1439. Later in the day on 11 July summit crater incandescence was observed in webcam images. Observations of the summit suggested that lava was likely present at the crater, which prompted AVO to raise the ACC to Orange (the second highest color on a four-color scale) and the VAL to Watch (the second highest level on a four-level scale). The US Coast Guard conducted an overflight on 12 July and confirmed that lava was erupting from the summit. That same day, sulfur dioxide emissions were detected in satellite images.
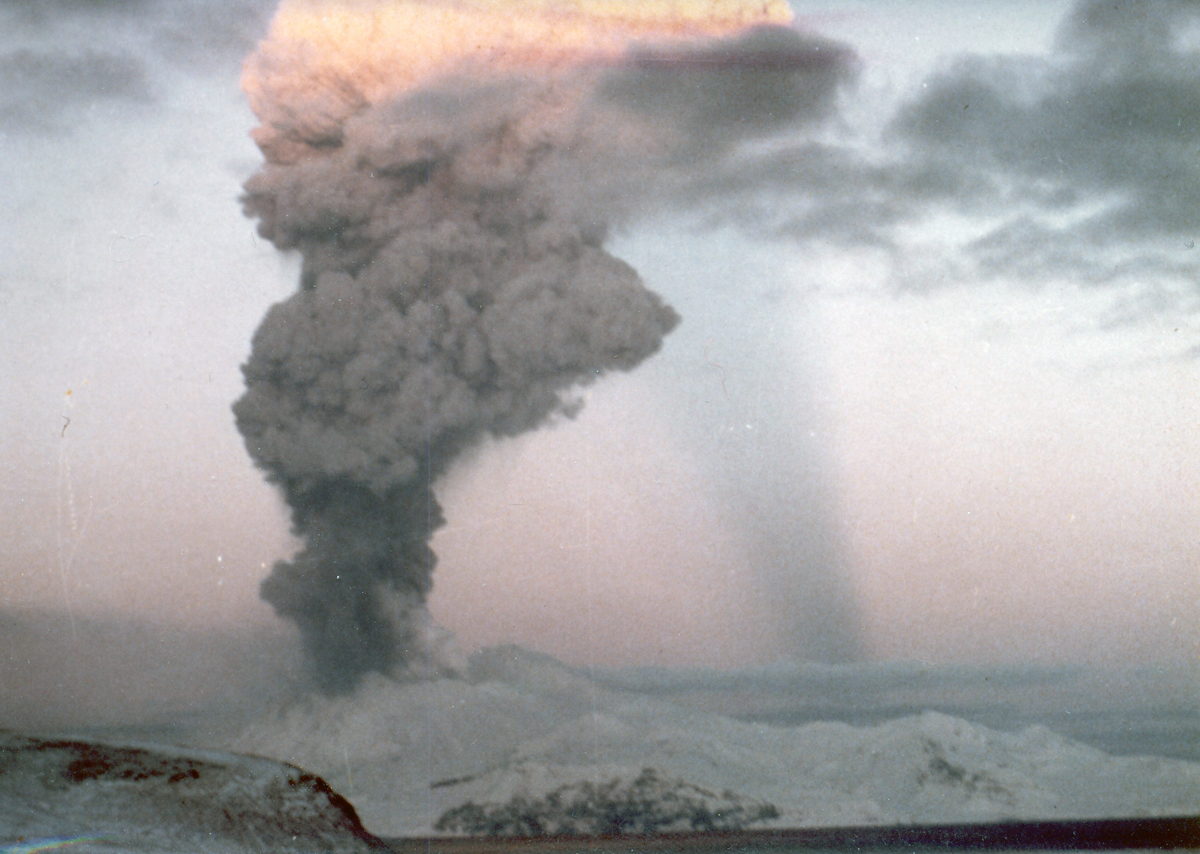
A significant explosion began at 0109 on 14 July that produced an ash plume that rose to 9-12 km altitude and drifted S over the Pacific Ocean (figure 43). Webcam images and photos taken around 0700 from a ship SW off Unimak Island showed small lahar deposits, which were the result of the interaction of hot pyroclastic material and snow and ice on the flanks. There was also ashfall on the SW and N flanks. A smaller explosion at 0710 generated an ash plume that rose to 4.5 km altitude. Webcam images and pilot reports showed continued low-level ash emissions during the morning, rising to less than 4.6 km altitude; those emissions included a small ash plume near the summit around 1030 resulting from a small explosion.
Seismic tremor amplitude began increasing at around 1700 on 15 July; strongly elevated surface temperatures were also reported. An ash plume rose to 4.6 km altitude and drifted SSE at 2100, based on a satellite image. A continuous ash plume during 2150 through 2330 rose to 5 km altitude and extended 125 km S. At 2357 AVO raised the ACC to Red (the highest color on a four-color scale) and the VAL to Warning (the highest level on a four-level scale), noting that seismicity remained elevated for more than six hours and explosion signals were frequently detected by regional infrasound (pressure sensor) networks. Explosions generated an ash plume that rose to 4.9 km altitude and drifted as far as 500 km SE. Activity throughout the night declined and by 0735 the ACC was lowered to Orange and the VAL to Watch. High-resolution satellite images taken on 16 July showed pyroclastic deposits extending as far as 3 km from the vent; these deposits generated lahars that extended further down the drainages on the flanks. Ash deposits were mainly observed on the SSE flank and extended to the shore of Unimak Island. During 16-17 July lava continued to erupt at the summit, which caused strongly elevated surface temperatures that were visible in satellite imagery.
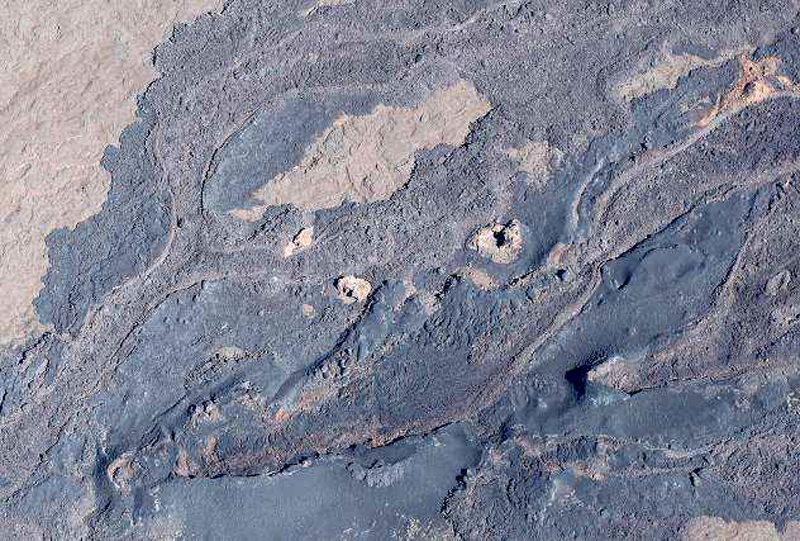
Lava effusion increased at 0100 on 18 July, as noted in elevated surface temperatures identified in satellite data, increasing seismic tremor, and activity detected on regional infrasound arrays. A significant ash plume at 0700 rose to 7 km altitude and continued until 0830, eventually reaching 9.1 km altitude and drifting SSE (figure 44). As a result, the ACC was raised to Red and the VAL to Warning. By 0930 the main plume detached, but residual low-level ash emissions continued for several hours, remaining below 3 km altitude and drifting S. The eruption gradually declined and by 1208 the ACC was lowered to Orange and the VAL was lowered to Watch. High-resolution satellite images showed ash deposits on the SW flank and pyroclastic deposits on the N, E, and S flanks, extending as far as 3 km from the vent; lahars triggered by the eruption extended farther down the flanks (figure 45). Lava continued to erupt from the summit crater on 19 July.
Elevated surface temperatures were detected in satellite images during 19-25 July, despite occasional weather cloud cover, which was consistent with increased lava effusion. During 22-23 July satellite observations acquired after the eruption from 18 July showed pyroclastic flow and lahar deposits extending as far as 3 km down the N, NW, and NE flanks and as far as 1.5 km down the S and SE flanks. Ash deposits covered the SW and NE flanks. No lava flows were observed outside the crater. On 22 July a sulfur dioxide plume was detected in satellite data midday that had an estimated mass of 10 kt. In a special notice issued at 1653 on 22 July AVO noted that eruptive activity had intensified over the previous six hours, which was characterized by an hours-long steady increase in seismic tremor, intermittent infrasound signals consistent with small explosions, and an increase in surface temperatures that were visible in satellite data. Pilots first reported low-level ash plumes at around 1900. At 2320 an ash plume had risen to 9 km altitude based on additional pilot reports and satellite images. The ACC was increased to Red and the VAL to Warning at 2343. Satellite images indicated growth of a significantly higher ash plume that rose to 11 km altitude continued until 0030 and drifted NE. During the early morning hours of 23 July ash plumes had declined to 4.6 k altitude. Seismic tremor peaked at 0030 on 23 July and began to rapidly decline at 0109; active ash emissions were no longer visible in satellite data by 0130. The ACC was lowered to Orange and the VAL to Watch at 0418; bursts of increased seismicity were recorded throughout the morning, but seismicity generally remained at low levels. Elevated surface temperatures were visible in satellite data until about 0600. On 24 July pilots reported seeing vigorous gas-and-steam plumes rising to about 3 km altitude; the plumes may have contained minor amounts of ash.
During 24-25 July low level seismicity and volcanic tremor were detected at low levels following the previous explosion on 23 July. Strongly elevated surface temperatures were observed at the summit crater in satellite data. Around 2200 on 25 July seismicity began to increase, followed by infrasound signals of explosions after 0200 on 26 July. An ash plume rose to 3 km altitude at 0500 and drifted ENE, along with an associated sulfur dioxide plume that drifted NE and had an estimated mass of 22 kt. Diffuse ash emissions were visible in satellite data and rose to 6.1-7.6 km altitude and extended 125 km from the volcano starting around 1130. These ash events were preceded by about seven hours of seismic tremor, infrasound detections of explosions, and five hours of increased surface temperatures visible in satellite data. Activity began to decline around 1327, which included low-frequency earthquakes and decreased volcanic tremor, and infrasound data no longer detected significant explosions. Surface temperatures remained elevated through the end of the month.
Seismicity, volcanic tremor, and ash emissions remained at low levels during early August. Satellite images on 1 August showed that some slumping had occurred on the E crater wall due to the recent explosive activity. Elevated surface temperatures continued, which was consistent with cooling lava. On 2 August small explosive events were detected, consistent with low-level Strombolian activity. Some episodes of volcanic tremor were reported, which reflected low-level ash emissions. Those ash emissions rose to less than 3 km altitude and drifted as far as 92.6 km N. Pilots that were located N of the volcano observed an ash plume that rose to 2.7 km altitude. Seismicity began to increase in intensity around 0900 on 3 August. Seismicity continued to increase throughout the day and through the night with strongly elevated surface temperatures, which suggested that lava was active at the surface.
An ash cloud that rose to 7.6-7.9 km altitude and drifted 60-75 km NE was visible in a satellite image at 0520 on 4 August. Pilots saw and reported the plume at 0836 (figure 46). By 0900 the plume had risen to 9.1 km altitude and extended over 100 km NE. AVO raised the ACC to Red and the VAL to Warning as a result. Seismic tremor levels peaked at 1400 and then sharply declined at 1500 to slightly elevated levels; the plume was sustained during the period of high tremor and drifted N and NE. The ACC was lowered to Orange and the VAL to Watch at 2055. During 5-14 August seismicity remained low and surface temperatures were elevated based on satellite data due to cooling lava. On 9 August a small lava flow was observed that extended from the crater rim to the upper NE flank. It had advanced to 55 m in length and appeared in satellite imagery on 11 August. Occasional gas-and-steam plumes were noted in webcam images. At 1827 AVO noted that seismic tremor had steadily increased during the afternoon and erupting lava was visible at the summit in satellite images.
Strong explosion signals were detected at 0200 on 15 August. An ash cloud that was visible in satellite data extended 100 km NE and may have risen as high as 11 km altitude around 0240. By 0335 satellite images showed the ash cloud rising to 7.6 km altitude and drifting NE. Significant seismicity and explosions were detected by the local AVO seismic and infrasound networks, and volcanic lightning was detected by the World Wide Lightning Location Network (WWLLN). A sulfur dioxide plume associated with the eruption drifted over the S Bering Sea and parts of Alaska and western Canada. Seismicity was significantly elevated during the eruption but had declined by 1322. A pilot reported that ash emissions continued, rising as high as 4.9 km altitude. Elevated surface temperatures detected in satellite data were caused by hot, eruptive material (pyroclastic debris and lava) that accumulated around the summit. Eruptive activity declined by 16 August and the associated sulfur dioxide plume had mostly dissipated; remnants continued to be identified in satellite images at least through 18 August. Surface temperatures remained elevated based on satellite images, indicating hot material on the upper parts of the volcano. Small explosions were detected in infrasound data on the morning of 19 August and were consistent with pilot reports of small, short-lived ash plumes that rose to about 4.3 km altitude. Low-level explosive activity was reported during 20-24 August, according to seismic and infrasound data, and weather clouds sometimes prevented views. Elevated surface temperatures were observed in satellite images, which indicated continued hot material on the upper parts of the volcano.
Seismic tremor began to increase at around 0300 on 25 August and was followed by elevated surface temperatures identified in satellite images, consistent with erupting lava. Small explosions were recorded in infrasound data. The ACC was raised to Red and the VAL to Warning at 1204 after a pilot reported an ash plume that rose to 9.1 km altitude. Seismicity peaked at 1630 and began to rapidly decline at around 1730. Ash plumes rose as high as 10 km altitude and drifted as far as 400 km NE. By 2020 the ash plumes had declined to 6.4 km altitude and continued to drift NE. Ash emissions were visible in satellite data until 0000 on 26 August and seismicity was at low levels. AVO lowered the ACC to Orange and the VAL to Watch at 0030. Minor explosive activity within the summit crater was detected during 26-28 August and strongly elevated surface temperatures were still visible in satellite imagery through the rest of the month. An AVO field crew working on Unimak Island observed a mass flow that descended the upper flanks beginning around 1720 on 27 August. The flow produced a short-lived ash cloud that rose to 4.5 km altitude and rapidly dissipated. The mass flow was likely caused by the collapse of spatter that accumulated on the summit crater rim.
Similar variable explosive activity was reported in September, although weather observations sometimes prevented observations. A moderate resolution satellite image from the afternoon of 1 September showed gas-and-steam emissions filling the summit crater and obscuring views of the vent. In addition, hot deposits from the previous 25-26 August explosive event were visible on the NE flank near the summit, based on a 1 September satellite image. On 2 and 4 September seismic and infrasound data showed signals of small, repetitive explosions. Variable gas-and-steam emissions from the summit were visible but there was no evidence of ash. Possible summit crater incandescence was visible in nighttime webcam images during 3-4 September.
Seismicity began to gradually increase at around 0300 on 5 September and activity escalated at around 0830. A pilot reported an ash plume that rose to 7.6 km altitude at 0842 and continued to rise as high as possibly 9.7 km altitude and drifted SSE based on satellite images (figure 47). The ACC was raised to Red and the VAL to Warning at 0900. In addition to strong tremor and sustained explosions, the eruption produced volcanic lightning that was detected by the WWLLN. Around 1100 seismicity decreased and satellite data confirmed that the altitude of the ash emissions had declined to 7.6 km altitude. By 1200 the lower-altitude portion of the ash plume had drifted 125 km E. Significant ash emissions ended by 1330 based on webcam images. The ACC was lowered to Orange and the VAL to Watch at 1440. Satellite images showed extensive pyroclastic debris flows on most of the flanks that extended 1.2-3.3 km from the crater rim.
During 6-13 September elevated surface temperatures continued to be observed in satellite data, seismicity remained elevated with weak but steady tremor, and small, low-frequency earthquakes and small explosions were reported, except on 12 September. On 6 September a low-level ash plume rose to 1.5-1.8 km altitude and drifted SSE. Occasional small and diffuse gas-and-steam emissions at the summit were visible in webcam images. Around 1800 on 13 September seismic tremor amplitudes began to increase, and small explosions were detected in seismic and infrasound data. Incandescent lava at the summit was seen in a webcam image taken at 0134 on 14 September during a period of elevated tremor. No ash emissions were reported during the period of elevated seismicity. Lava fountaining began around 0200, based on webcam images. Satellite-based radar observations showed that the lava fountaining activity led to the growth of a cone in the summit crater, which refilled most of the crater. By 0730 seismicity significantly declined and remained at low levels.
Seismic tremor began to increase around 0900 on 15 September and rapidly intensified. An explosive eruption began at around 1710, which prompted AVO to raise the ACC to Red and the VAL to Warning. Within about 30 minutes ash plumes drifted E below a weather cloud at 8.2 km altitude. The National Weather Service estimated that an ash-rich plume rose as high as 12.8 km altitude and produced volcanic lightning. The upper part of the ash plume detached from the vent around 1830 and drifted E, and was observed over the Gulf of Alaska. Around the same time, seismicity dramatically decreased. Trace ashfall was reported in the community of False Pass (38 km ENE) between 1800-2030 and also in King Cove and nearby marine waters. Activity declined at around 1830 although seismicity remained elevated, ash emissions, and ashfall continued until 2100. Lightning was again detected beginning around 1930, which suggested that ash emissions continued. Ongoing explosions were detected in infrasound data, at a lower level than during the most energetic phase of this event. Lightning was last detected at 2048. By 2124 the intensity of the eruption had decreased, and ash emissions were likely rising to less than 6.7 km altitude. Seismicity returned to pre-eruption levels. On 16 September the ACC was lowered to Orange and the VAL to Watch at 1244; the sulfur dioxide plume that was emitted from the previous eruption event was still visible over the northern Pacific Ocean. Elevated surface temperatures, gas-and-steam emissions from the vent, and new, small lahars were reported on the upper flanks based on satellite and webcam images. Minor deposits were reported on the flanks which were likely the result of collapse of previously accumulated lava near the summit crater.
Elevated seismicity with tremor, small earthquakes, and elevated surface temperatures were detected during 17-23 September. Minor gas-and-steam emissions were visible in webcam images. On 20 September small volcanic debris flows were reported on the upper flanks. On 21 September a small ash deposit was observed on the upper flanks extending to the NE based on webcam images. Seismic tremor increased significantly during 22-23 September. Regional infrasound sensors suggested that low-level eruptive activity was occurring within the summit crater by around 1800 on 23 September. Even though seismicity was at high levels, strongly elevated surface temperatures indicating lava at the surface were absent and no ash emissions were detected; weather clouds at 0.6-4.6 km altitude obscured views. At 0025 on 24 September AVO noted that seismicity continued at high levels and nearly continuous small infrasound signals began, likely from low-level eruptive activity. Strongly elevated surface temperatures were identified in satellite images by 0900 and persisted throughout the day; the higher temperatures along with infrasound and seismic data were consistent with lava erupting at the summit. Around 1700 similarly elevated surface temperatures were detected from the summit in satellite data, which suggested that more vigorous lava fountaining had started. Starting around 1800 low-level ash emissions rose to altitudes less than 4.6 km altitude and quickly dissipated.
Beginning at midnight on 25 September, a series of seismic signals consistent with volcanic flows were recorded on the N side of the volcano. A change in seismicity and infrasound signals occurred around 0535 and at 0540 a significant ash cloud formed and quickly reached 14 km altitude and drifted E along the Alaska Peninsula. The cloud generated at least 150 lightning strokes with thunder that could be heard by people in False Pass. Seismicity rapidly declined to near background levels around 0600. AVO increased the ACC to Red and the VAL to Warning at 0602. The ash cloud detached from the volcano at around 0700, rose to 11.6 km altitude, and drifted ESE. Trace to minor amounts of ashfall were reported by the communities of False Pass, King Cove, Cold Bay, and Sand Point around 0700. Ash emissions continued at lower altitudes of 6-7.6 km altitude at 0820. Small explosions at the vent area continued to be detected in infrasound data and likely represented low-level eruptive activity near the vent. Due to the significant decrease in seismicity and ash emissions the ACC was lowered to Orange and the VAL to Watch at 1234. Radar data showed significant collapses of the crater that occurred on 25 September. Satellite data also showed significant hot, degassing pyroclastic and lahar deposits on all flanks, including more extensive flows on the ENE and WSW sections below two new collapse scarps. Following the significant activity during 24-25 September, only low-level activity was observed. Seismicity decreased notably near the end of the strong activity on 25 September and continued to decrease through the end of the month, though tremor and small earthquakes were still reported. No explosive activity was detected in infrasound data through 2 October. Gas-and-steam emissions rose to 3.7 km altitude, as reported by pilots and seen in satellite images. Satellite data from 26 September showed that significant collapses had occurred at the summit crater and hot, steaming deposits from pyroclastic flows and lahars were present on all the flanks, particularly to the ENE and WSW. A small ash cloud was visible in webcam images on 27 September, likely from a collapse at the summit cone. High elevated surface temperatures were observed in satellite imagery during 27-28 September, which were likely the result of hot deposits on the flanks erupted on 25 September. Minor steaming at the summit crater and from an area on the upper flanks was visible in webcam images on 28 September.
During October, explosion events continued between periods of low activity. Seismicity significantly increased starting at around 2100 on 2 October; around the same time satellite images showed an increase in surface temperatures consistent with lava fountaining. Small, hot avalanches of rock and lava descended an unspecified flank. In addition, a distinct increase in infrasound, seismicity, and lightning detections was followed by an ash plume that rose to 12.2 km altitude and drifted S and E at 0520 on 3 October, based on satellite images. Nighttime webcam images showed incandescence due to lava fountaining at the summit and pyroclastic flows descending the NE flank. AVO reported that a notable explosive eruption started at 0547 and lasted until 0900 on 3 October, which prompted a rise in the ACC to Red and the VAL to Warning. Subsequent ash plumes rose to 6-7.6 km altitude by 0931. At 1036 the ACC was lowered back to Orange and the VAL to Watch since both seismic and infrasound data quieted substantially and were slightly above background levels. Gas-and-steam emissions were observed at the summit, based on webcam images. Trace amounts of ashfall were observed in Cold Bay. Resuspended ash was present at several kilometers altitude near the volcano. During the afternoon, low-level ash plumes were visible at the flanks, which appeared to be largely generated by rock avalanches off the summit crater following the explosive activity. These ash plumes rose to 3 km altitude and drifted W. Trace amounts of ashfall were reported by observers in Cold Bay and Unalaska and flights to these communities were disrupted by the ash cloud. Satellite images taken after the eruption showed evidence of pyroclastic flows and lahar deposits in drainages 2 km down the SW flank and about 3.2 km down the NE flank, and continued erosion of the crater rim. Small explosion craters at the end of the pyroclastic flows on the NE flank were noted for the first time, which may have resulted from gas-and-steam explosions when hot deposits interact with underlying ice.
During 4 October seismicity, including frequent small earthquakes, remained elevated, but was gradually declining. Ash plumes were produced for over eight hours until around 1400 that rose to below 3.7 km altitude. These ash plumes were primarily generated off the sides of the volcano where hot rock avalanches from the crater rim had entered drainages to the SW and NE. Two explosion craters were observed at the base of the NE deposits about 3.2 km from the crater rim. Webcam images showed the explosion craters were a source of persistent ash emissions; occasional collapse events also generated ash. Seismicity remained elevated with sulfur dioxide emissions that had a daily average of more than 1,000 tons per day, and frequent small earthquakes through the end of the month. Frequent elevated surface temperatures were identified in satellite images and gas-and-steam plumes were observed in webcam images, although weather conditions occasionally prevented clear views of the summit. Emissions were robust during 14-16 October and were likely generated by the interaction of hot material and snow and ice. During the afternoon of 21 October a strong gas-and-steam plume rose to 3-4.6 km altitude and extended 40 km WSW, based on satellite images and reports from pilots. On 31 October the ACC was lowered to Yellow and the VAL was lowered to Advisory.
Activity in November was characterized by elevated seismicity with ongoing seismic tremor and small, low-frequency earthquakes, elevated surface temperatures, and gas-and-steam emissions. There was an increase in seismic and infrasound tremor amplitudes starting at 1940 on 2 November. As a result, the ACC was again raised to Orange and the VAL was increased to Watch, although ash was not identified in satellite data. An ash cloud rose to 6.1 km altitude and drifted W according to satellite data at 2000. By 0831 on 3 November ash emissions were no longer visible in satellite images. On 6 and 9 November air pressure sensors detected signals consistent with small explosions. Small explosions were detected in infrasound data consistent with weak Strombolian activity on 19 and 21 November. Seismicity started to decrease on 21 November. On 25 November gas-and-steam emissions were emitted from the vent as well as from a scarp on the NE side of the volcano near the summit. A gas-and-steam plume extended about 50 km SSE and was observed in satellite and webcam images on 26 November. On 28 November small explosions were observed in seismic and local infrasound data and gas-and-steam emissions were visible from the summit and from the upper NE collapse scarp based on webcam images. Possible small explosions were observed in infrasound data on 30 November. Weakly elevated surface temperatures and a persistent gas-and-steam plume from the summit and collapse scarps on the upper flanks. A passing aircraft reported the gas-and-steam plume rose to 3-3.4 km altitude on 30 November, but no significant ash emissions were detected.
Satellite data. MODIS thermal anomaly data provided through MIROVA (Middle InfraRed Observation of Volcanic Activity) showed a strong pulse of thermal activity beginning in July 2023 that continued through November 2023 (figure 48). This strong activity was due to Strombolian explosions and lava fountaining events at the summit crater. According to data from MODVOLC thermal alerts, a total of 101 hotspots were detected near the summit crater in July (11-14, 16-19, 23-24 and 26), August (4, 25-26, and 29), September (5, 12, and 17), and October (3, 4, and 8). Infrared satellite data showed large lava flows descending primarily the northern and SE flanks during the reporting period (figure 49). Sulfur dioxide plumes often exceeded two Dobson Units (DUs) and drifted in different directions throughout the reporting period, based on satellite data from the TROPOMI instrument on the Sentinel-5P satellite (figure 50).
Geologic Background. The symmetrical glacier-covered Shishaldin in the Aleutian Islands is the westernmost of three large stratovolcanoes in the eastern half of Unimak Island. The Aleuts named the volcano Sisquk, meaning "mountain which points the way when I am lost." Constructed atop an older glacially dissected edifice, it is largely basaltic in composition. Remnants of an older edifice are exposed on the W and NE sides at 1,500-1,800 m elevation. There are over two dozen pyroclastic cones on its NW flank, which is covered by massive aa lava flows. Frequent explosive activity, primarily consisting of Strombolian ash eruptions from the small summit crater, but sometimes producing lava flows, has been recorded since the 18th century. A steam plume often rises from the summit crater.
Information Contacts: Alaska Volcano Observatory (AVO), a cooperative program of a) U.S. Geological Survey, 4200 University Drive, Anchorage, AK 99508-4667 USA (URL: https://avo.alaska.edu/), b) Geophysical Institute, University of Alaska, PO Box 757320, Fairbanks, AK 99775-7320, USA, and c) Alaska Division of Geological & Geophysical Surveys, 794 University Ave., Suite 200, Fairbanks, AK 99709, USA (URL: http://dggs.alaska.gov/); MIROVA (Middle InfraRed Observation of Volcanic Activity), a collaborative project between the Universities of Turin and Florence (Italy) supported by the Centre for Volcanic Risk of the Italian Civil Protection Department (URL: http://www.mirovaweb.it/); Hawai'i Institute of Geophysics and Planetology (HIGP) - MODVOLC Thermal Alerts System, School of Ocean and Earth Science and Technology (SOEST), Univ. of Hawai'i, 2525 Correa Road, Honolulu, HI 96822, USA (URL: http://modis.higp.hawaii.edu/); NASA Global Sulfur Dioxide Monitoring Page, Atmospheric Chemistry and Dynamics Laboratory, NASA Goddard Space Flight Center (NASA/GSFC), 8800 Greenbelt Road, Goddard, Maryland, USA (URL: https://so2.gsfc.nasa.gov/); Copernicus Browser, Copernicus Data Space Ecosystem, European Space Agency (URL: https://dataspace.copernicus.eu/browser/).
Ioto
Japan
24.751°N, 141.289°E; summit elev. 169 m
All times are local (unless otherwise noted)
New eruption with discolored water, ejecta, and floating pumice during October-December 2023
Ioto (Iwo-jima), located about 1,200 km S of Tokyo, lies within a 9-km-wide submarine caldera along the Izu-Bonin-Mariana volcanic arc. Previous eruptions date back to 1889 and have consisted of dominantly phreatic explosions, pumice deposits during 2001, and discolored water. A submarine eruption during July through December 2022 was characterized by discolored water, pumice deposits, and gas emissions (BGVN 48:01). This report covers a new eruption during October through December 2023, which consisted of explosions, black ejecta, discolored water, and floating pumice, based on information from the Japan Meteorological Association (JMA), the Japan Coast Guard (JCG), and satellite data.
JMA reported that an eruption had been occurring offshore of Okinahama on the SE side of the island since 21 October, which was characterized by volcanic tremor, according to the Japan Maritime Self-Defense Force (JMSDF) Iwo Jima Air Base (figure 22). According to an 18 October satellite image a plume of discolored water at the site of this new eruption extended NE (figure 23). During an overflight conducted on 30 October, a vent was identified about 1 km off the coast of Okinahama. Observers recorded explosions every few minutes that ejected dark material about 20 m above the ocean and as high as 150 m. Ejecta from the vent formed a black-colored island about 100 m in diameter, according to observations conducted from the air by the Earthquake Research Institute of the University of Tokyo in cooperation with the Mainichi newspaper (figure 24). Occasionally, large boulders measuring more than several meters in size were also ejected. Observations from the Advanced Land Observing Satellite Daichi-2 and Sentinel-2 satellite images also confirmed the formation of this island (figure 23). Brown discolored water and floating pumice were present surrounding the island.
The eruption continued during November. During an overflight on 3 November observers photographed the island and noted that material was ejected 169 m high, according to a news source. Explosions gradually became shorter, and, by the 3rd, they occurred every few seconds; dark and incandescent material were ejected about 800 m above the vent. On 4 November eruptions were accompanied by explosive sounds. Floating, brown-colored pumice was present in the water surrounding the island. There was a brief increase in the number of volcanic earthquakes during 8-14 November and 24-25 November. The eruption temporarily paused during 9-11 November and by 12 November eruptions resumed to the W of the island. On 10 November dark brown-to-dark yellow-green discolored water and a small amount of black floating material was observed (figure 25). A small eruption was reported on 18 November off the NE coast of the island, accompanied by white gas-and-steam plumes (figure 23). Another pause was recorded during 17-19 November, which then resumed on 20 November and continued erupting intermittently. According to a field survey conducted by the National Institute for Disaster Prevention Science and Technology on 19 November, a 30-m diameter crater was visible on the NE coast where landslides, hot water, and gray volcanic ash containing clay have occurred and been distributed previously. Erupted blocks about 10 cm in diameter were distributed about 90-120 m from the crater. JCG made observations during an overflight on 23 November and reported a phreatomagmatic eruption. Explosions at the main vent generated dark gas-and-ash plumes that rose to 200 m altitude and ejected large blocks that landed on the island and in the ocean (figure 26). Discolored water also surrounded the island. The size of the new island had grown to 450 m N-S x 200 m E-W by 23 November, according to JCG.
The eruption continued through 11 December, followed by a brief pause in activity, which then resumed on 31 December, according to JMA. Intermittent explosions produced 100-m-high black plumes at intervals of several minutes to 30 minutes during 1-10 December. Overflights were conducted on 4 and 15 December and reported that the water surrounding the new island was discolored to dark brown-to-dark yellow-green (figure 27). No floating material was reported during this time. In comparison to the observations made on 23 November, the new land had extended N and part of it had eroded away. In addition, analysis by the Geospatial Information Authority of Japan using SAR data from Daichi-2 also confirmed that the area of the new island continued to decrease between 4 and 15 December. Ejected material combined with wave erosion transformed the island into a “J” shape, 500-m-long and with the curved part about 200 m offshore of Ioto. The island was covered with brown ash and blocks, and the surrounding water was discolored to greenish-brown and contained an area of floating pumice. JCG reported from an overflight on 4 December that volcanic ash-like material found around the S vent on the NE part of the island was newly deposited since 10 November (figure 28). By 15 December the N part of the “J” shaped island had separated and migrated N, connecting to the Okinahama coast and the curved part of the “J” had eroded into two smaller islands (figure 27).
References. Ukawa, M., Fujita, E., Kobayashi, T., 2002, Recent volcanic activity of Iwo Jima and the 2001 eruption, Monthly Chikyu, Extra No. 39, 157-164.
Geologic Background. Ioto, in the Volcano Islands of Japan, lies within a 9-km-wide submarine caldera. The volcano is also known as Ogasawara-Iojima to distinguish it from several other "Sulfur Island" volcanoes in Japan. The triangular, low-elevation, 8-km-long island narrows toward its SW tip and has produced trachyandesitic and trachytic rocks that are more alkalic than those of other volcanoes in this arc. The island has undergone uplift for at least the past 700 years, accompanying resurgent doming of the caldera; a shoreline landed upon by Captain Cook's surveying crew in 1779 is now 40 m above sea level. The Motoyama plateau on the NE half of the island consists of submarine tuffs overlain by coral deposits and forms the island's high point. Many fumaroles are oriented along a NE-SW zone cutting through Motoyama. Numerous recorded phreatic eruptions, many from vents on the W and NW sides of the island, have accompanied the uplift.
Information Contacts: Japan Meteorological Agency (JMA), 1-3-4 Otemachi, Chiyoda-ku, Tokyo 100-8122, Japan (URL: http://www.jma.go.jp/jma/indexe.html); Japan Coast Guard (JCG) Volcano Database, Hydrographic and Oceanographic Department, 3-1-1, Kasumigaseki, Chiyoda-ku, Tokyo 100-8932, Japan (URL: https://www1.kaiho.mlit.go.jp/GIJUTSUKOKUSAI/kaiikiDB/kaiyo22-2.htm); Copernicus Browser, Copernicus Data Space Ecosystem, European Space Agency (URL: https://dataspace.copernicus.eu/browser/); Asahi, 5-3-2, Tsukiji, Chuo Ward, Tokyo, 104-8011, Japan (URL: https://www.asahi.com/ajw/articles/15048458).
Purace (Colombia) — December 2023 Cite this Report
Purace
Colombia
2.3095°N, 76.3948°W; summit elev. 4650 m
All times are local (unless otherwise noted)
Gas-and-ash emission on 16 November 2023
Puracé, located in Colombia, is a stratovolcano that contains a 500-m-wide summit crater. It is part of the Los Coconucos volcanic chain that is a NW-SE trending group of seven cones and craters. The most recent eruption occurred during March 2022 that was characterized by frequent seismicity and gas-and-steam emissions (BGVN 47:06). This report covers a brief eruption during November 2023 based on monthly reports from the Popayán Observatory, part of the Servicio Geologico Colombiano (SGC).
Activity during November 2022 through November 2023 primarily consisted of seismicity: VT-type events, LP-type events, HB-type events, and TR-type events (table 4). Maximum sulfur dioxide values were measured weekly and ranged from 259-5,854 tons per day (t/d) during November 2022 through April 2023. White gas-and-steam emissions were also occasionally reported.
SGC issued a report on 25 October that noted a significant increase in the number of earthquakes associated with rock fracturing. These earthquakes were located SE of the crater between Puracé and Piocollo at depths of 1-4 km. There were no reported variations in sulfur dioxide values, but SGC noted high carbon dioxide values, compared to those recorded in the first half of 2023.
SGC reported that at 1929 on 16 November the seismic network detected a signal that was possibly associated with a gas-and-ash emission, though it was not confirmed in webcam images due to limited visibility. On 17 November an observer confirmed ash deposits on the N flank. Webcam images showed an increase in degassing both inside the crater and from the NW flank, rising 700 m above the crater.
Table 4. Seismicity at Puracé during November 2022-November 2023. Volcano-tectonic (VT), long-period (LP), hybrid (HB), and tremor (TR) events are reported each month. Courtesy of SGC.
| Month |
Volcano-tectonic |
Long-period |
Hybrid |
Tremor |
| Nov 2022 |
429 |
2,023 |
5 |
831 |
| Dec 2022 |
423 |
1,390 |
9 |
834 |
| Jan 2023 |
719 |
1,622 |
0 |
957 |
| Feb 2023 |
598 |
1,701 |
2 |
1,124 |
| Mar 2023 |
331 |
2,408 |
147 |
607 |
| Apr 2023 |
614 |
4,427 |
33 |
148 |
| May 2023 |
620 |
3,717 |
170 |
109 |
| Jun 2023 |
467 |
3,293 |
86 |
148 |
| Jul 2023 |
1,116 |
5,809 |
183 |
542 |
| Aug 2023 |
692 |
2,927 |
94 |
321 |
| Sep 2023 |
887 |
1,505 |
82 |
848 |
| Oct 2023 |
2,373 |
2,949 |
135 |
692 |
| Nov 2023 |
1,212 |
2,302 |
69 |
293 |
Geologic Background. Puracé is an active andesitic volcano with a 600-m-diameter summit crater at the NW end of the Los Coconucos Volcanic Chain. This volcanic complex includes nine composite and five monogenetic volcanoes, extending from the Puracé crater more than 6 km SE to the summit of Pan de Azúcar stratovolcano. The dacitic massif which the complex is built on extends about 13 km NW-SE and 10 km NE-SW. Frequent small to moderate explosive eruptions reported since 1816 CE have modified the morphology of the summit crater, with the largest eruptions in 1849, 1869, and 1885.
Information Contacts: Servicio Geologico Colombiano (SGC), Diagonal 53 No. 34-53 - Bogotá D.C., Colombia (URL: https://www.sgc.gov.co/volcanes).
Suwanosejima (Japan) — December 2023 Cite this Report
Suwanosejima
Japan
29.638°N, 129.714°E; summit elev. 796 m
All times are local (unless otherwise noted)
Eruption plumes, crater incandescence, and occasional explosions during July-October 2023
Suwanosejima is an 8-km-long island that consists of a stratovolcano and two active summit craters, located in the northern Ryukyu Islands, Japan. Volcanism over the past century has been characterized by Strombolian explosions, ash plumes, and ashfall. The current eruption began in October 2004 and has more recently consisted of frequent eruption plumes, explosions, and incandescent ejecta (BGVN 48:07). This report covers similar activity of ash plumes, explosions, and crater incandescence during July through October 2023 using monthly reports from the Japan Meteorological Agency (JMA) and satellite data.
Thermal activity during the reporting period was relatively low; only one low-power thermal anomaly was detected during mid-July and one during early August, based on a MIROVA (Middle InfraRed Observation of Volcanic Activity) Log Radiative Power graph of the MODIS thermal anomaly data. On two clear weather days, a thermal anomaly was visible in infrared satellite images (figure 81).
Low-level activity was reported at the Otake crater during July and no explosions were detected. Eruption plumes rose as high as 1.8 km above the crater. On 13 July an ash plume rose 1.7 km above the crater rim, based on a webcam image. During the night of the 28th crater incandescence was visible in a webcam image. An eruptive event reported on 31 July produced an eruption plume that rose 2.1 km above the crater. Seismicity consisted of 11 volcanic earthquakes on the W flank, the number of which had decreased compared to June (28) and 68 volcanic earthquakes near the Otake crater, which had decreased from 722 in the previous month. According to observations conducted by the University of Tokyo Graduate School of Science, Kyoto University Disaster Prevention Research Institute, Toshima Village, and JMA, the amount of sulfur dioxide emissions released during the month was 400-800 tons per day (t/d).
Eruptive activity in the Otake crater continued during August and no explosions were reported. An eruptive event produced a plume that rose 1 km above the crater at 1447 on 12 August. Subsequent eruptive events were recorded at 0911 on 16 August, at 1303 on 20 August, and at 0317 on 21 August, which produced ash plumes that rose 1-1.1 km above the crater and drifted SE, SW, and W. On 22 August an ash plume was captured in a webcam image rising 1.4 km above the crater (figure 82). Multiple eruptive events were detected on 25 August at 0544, 0742, 0824, 1424, and 1704, which generated ash plumes that rose 1.1-1.2 km above the crater and drifted NE, W, and SW. On 28 August a small amount of ashfall was observed as far as 1.5 km from the crater. There were 17 volcanic earthquakes recorded on the W flank of the volcano and 79 recorded at the Otake crater during the month. The amount of sulfur dioxide emissions released during the month was 400-800 t/d.
Activity continued at the Otake crater during September. Occasionally, nighttime crater incandescence was observed in webcam images and ashfall was reported. An eruptive event at 1949 on 4 September produced an ash plume that rose 1 km above the crater and drifted SW. On 9 September several eruption events were detected at 0221, 0301, and 0333, which produced ash plumes that rose 1.1-1.4 km above the crater rim and drifted W; continuous ash emissions during 0404-0740 rose to a maximum height of 2 km above the crater rim (figure 83). More eruptive events were reported at 1437 on 10 September, at 0319 on 11 September, and at 0511 and 1228 on 15 September, which generated ash plumes that rose 1-1.8 km above the crater. During 25, 27, and 30 September, ash plumes rose as high as 1.3 km above the crater rim. JMA reported that large blocks were ejected as far as 300 m from the center of the crater. There were 18 volcanic earthquakes detected beneath the W flank and 82 volcanic earthquakes detected near the Otake crater. The amount of sulfur dioxide released during the month ranged from 600 to 1,600 t/d.
Activity during early-to-mid-October consisted of occasional explosions, a total number of 13, and ash plumes that rose as high as 1.9 km above the Otake crater rim on 29 October (figure 84). These explosions are the first to have occurred since June 2023. Continuous ash emissions were reported during 0510-0555 on 1 October. Explosions were recorded at 0304, 2141, and 2359 on 2 October, at 0112 on 3 October, and at 1326 on 6 October, which produced ash plumes that rose as high as 1 km above the crater rim and drifted SW and W. An explosion was noted at 0428 on 3 October, but emission details were unknown. A total of eight explosions were recorded by the seismic network at 1522 on 14 October, at 0337, 0433, 0555, 1008, and 1539 on 15 October, and at 0454 and 0517 on 16 October. Ash plumes from these explosions rose as high as 900 m above the crater and drifted SE. Eruptive events during 25-27 and 29-30 October generated plumes that rose as high as 1.9 km above the crater and drifted SE, S, and SW. Ash was deposited in Toshima village (3.5 km SSW). Eruptive activity occasionally ejected large volcanic blocks as far as 600 m from the crater. Nighttime crater incandescence was visible in webcams. Intermittent ashfall was reported as far as 1.5 km from the crater. There were 43 volcanic earthquakes detected on the W flank during the month, and 184 volcanic earthquakes detected near the Otake crater. The amount of sulfur dioxide emitted ranged between 400 and 900 t/d.
Geologic Background. The 8-km-long island of Suwanosejima in the northern Ryukyu Islands consists of an andesitic stratovolcano with two active summit craters. The summit is truncated by a large breached crater extending to the sea on the E flank that was formed by edifice collapse. One of Japan's most frequently active volcanoes, it was in a state of intermittent Strombolian activity from Otake, the NE summit crater, between 1949 and 1996, after which periods of inactivity lengthened. The largest recorded eruption took place in 1813-14, when thick scoria deposits covered residential areas, and the SW crater produced two lava flows that reached the western coast. At the end of the eruption the summit of Otake collapsed, forming a large debris avalanche and creating an open collapse scarp extending to the eastern coast. The island remained uninhabited for about 70 years after the 1813-1814 eruption. Lava flows reached the eastern coast of the island in 1884. Only about 50 people live on the island.
Information Contacts: Japan Meteorological Agency (JMA), 1-3-4 Otemachi, Chiyoda-ku, Tokyo 100-8122, Japan (URL: http://www.jma.go.jp/jma/indexe.html); MIROVA (Middle InfraRed Observation of Volcanic Activity), a collaborative project between the Universities of Turin and Florence (Italy) supported by the Centre for Volcanic Risk of the Italian Civil Protection Department (URL: http://www.mirovaweb.it/); Hawai'i Institute of Geophysics and Planetology (HIGP) - MODVOLC Thermal Alerts System, School of Ocean and Earth Science and Technology (SOEST), Univ. of Hawai'i, 2525 Correa Road, Honolulu, HI 96822, USA (URL: http://modis.higp.hawaii.edu/); Copernicus Browser, Copernicus Data Space Ecosystem, European Space Agency (URL: https://dataspace.copernicus.eu/browser/).
Etna
Italy
37.748°N, 14.999°E; summit elev. 3357 m
All times are local (unless otherwise noted)
Strombolian explosions, lava fountains, and lava flows during July-August 2023
Etna, located on the Italian island of Sicily, has had documented eruptions dating back to 1500 BCE. Activity typically originates from multiple cones at the summit, where several craters have formed and evolved. The currently active craters are Northeast Crater (NEC), Voragine (VOR), and Bocca Nuova (BN), and the Southeast Crater (SEC); VOR and BN were previously referred to as the “Central Crater”. The original Southeast crater formed in 1978, and a second eruptive site that opened on its SE flank in 2011 was named the New Southeast Crater (NSEC). Another eruptive site between the SEC and NSEC developed during early 2017 and was referred to as the "cono della sella" (saddle cone). The current eruption period began in November 2022 and has been characterized by intermittent Strombolian activity, lava flows, and ash plumes (BGVN 48:08). This report updates activity during July through October 2023, which includes primarily gas-and-steam emissions; during July and August Strombolian explosions, lava fountains, and lava flows were reported, based on weekly and special reports by the Osservatorio Etneo (OE), part of the Catania Branch of Italy's Istituo Nazionale di Geofisica e Vulcanologica (INGV) and satellite data.
Variable fumarolic degassing was reported at all summit craters (BN, VOR, NEC, and SEC) throughout the entire reporting period (table 15). The MIROVA (Middle InfraRed Observation of Volcanic Activity) volcano hotspot detection system based on the analysis of MODIS data showed frequent low-to-moderate power thermal anomalies during the reporting period (figure 399). During mid-August there was a pulse in activity that showed an increase in the power of the anomalies due to Strombolian activity, lava fountains, and lava flows. Infrared satellite imagery captured strong thermal anomalies at the central and southeast summit crater areas (figure 400). Accompanying thermal activity were occasional sulfur dioxide plumes that exceeded 2 Dobson Units (DUs) recorded by the TROPOMI instrument on the Sentinel-5P satellite (figure 401).
Table 15. Summary of activity at the four primary crater areas at the summit of Etna during July-October 2023. Information is from INGV weekly reports.
| Month |
Bocca Nuova (BN) |
Voragine (VOR) |
Northeast Crater (NEC) |
Southeast Crater (SEC) |
| Jul 2023 |
Continuous degassing. |
No observations. |
Weak gas emissions. |
Continuous degassing. Sporadic and weak-to-moderate ash emissions. Strombolian explosions. |
| Aug 2023 |
Continuous degassing. |
No observations. |
No observations. |
Continuous degassing. Occasional ash emissions. Strombolian activity, lava fountaining, and lava flows. |
| Sep 2023 |
Variable degassing. Crater incandescence. |
Weak fumarolic activity. |
Weak fumarolic activity. |
Variable degassing. |
| Oct 2023 |
Continuous degassing. |
Weak fumarolic activity. |
Weak fumarolic activity. |
Continuous degassing. |
Activity during July and August was relatively low and mainly consisted of degassing at the summit craters, particularly at SEC and BN. Cloudy weather prevented clear views of the summit during early July. During the night of 2 July some crater incandescence was visible at SEC. Explosive activity resumed at SEC during 9-10 July, which was characterized by sporadic and weak ash emissions that rapidly dispersed in the summit area (figure 402). INGV reported moderate Strombolian activity began at 2034 on 14 July and was confined to the inside of the crater and fed by a vent located in the E part of SEC. An ash emission was detected at 2037. A new vent opened on 15 July in the SE part of BN and began to produce continuous gas-and-steam emissions. During an inspection carried out on 28 July pulsating degassing, along with audible booms, were reported at two active vents in BN. Vigorous gas-and-steam emissions intermittently generated rings. On rare occasions, fine, reddish ash was emitted from BN1 and resuspended by the gas-and-steam emissions.
Around 2000 on 13 August INGV reported a sudden increase in volcanic tremor amplitude. Significant infrasonic activity coincided with the tremor increase. Incandescent flashes were visible through the cloud cover in webcam images of SEC (figure 403). Strombolian activity at SEC began to gradually intensify starting at 2040 as seismicity continued to increase. The Aviation Color Code (ACC) was raised to Yellow (the second lowest-level on a four-color scale) at 2126 and then to Orange (the second highest-level on a four-color scale) at 2129 due to above-background activity. The activity rapidly transitioned from Strombolian activity to lava fountains around 2333 that rose 300-400 m above the crater (figure 403). Activity was initially focused on the E vent of the crater, but then the vent located above the S flank of the cone also became active. A lava flow from this vent traveled SW into the drainage created on 10 February 2022, overlapping with previous flows from 10 and 21 February 2022 and 21 May 2023, moving between Monte Barbagallo and Monte Frumento Supino (figure 404). The lava flow was 350 m long, oriented NNE-SSW, and descended to an elevation of 2.8 km. Flows covered an area of 300,000 m2 and had an estimated volume of 900,000 m3. The ACC was raised to Red at 2241 based on strong explosive activity and ashfall in Rifugio Sapienza-Piano Vetore at 1.7 km elevation on the S flank. INGV reported that pyroclastic flows accompanied this activity.
Activity peaked between 0240 and 0330 on 14 August, when roughly 5-6 vents erupted lava fountains from the E to SW flank of SEC. The easternmost vents produced lava fountains that ejected material strongly to the E, which caused heavy fallout of incandescent pyroclastic material on the underlying flank, triggering small pyroclastic flows. This event was also accompanied by lightning both in the ash column and in the ash clouds that were generated by the pyroclastic flows. A fracture characterized by a series of collapse craters (pit craters) opened on the upper SW flank of SEC. An ash cloud rose a few kilometers above the crater and drifted S, causing ash and lapilli falls in Rifugio Sapienza and expanding toward Nicolosi, Mascalucia, Catania, and up to Syracuse. Ashfall resulted in operational problems at the Catania airport (50 km S), which lasted from 0238 until 2000. By 0420 the volcanic tremor amplitude values declined to background levels. After 0500 activity sharply decreased, although the ash cloud remained for several hours and drifted S. By late morning, activity had completely stopped. The ACC was lowered to Orange as volcanic ash was confined to the summit area. Sporadic, minor ash emissions continued throughout the day. At 1415 the ACC was lowered to Yellow and then to Green at 1417.
During the night of 14-15 August only occasional flashes were observed, which were more intense during avalanches of material inside the eruptive vents. Small explosions were detected at SEC at 2346 on 14 August and at 0900 on 26 August that each produced ash clouds which rapidly dispersed into the atmosphere (figure 405). According to a webcam image, an explosive event detected at 2344 at SEC generated a modest ash cloud that was rapidly dispersed by winds. The ACC was raised to Yellow at 2355 on 14 August due to increasing unrest and was lowered to Green at 0954 on 15 August.
Activity during September and October was relatively low and mainly characterized by variable degassing from BN and SEC. Intense, continuous, and pulsating degassing was accompanied by roaring sounds and flashes of incandescence at BN both from BN1 and the new pit crater that formed during late July (figure 406). The degassing from the new pit crater sometimes emitted vapor rings. Cloudy weather during 6-8 September prevented observations of the summit craters .
Geologic Background. Mount Etna, towering above Catania on the island of Sicily, has one of the world's longest documented records of volcanism, dating back to 1500 BCE. Historical lava flows of basaltic composition cover much of the surface of this massive volcano, whose edifice is the highest and most voluminous in Italy. The Mongibello stratovolcano, truncated by several small calderas, was constructed during the late Pleistocene and Holocene over an older shield volcano. The most prominent morphological feature of Etna is the Valle del Bove, a 5 x 10 km caldera open to the east. Two styles of eruptive activity typically occur, sometimes simultaneously. Persistent explosive eruptions, sometimes with minor lava emissions, take place from one or more summit craters. Flank vents, typically with higher effusion rates, are less frequently active and originate from fissures that open progressively downward from near the summit (usually accompanied by Strombolian eruptions at the upper end). Cinder cones are commonly constructed over the vents of lower-flank lava flows. Lava flows extend to the foot of the volcano on all sides and have reached the sea over a broad area on the SE flank.
Information Contacts: Sezione di Catania - Osservatorio Etneo, Istituto Nazionale di Geofisica e Vulcanologia (INGV), Sezione di Catania, Piazza Roma 2, 95123 Catania, Italy (URL: http://www.ct.ingv.it/it/); MIROVA (Middle InfraRed Observation of Volcanic Activity), a collaborative project between the Universities of Turin and Florence (Italy) supported by the Centre for Volcanic Risk of the Italian Civil Protection Department (URL: http://www.mirovaweb.it/); NASA Global Sulfur Dioxide Monitoring Page, Atmospheric Chemistry and Dynamics Laboratory, NASA Goddard Space Flight Center (NASA/GSFC), 8800 Greenbelt Road, Goddard MD 20771, USA (URL: https://so2.gsfc.nasa.gov/); Copernicus Browser, Copernicus Data Space Ecosystem, European Space Agency (URL: https://dataspace.copernicus.eu/browser/).
Aira
Japan
31.5772°N, 130.6589°E; summit elev. 1117 m
All times are local (unless otherwise noted)
Explosions, ash plumes, ash fall, and crater incandescence during July-October 2023
Aira caldera, located in the northern half of Kagoshima Bay, Japan, contains the post-caldera Sakurajima volcano. Eruptions typically originate from the Minamidake crater, and since the 8th century, ash deposits have been recorded in the city of Kagoshima (10 km W), one of Kyushu’s largest cities. The Minamidake summit cone and crater has had persistent activity since 1955; the Showa crater on the E flank has also been intermittently active since 2006. The current eruption period began during March 2017 and has recently been characterized by intermittent explosions, eruption plumes, and ashfall (BGVN 48:07). This report updates activity during July through October 2023 and describes explosive events, ash plumes, nighttime crater incandescence, and ashfall, according to monthly activity reports from the Japan Meteorological Agency (JMA) and satellite data.
Thermal activity remained at low levels during this reporting period, according to the MIROVA (Middle InfraRed Observation of Volcanic Activity) system (figure 149). There was a slight increase in the number of anomalies during September through October. Occasional thermal anomalies were visible in infrared satellite images mainly at the Minamidake crater (Vent A is located to the left and Vent B is located to the right) (figure 150).
Table 30. Number of monthly explosive events, days of ashfall, area of ash covered, and sulfur dioxide emissions from Sakurajima’s Minamidake crater at Aira during July-October 2023. Note that smaller ash events are not listed. Ashfall days were measured at Kagoshima Local Meteorological Observatory and ashfall amounts represent material covering all the Kagoshima Prefecture. Data courtesy of JMA monthly reports.
| Month |
Explosive events |
Days of ashfall |
Ashfall amount (g/m2) |
SO2 emissions (tons/day) |
| Jul 2023 |
3 |
0 |
0 |
1,600-3,200 |
| Aug 2023 |
3 |
10 |
7 |
1,800-3,300 |
| Sep 2023 |
3 |
7 |
3 |
1,600-2,300 |
| Oct 2023 |
33 |
8 |
61 |
2,200-4,200 |
JMA reported that during July, there were eight eruptions, three of which were explosion events in the Showa crater. Large blocks were ejected as far as 600 m from the Showa crater. Very small eruptions were occasionally reported at the Minamidake crater. Nighttime incandescence was observed in both the Showa and Minamidake crater. Explosions were reported on 16 July at 2314 and on 17 July at 1224 and at 1232 (figure 151). Resulting eruption plumes rose 700-2,500 m above the crater and drifted N. On 23 July the number of volcanic earthquakes on the SW flank of the volcano increased. A strong Mw 3.1 volcanic earthquake was detected at 1054 on 26 July. The number of earthquakes recorded throughout the month was 545, which markedly increased from 73 in June. No ashfall was observed at the Kagoshima Regional Meteorological Observatory during July. According to a field survey conducted during the month, the daily amount of sulfur dioxide emissions was 1,600-3,200 tons per day (t/d).
There were three eruptions reported at the Minamidake crater during August, each of which were explosive. The explosions occurred on 9 August at 0345, on 13 August at 2205, and on 31 August at 0640, which generated ash plumes that rose 800-2,000 m above the crater and drifted W. There were two eruptions detected at Showa crater; on 4 August at 2150 ejecta traveled 800 m from the Showa crater and associated eruption plumes rose 2.3 km above the crater. The explosion at 2205 on 13 August generated an ash plume that rose 2 km above the crater and was accompanied by large blocks that were ejected 600 m from the Minamidake crater (figure 152). Nighttime crater incandescence was visible in a high-sensitivity surveillance camera at both craters. Seismicity consisted of 163 volcanic earthquakes, 84 of which were detected on the SW flank. According to the Kagoshima Regional Meteorological Observatory there was a total of 7 g/m2 of ashfall over the course of 10 days during the month. According to a field survey, the daily amount of sulfur dioxide emitted was 1,800-3,300 t/d.
During September, four eruptions were reported, three of which were explosion events. These events occurred at 1512 on 9 September, at 0018 on 11 September, and at 2211 on 13 September. Resulting ash plumes generally rose 800-1,100 m above the crater. An explosion produced an ash plume at 2211 on 13 September that rose as high as 1.7 km above the crater. Large volcanic blocks were ejected 600 m from the Minamidake crater. Smaller eruptions were occasionally observed at the Showa crater. Nighttime crater incandescence was visible at the Minamidake crater. Seismicity was characterized by 68 volcanic earthquakes, 28 of which were detected beneath the SW flank. According to the Kagoshima Regional Meteorological Observatory there was a total of 3 g/m2 of ashfall over the course of seven days during the month. A field survey reported that the daily amount of sulfur dioxide emitted was 1,600-2,300 t/d.
Eruptive activity during October consisted of 69 eruptions, 33 of which were described as explosive. These explosions occurred during 4 and 11-21 October and generated ash plumes that rose 500-3,600 m above the crater and drifted S, E, SE, and N. On 19 October at 1648 an explosion generated an ash plume that rose 3.6 km above the crater (figure 153). No eruptions were reported in the Showa crater; white gas-and-steam emissions rose 100 m above the crater from a vent on the N flank. Nighttime incandescence was observed at the Minamidake crater. On 24 October an eruption was reported from 0346 through 0430, which included an ash plume that rose 3.4 km above the crater. Ejected blocks traveled 1.2 km from the Minamidake crater. Following this eruption, small amounts of ashfall were observed from Arimura (4.5 km SE) and a varying amount in Kurokami (4 km E) (figure 154). The number of recorded volcanic earthquakes during the month was 190, of which 14 were located beneath the SW flank. Approximately 61 g/m2 of ashfall was reported over eight days of the month. According to a field survey, the daily amount of sulfur dioxide emitted was 2,200-4,200 t/d.
Geologic Background. The Aira caldera in the northern half of Kagoshima Bay contains the post-caldera Sakurajima volcano, one of Japan's most active. Eruption of the voluminous Ito pyroclastic flow accompanied formation of the 17 x 23 km caldera about 22,000 years ago. The smaller Wakamiko caldera was formed during the early Holocene in the NE corner of the caldera, along with several post-caldera cones. The construction of Sakurajima began about 13,000 years ago on the southern rim and built an island that was joined to the Osumi Peninsula during the major explosive and effusive eruption of 1914. Activity at the Kitadake summit cone ended about 4,850 years ago, after which eruptions took place at Minamidake. Frequent eruptions since the 8th century have deposited ash on the city of Kagoshima, located across Kagoshima Bay only 8 km from the summit. The largest recorded eruption took place during 1471-76.
Information Contacts: Japan Meteorological Agency (JMA), 1-3-4 Otemachi, Chiyoda-ku, Tokyo 100-8122, Japan (URL: http://www.jma.go.jp/jma/indexe.html); MIROVA (Middle InfraRed Observation of Volcanic Activity), a collaborative project between the Universities of Turin and Florence (Italy) supported by the Centre for Volcanic Risk of the Italian Civil Protection Department (URL: http://www.mirovaweb.it/); Copernicus Browser, Copernicus Data Space Ecosystem, European Space Agency (URL: https://dataspace.copernicus.eu/browser/).
Nishinoshima (Japan) — November 2023 Cite this Report
Nishinoshima
Japan
27.247°N, 140.874°E; summit elev. 100 m
All times are local (unless otherwise noted)
Gray emissions during October 2023
Nishinoshima is a small island in the Ogasawara Arc, about 1,000 km S of Tokyo, Japan. It contains prominent submarine peaks to the S, W, and NE. Recorded eruptions date back to 1973, with the current eruption period beginning in October 2022. Eruption plumes and fumarolic activity characterize recent activity (BGVN 48:10). This report covers the end of the eruption for September through October 2023, based on information from monthly reports of the Japan Meteorological Agency (JMA) monthly reports, and satellite data.
No eruptive activity was reported during September 2023, although JMA noted that the surface temperature was slightly elevated compared to the surrounding area since early March 2023. The Japan Coast Guard (JCG) conducted an overflight on 20 September and reported white gas-and-steam plumes rising 3 km above the central crater of the pyroclastic cone, as well as multiple white gas-and-steam emissions emanating from the N, E, and S flanks of the crater to the coastline. In addition, dark reddish brown-to-green discolored water was distributed around almost the entire circumference of the island.
Similar low-level activity was reported during October. Multiple white gas-and-steam emissions rose from the N, E, and S flanks of the central crater of the pyroclastic cone and along the coastline; these emissions were more intense compared to the previous overflight observations. Dark reddish brown-to-green discolored water remained visible around the circumference of the island. On 4 October aerial observations by JCG showed a small eruption consisting of continuous gas-and-steam emissions emanating from the central crater, with gray emissions rising to 1.5 km altitude (figure 129). According to observations from the marine weather observation vessel Keifu Maru on 26 October, white gas-and-steam emissions persisted from the center of the pyroclastic cone, as well as from the NW, SW, and SE coasts of the island for about five minutes. Slightly discolored water was visible up to about 1 km.
Frequent low-to-moderate power thermal anomalies were recorded in the MIROVA graph (Middle InfraRed Observation of Volcanic Activity) during September (figure 130). Occasional anomalies were detected during October, and fewer during November through December. A thermal anomaly was visible in the crater using infrared satellite imagery on 6, 8, 11, 16, 18, 21, and 23 September and 8, 13, 21, 26, and 28 October (figure 131).
Geologic Background. The small island of Nishinoshima was enlarged when several new islands coalesced during an eruption in 1973-74. Multiple eruptions that began in 2013 completely covered the previous exposed surface and continued to enlarge the island. The island is the summit of a massive submarine volcano that has prominent peaks to the S, W, and NE. The summit of the southern cone rises to within 214 m of the ocean surface 9 km SSE.
Information Contacts: Japan Meteorological Agency (JMA), 1-3-4 Otemachi, Chiyoda-ku, Tokyo 100-8122, Japan (URL: http://www.jma.go.jp/jma/indexe.html); MIROVA (Middle InfraRed Observation of Volcanic Activity), a collaborative project between the Universities of Turin and Florence (Italy) supported by the Centre for Volcanic Risk of the Italian Civil Protection Department (URL: http://www.mirovaweb.it/); Copernicus Browser, Copernicus Data Space Ecosystem, European Space Agency (URL: https://dataspace.copernicus.eu/browser/).
Kilauea (United States) — October 2023 Cite this Report
Kilauea
United States
19.421°N, 155.287°W; summit elev. 1222 m
All times are local (unless otherwise noted)
Strong lava fountains, lava flows, and spatter at Halema’uma’u during January-September 2023
Kīlauea is on the island of Hawai’i and overlaps the E flank of the Mauna Loa volcano. Its East Rift Zone (ERZ) has been intermittently active for at least 2,000 years. An extended eruption period began in January 1983 and was characterized by open lava lakes and lava flows from the summit caldera and the East Rift Zone. During May 2018 magma migrated into the Lower East Rift Zone (LERZ) and opened 24 fissures along a 6-km-long NE-trending fracture zone that produced lava flows traveling in multiple directions. As lava emerged from the fissures, the lava lake at Halema'uma'u drained and explosions sent ash plumes to several kilometers altitude (BGVN 43:10).
The current eruption period started during September 2021 and has been characterized by low-level lava effusions in the active Halema’uma’u lava lake (BGVN 48:01). This report covers three notable eruption periods during February, June, and September 2023 consisting of lava fountaining, lava flows, and spatter during January through September 2023 using information from daily reports, volcanic activity notices, and abundant photo, map, and video data from the US Geological Survey's (USGS) Hawaiian Volcano Observatory (HVO).
Activity during January 2023. Small earthquake swarms were recorded on 2 January 2023; increased seismicity and changes in the pattern of deformation were noted on the morning of 5 January. At around 1500 both the rate of deformation and seismicity drastically increased, which suggested magma movement toward the surface. HVO raised the Volcano Alert Level (VAL) to Watch (the second highest level on a four-level scale) and the Aviation Color Code (ACC) to Orange (the second highest color on a four-color scale) at 1520.
Multiple lava fountains and lava effusions from vents in the central eastern portion of the Halema’uma’u crater began on 5 January around 0434; activity was confined to the eastern half of the crater and within the basin of the western half of the crater, which was the focus of the eruption in 2021-2022 (figure 525). Incandescence was visible in webcam images at 1634 on 5 January, prompting HVO to raise the VAL to Warning (the highest level on a four-level scale) and the ACC to Red (the highest color on a four-color scale). Lava fountains initially rose as high as 50 m above the vent at the onset of the eruption (figure 526) but then declined to a more consistent 5-6 m height in the proceeding days. By 1930 that same day, lava had covered most of the crater floor (an area of about 1,200,000 m2) and the lava lake had a depth of 10 m. A higher-elevation island that formed during the initial phase of the December 2020 eruption remained exposed, appearing darker in images, along with a ring of older lava around the lava lake that was active prior to December 2022. Overnight during 5-6 January the lava fountains continued to rise 5 m high, and the lava effusion rate had slowed.
On 6 January at 0815 HVO lowered the VAL to Watch and the ACC to Orange due to the declining effusion rates. Sulfur dioxide emission rates ranged from 3,000-12,500 tonnes per day (t/d), the highest value of which was recorded on 6 January. Lava continued to erupt from the vents during 6-8 January, although the footprint of the active area had shrunk; a similar progression has been commonly observed during the early stages of recent eruptions at Halema’uma’u. On 9 January HVO reported one dominant lava fountain rising 6-7 m high in the E half of the crater. Lava flows built up the margins of the lake, causing the lake to be perched. On 10 January the eastern lava lake had an area of approximately 120,000 m2 that increased to 250,000 m2 by 17 January. During 13-31 January several small overflows occurred along the margins of the E lake. A smaller area of lava was active within the basin in the W half of the crater that had been the focus of activity during 2021-2022. On 19 January just after 0200 a small ooze-out was observed on the crater’s W edge.
Activity during February 2023. Activity continued in the E part of Halema’uma’u crater, as well as in a smaller basin in the W part of the 2021-2022 lava lake (figure 527). The E lava lake contained a single lava fountain and frequent overflows. HVO reported that during the morning of 1 February the large E lava lake began to cool and crust over in the center of the lake; two smaller areas of lava were observed on the N and S sides by the afternoon. The dominant lava fountain located in the S part of the lava lake paused for roughly 45 minutes at 2315 and resumed by midnight, rising 1-2 m. At 0100 on 2 February lava from the S part was effusing across the entire E lava lake area, covering the crusted over portion in the center of the lake and continuing across the majority of the previously measured 250,000 m2 by 0400. A small lava pond near the E lake produced an overflow around 0716 on 2 February. On 3 February some lava crust began to form against the N and E levees, which defined the 250,000 m2 eastern lava lake. The small S lava fountain remained active, rising 1-6 m high during 3-9 February; around 0400 on 5 February occasional bursts doubled the height of the lava fountain.
A large breakout occurred overnight during 2100 on 4 February to 0900 on 5 February on the N part of the crater floor, equal to or slightly larger in size than the E lava lake. A second, smaller lava fountain appeared in the same area of the E lava lake between 0300 and 0700 on 5 February and was temporarily active. This large breakout continued until 7 February. A small, brief breakout was reported in the S of the E lava lake around midnight on 7 February. In the W lake, as well as the smaller lava pond in the central portion of the crater floor, contained several overflows during 7-10 February and intermittent fountaining. Activity at the S small lava pond and the small S lava fountain within the E lake declined during 9-10 February. The lava pond in the central portion of the crater floor had nearly continuous, expansive flows during 10-13 February; channels from the small central lava pond seemed to flow into the larger E lake. During 13-18 February a small lava fountain was observed in the small lava pond in the central portion of the crater floor. Continuous overflows persisted during this time.
Activity in the eastern and central lakes began to decline in the late afternoon of 17 February. By 18 February HVO reported that the lava effusions had significantly declined, and that the eastern and central lakes were no longer erupting. The W lake in the basin remained active but at a greatly reduced level that continued to decline. HVO reported that this decrease in activity is attributed to notable deflationary tilt that began early on the morning of 17 February and lasted until early 19 February. By 19 February the W lake was mostly crusted over although some weak lava flows remained, which continued through 28 February. The sulfur dioxide emission rates ranged 250-2,800 t/d, the highest value of which was recorded on 6 February.
Activity during March 2023. The summit eruption at Halema’uma’u crater continued at greatly reduced levels compared to the previous two months. The E and central vents stopped effusing lava, and the W lava lake remained active with weak lava flows; the lake was mostly crusted over, although slowly circulating lava intermittently overturned the crust. By 6 March the lava lake in the W basin had stopped because the entire surface was crusted over. The only apparent surface eruptive activity during 5-6 March was minor ooze-outs of lava onto the crater floor, which had stopped by 7 March. Several hornitos on the crater floor still glowed through 12 March according to overnight webcam images, but they did not erupt any lava. A small ooze-out of lava was observed just after 1830 in the W lava lake on 8 March, which diminished overnight. The sulfur dioxide emission rate ranged from 155-321 t/d on 21 March. The VAL was lowered to Advisory, and the ACC was lowered to Yellow (the second lowest on a four-color scale) on 23 March due to a pause in the eruption since 7 March.
Activity during April-May 2023. The eruption at Halema’uma’u crater was paused; no lava effusions were visible on the crater floor. Sulfur dioxide emission rates ranged from 75-185 t/d, the highest of which was measured on 22 April. During May and June summit seismicity was elevated compared to seismicity that preceded the activity during January.
Activity during June 2023. Earthquake activity and changes in the patterns of ground deformation beneath the summit began during the evening of 6 June. The data indicated magma movement toward the surface, prompting HVO to raise the VAL to Watch and the ACC to Orange. At about 0444 on 7 June incandescence in Halema’uma’u crater was visible in webcam images, indicating that a new eruption had begun. HVO raised the VAL to Warning and the ACC to Red (the highest color on a four-color scale). Lava flowed from fissures that had opened on the crater floor. Multiple minor lava fountains were active in the central E portion of the Halema’uma’u crater, and one vent opened on the W wall of the caldera (figure 528). The eruptive vent on the SW wall of the crater continued to effuse into the lava lake in the far SW part of the crater (figure 529). The largest lava fountain consistently rose 15 m high; during the early phase of the eruption, fountain bursts rose as high as 60 m. Lava flows inundated much of the crater floor and added about 6 m depth of new lava within a few hours, covering approximately 10,000 m2. By 0800 on 7 June lava filled the crater floor to a depth of about 10 m. During 0800-0900 the sulfur dioxide emission rate was about 65,000 t/d. Residents of Pahala (30 km downwind of the summit) reported minor deposits of fine, gritty ash and Pele’s hair. A small spatter cone had formed at the vent on the SW wall by midday, and lava from the cone was flowing into the active lava lake. Fountain heights had decreased from the onset of the eruption and were 4-9 m high by 1600, with occasional higher bursts. Inflation switched to deflation and summit earthquake activity greatly diminished shortly after the eruption onset.
At 0837 on 8 June HVO lowered the VAL to Watch and the ACC to Orange because the initial high effusion rates had declined, and no infrastructure was threatened. The surface of the lava lake had dropped by about 2 m, likely due to gas loss by the morning of 8 June. The drop left a wall of cooled lava around the margins of the crater floor. Lava fountain heights decreased during 8-9 June but continued to rise to 10 m high. Active lava and vents covered much of the W half of Halema’uma’u crater in a broad, horseshoe-shape around a central, uplifted area (figure 530). The preliminary average effusion rate for the first 24 hours of the eruption was about 150 cubic meters per second, though the estimate did not account for vesiculated lava and variations in crater floor topography. The effusion rate during the very earliest phases of the eruption appeared significantly higher than the previous three summit eruptions based on the rapid coverage of the entire crater floor. An active lava lake, also referred to as the “western lava lake” was centered within the uplifted area and was fed by a vent in the NE corner. Two small active lava lakes were located just SE from the W lava lake and in the E portion of the crater floor.
During 8-9 June the lava in the central lava lake had a thickness of approximately 1.5 m, based on measurements from a laser rangefinder. During 9-12 June the height of the lava fountains decreased to 9 m high. HVO reported that the previously active lava lake in the E part of the crater appeared stagnant during 10-11 June. The surface of the W lake rose approximately 1 m overnight during 11-12 June, likely due to the construction of a levee around it. Only a few small fountains were active during 12-13 June; the extent of the active lava had retreated so that all activity was concentrated in the SW and central parts of Halema’uma’u crater. Intermittent spattering from the vent on the SW wall was visible in overnight webcam images during 13-18 June. On the morning of 14 June a weak lava effusion originated from near the western eruptive vent, but by 15 June there were no signs of continued activity. HVO reported that other eruptive vents in the SW lava lake had stopped during this time, following several days of waning activity; lava filled the lake by about 0.5 m. Lava circulation continued in the central lake and no active lava was reported in the northern or eastern parts of the crater. Around 0800 on 15 June the top of the SW wall spatter cone collapsed, which was followed by renewed and constant spattering from the top vent and a change in activity from the base vent; several new lava flows effused from the top of the cone, as well as from the pre-existing tube-fed flow from its base. Accumulation of lava on the floor resulted in a drop of the central basin relative to the crater floor, allowing several overflows from the SW lava lake to cascade into the basin during the night of 15 June into the morning of 16 June.
Renewed lava fountaining was reported at the eruptive vent on the SW side of the crater during 16-19 June, which effused lava into the far SW part of the crater. This activity was described as vigorous during midday on 16 June; a group of observatory geologists estimated that the lava was consistently ejected at least 10 m high, with some spatter ejected even higher and farther. Deposits from the fountain further heightened and widened the spatter cone built around the original eruptive vent in the lower section of the crater wall. Multiple lava flows from the base of the cone were fed into the SW lava lake and onto the southwestern-most block from the 2018 collapse within Halema’uma’u on 17 June (figure 531); by 18 June they focused into a single flow feeding into the SW lava lake. On the morning of 19 June a second lava flow from the base of the eruptive cone advanced into the SW lava lake.
Around 1600 on 19 June there was a rapid decline in lava fountaining and effusion at the eruptive vent on the SW side of the crater; vent activity had been vigorous up to that point (figure 532). Circulation in the lava lake also slowed, and the lava lake surface dropped by several meters. Overnight webcam images showed some previously eruptive lava still flowing onto the crater floor, which continued until those flows began to cool. By 21 June no lava was erupting in Halema’uma’u crater. Overnight webcam images during 29-30 June showed some incandescence from previously erupted lava flows as they continued to cool. Seismicity in the crater declined to low levels. Sulfur dioxide emission rates ranged 160-21,000 t/d throughout the month, the highest measurement of which was recorded on 8 June. On 30 June the VAL was lowered to Advisory (the second level on a four-level scale) and the ACC was lowered to Yellow. Gradual inflation was detected at summit tiltmeters during 19-30 June.
Activity during July-August 2023. During July, the eruption paused; no lava was erupting in Halema’uma’u crater. Nighttime webcam images showed some incandescence from previously erupted lava as it continued to cool on the crater floor. During the week of 14 August HVO reported that the rate in seismicity increased, with 467 earthquakes of Mw 3.2 and smaller occurring. Sulfur dioxide emission rates remained low, ranging from 75-86 t/d, the highest of which was recorded on 10 and 15 August. On 15 August beginning at 0730 and lasting for several hours, a swarm of approximately 50 earthquakes were detected at a depth of 2-3 km below the surface and about 2 km long directly S of Halema’uma’u crater. HVO reported that this was likely due to magma movement in the S caldera region. During 0130-0500 and 1700-2100 on 21 August two small earthquake swarms of approximately 20 and 25 earthquakes, respectively, occurred at the same location and at similar depths. Another swarm of 50 earthquakes were recorded during 0430-0830 on 23 August. Elevated seismicity continued in the S area through the end of the month.
Activity during September 2023. Elevated seismicity persisted in the S summit with occasional small, brief seismic swarms. Sulfur dioxide measurements were relatively low and were 70 t/d on 8 September. About 150 earthquakes occurred during 9-10 September, and tiltmeter and Global Positioning System (GPS) data showed inflation in the S portion of the crater.
At 0252 on 10 September HVO raised the VAL to Watch and the ACC to Orange due to increased earthquake activity and changes in ground deformation that indicated magma moving toward the surface. At 1515 the summit eruption resumed in the E part of the caldera based on field reports and webcam images. Fissures opened on the crater floor and produced multiple minor lava fountains and flows (figure 533). The VAL and ACC were raised to Warning and Red, respectively. Gas-and-steam plumes rose from the fissures and drifted downwind. A line of eruptive vents stretched approximately 1.4 km from the E part of the crater into the E wall of the down dropped block by 1900. The lava fountains at the onset of the eruption had an estimated 50 m height, which later rose 20-25 m high. Lava erupted from fissures on the down dropped block and expanded W toward Halema’uma’u crater. Data from a laser rangefinder recorded about 2.5 m thick of new lava added to the W part of the crater. Sulfur dioxide emissions were elevated in the eruptive area during 1600-1500 on 10 September, measuring at least 100,000 t/d.
At 0810 on 11 September HVO lowered the VAL and ACC back to Watch and Orange due to the style of eruption and the fissure location had stabilized. The initial extremely high effusion rates had declined (but remained at high levels) and no infrastructure was threatened. An eruption plume, mainly comprised of sulfur dioxide and particulates, rose as high as 3 km altitude. Several lava fountains were active on the W side of the down dropped block during 11-15 September, while the easternmost vents on the down dropped block and the westernmost vents in the crater became inactive on 11 September (figure 534). The remaining vents spanned approximately 750 m and trended roughly E-W. The fed channelized lava effusions flowed N and W into Halema’uma’u. The E rim of the crater was buried by new lava flows; pahoehoe lava flows covered most of the crater floor except areas of higher elevation in the SW part of the crater. The W part of the crater filled about 5 m since the start of the eruption, according to data from a laser rangefinder during 11-12 September. Lava fountaining continued, rising as high as 15 m by the morning of 12 September. During the morning of 13 September active lava flows were moving on the N and E parts of the crater. The area N of the eruptive vents that had active lava on its surface became perched and was about 3 m higher than the surrounding ground surface. By the morning of 14 September active lava was flowing on the W part of the down dropped block and the NE parts of the crater. The distances of the active flows progressively decreased. Spatter had accumulated on the S (downwind) side of the vents, forming ramparts about 20 m high.
Vigorous spattering was restricted to the westernmost large spatter cone with fountains rising 10-15 m high. Minor spattering occurred within the cone to the E of the main cone, but HVO noted that the fountains remained mostly below the rim of the cone. Lava continued to effuse from these cones and likely from several others as well, traveled N and W, confined to the W part of the down-dropped block and the NE parts of Halema’uma’u. Numerous ooze-outs of lava were visible over other parts of the crater floor at night. Laser range-finder measurements taken of the W part of the crater during 14-15 September showed that lava filled the crater by 10 m since the start of the eruption. Sulfur dioxide emissions remained elevated after the onset of the eruption, ranging 20,000-190,000 t/d during the eruption activity, the highest of which occurred on 10 September.
Field crews observed the eruptive activity on 15 September; they reported a notable decrease or stop in activity at several vents. Webcam images showed little to no fountaining since 0700 on 16 September, though intermittent spattering continued from the westernmost large cone throughout the night of 15-16 September. Thermal images showed that lava continued to flow onto the crater floor. On 16 September HVO reported that the eruption stopped around 1200 and that there was no observable activity anywhere overnight or on the morning of 17 September. HVO field crews reported that active lava was no longer flowing onto Halema’uma’u crater floor and was restricted to a ponded area N of the vents on the down dropped block. They reported that spattering stopped around 1115 on 16 September. Nighttime webcam images showed some incandescence on the crater floor as lava continued to cool. Field observations supported by geophysical data showed that eruptive tremor in the summit region decreased over 15-16 September and returned to pre-eruption levels by 1700 on 16 September. Sulfur dioxide emissions were measured at a rate of 800 t/d on 16 September while the eruption was waning, and 200 t/d on 17 September, which were markedly lower compared to measurements taken the previous week of 20,000-190,000 t/d.
Geologic Background. Kilauea overlaps the E flank of the massive Mauna Loa shield volcano in the island of Hawaii. Eruptions are prominent in Polynesian legends; written documentation since 1820 records frequent summit and flank lava flow eruptions interspersed with periods of long-term lava lake activity at Halemaumau crater in the summit caldera until 1924. The 3 x 5 km caldera was formed in several stages about 1,500 years ago and during the 18th century; eruptions have also originated from the lengthy East and Southwest rift zones, which extend to the ocean in both directions. About 90% of the surface of the basaltic shield volcano is formed of lava flows less than about 1,100 years old; 70% of the surface is younger than 600 years. The long-term eruption from the East rift zone between 1983 and 2018 produced lava flows covering more than 100 km2, destroyed hundreds of houses, and added new coastline.
Information Contacts: Hawaiian Volcano Observatory (HVO), U.S. Geological Survey, PO Box 51, Hawai'i National Park, HI 96718, USA (URL: http://hvo.wr.usgs.gov/).
Tinakula (Solomon Islands) — December 2023 Cite this Report
Tinakula
Solomon Islands
10.386°S, 165.804°E; summit elev. 796 m
All times are local (unless otherwise noted)
Continued lava flows and thermal activity during June through November 2023
Tinakula is a remote 3.5 km-wide island in the Solomon Islands, located 640 km ESE of the capital, Honiara. The current eruption period began in December 2018 and has more recently been characterized by intermittent lava flows and thermal activity (BGVN 48:06). This report covers similar activity during June through November 2023 using satellite data.
During clear weather days (20 July, 23 September, 23 October, and 12 November), infrared satellite imagery showed lava flows that mainly affected the W side of the island and were sometimes accompanied by gas-and-steam emissions (figure 54). The flow appeared more intense during July and September compared to October and November. According to the MODVOLC thermal alerts, there were a total of eight anomalies detected on 19 and 21 July, 28 and 30 October, and 16 November. Infrared MODIS satellite data processed by MIROVA (Middle InfraRed Observation of Volcanic Activity) detected a small cluster of thermal activity occurring during late July, followed by two anomalies during August, two during September, five during October, and five during November (figure 55).
Geologic Background. The small 3.5-km-wide island of Tinakula is the exposed summit of a massive stratovolcano at the NW end of the Santa Cruz islands. It has a breached summit crater that extends from the summit to below sea level. Landslides enlarged this scarp in 1965, creating an embayment on the NW coast. The Mendana cone is located on the SE side. The dominantly andesitic volcano has frequently been observed in eruption since the era of Spanish exploration began in 1595. In about 1840, an explosive eruption apparently produced pyroclastic flows that swept all sides of the island, killing its inhabitants. Recorded eruptions have frequently originated from a cone constructed within the large breached crater. These have left the upper flanks and the steep apron of lava flows and volcaniclastic debris within the breach unvegetated.
Information Contacts: MIROVA (Middle InfraRed Observation of Volcanic Activity), a collaborative project between the Universities of Turin and Florence (Italy) supported by the Centre for Volcanic Risk of the Italian Civil Protection Department (URL: http://www.mirovaweb.it/); Hawai'i Institute of Geophysics and Planetology (HIGP) - MODVOLC Thermal Alerts System, School of Ocean and Earth Science and Technology (SOEST), Univ. of Hawai'i, 2525 Correa Road, Honolulu, HI 96822, USA (URL: http://modis.higp.hawaii.edu/); Copernicus Browser, Copernicus Data Space Ecosystem, European Space Agency (URL: https://dataspace.copernicus.eu/browser/).
Search Bulletin Archive by Publication Date
Select a month and year from the drop-downs and click "Show Issue" to have that issue displayed in this tab.
The default month and year is the latest issue available.
Bulletin of the Global Volcanism Network - Volume 43, Number 09 (September 2018)
Alaid (Russia)
Small ash plume reported on 21 August 2018
Fournaise, Piton de la (France)
One-day eruptive events in April and July; 5-week eruption 27 April-1 June 2018
Great Sitkin (United States)
Small phreatic explosions in June and August 2018; ash deposit on snow near summit
Negra, Sierra (Ecuador)
Fissure opens on NNE caldera rim 26 June 2018, NW-flank lava flows reach the sea
Nishinoshima (Japan)
Quiescence interrupted by brief lava flow emission and small explosions in July 2018
Rincon de la Vieja (Costa Rica)
Intermittent weak phreatic explosions during January-March and July-August 2018
Semeru (Indonesia)
Small ash plumes in February, April, July, and August 2018; persistent thermal hotspot in the crater
Sinabung (Indonesia)
No significant ash plumes seen after 22 June 2018; minor ash in early July
Telica (Nicaragua)
Explosions on 21 June and 15 August 2018; local ashfall from June event
Turrialba (Costa Rica)
Ongoing variable ash emissions and crater incandescence through August 2018
Alaid
Russia
50.861°N, 155.565°E; summit elev. 2285 m
All times are local (unless otherwise noted)
Small ash plume reported on 21 August 2018
Sporadic ash and gas-and-ash plumes and strong thermal anomalies were reported from Alaid, in Russia's Kurile Islands, between 29 September 2015 and 30 September 2016 (figure 8). The Kamchatka Volcanic Eruptions Response Team (KVERT), which monitors the volcano, interpreted the thermal anomalies as Strombolian activity and a lava flow (BGVN 42:04). The current report summarizes activity during October 2016 through August 2018.
According to KVERT weekly reports, the Aviation Color Code for Alaid was Green (Volcano is in normal, non-eruptive state) throughout the reporting period. The only reported activity was from the Tokyo Volcanic Ash Advisory Center, which reported that on 21 August 2018, an ash plume identified in Himawari-8 satellite images rose to an altitude of 2.7 km (about 500 m above the summit) and drifted SE. The plume was clearly visible on imagery starting at 0830 Japan Standard Time (UTC + 9 hours), and remained noticeable for at least 4 hours. There were no other satellite or ground-based observations of this activity.
Geologic Background. The highest and northernmost volcano of the Kuril Islands, Alaid is a symmetrical stratovolcano when viewed from the north, but has a 1.5-km-wide summit crater that is breached open to the south. This basaltic to basaltic andesite volcano is the northernmost of a chain constructed west of the main Kuril archipelago. Numerous pyroclastic cones are present the lower flanks, particularly on the NW and SE sides, including an offshore cone formed during the 1933-34 eruption. Strong explosive eruptions have occurred from the summit crater beginning in the 18th century. Reports of eruptions in 1770, 1789, 1821, 1829, 1843, 1848, and 1858 were considered incorrect by Gorshkov (1970). Explosive eruptions in 1790 and 1981 were among the largest reported in the Kuril Islands.
Information Contacts: Tokyo Volcanic Ash Advisory Center (VAAC), 1-3-4 Otemachi, Chiyoda-ku, Tokyo, Japan (URL: http://ds.data.jma.go.jp/svd/vaac/data/); Kamchatka Volcanic Eruptions Response Team (KVERT), Far Eastern Branch, Russian Academy of Sciences, 9 Piip Blvd., Petropavlovsk-Kamchatsky, 683006, Russia (URL: http://www.kscnet.ru/ivs/kvert/); Institute of Volcanology and Seismology, Far Eastern Branch, Russian Academy of Sciences (IVS FEB RAS), 9 Piip Blvd., Petropavlovsk-Kamchatsky 683006, Russia (URL: http://www.kscnet.ru/ivs/eng/); Himawari-8 Real-time Web, developed by the NICT Science Cloud project in NICT (National Institute of Information and Communications Technology), Japan, in collaboration with JMA (Japan Meteorological Agency) and CEReS (Center of Environmental Remote Sensing, Chiba University) (URL: https://himawari8.nict.go.jp/).
Piton de la Fournaise (France) — September 2018 Cite this Report
Piton de la Fournaise
France
21.244°S, 55.708°E; summit elev. 2632 m
All times are local (unless otherwise noted)
One-day eruptive events in April and July; 5-week eruption 27 April-1 June 2018
Short pulses of intermittent eruptive activity have characterized Piton de la Fournaise, the large basaltic shield volcano on Reunion Island in the western Indian Ocean, for several thousand years. The most recent episode occurred during 14 July-28 August 2017 with a 450-m-long fissure on the S flank inside the Enclos Fouqué caldera about 850 m W of Château Fort. Three eruptive episodes occurred during March-August 2018, the period covered in this report; two lasted for one day each on the N flank in April and July, and one lasting from late April through May located on the S flank. Information is provided primarily by the Observatoire Volcanologique du Piton de la Fournaise (OVPF) as well as satellite instruments.
The first of three eruptive events during March-August 2018 occurred during 3-4 April and was a 1-km-long fissure that opened in seven segments with two eruptive vents. It was located on the N flank of the central cone, just S of the Nez Coupé de Sainte Rose on the rim of the caldera. A longer lasting eruptive event began on 27 April and was located in the cratère Rivals area on the S flank of the central cone. The main fissure had three eruptive vents initially, only one of which produced lava that flowed in tunnels away from the site toward the S rim of the Enclos Fouqué caldera. The longest flow reached 3 km in length and set fires at the base of the rampart rim of the caldera. Flow activity gradually decreased throughout May, and seismic tremor ceased, indicating the end of the event, on 1 June 2018. A third, brief event on 13 July 2018 produced four fissures with 20-m-high incandescent lava and aa flows that traveled several hundred meters across the NNW flank of the central cone, covering a large section of the most popular hiking trail to the summit. The event only lasted for about 18 hours but caused significant geomorphologic change as the first flow activity in that area in several hundred years.
The MIROVA plot of thermal energy from 6 February-1 September 2018 clearly shows two of the three eruptive events that took place during that period. The 27 April to 1 June event produced an initial very strong thermal signature that decreased throughout May. Cooling after the flow ceased continued for most of June. The one-day eruptive event on 13 July was also recorded, but the similarly brief event on 3-4 April was not captured in the thermal data (figure 126).
Eruptive event of 3-4 April 2018. Minor inflation and seismicity were intermittent from the end of August 2017 when the last eruptive episode ended. Significant seismic activity around the summit resumed on 23 March 2018 and accelerated through the end of the month. Inflation continued throughout March as well. A change of composition was detected in the summit fumaroles on 23 March 2018; the fluids were enriched in CO2 and SO2. Beginning on 3 April around 0550 local time, OVPF reported a seismic swarm and deformation consistent with magma rising towards the surface. Seismic tremor began around 1040 in an area on the N flank near the Nez Coupé de Sainte Rose. The tremor intensity continued to increase throughout the day; OVPF visually confirmed the eruption around 1150 in the morning on the upper part of the N flank (figure 127).
A helicopter overflight in mid-afternoon revealed a 1-km-long fissure that had opened in seven distinct segments; lava fountains emerged from two of the segments. The last active segment was just below the rampart of the Nez Coupé de Sainte Rose (figure 128). Both seismic and surface eruptive activity stopped abruptly the following day at 0400.
Eruptive event of 27 April-1 June 2018. OVPF reported 2.5 cm of inflation in the 15 days after the 3-4 April eruption. Seismic activity resumed at the base of the summit area on 21 April, and a new seismic swarm began at 2015 local time on 27 April. This was followed three hours later by tremor activity indicating the beginning of a new eruptive event from fissures that opened on the S flank in the area of cratère Rivals (figure 129). Four fissures opened; one on each side of the crater and one cutting across it were initially active, but activity moved the next morning to a fourth fissure just downstream from Rivals crater and extended for less than 300 m. Fountains of lava rose to 30 m during a morning overflight on 28 April. Several streams of lava quickly coalesced into a single flow heading S towards the rampart at the rim of the Enclos Fouqué (figure 130). By 0830 on 28 April the flow was less than 300 m from the rim and had destroyed an OVPF seismic station and a GPS station. The OMI instrument on the Aura satellite recorded a significant SO2 plume from the event on 28 April (figure 131).
Tremor activity decreased throughout the day on 28 April while the flow continued. The surface flow rate was measured initially at 8-15 m3 per second; it had slowed to 3-7 m3 per second by late that afternoon. Three active vents were observed on the morning of 29 April that continued the next day with fountains rising about 15 m (figure 132). A small cone (less than 5 m high) had grown around the southernmost vent and the larger middle vent contained a small lava lake. Visible lava was flowing only from the middle vent. The flow consisted of three branches; the two spreading to the E were less than 150 m long while the third flow traveled W past the E Cassian crater and had reached 1.2 km in length by 1020 on 30 April. On 30 April OVPF observed a flow from the previous day that had traveled 2.6 km, reaching the foot of the S edge of the l'Enclos Fouqué rampart.
OVPF noted on 2 May 2018 that the intensity of volcanic tremor remained stable, slight deflation was measured, and the surface flow rate was estimated from satellite data at 1-3 m3 per second. Field observations during the afternoon of 3 May indicated that most activity was occurring from the central vent which had grown into a small pyroclastic cone with incandescent ejecta and gas emissions (figure 133). A well-developed lava tunnel had a number of roof breakouts.
Field reconnaissance during 6-7 May confirmed that most of the activity was concentrated at the central cone with incandescent ejecta rising less than 10 m from the top, and the only source of lava was enclosed in a tunnel. The front of the flow was still active with numerous fires reported at the base of the rampart at the rim of the Enclos Fouqué. The farthest upstream cone was still active, but weak with only occasional bursts of incandescent ejecta. By 10 May the intensity of the volcanic tremor had stabilized at a low level. Two cones remained active, the upstream cone had incandescent ejections rising 10-20 m high. Lava was contained in tunnels near the cones but was exposed below the Piton de Bert (figure 134). The frontal lobe of the flow was located 3 km from the eruptive site, downstream of Piton de Bert (figure 135) at the base of the rampart rim of the Enclos. Numerous fires continued at the base of the rampart due to fresh flows (figure 136).
A minor spike in seismicity was recorded on 15 May 2018; at the same time inflation resumed underneath the caldera. The smaller, farthest upstream cone was the most active on 16 May, with 20-30 m high ejecta. A webcam view on 24 May showed that the vent on the larger pyroclastic cone was nearly closed, and that flow activity was largely contained in tunnels. Field observations that day also confirmed the overall decrease in activity; only a single incandescent zone in the lava field near the vent was observed at nightfall, although persistent degassing continued (figure 137).
An overflight on 29 May confirmed the decreasing flow activity and continued inflation. Only rare tongues of lava could be observed in the flow field. The flow front had not progressed eastward for the previous 15 days. The main cone remained open at the top with a small eruptive vent less than 5 m in diameter. Small collapses and slumps were visible on the outer flanks of the cone (figure 138). The height of the main cone was estimated at 22-25 m on 31 May and the second vent was observed to be completely closed off. OVPF reported the end of the eruption at 1430 on 1 June 2018 based on the cessation of seismic tremor (figure 139). The MODVOLC thermal alert system recorded multiple thermal alerts from 27 April through 29 May.
Eruptive event of 13 July 2018. Throughout June 2018, very little activity was reported; only 23 shallow seismic events were recorded during the month and no significant deformation was measured by the OVPF deformation network. OVPF reported that inflation resumed around 1 July. A sharp increase in seismicity was observed beginning at 2340 local time on 12 July followed by a seismic swarm and rapid deformation around midnight. Tremor activity was recorded beginning about 0330 on 13 July and located on the N flank. The first images of the eruption were visible in a webcam at around 0430. Four eruptive fissures were observed in an overflight that morning around 0800 that opened over a 500-m-long zone, spreading from upstream of la Chapelle de Rosemont towards Formica Leo. Incandescent ejecta rose less than 20 m and the aa lava had flowed about 200 m from the fissures (figures 140 and 142). The lava flow propagation rate was estimated at about 6 m per minute during the first hour of activity. Thereafter, the rate continued to decrease to less than 1 m per minute at the end of the eruption. After a progressive decrease of tremor, and about 3 hours of "gas flushes" that are typically observed at the end of Piton de la Fournaise eruptions (according to OVPF), the eruption stopped on 13 July at 2200 local time. Both MIROVA and MODVOLC recorded thermal anomalies from the brief one-day event (figure 126).
The 13 July 2018 eruption lasted about 18 hours and produced about 0.3 million m3 of lava. Lava flows covered more than 400 m of the popular hiking trail leading to the summit (figure 142 and 143) and almost completely filled the Chapelle de Rosemont (figure 144), an old vent and a characteristic feature within the Enclos Fouqué landscape that was first described in reports of the early volcano expeditions at the end of the 18th century. This area of the volcano on the NNW flank had not experienced active eruptive events for at least the past 400 years. Despite the low volume of lava emitted and its short duration, this event significantly changed the geomorphology of the area, which was quite well known and popular with visitors. Inflation resumed after the eruptive event of 13 July and a brief pulse of seismic activity was reported by OVPF on 26 July. They noted on 13 August that after about a month of inflation, seismicity and inflation both ceased.
Geologic Background. Piton de la Fournaise is a massive basaltic shield volcano on the French island of Réunion in the western Indian Ocean. Much of its more than 530,000-year history overlapped with eruptions of the deeply dissected Piton des Neiges shield volcano to the NW. Three scarps formed at about 250,000, 65,000, and less than 5,000 years ago by progressive eastward slumping, leaving caldera-sized embayments open to the E and SE. Numerous pyroclastic cones are present on the floor of the scarps and their outer flanks. Most recorded eruptions have originated from the summit and flanks of Dolomieu, a 400-m-high lava shield that has grown within the youngest scarp, which is about 9 km wide and about 13 km from the western wall to the ocean on the E side. More than 150 eruptions, most of which have produced fluid basaltic lava flows, have occurred since the 17th century. Only six eruptions, in 1708, 1774, 1776, 1800, 1977, and 1986, have originated from fissures outside the scarps.
Information Contacts: Observatoire Volcanologique du Piton de la Fournaise (OVPF), Institut de Physique du Globe de Paris, 14 route nationale 3, 27 ème km, 97418 La Plaine des Cafres, La Réunion, France (URL: http://www.ipgp.fr/fr); MIROVA (Middle InfraRed Observation of Volcanic Activity), a collaborative project between the Universities of Turin and Florence (Italy) supported by the Centre for Volcanic Risk of the Italian Civil Protection Department (URL: http://www.mirovaweb.it/); Hawai'i Institute of Geophysics and Planetology (HIGP) - MODVOLC Thermal Alerts System, School of Ocean and Earth Science and Technology (SOEST), Univ. of Hawai'i, 2525 Correa Road, Honolulu, HI 96822, USA (URL: http://modis.higp.hawaii.edu/); NASA Goddard Space Flight Center (NASA/GSFC), Global Sulfur Dioxide Monitoring Page, Atmospheric Chemistry and Dynamics Laboratory, 8800 Greenbelt Road, Goddard, Maryland, USA (URL: https://so2.gsfc.nasa.gov/).
Great Sitkin (United States) — September 2018 Cite this Report
Great Sitkin
United States
52.076°N, 176.13°W; summit elev. 1740 m
All times are local (unless otherwise noted)
Small phreatic explosions in June and August 2018; ash deposit on snow near summit
Episodic recent and historic volcanic activity has been reported at Great Sitkin, located about 40 km NE of the community of Adak in the Aleutian Islands. Prior to the recent 2018 activity, the last confirmed eruption in 1974 produced at least one ash cloud that likely exceeded an altitude of 3 km (figures 1 and 2). This eruption extruded a lava dome that partially destroyed an existing dome from a 1945 eruption. Most recently, a small steam explosion was reported on 10 June 2018. In response, the Alaska Volcano Observatory (AVO) raised the Aviation Color Code (ACC) to Yellow (Advisory) from the previous Green (Normal).
AVO had previously reported that a seismic swarm had been detected beginning in late July 2016 and continuing through December 2017. Steam from the crater was also observed during this time period, in late November 2017 (figure 2). The seismicity was characterized by earthquakes typically less than magnitude 1.0 and at depths from near the summit to 30 km below sea level. Most earthquakes were in one of two clusters, beneath the volcano's summit or just offshore the NW coast of the island. Possible explosion signals were observed in seismic data on 10 January and 21 July 2017, but no confirmed emissions were observed locally or detected in infrasound data or satellite imagery.
The most recent eruption at Great Sitkin produced a small steam explosion which was detected in seismic data at 1139 local time on 10 June 2018 (figure 3). The explosion was followed by seismic activity which began diminishing after 24 hours, and by 15-16 June had returned to background levels.
Due to heavy cloud cover on 10 June 2018, satellite views were obscured. Subsequent satellite data collected on 11 June showed an ash deposit on the surface of the snow extending to about 2 km SW from a vent in the summit crater (figure 4). Minor changes in the vicinity of the summit crater were observed from satellite data, including possible fumaroles north of the main crater. On 17 June an aerial photograph showed minor steaming at the vent (figure 5).
Another small phreatic explosion was observed in seismic data at 1105 local time on 11 August. Small local earthquakes preceded the event but were not recorded following the explosion. The event is similar to three other phreatic explosions that have occurred over the past 2 years.
Geologic Background. The Great Sitkin volcano forms much of the northern side of Great Sitkin Island. A younger volcano capped by a small, 0.8 x 1.2 km ice-filled summit caldera was constructed within a large late-Pleistocene or early Holocene scarp formed by massive edifice failure that truncated an older edifice and produced a submarine debris avalanche. Deposits from this and an even older debris avalanche from a source to the south cover a broad area of the ocean floor north of the volcano. The summit lies along the eastern rim of the younger collapse scarp. Deposits from an earlier caldera-forming eruption of unknown age cover the flanks of the island to a depth up to 6 m. The small younger caldera was partially filled by lava domes emplaced in 1945 and 1974, and five small older flank lava domes, two of which lie on the coastline, were constructed along northwest- and NNW-trending lines. Hot springs, mud pots, and fumaroles occur near the head of Big Fox Creek, south of the volcano. Eruptions have been recorded since the late-19th century.
Information Contacts: Alaska Volcano Observatory (AVO), a cooperative program of a) U.S. Geological Survey, 4200 University Drive, Anchorage, AK 99508-4667 USA (URL: https://avo.alaska.edu/), b) Geophysical Institute, University of Alaska, PO Box 757320, Fairbanks, AK 99775-7320, USA, and c) Alaska Division of Geological & Geophysical Surveys, 794 University Ave., Suite 200, Fairbanks, AK 99709, USA (URL: http://dggs.alaska.gov/).
Sierra Negra (Ecuador) — September 2018 Cite this Report
Sierra Negra
Ecuador
0.83°S, 91.17°W; summit elev. 1124 m
All times are local (unless otherwise noted)
Fissure opens on NNE caldera rim 26 June 2018, NW-flank lava flows reach the sea
Sierra Negra shield volcano on the Galápagos Island of Isabela has erupted six times since 1948, most recently in 2005. The eruptions of 2005, 1979, 1963, and 1953 were located in the area known as 'Volcán Chico' near the NNE rim of the summit caldera, which extends about 9 km E-W and 7 km N-S (figure 12). The lava flows generated in these eruptions were directed mainly towards the N and NE flanks of Sierra Negra, in some cases reaching Elizabeth Bay to the N and in others filling the interior of the caldera (figure 13). A new effusive eruption that occurred from 26 June through August 2018 is covered in this report with information provided primarily by Instituto Geofísico, Escuela Politécnica Nacional (IG-EPN). Additional information comes from the Washington Volcanic Ash Advisory Center (VAAC), and several sources of satellite information.
Beginning in 2017, the Geophysical Institute of the National Polytechnic School (IGEPN) installed a surveillance network of six broadband seismic stations for the Galápagos volcanoes. One station is located on the NE edge of the Sierra Negra caldera and another on the SE flank. After 12 years of little activity, an increase in seismicity beneath and around the caldera became evident by July 2017 (figure 14). On 19 October 2017 (local time) the seismic monitors detected a 16-km-deep M 3.8 earthquake with an epicenter on the NE border of the caldera in the vicinity of Volcán Chico. Four additional similar earthquakes occurred within the next hour. Another earthquake of similar size occurred on 22 October; between 15 and 16 November, three earthquakes with M 3.0 or greater were recorded. The frequency of seismic activity increased significantly in December 2017, with over 550 events recorded during the first three weeks of December 2017; at least three had magnitudes greater than 3. GPS receivers showed uplift of the caldera floor of 80 cm between 2013 and 2017. InSAR interferometry data indicated substantial inflation of the caldera floor of about 70 cm between December 2016 and late November 2017, reaching a level higher than that which preceded the eruption of 2005 (figure 15).
By early January 2018, inflation over the preceding 12 months was close to 1 m, with a total inflation exceeding that prior to the 2005 eruption. Seismic activity, focused on two fracture zones trending NE-SW across the summit caldera, continued to increase until 26 June 2018 when a fissure opened near Volcán Chico on the NNE caldera rim. Over the next 24 hours four fissures opened on the N rim and the NW flank. Three of the fissures were active only for this period, but the fourth, on the NW flank about 7 km below the caldera rim, continued to effuse lava for all of July and most of August 2018. Lava flows reached the sea in early July. Several pulses of increased effusive activity corresponded with increased seismic, thermal, and gas-emission activity recorded by both ground-based and satellite instrumentation. By the last week of August active flows were no longer observed, although the cooling flows continued to emit thermal signals for several weeks.
Activity during January-early June 2018. Elevated seismicity continued into 2018 with a M 3.8 event recorded on 6 January 2018 that was felt by tourists, guides, and Galápagos National Park officials. Tens of additional smaller events continued throughout the month, reaching more than 100 seismic events per day a few times; the earthquakes were located below the caldera at a depth of less than 8 km. A M 4.1 event on 10 January was located at a depth of 7 km. By 12 January, the total inflation of the caldera since the beginning of 2017 was 98 cm (figure 16).
IG reported 14 seismic events with magnitudes ranging from 3.0-4.6 between 1 January and 19 March 2018. A M 4.4 event on 18 January was located less than 1 km below the surface with an epicenter on the S rim of the caldera. A M 4.1 event on 27 February was also located less than 1 km below the surface. A M 4.6 event on 14 March was the largest to date at Sierra Negra and was located only 0.3 km below the surface. Measurements of CO2, SO2, and H2S made at the Azufral fumarole field (figure 17) on the W rim of the caldera in early February did not have values significantly different compared to May 2014 and September 2017. With the continued increase in frequency and magnitude of shallow seismic activity, IG noted the increased risk of renewed eruptive activity, and noted that most of the active flows of the last 1,000 years were located on the N flank (figure 18).
Increases in seismicity continued into early June. IG noted that on 25 May 2018, 104 seismic events were recorded, the largest number in a single day since 2015. A M 4.8 event on 8 June was accompanied by over 40 other smaller earthquakes. The earthquake epicenters were mainly located on the edges of the crater in two NE-SW trending lineaments; the first covered the N and W edges of the crater and the second trended from the NE edge to the S edge. Deformation data indicated the largest displacements were at the caldera's center, compared with lower levels of deformation outside of the caldera.
Eruption of 26 June-late August 2018. IG reported an increase in seismicity and a M 4.2 earthquake on 22 June 2018. A larger M 5.3 earthquake was detected at 0315 on 26 June, 5.3 km below the caldera. The event was felt strongly on the upper flanks and in Puerto Villamil (23 km SE). About 8 hours later, at 1117, an earthquake swarm characterized by events located at 3-5 km depth was recorded. A M 4.2 earthquake took place at 1338 and was followed by increasing amplitudes of seismic and infrasound signals. Parque Nacional Galápagos staff then reported noises described as bellows coming from the Volcán Chico fissure vent, which, coupled with the seismicity and infrasound data, suggested the start of an eruption. About 20 minutes later IG described a thermal anomaly identified in satellite images in the N area of the caldera near Volcán Chico and Park staff observed lava flowing towards the crater's interior as well as towards the N flank in the direction of Elizabeth Bay (figure 19).
The Washington VAAC reported an ash plume visible in satellite imagery late on 26 June at 10.6 km altitude drifting SW. By the following morning, a plume of ash mixed with SO2 was drifting W at 8.2 km altitude. IG reported a new ash emission late on 27 June drifting NW at 6.1 km altitude. A substantial SO2 plume emerged on 27 June and was recorded by the OMI and OMPS satellite-based instruments drifting SW that day and the next (figure 20). The MODVOLC thermal alert system confirmed the beginning of the eruption with over 100 alert pixels recorded on 27 June and over 50 the following day. The MIROVA system recorded an abrupt, very high thermal signal beginning on 26 June (figure 21). Seismic and acoustic data indicated a gradual decrease of activity after the initial outburst, but effusive lava flows continued on 27 June.
During 27 and 28 June, IG scientists were able to make a site visit to capture thermal, photographic, and physical evidence of the new lava flows (figure 22). A composite thermal image showed the extent of flows that traveled down the N flank as well as into the caldera (figure 23). A temperature of 580°C was measured near the eruptive fissure, and the surface temperatures averaged about 60°C, although some flows were measured as high as 200°C. The temperature inside a fracture on a lava flow was measured at 975°C (figure 24). Pelée hair and "spatter" bombs were visible around the eruptive fissures.
Pahoehoe and aa flows along with lava tunnels were visible in drone images. The visible fissures were slightly arcuate and aligned in a general ENE direction, similar to the fissures of 1979 and 2005 in the vicinity of Volcán Chico. The largest flow was more than 150 m long; they reached up to 130 m wide in the flat areas, but only between 25 and 35 m wide where they were channeled on the steeper slope. In the flatter areas they had characteristics of pahoehoe with a smooth surface, a sometimes rounded texture and lava tunnels (figure 25), while in the channelized areas with a steeper slope they had a rougher surface and were characterized as aa (figure 26). The flows averaged 0.5-1 m thick and in several places the lava filled fissures or previous depressions. The samples of pahoehoe that were collected were all aphanitic with no crystals, strongly iridescent, and vesiculated with fluid textures that indicated a high gas content and low viscosity.
A small seismic event followed by several hours of tremor was recorded at 1552 on 1 July; a short while later National Park staff observed active lava flows on the NW flank. On 4 July, IG reported a M 5.2 earthquake that was 5 km deep; it was followed by 68 smaller seismic events. On 7 July seismic tremor activity indicating another pulse of magmatic activity was recorded by a station on the NE edge of the caldera at 1700. At the same time, satellite data showed an increase in the intensity of the thermal anomaly on the NW flank; Parque Nacional Galápagos staff confirmed strong visible incandescence in an area near the beach. Tremor activity continued on 8 July, although the amplitude gradually decreased.
The Washington VAAC reported an ash plume visible in satellite imagery on 2 July at 6.1 km altitude drifting SW. Later in the day a concentrated plume interpreted to be primarily steam and gas extended about 260 km SW. On 8 July ash could be seen moving both W and SW in satellite imagery at 2.7-3.0 km altitude. Later that day ash was visible extending about 115 km SW from the summit and other gases extended 370 km W. That evening the ash plume extended about 190 km SW at 3.7 km altitude. Gas-and-ash plumes were observed continuously drifting SW for the next three days (9-11 July) at 3.7 km altitude to a distance of about 80 km. On 13 July, two areas of ash and gas were seen in satellite imagery moving 25 km NW from the summit and up to 45 km SW at altitudes of 3.9 and 2.4 km respectively. A low-level ash plume on 16 July extended 30 km SW from the summit at 2.4 km altitude; incandescence was also visible in the webcam. The next day ash and gas emissions extended about 120 km SW at a similar altitude. Ongoing steam, gas, and ash emissions were seen in satellite imagery and in the webcam extending 110 km NW from the summit on 19 July at 3.4 km altitude. The Washington VAAC reported an ash plume on 30 July that rose to 3.4 km altitude and drifted SW. Strong SO2 emissions were recorded by both the OMPS and OMI satellite instruments throughout July 2018 (figure 27).
In a report issued by IGEPN covering activity through 23 July 2018, they noted that at least four fissures had initially opened on 26 June at the start of the eruption (see numbers in figure 19 at the beginning of this report, and figure 31 at the end). Fissure 1, the longest at 4 km, was located at the edge of the caldera in the area of Volcán Chico; lava flows from this fissure traveled 7 km down the flanks, and over 1 km within the interior of the caldera. NW-flank fissures 2, 3, and 4 were much smaller (about 250 m long). Fissures 1-3 were active only until 27 June; fissure 4 continued to be active throughout July. Lava from this fissure reached the ocean on 6 July.
Gas and possible volcanic ash extended 35 km SW of the summit on 4 August at 1.5 km altitude; this was the last report of an ash plume by the Washington VAAC for the eruption. Daily reports from IGEPN indicated that nightly incandescence from advancing flows continued into August. Occasional low-level steam and gas plumes were also visible. Pulses of lava effusion on 4 and 9 August were accompanied by major episodes of seismic tremor activity and substantial SO2 plumes (figure 28). On 15 August satellite images showed lava from fissure 4 continuing to enter the ocean. The area where the lavas entered the sea were far from any human population or agricultural activities and only accessible by boats.
Throughout the ongoing eruption, pulses of thermal activity detected by MODIS infrared satellite sensors correlated with increases in seismic activity and observed flow activity. The MIROVA plot showed a high level of heat flow from the onset of the eruption on 26 June gradually decreasing in intensity through mid-August (figure 21). This was followed by a significant drop in heat flow and gradual cooling thereafter. After the initial fissure activity near the crater rim on 26-27 June, all subsequent activity was concentrated farther down the N flank at fissure 4 and is reflected in the number of pixels concentrated in that area of the MODVOLC plot of thermal alerts from June-September 2018 (figure 29).
The number of seismic events recorded during the eruptive episode had increased between 26 June and 30 July 2018 to an average of 265 per day. The peak was recorded on 29 June with 940 earthquakes. Between 31 July and 23 August, the average number was 121 per day, still higher than the level of 38 per day prior to the beginning of the eruption on 26 June. IG reported a continuous decline in activity during the last two weeks of August 2018. After the initial burst of effusive activity during 26-27 June, five additional pulses of increased thermal, seismic, and gas-emission activity were observed in multiple sources of data on 1-2, 7-8, and 31 July, and 4 and 9 August (figure 30).
In a summary report on 31 August 2018, IG reported that the eruption was divided into two main phases. The first and most energetic phase lasted one day (26 June) and was characterized by the opening of five fissures (table 2) located on the rim and N and NW flanks, and creation of lava flows that traveled as far as 7 km from the vents (figure 31). Lava was only active from all five fissures during the first day of the eruption, covering an area greater than 17 km2. During the rest of the eruption from 27 June-23 August, about 13 km2 of lava was produced from fissure 4, with lava reaching the sea on 6 July and expanding the coastline by 1.5 km2. Detailed descriptions of the fissures provided by IGEPN are given in the following section. By 25 August the lava flows covered an area of 30.6 square kilometers. Activity continued to decline the last week of August with decreased seismicity, gas emission, and no surficial activity visible.
Table 2. Descriptions of the five fissures active during the June-August 2018 eruption of Sierra Negra (see figure 31 for locations). Courtesy of IGEPN (Informe Especial N°18 – 2018, Volcán Sierra Negra, Islas Galápagos, "Terminación de episodio ruptive actual", Quito, 31 de Agosto del 2018)
| Feature |
Location |
Description |
| Fissure 1 |
Edge of the caldera in the Volcán Chico area, trending WNW, tangential to the edge of the caldera. |
Four kilometers in length with lava flows that moved toward both the interior of the caldera and down the flank from the beginning of the eruption until 27 June, covering an area of 14.6 km2. The flows deposited outside the crater traveled 7 km downhill, without reaching the sea, while those inside it reached a maximum distance of 1.1 km. |
| Fissure 2 |
NW of the caldera about 3 km below its edge of the caldera at an elevation of 700 m. |
Approximately 250 m long and produced 4-km-long lava flows from the beginning of the eruption until 27 June, covering an area of 2.2 km2; its lava did not reach the sea. |
| Fissure 3 |
WNW of the caldera about 4 km below its edge at an elevation of 550 m. |
Approximately 250 m long and active from the beginning of the eruption until 27 June, emitting lava flows that covered an area of about 0.4 km2. The lava flows had a length of about 2 km and did not reach the sea. |
| Fissure 4 |
NW flank at an elevation of 100 m between 7 and 8 km below the rim of the caldera. |
Continuously emitting lava flows throughout the eruption. It was located on the On 6 July the lava flows from this fissure reached the ocean and modified the coastline of Isla Isabela by 1.5 km2. By 25 August when active flow ceased, its lavas had covered an area of approximately 13.3 km2. |
| Fissure 5 |
Western flank at an elevation of 840 m, 1.5 km downhill from the inner edge of the caldera. |
Length of 170 m and covered 0.026 km2. |
References: Davidge L, Ebinger C, Ruiz M, Tepp G, Amelung F, Geist D, Cote D, Anzieta J, 2017, Seismicity patterns during a period of inflation at Sierra Negra volcano, Galápagos Ocean Island Chain. Earth and Planetary Science Letters. 462. DOI: 10.1016/j.epsl.2016.12.021.
Geist D, Naumann T R, Standish J J, Kurz M D, Harpp K S, White W M , Fornari D, 2005, Wolf Volcano, Galapagos Archipelago: Melting and magmatic evolution at the margins of a mantle plume. Journal of Petrology 46:2197-2224.
Vasconez F, Ramón P, Hernandez S, Hidalgo S, Bernard B, Ruiz M, Alvarado A., La Femina P, Ruiz G, 2018, The different characteristics of the recent eruptions of Fernandina and Sierra Negra volcanoes (Galápagos, Ecuador), Volcanica 1(2): 127-133. DOI: 10.30909/vol.01.02.127133.
Geologic Background. The broad shield volcano of Sierra Negra at the southern end of Isabela Island contains a shallow 7 x 10.5 km caldera that is the largest in the Galápagos Islands. Flank vents abound, including cinder cones and spatter cones concentrated along an ENE-trending rift system and tuff cones along the coast and forming offshore islands. Although it is the largest of the five major Isabela volcanoes, it has the flattest slopes, averaging less than 5° and diminishing to 2° near the coast. A sinuous 14-km-long, N-S-trending ridge occupies the west part of the caldera floor, which lies only about 100 m below its rim. The Volcán de Azufre fumarolic area lies within a graben between this ridge and the west caldera wall. Lava flows from a major eruption in 1979 extend all the way to the north coast from circumferential fissure vents on the upper northern flank.
Information Contacts: Instituto Geofísico (IG), Escuela Politécnica Nacional, Casilla 17-01-2759, Quito, Ecuador (URL: http://www.igepn.edu.ec ); Washington Volcanic Ash Advisory Center (VAAC), Satellite Analysis Branch (SAB), NOAA/NESDIS OSPO, NOAA Science Center Room 401, 5200 Auth Rd, Camp Springs, MD 20746, USA (URL: www.ospo.noaa.gov/Products/atmosphere/vaac, archive at: http://www.ssd.noaa.gov/VAAC/archive.html); MIROVA (Middle InfraRed Observation of Volcanic Activity), a collaborative project between the Universities of Turin and Florence (Italy) supported by the Centre for Volcanic Risk of the Italian Civil Protection Department (URL: http://www.mirovaweb.it/); Hawai'i Institute of Geophysics and Planetology (HIGP) - MODVOLC Thermal Alerts System, School of Ocean and Earth Science and Technology (SOEST), Univ. of Hawai'i, 2525 Correa Road, Honolulu, HI 96822, USA (URL: http://modis.higp.hawaii.edu/); NASA Goddard Space Flight Center (NASA/GSFC), Global Sulfur Dioxide Monitoring Page, Atmospheric Chemistry and Dynamics Laboratory, 8800 Greenbelt Road, Goddard, Maryland, USA (URL: https://so2.gsfc.nasa.gov/); Nature Galápagos (Twitter: @natureGalápagos, https://twitter.com/natureGalápagos).
Nishinoshima (Japan) — September 2018 Cite this Report
Nishinoshima
Japan
27.247°N, 140.874°E; summit elev. 100 m
All times are local (unless otherwise noted)
Quiescence interrupted by brief lava flow emission and small explosions in July 2018
Nishinoshima is an active volcano in the Ogasawara Arc, about 1,000 km S of Tokyo, Japan. After 40 years of dormancy, activity increased in November 2013 and has since formed an island. The eruption has continued with subaerial activity that largely consists of lava flows and small gas-and-ash plumes. This report covers November 2017 through July 2018, and summarizes activity noted in reports issued by the Japan Meteorological Agency, and images and footage taken by the Japan Coast Guard (JCG).
No eruptive activity at Nishinoshima had been noted since mid-August 2017, when lava was last entering the ocean. Activity recommenced on 12 July and a 200-m-long lava flow was confirmed on 13 July. The lava flow was accompanied by explosive activity that ejected blocks and bombs out to 500 m from the vent, plumes and water discoloration (figures 60, 61, and 62). An aerial survey by the JCG on 30 July showed that activity had ceased and the lava flow had reached 700 m in length, terminating 100 m from the ocean.
After the July activity, Nishinoshima again entered a phase of quiescence with activity limited to fumaroles around the vent. Himawari-8 satellite observations noted no increased thermal output following the July 2018 eruption. Thermal anomalies detected by satellite-based MODIS instruments were identified by the MODVOLC system from during 12-21 July 2018.
Geologic Background. The small island of Nishinoshima was enlarged when several new islands coalesced during an eruption in 1973-74. Multiple eruptions that began in 2013 completely covered the previous exposed surface and continued to enlarge the island. The island is the summit of a massive submarine volcano that has prominent peaks to the S, W, and NE. The summit of the southern cone rises to within 214 m of the ocean surface 9 km SSE.
Information Contacts: Japan Coast Guard (JCG) Volcano Database, Hydrographic and Oceanographic Department, 3-1-1, Kasumigaseki, Chiyoda-ku, Tokyo 100-8932, Japan (URL: http://www.kaiho.mlit.go.jp/info/kouhou/h29/index.html, http://www1.kaiho.mlit.go.jp/GIJUTSUKOKUSAI/kaiikiDB/kaiyo18-e1.htm); Japan Meteorological Agency (JMA), Otemachi, 1-3-4, Chiyoda-ku Tokyo 100-8122, Japan (URL: http://www.jma.go.jp/jma/indexe.html); Hawai'i Institute of Geophysics and Planetology (HIGP) - MODVOLC Thermal Alerts System, School of Ocean and Earth Science and Technology (SOEST), Univ. of Hawai'i, 2525 Correa Road, Honolulu, HI 96822, USA (URL: http://modis.higp.hawaii.edu/).
Rincon de la Vieja (Costa Rica) — September 2018 Cite this Report
Rincon de la Vieja
Costa Rica
10.8314°N, 85.3364°W; summit elev. 1729 m
All times are local (unless otherwise noted)
Intermittent weak phreatic explosions during January-March and July-August 2018
The Rincón de la Vieja volcano complex has generated intermittent phreatic explosions since 2011; during 2017, weak phreatic explosions occurred during May, June, July, September, and October (BGVN 42:08 and 43:03). This activity continued through August 2018. The volcano is monitored by the Observatorio Vulcanologico Sismologica de Costa Rica-Universidad Nacional (OVSICORI-UNA).
According to OVSICORI-UNA, at 1758 on 9 January 2018, an explosion produced a plume that rose 1 km above the crater rim. On 12 January, OVSICORI-UNA reported some small phreatic explosions. The webcam detected weak explosions again in mid-February. Another weak explosion on 22 February confirmed the presence of a crater lake.
During the first week of March OVSICORI-UNA reported weak phreatic explosions of low amplitude that were only be detected by the webcam (figure 28), and not by seismic instruments. During the week of 5-11 March there were 2-4 weak phreatic explosions occurred per day, along with strong tremor on the 10th. Small eruptions were seen on unspecified days the week of 12-18 March.
No phreatic activity was reported during the second half of March through June, though on 20 May a seismic swarm of about 30 earthquakes was recorded. After a tremor on 3 July, a possible weak phreatic explosion occurred on 4 July at 0044, followed by a pulse of tremor. On 28 July, at 1828, a small explosion followed by tremor was recorded.
On 3 August OVSICORI-UNA reported that two weak explosions occurred at dawn. On 14 August, another weak explosion began at 1828 and lasted three minutes. Foggy conditions prevented webcam views and an estimate of a plume height. Other weak explosions were recorded on 17 August at 1407 and 2015.
Geologic Background. Rincón de la Vieja is a volcanic complex in the Guanacaste Range of NW Costa Rica. Sometimes referred to as the Rincon de la Vieja-Santa María Volcanic Complex, it consists of a slightly arcuate 20-km-long ridge of 12 craters and pyroclastic cones constructed within the 15-km-wide early Pleistocene Guachipelín caldera, whose rim is exposed on the south side. Sometimes known as the "Colossus of Guanacaste," it has an estimated volume of 130 km3 and contains at least nine major eruptive centers. The Santa María cone, the highest peak of the complex, is located on the E side of the ridge and has a lake within the 400-m-diameter crater. A Plinian eruption producing the 0.25 km3 Río Blanca tephra about 3,500 years ago was the last major magmatic eruption. All subsequent eruptions, including numerous reported eruptions possibly dating back to the 16th century, have been from the active crater, near the center of the complex, with an acidic 300-m-diameter lake.
Information Contacts: Observatorio Vulcanologico Sismologica de Costa Rica-Universidad Nacional (OVSICORI-UNA), Apartado 86-3000, Heredia, Costa Rica (URL: http://www.ovsicori.una.ac.cr/).
Semeru (Indonesia) — September 2018 Cite this Report
Semeru
Indonesia
8.108°S, 112.922°E; summit elev. 3657 m
All times are local (unless otherwise noted)
Small ash plumes in February, April, July, and August 2018; persistent thermal hotspot in the crater
Semeru volcano is the tallest volcano in Java (figure 33) and one of the most active in Indonesia. The Mahameru summit area contains the active Jonggring-Seloko vent where activity consists of dome growth and regular ash plumes, along with pyroclastic flows, avalanches, and lava flows that travel down the SE-flank ravine. The Pusat Vulkanologi dan Mitigasi Bencana Geologi (PVMBG, also known as Indonesian Center for Volcanology and Geological Hazard Mitigation, CVGHM) Volcano Alert level for Semeru throughout the report period is II (on a scale of I-IV). The last Volcano Observatory Notice for Aviation (VONA) was issued on 9 January 2017, and the status has not changed during the reporting period. This report summarizes the activity from January to 24 August 2018 and is based on Volcano Ash Advisory Center (VAAC) ash advisories and satellite data.
While there were no observatory activity reports issued, the Darwin VAAC issued reports for five events that produced ash plumes to altitudes ranging 3.4 to 4.9 km (table 22). MIROVA (Middle InfraRed Observation of Volcanic Activity) thermal data indicate near-consistent low-level thermal activity at Semeru after a period of no detected thermal anomalies in late January through early February. This supports the elevated thermal energy detected by Sentinel-2 satellite data at the Jonggring-Seloko vent and along the SE-flank ravine (figure 34). The MODVOLC algorithm detected 16 high-temperature hotspots through the reporting period, six in January, two in March, three in April, one in July, and two in August through to the 24th.
Table 22. Summary of ash plumes (altitude and drift direction) and pyroclastic flows at Semeru, January to 24 August 2018. The summit is at 3,657 m elevation. Data courtesy of Darwin VAAC report.
| Date |
Altitude (km) |
Drift direction |
Other notes |
| 24 Feb 2018 |
4.6 |
20 km ESE and WSW |
-- |
| 29 Apr 2018 |
3.4 |
NW |
Short-lived discrete eruption |
| 20 Jul 2018 |
4.9 |
SW |
Minor discrete eruption |
| 30-31 Jul 2018 |
4.3 |
W |
-- |
| 23-24 Aug 2018 |
4.3 |
W and SW |
-- |
Geologic Background. Semeru, the highest volcano on Java, and one of its most active, lies at the southern end of a volcanic massif extending north to the Tengger caldera. The steep-sided volcano, also referred to as Mahameru (Great Mountain), rises above coastal plains to the south. Gunung Semeru was constructed south of the overlapping Ajek-ajek and Jambangan calderas. A line of lake-filled maars was constructed along a N-S trend cutting through the summit, and cinder cones and lava domes occupy the eastern and NE flanks. Summit topography is complicated by the shifting of craters from NW to SE. Frequent 19th and 20th century eruptions were dominated by small-to-moderate explosions from the summit crater, with occasional lava flows and larger explosive eruptions accompanied by pyroclastic flows that have reached the lower flanks of the volcano.
Information Contacts: Pusat Vulkanologi dan Mitigasi Bencana Geologi (PVMBG, also known as Indonesian Center for Volcanology and Geological Hazard Mitigation, CVGHM), Jalan Diponegoro 57, Bandung 40122, Indonesia (URL: http://www.vsi.esdm.go.id/); MAGMA Indonesia, Kementerian Energi dan Sumber Daya Mineral (URL: https://magma.vsi.esdm.go.id/); Darwin Volcanic Ash Advisory Centre (VAAC), Bureau of Meteorology, Northern Territory Regional Office, PO Box 40050, Casuarina, NT 0811, Australia (URL: http://www.bom.gov.au/info/vaac/); MIROVA (Middle InfraRed Observation of Volcanic Activity), a collaborative project between the Universities of Turin and Florence (Italy) supported by the Centre for Volcanic Risk of the Italian Civil Protection Department (URL: http://www.mirovaweb.it/); Hawai'i Institute of Geophysics and Planetology (HIGP) - MODVOLC Thermal Alerts System, School of Ocean and Earth Science and Technology (SOEST), Univ. of Hawai'i, 2525 Correa Road, Honolulu, HI 96822, USA (URL: http://modis.higp.hawaii.edu/); Sentinel Hub Playground (URL: https://www.sentinel-hub.com/explore/sentinel-playground); Øystein Lund Andersen? (Twitter: @OysteinLAnderse, https://twitter.com/OysteinLAnderse, URL: http://www.oysteinlundandersen.com).
Sinabung (Indonesia) — September 2018 Cite this Report
Sinabung
Indonesia
3.17°N, 98.392°E; summit elev. 2460 m
All times are local (unless otherwise noted)
No significant ash plumes seen after 22 June 2018; minor ash in early July
Sinabung volcano is located in the Karo regency of North Sumatra, Indonesia. The current eruptive episode commenced in late 2013, after phreatic activity in 2010, producing ash plumes, lava domes and flows, and pyroclastic flows that caused evacuation and relocation of nearby communities. This report covers activity from April through early July, and is based on information provided by MAGMA Indonesia, the Darwin Volcanic Ash Advisory Center (VAAC), the Center for Volcanology and Geological Hazard Mitigation (CVGHM, also known as PVMBG), satellite data, and field photographs. Sinabung has been on Alert Level IV, the highest hazard status, since 2 June 2015.
The eruption has built a pyroclastic flow and lava fan to the SE (figure 60). This activity continued into 2018, with the last significant ash plume reported on 22 June (table 8). However, minor ash emissions continued at least through 5 July 2018.
Table 8. Summary of ash plumes (altitude and drift direction) and pyroclastic flows at Sinabung, April-June 2018. The summit is at 2,460 m elevation. Data courtesy of Darwin VAAC reports, MAGMA Indonesia VAAC reports, and CVGHM volcanic activity reports.
| Date |
Ash plume altitude (km) |
Ash plume drift direction |
Pyroclastic flows |
| 06 Apr 2018 |
7.5 |
W, S |
3.5 km |
| 12 Apr 2018 |
2.7 |
WNW |
Yes |
| 19 Apr 2018 |
5.5 |
ESE |
1 km |
| 19 May 2018 |
3.2 |
NW |
-- |
| 20 May 2018 |
5.0 |
WNW |
-- |
| 15 Jun 2018 |
3.0 |
ESE |
-- |
| 22 Jun 2018 |
3.5 |
SE |
-- |
An eruption on 6 April 2018 at 1607 local time produced an ash plume that reached about 7.5 km above the summit. The eruption also produced pyroclastic flows that traveled about 3.5 km from the summit down the SE slope (figure 61). The eruption resulted in the closure of a nearby airport and ashfall affected hundreds of hectares of agricultural land. Two more notable ash plumes were reported on 12 and 19 April, to altitudes of about 2.7 and 5.5 km, respectively. A pyroclastic flow was reported during the 12 April eruption. Smaller ash and gas emissions occurred through the month.
Two ash plumes were recorded on 19 and 20 May, rising to about 3.2 and 5 km altitude, respectively. Throughout June small diffuse gas-and-ash plumes continued (figures 62 and 63). The last activity reported by the agencies was on the 15 and 22 June, when ash plumes reached 3 and 3.5 km altitude (figure 64). Activity after 22 June was limited to seismicity and ash, gas, and steam plumes to several hundred meters above the summit (figure 65). Although an elevated thermal signature was detected in Sentinel-2 satellite data on 30 August 2018, there were no reports of renewed activity.
Geologic Background. Gunung Sinabung is a Pleistocene-to-Holocene stratovolcano with many lava flows on its flanks. The migration of summit vents along a N-S line gives the summit crater complex an elongated form. The youngest crater of this conical andesitic-to-dacitic edifice is at the southern end of the four overlapping summit craters. The youngest deposit is a SE-flank pyroclastic flow 14C dated by Hendrasto et al. (2012) at 740-880 CE. An unconfirmed eruption was noted in 1881, and solfataric activity was seen at the summit and upper flanks in 1912. No confirmed historical eruptions were recorded prior to explosive eruptions during August-September 2010 that produced ash plumes to 5 km above the summit.
Information Contacts: Pusat Vulkanologi dan Mitigasi Bencana Geologi (PVMBG, also known as Indonesian Center for Volcanology and Geological Hazard Mitigation, CVGHM), Jalan Diponegoro 57, Bandung 40122, Indonesia (URL: http://www.vsi.esdm.go.id/); Badan Nasional Penanggulangan Bencana (BNPB), National Disaster Management Agency, Graha BNPB - Jl. Scout Kav.38, East Jakarta 13120, Indonesia (URL: http://www.bnpb.go.id/, Twitter: https://twitter.com/BNPB_Indonesia ); MAGMA Indonesia, Kementerian Energi dan Sumber Daya Mineral (URL: https://magma.vsi.esdm.go.id/, Twitter: https://twitter.com/id_magma); Darwin Volcanic Ash Advisory Centre (VAAC), Bureau of Meteorology, Northern Territory Regional Office, PO Box 40050, Casuarina, NT 0811, Australia (URL: http://www.bom.gov.au/info/vaac/); Sentinel Hub Playground (URL: https://www.sentinel-hub.com/explore/sentinel-playground); Brett Carr, Lamont-Doherty Earth Observatory, Columbia University, 61 Route 9W, Palisades, NY (URL: https://www.ldeo.columbia.edu/user/bcarr); Agence France-Presse (URL: http://www.afp.com/); Straits Times (URL: https://www.straitstimes.com).
Telica (Nicaragua) — September 2018 Cite this Report
Telica
Nicaragua
12.606°N, 86.84°W; summit elev. 1036 m
All times are local (unless otherwise noted)
Explosions on 21 June and 15 August 2018; local ashfall from June event
The Telica volcano complex, which consists of several cones and craters, has had intermittent eruptions since the Spanish conquest, with emissions of gas and ash. According to The Instituto Nicaragüense de Estudios Territoriales (INETER), the volcano is monitored in real time by a permanent seismic station near the crater. It is also visited several times per year for visual observations, to measure sulfur dioxide emissions, and measure temperatures in the crater and fumaroles near the seismic station. A gas-and-ash explosion occurred in early May 2016 (BGVN 42:01). This report covers activity from September 2016 through June 2018.
INETER reported that local residents heard a small gas explosion on 10 September 2017, and warned the public to stay at least 2 km away from the crater. No ash emissions were reported related to this event.
According to INETER and the Sistema Nacional para la Prevención, Mitigación y Atención de Desastres (SINAPRED), an eruption began at 0708 on 21 June 2018. Explosions produced an ash plume that rose 500 m above the crater and drifted E, S, and SW. Ejected tephra was deposited within a 1-km-radius of the volcano, and ashfall was reported in nearby areas, including La Joya, Las Marías (7 km NNW), Pozo Viejo (10 km NNW), Ojo de Agua, San Lucas (11 km NNW), Las Higueras, Las Grietas (12 km NNW), and Posoltega (16 km WSW).
Another explosion on 15 August 2018 was reported by SINAPRED that generated an ash plume to 200 m above the crater rim.
Seismicity. INETER monthly reports indicated that during September through December 2016, between 3,500 and 3,900 monthly seismic events took place, with the majority having hybrid signatures. During 2017, the monthly number of seismic events ranged from 40,584 (September) to 105,555 (November), of which 50-90% were hybrid events, 9-10% long-period events (but 23 percent in January), and 0-35% multiple events. A few scattered volcanic-tectonic events occurred, and tremor was usually low. Seismic data for January and March consisted of percentages of different earthquake types similar to those during 2017.
About 5% of the monthly seismic signals between April 2017 and January 2018 were doublets, or paired earthquakes with two predominant frequencies. INETER did not mention doublets in their March 2018 report, and did not include seismic data in their February or April 2018 reports.
Sulfur dioxide measurements. According to INETER, during fieldwork on 8 and 11 May 2017 the sulfur dioxide level was measured at 368 ± 194 metric tons/day. This value was lower than those in November 2015 with an average of 765 ± 94 tons/day. On 28 February and 1 March 2018, measurements using the Mobile-DOAS technique found levels greater than 426 tons/day and a minimum value of 152 tons/day, with an average of 260 tons/day, higher than the value measured in September 2017 with 183 tons/day. On 16 and 19 April 2018, the minimum and maximum values were 229 and 567 tons/day, with an average of 353 tons/day.
Geologic Background. Telica, one of Nicaragua's most active volcanoes, has erupted frequently since the beginning of the Spanish era. This volcano group consists of several interlocking cones and vents with a general NW alignment. Sixteenth-century eruptions were reported at symmetrical Santa Clara volcano at the SW end of the group. However, its eroded and breached crater has been covered by forests throughout historical time, and these eruptions may have originated from Telica, whose upper slopes in contrast are unvegetated. The steep-sided cone of Telica is truncated by a 700-m-wide double crater; the southern crater, the source of recent eruptions, is 120 m deep. El Liston, immediately E, has several nested craters. The fumaroles and boiling mudpots of Hervideros de San Jacinto, SE of Telica, form a prominent geothermal area frequented by tourists, and geothermal exploration has occurred nearby.
Information Contacts: Instituto Nicaragüense de Estudios Territoriales (INETER), Apartado Postal 2110, Managua, Nicaragua (URL: http://webserver2.ineter.gob.ni/vol/dep-vol.html); Sistema Nacional para la Prevencion, Mitigacion y Atencion de Desastres (SINAPRED), Edificio SINAPRED, Rotonda Comandante Hugo Chávez 50 metros al Norte, frente a la Avenida Bolívar, Managua, Nicaragua (URL: http://www.sinapred.gob.ni/).
Turrialba (Costa Rica) — September 2018 Cite this Report
Turrialba
Costa Rica
10.025°N, 83.767°W; summit elev. 3340 m
All times are local (unless otherwise noted)
Ongoing variable ash emissions and crater incandescence through August 2018
This report summarizes activity at Turrialba during January-August 2018. Activity became more constant after September 2014, with cycles of explosions with numerous, sometimes persistent, weak and passive ash plumes and emissions usually rising no more than 500 m above the active crater. This activity continued during this reporting period (table 7). Most of the data were provided by monthly bulletins of the Observatorio Vulcanologico Sismologica de Costa Rica-Universidad Nacional (OVSICORI-UNA) and alerts from the Washington Volcanic Ash Advisory Center (VAAC).
Table 7. Ash emissions at Turrialba, January-August 2018. Information was provided by OVSICORI-UNA, Washington VAAC, and RSN: UCR-ICE.
| Date |
Time |
Max. Plume height above crater rim |
Drift |
Remarks |
| 08 Jan 2018 |
0600 |
400-500 m |
NW |
-- |
| 08 Jan 2018 |
1319 |
400-500 m |
NE |
-- |
| 08 Jan 2018 |
2005 |
800 m |
SW |
-- |
| 09 Jan 2018 |
0630 |
300 m |
SW |
-- |
| 09 Jan 2018 |
1412 |
-- |
-- |
-- |
| 15 Jan 2018 |
0400 |
-- |
-- |
Ashfall in areas N of Pacayas (Pinos, Buenos Aires, and Santa Rosa de Oreamuno); sulfur odor noted in Santa Rosa de Oreamuno. |
| 22 Jan 2018 |
0000 |
500 m |
NW |
-- |
| 26 Jan 2018 |
1101 |
100-200 m |
SW |
-- |
| 26 Jan 2018 |
1427 |
100-200 m |
SW |
-- |
| 30 Jan 2018 |
0920 |
100-200 m |
SW |
-- |
| 05 Feb 2018 |
0830 |
200 m |
SW |
-- |
| 06 Feb 2018 |
0730 |
1 km |
SW |
According to The Costa Rica Star, the activity continued for almost one hour; smaller explosion at 0832. Ashfall in several W-flank communities in San Jose (Goicoechea, Curridabat, Coronado) and Heredia. |
| 27 Feb 2018 |
0800 |
100 m |
SW |
-- |
| 06 Mar 2018 |
2240 |
500 m |
NW |
Activity intensified around midnight with dense ash emissions and ejection of incandescent blocks, and remained elevated almost until 0300 on 7 March. At 1740 activity again intensified; emissions with increased ash volume occurred 1801-1820 drifting W. |
| 08 Mar 2018 |
1515 |
300 m |
SW |
-- |
| 13 Mar 2018 |
0920 |
300 m |
NW |
-- |
| 23 Mar 2018 |
0605 |
100 m |
SW |
-- |
| 31 Mar 2018 |
1802 |
400 m |
SW |
-- |
| 01 Apr 2018 |
0838 |
500 m |
NW |
-- |
| 03 Apr 2018 |
0700 |
500 m |
NW |
-- |
| 05 Apr 2018 |
1230 |
500 m |
S |
-- |
| 09 Apr 2018 |
0609 |
300 m |
W |
-- |
| 11 Apr 2018 |
-- |
-- |
-- |
-- |
| 26 Apr 2018 |
0700 |
300 m |
W |
-- |
| 10 May 2018 |
-- |
-- |
-- |
Ashfall in La Pastora de Santa Cruz de Turrialba and Pacayas. No specific date: strong emissions of SO2, accompanied by vigorous fumarolic activity and jetting noises. |
| 13 May 2018 |
0920 |
300-500 m |
-- |
Weak steam and gas, apparently no ash. Seismicity low, with low-amplitude long-period earthquakes and tremor. Continuous low-amplitude tremor. |
| 21 May 2018 |
0900 |
-- |
-- |
-- |
| 28 May 2018 |
0930 |
300 m |
SE |
-- |
| 23 Jul-04 Aug 2018 |
-- |
300 m |
NW, W, SW |
Series of weak, sporadic, and almost daily gas-and-ash emissions. On 24 July, ashfall in Coronado, Tibás (35 km WSW), Goicoechea (28 km WSW), Moravia (31 km WSW), and other areas in the Valle Central. On 31 July, ashfall in Tres Ríos (27 km SW). Sulfur odor occasionally reported. |
| 02 Aug 2018 |
0023 |
1 km |
W |
-- |
| 02 Aug 2018 |
0700 |
300 m |
W |
-- |
| 04 Aug 2018 |
1600 |
300 m |
-- |
-- |
| 10 Aug 2018 |
-- |
-- |
W |
Pulsating, passive ash emissions. Strong sulfur odor in parts of Heredia (38 km W) and San José (36 km WSW) on 11 Aug. |
| 27-28 Aug 2018 |
-- |
200 m |
SW |
Continuous emissions. |
| 30 Aug 2018 |
1340 |
200 m |
SW |
-- |
| 31 Aug-01 Sep 2018 |
-- |
200 m |
SW, W |
Continuous gas-and-ash emissions. |
According to an online news report (Q Costa Rica), a group of volcanologists called Volcanes sin Fronteras (Volcanos Without Borders) flew a drone over the volcano several times in December 2017 and first the two weeks of January 2018. On their Facebook page, they indicated that activity was dominated by intense degassing from the active crater, with sporadic explosions every 30-60 minutes, releasing gas and ash that rose to more than 300 m above the crater. They also observed phreato-magmatic explosions.
OVSICORI reported that pulses of ash emissions were common in January (figure 49), and incandescence was occasionally observed at night. Activity decreased after the middle of February, but strong incandescence was observed during early March.
Eruptive activity resumed during the middle of May, but faded toward the end of the month to weak passive emissions, and finally ended. The volcano continued with a stable permanent Strombolian activity at the bottom of the crater. During June, the volcano was stable, with strong incandescence at night reflecting the presence of minor Strombolian activity that continued through at least early July.
On 3 July a weak explosion occurred and a thin layer of ash fell on the park ranger house and the Pica seismic station (2.5 km NW). A jet-like sound was heard on 4 July from a lookout. On 16 July incandescence continued at a low level. OVSICORI reported frequent weak ash emissions from 18 July through 2 August; the ash had a very low proportion of juvenile material and a high proportion of altered material. According to a news account (The Costa Rica Star) citing the RSN, persistent tremor accompanied these emissions, and a lahar descended the Toro Amarillo River on the W flank. Weak short-lived ash emissions resumed during the last half of August, and weak to moderate incandescence could still be observed.
Seismicity and deformation. During the first week of January, weak long-period (LP) earthquakes were recorded, but no volcanic-tectonic (VT) earthquakes or tremor. In February-April, weak VT earthquakes, a few LP earthquakes, and harmonic tremor were recorded. By May, seismic activity was almost non-existent, with VT signals below the crater and sporadic tremor. The latter disappeared by the end of May.
On 16 July, seismicity increased, particularly low-frequency earthquakes, to reach about 200 events the next day, but then decreased to normal on 18 July, with sporadic short tremor. During the last week of July, seismicity again increased until an internal explosion on 27 July, after which seismicity decreased. Tremor activity increased on 4 August, and by the middle of August, about 50 LP earthquakes per day were recorded, along with spasmodic tremor of low amplitude. This heightened activity continued during the following week.
Since June 2017, the volcano tended toward deflation, but then in early 2018 became stable until the middle of February, when inflation was recorded. By June, deformation was longer measured. No significant deformation was found in July or August.
Thermal anomalies. MODIS satellite instruments processed using the MODVOLC algorithm only recorded thermal anomalies on 22 March, 2 April, and 27 April (2 pixels). The MIROVA (Middle InfraRed Observation of Volcanic Activity) system recorded one hotspot during February, numerous hotspots between mid-March and mid-May, and only several hotspots after mid-May through the end of August. All recorded MIROVA anomalies were within 2.5 km of the volcano and of low radiative power.
Sulfur dioxide measurements. Significant sulfur dioxide levels near the volcano were recorded by NASA's satellite-borne ozone instruments between 30 March and 3 June, especially between 6-15 April.
According to OVSICORI, the CO2/SO2 ratio increased to a peak of 8 during the night of 21-22 January, then remained stable until the first week of February, when it decreased. By 20 February, the ratio was stable at about 4. The ratio was low during the middle of March, but rose on 29 March. On 10 April, the SO2 flow was normal (below 1000 t/d) and remained low until the middle of May, when CO2 levels increased. High CO2/SO2 levels were measured at the end of May, but decreased in early June. On 12 and 25 June, SO2 levels were about 400 and 500 tons/day, respectively. During early July, the ratio remained low at 4, with short periods of high measurements (about 10 on 5 July). The ratio remained stable throughout the rest of July. The ratio increased on 6 August during the last phase of eruptive activity, but then decreased to normal and stable levels for the rest of the month. Near the end of August, the two gas monitoring stations were vandalized.
Geologic Background. Turrialba, the easternmost of Costa Rica's Holocene volcanoes, is a large vegetated basaltic-to-dacitic stratovolcano located across a broad saddle NE of Irazú volcano overlooking the city of Cartago. The massive edifice covers an area of 500 km2. Three well-defined craters occur at the upper SW end of a broad 800 x 2200 m summit depression that is breached to the NE. Most activity originated from the summit vent complex, but two pyroclastic cones are located on the SW flank. Five major explosive eruptions have occurred during the past 3500 years. A series of explosive eruptions during the 19th century were sometimes accompanied by pyroclastic flows. Fumarolic activity continues at the central and SW summit craters.
Information Contacts: Observatorio Vulcanologico Sismologica de Costa Rica-Universidad Nacional (OVSICORI-UNA), Apartado 86-3000, Heredia, Costa Rica (URL: http://www.ovsicori.una.ac.cr/); Red Sismologica Nacional (RSN: UCR-ICE), Universidad de Costa Rica and Instituto Costarricense de Electricidad (URL: http://rsn.ucr.ac.cr/); Washington Volcanic Ash Advisory Center (VAAC), Satellite Analysis Branch (SAB), NOAA/NESDIS OSPO, NOAA Science Center Room 401, 5200 Auth Rd, Camp Springs, MD 20746, USA (URL: www.ospo.noaa.gov/Products/atmosphere/vaac, archive at: http://www.ssd.noaa.gov/VAAC/archive.html); Hawai'i Institute of Geophysics and Planetology (HIGP) - MODVOLC Thermal Alerts System, School of Ocean and Earth Science and Technology (SOEST), Univ. of Hawai'i, 2525 Correa Road, Honolulu, HI 96822, USA (URL: http://hotspot.higp.hawaii.edu/); MIROVA (Middle InfraRed Observation of Volcanic Activity), a collaborative project between the Universities of Turin and Florence (Italy) supported by the Centre for Volcanic Risk of the Italian Civil Protection Department (URL: http://www.mirovaweb.it/); Atmospheric Chemistry and Dynamics Laboratory, NASA Goddard Space Flight Center (URL: https://sO2.gsfc.nasa.gov/); Costa Rica Star (URL: https://news.co.cr); Q Costa Rica (URL: https://qcostarica.com).