Recently Published Bulletin Reports
Ioto (Japan) New eruption with discolored water, ejecta, and floating pumice during October-December 2023
Purace (Colombia) Gas-and-ash emission on 16 November 2023
Suwanosejima (Japan) Eruption plumes, crater incandescence, and occasional explosions during July-October 2023
Etna (Italy) Strombolian explosions, lava fountains, and lava flows during July-August 2023
Aira (Japan) Explosions, ash plumes, ash fall, and crater incandescence during July-October 2023
Nishinoshima (Japan) Gray emissions during October 2023
Kilauea (United States) Strong lava fountains, lava flows, and spatter at Halema’uma’u during January-September 2023
Tinakula (Solomon Islands) Continued lava flows and thermal activity during June through November 2023
Fuego (Guatemala) Daily explosions, gas-and-ash plumes, and block avalanches during August-November 2023
Santa Maria (Guatemala) Continuing lava effusion, explosions, ash plumes, and pyroclastic flows during August-November 2023
Karangetang (Indonesia) Incandescent avalanches, pyroclastic flows, and ash plumes during July-September 2023
Langila (Papua New Guinea) Intermittent thermal activity and few ash plumes during April-October 2023
Ioto
Japan
24.751°N, 141.289°E; summit elev. 169 m
All times are local (unless otherwise noted)
New eruption with discolored water, ejecta, and floating pumice during October-December 2023
Ioto (Iwo-jima), located about 1,200 km S of Tokyo, lies within a 9-km-wide submarine caldera along the Izu-Bonin-Mariana volcanic arc. Previous eruptions date back to 1889 and have consisted of dominantly phreatic explosions, pumice deposits during 2001, and discolored water. A submarine eruption during July through December 2022 was characterized by discolored water, pumice deposits, and gas emissions (BGVN 48:01). This report covers a new eruption during October through December 2023, which consisted of explosions, black ejecta, discolored water, and floating pumice, based on information from the Japan Meteorological Association (JMA), the Japan Coast Guard (JCG), and satellite data.
JMA reported that an eruption had been occurring offshore of Okinahama on the SE side of the island since 21 October, which was characterized by volcanic tremor, according to the Japan Maritime Self-Defense Force (JMSDF) Iwo Jima Air Base (figure 22). According to an 18 October satellite image a plume of discolored water at the site of this new eruption extended NE (figure 23). During an overflight conducted on 30 October, a vent was identified about 1 km off the coast of Okinahama. Observers recorded explosions every few minutes that ejected dark material about 20 m above the ocean and as high as 150 m. Ejecta from the vent formed a black-colored island about 100 m in diameter, according to observations conducted from the air by the Earthquake Research Institute of the University of Tokyo in cooperation with the Mainichi newspaper (figure 24). Occasionally, large boulders measuring more than several meters in size were also ejected. Observations from the Advanced Land Observing Satellite Daichi-2 and Sentinel-2 satellite images also confirmed the formation of this island (figure 23). Brown discolored water and floating pumice were present surrounding the island.
The eruption continued during November. During an overflight on 3 November observers photographed the island and noted that material was ejected 169 m high, according to a news source. Explosions gradually became shorter, and, by the 3rd, they occurred every few seconds; dark and incandescent material were ejected about 800 m above the vent. On 4 November eruptions were accompanied by explosive sounds. Floating, brown-colored pumice was present in the water surrounding the island. There was a brief increase in the number of volcanic earthquakes during 8-14 November and 24-25 November. The eruption temporarily paused during 9-11 November and by 12 November eruptions resumed to the W of the island. On 10 November dark brown-to-dark yellow-green discolored water and a small amount of black floating material was observed (figure 25). A small eruption was reported on 18 November off the NE coast of the island, accompanied by white gas-and-steam plumes (figure 23). Another pause was recorded during 17-19 November, which then resumed on 20 November and continued erupting intermittently. According to a field survey conducted by the National Institute for Disaster Prevention Science and Technology on 19 November, a 30-m diameter crater was visible on the NE coast where landslides, hot water, and gray volcanic ash containing clay have occurred and been distributed previously. Erupted blocks about 10 cm in diameter were distributed about 90-120 m from the crater. JCG made observations during an overflight on 23 November and reported a phreatomagmatic eruption. Explosions at the main vent generated dark gas-and-ash plumes that rose to 200 m altitude and ejected large blocks that landed on the island and in the ocean (figure 26). Discolored water also surrounded the island. The size of the new island had grown to 450 m N-S x 200 m E-W by 23 November, according to JCG.
The eruption continued through 11 December, followed by a brief pause in activity, which then resumed on 31 December, according to JMA. Intermittent explosions produced 100-m-high black plumes at intervals of several minutes to 30 minutes during 1-10 December. Overflights were conducted on 4 and 15 December and reported that the water surrounding the new island was discolored to dark brown-to-dark yellow-green (figure 27). No floating material was reported during this time. In comparison to the observations made on 23 November, the new land had extended N and part of it had eroded away. In addition, analysis by the Geospatial Information Authority of Japan using SAR data from Daichi-2 also confirmed that the area of the new island continued to decrease between 4 and 15 December. Ejected material combined with wave erosion transformed the island into a “J” shape, 500-m-long and with the curved part about 200 m offshore of Ioto. The island was covered with brown ash and blocks, and the surrounding water was discolored to greenish-brown and contained an area of floating pumice. JCG reported from an overflight on 4 December that volcanic ash-like material found around the S vent on the NE part of the island was newly deposited since 10 November (figure 28). By 15 December the N part of the “J” shaped island had separated and migrated N, connecting to the Okinahama coast and the curved part of the “J” had eroded into two smaller islands (figure 27).
References. Ukawa, M., Fujita, E., Kobayashi, T., 2002, Recent volcanic activity of Iwo Jima and the 2001 eruption, Monthly Chikyu, Extra No. 39, 157-164.
Geologic Background. Ioto, in the Volcano Islands of Japan, lies within a 9-km-wide submarine caldera. The volcano is also known as Ogasawara-Iojima to distinguish it from several other "Sulfur Island" volcanoes in Japan. The triangular, low-elevation, 8-km-long island narrows toward its SW tip and has produced trachyandesitic and trachytic rocks that are more alkalic than those of other volcanoes in this arc. The island has undergone uplift for at least the past 700 years, accompanying resurgent doming of the caldera; a shoreline landed upon by Captain Cook's surveying crew in 1779 is now 40 m above sea level. The Motoyama plateau on the NE half of the island consists of submarine tuffs overlain by coral deposits and forms the island's high point. Many fumaroles are oriented along a NE-SW zone cutting through Motoyama. Numerous recorded phreatic eruptions, many from vents on the W and NW sides of the island, have accompanied the uplift.
Information Contacts: Japan Meteorological Agency (JMA), 1-3-4 Otemachi, Chiyoda-ku, Tokyo 100-8122, Japan (URL: http://www.jma.go.jp/jma/indexe.html); Japan Coast Guard (JCG) Volcano Database, Hydrographic and Oceanographic Department, 3-1-1, Kasumigaseki, Chiyoda-ku, Tokyo 100-8932, Japan (URL: https://www1.kaiho.mlit.go.jp/GIJUTSUKOKUSAI/kaiikiDB/kaiyo22-2.htm); Copernicus Browser, Copernicus Data Space Ecosystem, European Space Agency (URL: https://dataspace.copernicus.eu/browser/); Asahi, 5-3-2, Tsukiji, Chuo Ward, Tokyo, 104-8011, Japan (URL: https://www.asahi.com/ajw/articles/15048458).
Purace (Colombia) — December 2023  Cite this Report
Purace
Colombia
2.3095°N, 76.3948°W; summit elev. 4650 m
All times are local (unless otherwise noted)
Gas-and-ash emission on 16 November 2023
Puracé, located in Colombia, is a stratovolcano that contains a 500-m-wide summit crater. It is part of the Los Coconucos volcanic chain that is a NW-SE trending group of seven cones and craters. The most recent eruption occurred during March 2022 that was characterized by frequent seismicity and gas-and-steam emissions (BGVN 47:06). This report covers a brief eruption during November 2023 based on monthly reports from the Popayán Observatory, part of the Servicio Geologico Colombiano (SGC).
Activity during November 2022 through November 2023 primarily consisted of seismicity: VT-type events, LP-type events, HB-type events, and TR-type events (table 4). Maximum sulfur dioxide values were measured weekly and ranged from 259-5,854 tons per day (t/d) during November 2022 through April 2023. White gas-and-steam emissions were also occasionally reported.
SGC issued a report on 25 October that noted a significant increase in the number of earthquakes associated with rock fracturing. These earthquakes were located SE of the crater between Puracé and Piocollo at depths of 1-4 km. There were no reported variations in sulfur dioxide values, but SGC noted high carbon dioxide values, compared to those recorded in the first half of 2023.
SGC reported that at 1929 on 16 November the seismic network detected a signal that was possibly associated with a gas-and-ash emission, though it was not confirmed in webcam images due to limited visibility. On 17 November an observer confirmed ash deposits on the N flank. Webcam images showed an increase in degassing both inside the crater and from the NW flank, rising 700 m above the crater.
Table 4. Seismicity at Puracé during November 2022-November 2023. Volcano-tectonic (VT), long-period (LP), hybrid (HB), and tremor (TR) events are reported each month. Courtesy of SGC.
| Month |
Volcano-tectonic |
Long-period |
Hybrid |
Tremor |
| Nov 2022 |
429 |
2,023 |
5 |
831 |
| Dec 2022 |
423 |
1,390 |
9 |
834 |
| Jan 2023 |
719 |
1,622 |
0 |
957 |
| Feb 2023 |
598 |
1,701 |
2 |
1,124 |
| Mar 2023 |
331 |
2,408 |
147 |
607 |
| Apr 2023 |
614 |
4,427 |
33 |
148 |
| May 2023 |
620 |
3,717 |
170 |
109 |
| Jun 2023 |
467 |
3,293 |
86 |
148 |
| Jul 2023 |
1,116 |
5,809 |
183 |
542 |
| Aug 2023 |
692 |
2,927 |
94 |
321 |
| Sep 2023 |
887 |
1,505 |
82 |
848 |
| Oct 2023 |
2,373 |
2,949 |
135 |
692 |
| Nov 2023 |
1,212 |
2,302 |
69 |
293 |
Geologic Background. Puracé is an active andesitic volcano with a 600-m-diameter summit crater at the NW end of the Los Coconucos Volcanic Chain. This volcanic complex includes nine composite and five monogenetic volcanoes, extending from the Puracé crater more than 6 km SE to the summit of Pan de Azúcar stratovolcano. The dacitic massif which the complex is built on extends about 13 km NW-SE and 10 km NE-SW. Frequent small to moderate explosive eruptions reported since 1816 CE have modified the morphology of the summit crater, with the largest eruptions in 1849, 1869, and 1885.
Information Contacts: Servicio Geologico Colombiano (SGC), Diagonal 53 No. 34-53 - Bogotá D.C., Colombia (URL: https://www.sgc.gov.co/volcanes).
Suwanosejima (Japan) — December 2023 Cite this Report
Suwanosejima
Japan
29.638°N, 129.714°E; summit elev. 796 m
All times are local (unless otherwise noted)
Eruption plumes, crater incandescence, and occasional explosions during July-October 2023
Suwanosejima is an 8-km-long island that consists of a stratovolcano and two active summit craters, located in the northern Ryukyu Islands, Japan. Volcanism over the past century has been characterized by Strombolian explosions, ash plumes, and ashfall. The current eruption began in October 2004 and has more recently consisted of frequent eruption plumes, explosions, and incandescent ejecta (BGVN 48:07). This report covers similar activity of ash plumes, explosions, and crater incandescence during July through October 2023 using monthly reports from the Japan Meteorological Agency (JMA) and satellite data.
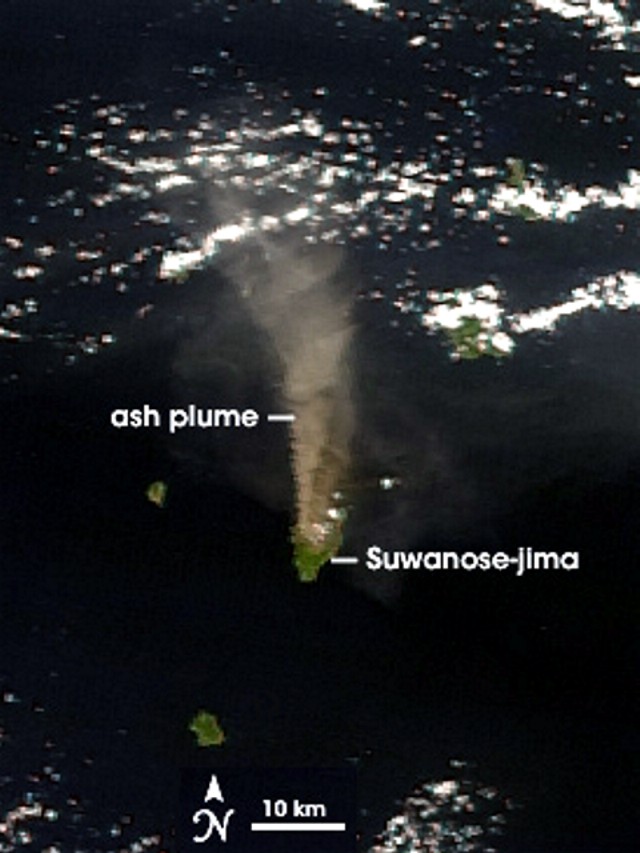
Thermal activity during the reporting period was relatively low; only one low-power thermal anomaly was detected during mid-July and one during early August, based on a MIROVA (Middle InfraRed Observation of Volcanic Activity) Log Radiative Power graph of the MODIS thermal anomaly data. On two clear weather days, a thermal anomaly was visible in infrared satellite images (figure 81).
Low-level activity was reported at the Otake crater during July and no explosions were detected. Eruption plumes rose as high as 1.8 km above the crater. On 13 July an ash plume rose 1.7 km above the crater rim, based on a webcam image. During the night of the 28th crater incandescence was visible in a webcam image. An eruptive event reported on 31 July produced an eruption plume that rose 2.1 km above the crater. Seismicity consisted of 11 volcanic earthquakes on the W flank, the number of which had decreased compared to June (28) and 68 volcanic earthquakes near the Otake crater, which had decreased from 722 in the previous month. According to observations conducted by the University of Tokyo Graduate School of Science, Kyoto University Disaster Prevention Research Institute, Toshima Village, and JMA, the amount of sulfur dioxide emissions released during the month was 400-800 tons per day (t/d).
Eruptive activity in the Otake crater continued during August and no explosions were reported. An eruptive event produced a plume that rose 1 km above the crater at 1447 on 12 August. Subsequent eruptive events were recorded at 0911 on 16 August, at 1303 on 20 August, and at 0317 on 21 August, which produced ash plumes that rose 1-1.1 km above the crater and drifted SE, SW, and W. On 22 August an ash plume was captured in a webcam image rising 1.4 km above the crater (figure 82). Multiple eruptive events were detected on 25 August at 0544, 0742, 0824, 1424, and 1704, which generated ash plumes that rose 1.1-1.2 km above the crater and drifted NE, W, and SW. On 28 August a small amount of ashfall was observed as far as 1.5 km from the crater. There were 17 volcanic earthquakes recorded on the W flank of the volcano and 79 recorded at the Otake crater during the month. The amount of sulfur dioxide emissions released during the month was 400-800 t/d.
Activity continued at the Otake crater during September. Occasionally, nighttime crater incandescence was observed in webcam images and ashfall was reported. An eruptive event at 1949 on 4 September produced an ash plume that rose 1 km above the crater and drifted SW. On 9 September several eruption events were detected at 0221, 0301, and 0333, which produced ash plumes that rose 1.1-1.4 km above the crater rim and drifted W; continuous ash emissions during 0404-0740 rose to a maximum height of 2 km above the crater rim (figure 83). More eruptive events were reported at 1437 on 10 September, at 0319 on 11 September, and at 0511 and 1228 on 15 September, which generated ash plumes that rose 1-1.8 km above the crater. During 25, 27, and 30 September, ash plumes rose as high as 1.3 km above the crater rim. JMA reported that large blocks were ejected as far as 300 m from the center of the crater. There were 18 volcanic earthquakes detected beneath the W flank and 82 volcanic earthquakes detected near the Otake crater. The amount of sulfur dioxide released during the month ranged from 600 to 1,600 t/d.
Activity during early-to-mid-October consisted of occasional explosions, a total number of 13, and ash plumes that rose as high as 1.9 km above the Otake crater rim on 29 October (figure 84). These explosions are the first to have occurred since June 2023. Continuous ash emissions were reported during 0510-0555 on 1 October. Explosions were recorded at 0304, 2141, and 2359 on 2 October, at 0112 on 3 October, and at 1326 on 6 October, which produced ash plumes that rose as high as 1 km above the crater rim and drifted SW and W. An explosion was noted at 0428 on 3 October, but emission details were unknown. A total of eight explosions were recorded by the seismic network at 1522 on 14 October, at 0337, 0433, 0555, 1008, and 1539 on 15 October, and at 0454 and 0517 on 16 October. Ash plumes from these explosions rose as high as 900 m above the crater and drifted SE. Eruptive events during 25-27 and 29-30 October generated plumes that rose as high as 1.9 km above the crater and drifted SE, S, and SW. Ash was deposited in Toshima village (3.5 km SSW). Eruptive activity occasionally ejected large volcanic blocks as far as 600 m from the crater. Nighttime crater incandescence was visible in webcams. Intermittent ashfall was reported as far as 1.5 km from the crater. There were 43 volcanic earthquakes detected on the W flank during the month, and 184 volcanic earthquakes detected near the Otake crater. The amount of sulfur dioxide emitted ranged between 400 and 900 t/d.
Geologic Background. The 8-km-long island of Suwanosejima in the northern Ryukyu Islands consists of an andesitic stratovolcano with two active summit craters. The summit is truncated by a large breached crater extending to the sea on the E flank that was formed by edifice collapse. One of Japan's most frequently active volcanoes, it was in a state of intermittent Strombolian activity from Otake, the NE summit crater, between 1949 and 1996, after which periods of inactivity lengthened. The largest recorded eruption took place in 1813-14, when thick scoria deposits covered residential areas, and the SW crater produced two lava flows that reached the western coast. At the end of the eruption the summit of Otake collapsed, forming a large debris avalanche and creating an open collapse scarp extending to the eastern coast. The island remained uninhabited for about 70 years after the 1813-1814 eruption. Lava flows reached the eastern coast of the island in 1884. Only about 50 people live on the island.
Information Contacts: Japan Meteorological Agency (JMA), 1-3-4 Otemachi, Chiyoda-ku, Tokyo 100-8122, Japan (URL: http://www.jma.go.jp/jma/indexe.html); MIROVA (Middle InfraRed Observation of Volcanic Activity), a collaborative project between the Universities of Turin and Florence (Italy) supported by the Centre for Volcanic Risk of the Italian Civil Protection Department (URL: http://www.mirovaweb.it/); Hawai'i Institute of Geophysics and Planetology (HIGP) - MODVOLC Thermal Alerts System, School of Ocean and Earth Science and Technology (SOEST), Univ. of Hawai'i, 2525 Correa Road, Honolulu, HI 96822, USA (URL: http://modis.higp.hawaii.edu/); Copernicus Browser, Copernicus Data Space Ecosystem, European Space Agency (URL: https://dataspace.copernicus.eu/browser/).
Etna
Italy
37.748°N, 14.999°E; summit elev. 3357 m
All times are local (unless otherwise noted)
Strombolian explosions, lava fountains, and lava flows during July-August 2023
Etna, located on the Italian island of Sicily, has had documented eruptions dating back to 1500 BCE. Activity typically originates from multiple cones at the summit, where several craters have formed and evolved. The currently active craters are Northeast Crater (NEC), Voragine (VOR), and Bocca Nuova (BN), and the Southeast Crater (SEC); VOR and BN were previously referred to as the “Central Crater”. The original Southeast crater formed in 1978, and a second eruptive site that opened on its SE flank in 2011 was named the New Southeast Crater (NSEC). Another eruptive site between the SEC and NSEC developed during early 2017 and was referred to as the "cono della sella" (saddle cone). The current eruption period began in November 2022 and has been characterized by intermittent Strombolian activity, lava flows, and ash plumes (BGVN 48:08). This report updates activity during July through October 2023, which includes primarily gas-and-steam emissions; during July and August Strombolian explosions, lava fountains, and lava flows were reported, based on weekly and special reports by the Osservatorio Etneo (OE), part of the Catania Branch of Italy's Istituo Nazionale di Geofisica e Vulcanologica (INGV) and satellite data.
Variable fumarolic degassing was reported at all summit craters (BN, VOR, NEC, and SEC) throughout the entire reporting period (table 15). The MIROVA (Middle InfraRed Observation of Volcanic Activity) volcano hotspot detection system based on the analysis of MODIS data showed frequent low-to-moderate power thermal anomalies during the reporting period (figure 399). During mid-August there was a pulse in activity that showed an increase in the power of the anomalies due to Strombolian activity, lava fountains, and lava flows. Infrared satellite imagery captured strong thermal anomalies at the central and southeast summit crater areas (figure 400). Accompanying thermal activity were occasional sulfur dioxide plumes that exceeded 2 Dobson Units (DUs) recorded by the TROPOMI instrument on the Sentinel-5P satellite (figure 401).
Table 15. Summary of activity at the four primary crater areas at the summit of Etna during July-October 2023. Information is from INGV weekly reports.
| Month |
Bocca Nuova (BN) |
Voragine (VOR) |
Northeast Crater (NEC) |
Southeast Crater (SEC) |
| Jul 2023 |
Continuous degassing. |
No observations. |
Weak gas emissions. |
Continuous degassing. Sporadic and weak-to-moderate ash emissions. Strombolian explosions. |
| Aug 2023 |
Continuous degassing. |
No observations. |
No observations. |
Continuous degassing. Occasional ash emissions. Strombolian activity, lava fountaining, and lava flows. |
| Sep 2023 |
Variable degassing. Crater incandescence. |
Weak fumarolic activity. |
Weak fumarolic activity. |
Variable degassing. |
| Oct 2023 |
Continuous degassing. |
Weak fumarolic activity. |
Weak fumarolic activity. |
Continuous degassing. |
Activity during July and August was relatively low and mainly consisted of degassing at the summit craters, particularly at SEC and BN. Cloudy weather prevented clear views of the summit during early July. During the night of 2 July some crater incandescence was visible at SEC. Explosive activity resumed at SEC during 9-10 July, which was characterized by sporadic and weak ash emissions that rapidly dispersed in the summit area (figure 402). INGV reported moderate Strombolian activity began at 2034 on 14 July and was confined to the inside of the crater and fed by a vent located in the E part of SEC. An ash emission was detected at 2037. A new vent opened on 15 July in the SE part of BN and began to produce continuous gas-and-steam emissions. During an inspection carried out on 28 July pulsating degassing, along with audible booms, were reported at two active vents in BN. Vigorous gas-and-steam emissions intermittently generated rings. On rare occasions, fine, reddish ash was emitted from BN1 and resuspended by the gas-and-steam emissions.
Around 2000 on 13 August INGV reported a sudden increase in volcanic tremor amplitude. Significant infrasonic activity coincided with the tremor increase. Incandescent flashes were visible through the cloud cover in webcam images of SEC (figure 403). Strombolian activity at SEC began to gradually intensify starting at 2040 as seismicity continued to increase. The Aviation Color Code (ACC) was raised to Yellow (the second lowest-level on a four-color scale) at 2126 and then to Orange (the second highest-level on a four-color scale) at 2129 due to above-background activity. The activity rapidly transitioned from Strombolian activity to lava fountains around 2333 that rose 300-400 m above the crater (figure 403). Activity was initially focused on the E vent of the crater, but then the vent located above the S flank of the cone also became active. A lava flow from this vent traveled SW into the drainage created on 10 February 2022, overlapping with previous flows from 10 and 21 February 2022 and 21 May 2023, moving between Monte Barbagallo and Monte Frumento Supino (figure 404). The lava flow was 350 m long, oriented NNE-SSW, and descended to an elevation of 2.8 km. Flows covered an area of 300,000 m2 and had an estimated volume of 900,000 m3. The ACC was raised to Red at 2241 based on strong explosive activity and ashfall in Rifugio Sapienza-Piano Vetore at 1.7 km elevation on the S flank. INGV reported that pyroclastic flows accompanied this activity.
Activity peaked between 0240 and 0330 on 14 August, when roughly 5-6 vents erupted lava fountains from the E to SW flank of SEC. The easternmost vents produced lava fountains that ejected material strongly to the E, which caused heavy fallout of incandescent pyroclastic material on the underlying flank, triggering small pyroclastic flows. This event was also accompanied by lightning both in the ash column and in the ash clouds that were generated by the pyroclastic flows. A fracture characterized by a series of collapse craters (pit craters) opened on the upper SW flank of SEC. An ash cloud rose a few kilometers above the crater and drifted S, causing ash and lapilli falls in Rifugio Sapienza and expanding toward Nicolosi, Mascalucia, Catania, and up to Syracuse. Ashfall resulted in operational problems at the Catania airport (50 km S), which lasted from 0238 until 2000. By 0420 the volcanic tremor amplitude values declined to background levels. After 0500 activity sharply decreased, although the ash cloud remained for several hours and drifted S. By late morning, activity had completely stopped. The ACC was lowered to Orange as volcanic ash was confined to the summit area. Sporadic, minor ash emissions continued throughout the day. At 1415 the ACC was lowered to Yellow and then to Green at 1417.
During the night of 14-15 August only occasional flashes were observed, which were more intense during avalanches of material inside the eruptive vents. Small explosions were detected at SEC at 2346 on 14 August and at 0900 on 26 August that each produced ash clouds which rapidly dispersed into the atmosphere (figure 405). According to a webcam image, an explosive event detected at 2344 at SEC generated a modest ash cloud that was rapidly dispersed by winds. The ACC was raised to Yellow at 2355 on 14 August due to increasing unrest and was lowered to Green at 0954 on 15 August.
Activity during September and October was relatively low and mainly characterized by variable degassing from BN and SEC. Intense, continuous, and pulsating degassing was accompanied by roaring sounds and flashes of incandescence at BN both from BN1 and the new pit crater that formed during late July (figure 406). The degassing from the new pit crater sometimes emitted vapor rings. Cloudy weather during 6-8 September prevented observations of the summit craters .
Geologic Background. Mount Etna, towering above Catania on the island of Sicily, has one of the world's longest documented records of volcanism, dating back to 1500 BCE. Historical lava flows of basaltic composition cover much of the surface of this massive volcano, whose edifice is the highest and most voluminous in Italy. The Mongibello stratovolcano, truncated by several small calderas, was constructed during the late Pleistocene and Holocene over an older shield volcano. The most prominent morphological feature of Etna is the Valle del Bove, a 5 x 10 km caldera open to the east. Two styles of eruptive activity typically occur, sometimes simultaneously. Persistent explosive eruptions, sometimes with minor lava emissions, take place from one or more summit craters. Flank vents, typically with higher effusion rates, are less frequently active and originate from fissures that open progressively downward from near the summit (usually accompanied by Strombolian eruptions at the upper end). Cinder cones are commonly constructed over the vents of lower-flank lava flows. Lava flows extend to the foot of the volcano on all sides and have reached the sea over a broad area on the SE flank.
Information Contacts: Sezione di Catania - Osservatorio Etneo, Istituto Nazionale di Geofisica e Vulcanologia (INGV), Sezione di Catania, Piazza Roma 2, 95123 Catania, Italy (URL: http://www.ct.ingv.it/it/); MIROVA (Middle InfraRed Observation of Volcanic Activity), a collaborative project between the Universities of Turin and Florence (Italy) supported by the Centre for Volcanic Risk of the Italian Civil Protection Department (URL: http://www.mirovaweb.it/); NASA Global Sulfur Dioxide Monitoring Page, Atmospheric Chemistry and Dynamics Laboratory, NASA Goddard Space Flight Center (NASA/GSFC), 8800 Greenbelt Road, Goddard MD 20771, USA (URL: https://so2.gsfc.nasa.gov/); Copernicus Browser, Copernicus Data Space Ecosystem, European Space Agency (URL: https://dataspace.copernicus.eu/browser/).
Aira
Japan
31.5772°N, 130.6589°E; summit elev. 1117 m
All times are local (unless otherwise noted)
Explosions, ash plumes, ash fall, and crater incandescence during July-October 2023
Aira caldera, located in the northern half of Kagoshima Bay, Japan, contains the post-caldera Sakurajima volcano. Eruptions typically originate from the Minamidake crater, and since the 8th century, ash deposits have been recorded in the city of Kagoshima (10 km W), one of Kyushu’s largest cities. The Minamidake summit cone and crater has had persistent activity since 1955; the Showa crater on the E flank has also been intermittently active since 2006. The current eruption period began during March 2017 and has recently been characterized by intermittent explosions, eruption plumes, and ashfall (BGVN 48:07). This report updates activity during July through October 2023 and describes explosive events, ash plumes, nighttime crater incandescence, and ashfall, according to monthly activity reports from the Japan Meteorological Agency (JMA) and satellite data.
Thermal activity remained at low levels during this reporting period, according to the MIROVA (Middle InfraRed Observation of Volcanic Activity) system (figure 149). There was a slight increase in the number of anomalies during September through October. Occasional thermal anomalies were visible in infrared satellite images mainly at the Minamidake crater (Vent A is located to the left and Vent B is located to the right) (figure 150).
Table 30. Number of monthly explosive events, days of ashfall, area of ash covered, and sulfur dioxide emissions from Sakurajima’s Minamidake crater at Aira during July-October 2023. Note that smaller ash events are not listed. Ashfall days were measured at Kagoshima Local Meteorological Observatory and ashfall amounts represent material covering all the Kagoshima Prefecture. Data courtesy of JMA monthly reports.
| Month |
Explosive events |
Days of ashfall |
Ashfall amount (g/m2) |
SO2 emissions (tons/day) |
| Jul 2023 |
3 |
0 |
0 |
1,600-3,200 |
| Aug 2023 |
3 |
10 |
7 |
1,800-3,300 |
| Sep 2023 |
3 |
7 |
3 |
1,600-2,300 |
| Oct 2023 |
33 |
8 |
61 |
2,200-4,200 |
JMA reported that during July, there were eight eruptions, three of which were explosion events in the Showa crater. Large blocks were ejected as far as 600 m from the Showa crater. Very small eruptions were occasionally reported at the Minamidake crater. Nighttime incandescence was observed in both the Showa and Minamidake crater. Explosions were reported on 16 July at 2314 and on 17 July at 1224 and at 1232 (figure 151). Resulting eruption plumes rose 700-2,500 m above the crater and drifted N. On 23 July the number of volcanic earthquakes on the SW flank of the volcano increased. A strong Mw 3.1 volcanic earthquake was detected at 1054 on 26 July. The number of earthquakes recorded throughout the month was 545, which markedly increased from 73 in June. No ashfall was observed at the Kagoshima Regional Meteorological Observatory during July. According to a field survey conducted during the month, the daily amount of sulfur dioxide emissions was 1,600-3,200 tons per day (t/d).
There were three eruptions reported at the Minamidake crater during August, each of which were explosive. The explosions occurred on 9 August at 0345, on 13 August at 2205, and on 31 August at 0640, which generated ash plumes that rose 800-2,000 m above the crater and drifted W. There were two eruptions detected at Showa crater; on 4 August at 2150 ejecta traveled 800 m from the Showa crater and associated eruption plumes rose 2.3 km above the crater. The explosion at 2205 on 13 August generated an ash plume that rose 2 km above the crater and was accompanied by large blocks that were ejected 600 m from the Minamidake crater (figure 152). Nighttime crater incandescence was visible in a high-sensitivity surveillance camera at both craters. Seismicity consisted of 163 volcanic earthquakes, 84 of which were detected on the SW flank. According to the Kagoshima Regional Meteorological Observatory there was a total of 7 g/m2 of ashfall over the course of 10 days during the month. According to a field survey, the daily amount of sulfur dioxide emitted was 1,800-3,300 t/d.
During September, four eruptions were reported, three of which were explosion events. These events occurred at 1512 on 9 September, at 0018 on 11 September, and at 2211 on 13 September. Resulting ash plumes generally rose 800-1,100 m above the crater. An explosion produced an ash plume at 2211 on 13 September that rose as high as 1.7 km above the crater. Large volcanic blocks were ejected 600 m from the Minamidake crater. Smaller eruptions were occasionally observed at the Showa crater. Nighttime crater incandescence was visible at the Minamidake crater. Seismicity was characterized by 68 volcanic earthquakes, 28 of which were detected beneath the SW flank. According to the Kagoshima Regional Meteorological Observatory there was a total of 3 g/m2 of ashfall over the course of seven days during the month. A field survey reported that the daily amount of sulfur dioxide emitted was 1,600-2,300 t/d.
Eruptive activity during October consisted of 69 eruptions, 33 of which were described as explosive. These explosions occurred during 4 and 11-21 October and generated ash plumes that rose 500-3,600 m above the crater and drifted S, E, SE, and N. On 19 October at 1648 an explosion generated an ash plume that rose 3.6 km above the crater (figure 153). No eruptions were reported in the Showa crater; white gas-and-steam emissions rose 100 m above the crater from a vent on the N flank. Nighttime incandescence was observed at the Minamidake crater. On 24 October an eruption was reported from 0346 through 0430, which included an ash plume that rose 3.4 km above the crater. Ejected blocks traveled 1.2 km from the Minamidake crater. Following this eruption, small amounts of ashfall were observed from Arimura (4.5 km SE) and a varying amount in Kurokami (4 km E) (figure 154). The number of recorded volcanic earthquakes during the month was 190, of which 14 were located beneath the SW flank. Approximately 61 g/m2 of ashfall was reported over eight days of the month. According to a field survey, the daily amount of sulfur dioxide emitted was 2,200-4,200 t/d.
Geologic Background. The Aira caldera in the northern half of Kagoshima Bay contains the post-caldera Sakurajima volcano, one of Japan's most active. Eruption of the voluminous Ito pyroclastic flow accompanied formation of the 17 x 23 km caldera about 22,000 years ago. The smaller Wakamiko caldera was formed during the early Holocene in the NE corner of the caldera, along with several post-caldera cones. The construction of Sakurajima began about 13,000 years ago on the southern rim and built an island that was joined to the Osumi Peninsula during the major explosive and effusive eruption of 1914. Activity at the Kitadake summit cone ended about 4,850 years ago, after which eruptions took place at Minamidake. Frequent eruptions since the 8th century have deposited ash on the city of Kagoshima, located across Kagoshima Bay only 8 km from the summit. The largest recorded eruption took place during 1471-76.
Information Contacts: Japan Meteorological Agency (JMA), 1-3-4 Otemachi, Chiyoda-ku, Tokyo 100-8122, Japan (URL: http://www.jma.go.jp/jma/indexe.html); MIROVA (Middle InfraRed Observation of Volcanic Activity), a collaborative project between the Universities of Turin and Florence (Italy) supported by the Centre for Volcanic Risk of the Italian Civil Protection Department (URL: http://www.mirovaweb.it/); Copernicus Browser, Copernicus Data Space Ecosystem, European Space Agency (URL: https://dataspace.copernicus.eu/browser/).
Nishinoshima (Japan) — November 2023 Cite this Report
Nishinoshima
Japan
27.247°N, 140.874°E; summit elev. 100 m
All times are local (unless otherwise noted)
Gray emissions during October 2023
Nishinoshima is a small island in the Ogasawara Arc, about 1,000 km S of Tokyo, Japan. It contains prominent submarine peaks to the S, W, and NE. Recorded eruptions date back to 1973, with the current eruption period beginning in October 2022. Eruption plumes and fumarolic activity characterize recent activity (BGVN 48:10). This report covers the end of the eruption for September through October 2023, based on information from monthly reports of the Japan Meteorological Agency (JMA) monthly reports, and satellite data.
No eruptive activity was reported during September 2023, although JMA noted that the surface temperature was slightly elevated compared to the surrounding area since early March 2023. The Japan Coast Guard (JCG) conducted an overflight on 20 September and reported white gas-and-steam plumes rising 3 km above the central crater of the pyroclastic cone, as well as multiple white gas-and-steam emissions emanating from the N, E, and S flanks of the crater to the coastline. In addition, dark reddish brown-to-green discolored water was distributed around almost the entire circumference of the island.
Similar low-level activity was reported during October. Multiple white gas-and-steam emissions rose from the N, E, and S flanks of the central crater of the pyroclastic cone and along the coastline; these emissions were more intense compared to the previous overflight observations. Dark reddish brown-to-green discolored water remained visible around the circumference of the island. On 4 October aerial observations by JCG showed a small eruption consisting of continuous gas-and-steam emissions emanating from the central crater, with gray emissions rising to 1.5 km altitude (figure 129). According to observations from the marine weather observation vessel Keifu Maru on 26 October, white gas-and-steam emissions persisted from the center of the pyroclastic cone, as well as from the NW, SW, and SE coasts of the island for about five minutes. Slightly discolored water was visible up to about 1 km.
Frequent low-to-moderate power thermal anomalies were recorded in the MIROVA graph (Middle InfraRed Observation of Volcanic Activity) during September (figure 130). Occasional anomalies were detected during October, and fewer during November through December. A thermal anomaly was visible in the crater using infrared satellite imagery on 6, 8, 11, 16, 18, 21, and 23 September and 8, 13, 21, 26, and 28 October (figure 131).
Geologic Background. The small island of Nishinoshima was enlarged when several new islands coalesced during an eruption in 1973-74. Multiple eruptions that began in 2013 completely covered the previous exposed surface and continued to enlarge the island. The island is the summit of a massive submarine volcano that has prominent peaks to the S, W, and NE. The summit of the southern cone rises to within 214 m of the ocean surface 9 km SSE.
Information Contacts: Japan Meteorological Agency (JMA), 1-3-4 Otemachi, Chiyoda-ku, Tokyo 100-8122, Japan (URL: http://www.jma.go.jp/jma/indexe.html); MIROVA (Middle InfraRed Observation of Volcanic Activity), a collaborative project between the Universities of Turin and Florence (Italy) supported by the Centre for Volcanic Risk of the Italian Civil Protection Department (URL: http://www.mirovaweb.it/); Copernicus Browser, Copernicus Data Space Ecosystem, European Space Agency (URL: https://dataspace.copernicus.eu/browser/).
Kilauea (United States) — October 2023 Cite this Report
Kilauea
United States
19.421°N, 155.287°W; summit elev. 1222 m
All times are local (unless otherwise noted)
Strong lava fountains, lava flows, and spatter at Halema’uma’u during January-September 2023
Kīlauea is on the island of Hawai’i and overlaps the E flank of the Mauna Loa volcano. Its East Rift Zone (ERZ) has been intermittently active for at least 2,000 years. An extended eruption period began in January 1983 and was characterized by open lava lakes and lava flows from the summit caldera and the East Rift Zone. During May 2018 magma migrated into the Lower East Rift Zone (LERZ) and opened 24 fissures along a 6-km-long NE-trending fracture zone that produced lava flows traveling in multiple directions. As lava emerged from the fissures, the lava lake at Halema'uma'u drained and explosions sent ash plumes to several kilometers altitude (BGVN 43:10).
The current eruption period started during September 2021 and has been characterized by low-level lava effusions in the active Halema’uma’u lava lake (BGVN 48:01). This report covers three notable eruption periods during February, June, and September 2023 consisting of lava fountaining, lava flows, and spatter during January through September 2023 using information from daily reports, volcanic activity notices, and abundant photo, map, and video data from the US Geological Survey's (USGS) Hawaiian Volcano Observatory (HVO).
Activity during January 2023. Small earthquake swarms were recorded on 2 January 2023; increased seismicity and changes in the pattern of deformation were noted on the morning of 5 January. At around 1500 both the rate of deformation and seismicity drastically increased, which suggested magma movement toward the surface. HVO raised the Volcano Alert Level (VAL) to Watch (the second highest level on a four-level scale) and the Aviation Color Code (ACC) to Orange (the second highest color on a four-color scale) at 1520.
Multiple lava fountains and lava effusions from vents in the central eastern portion of the Halema’uma’u crater began on 5 January around 0434; activity was confined to the eastern half of the crater and within the basin of the western half of the crater, which was the focus of the eruption in 2021-2022 (figure 525). Incandescence was visible in webcam images at 1634 on 5 January, prompting HVO to raise the VAL to Warning (the highest level on a four-level scale) and the ACC to Red (the highest color on a four-color scale). Lava fountains initially rose as high as 50 m above the vent at the onset of the eruption (figure 526) but then declined to a more consistent 5-6 m height in the proceeding days. By 1930 that same day, lava had covered most of the crater floor (an area of about 1,200,000 m2) and the lava lake had a depth of 10 m. A higher-elevation island that formed during the initial phase of the December 2020 eruption remained exposed, appearing darker in images, along with a ring of older lava around the lava lake that was active prior to December 2022. Overnight during 5-6 January the lava fountains continued to rise 5 m high, and the lava effusion rate had slowed.
On 6 January at 0815 HVO lowered the VAL to Watch and the ACC to Orange due to the declining effusion rates. Sulfur dioxide emission rates ranged from 3,000-12,500 tonnes per day (t/d), the highest value of which was recorded on 6 January. Lava continued to erupt from the vents during 6-8 January, although the footprint of the active area had shrunk; a similar progression has been commonly observed during the early stages of recent eruptions at Halema’uma’u. On 9 January HVO reported one dominant lava fountain rising 6-7 m high in the E half of the crater. Lava flows built up the margins of the lake, causing the lake to be perched. On 10 January the eastern lava lake had an area of approximately 120,000 m2 that increased to 250,000 m2 by 17 January. During 13-31 January several small overflows occurred along the margins of the E lake. A smaller area of lava was active within the basin in the W half of the crater that had been the focus of activity during 2021-2022. On 19 January just after 0200 a small ooze-out was observed on the crater’s W edge.
Activity during February 2023. Activity continued in the E part of Halema’uma’u crater, as well as in a smaller basin in the W part of the 2021-2022 lava lake (figure 527). The E lava lake contained a single lava fountain and frequent overflows. HVO reported that during the morning of 1 February the large E lava lake began to cool and crust over in the center of the lake; two smaller areas of lava were observed on the N and S sides by the afternoon. The dominant lava fountain located in the S part of the lava lake paused for roughly 45 minutes at 2315 and resumed by midnight, rising 1-2 m. At 0100 on 2 February lava from the S part was effusing across the entire E lava lake area, covering the crusted over portion in the center of the lake and continuing across the majority of the previously measured 250,000 m2 by 0400. A small lava pond near the E lake produced an overflow around 0716 on 2 February. On 3 February some lava crust began to form against the N and E levees, which defined the 250,000 m2 eastern lava lake. The small S lava fountain remained active, rising 1-6 m high during 3-9 February; around 0400 on 5 February occasional bursts doubled the height of the lava fountain.
A large breakout occurred overnight during 2100 on 4 February to 0900 on 5 February on the N part of the crater floor, equal to or slightly larger in size than the E lava lake. A second, smaller lava fountain appeared in the same area of the E lava lake between 0300 and 0700 on 5 February and was temporarily active. This large breakout continued until 7 February. A small, brief breakout was reported in the S of the E lava lake around midnight on 7 February. In the W lake, as well as the smaller lava pond in the central portion of the crater floor, contained several overflows during 7-10 February and intermittent fountaining. Activity at the S small lava pond and the small S lava fountain within the E lake declined during 9-10 February. The lava pond in the central portion of the crater floor had nearly continuous, expansive flows during 10-13 February; channels from the small central lava pond seemed to flow into the larger E lake. During 13-18 February a small lava fountain was observed in the small lava pond in the central portion of the crater floor. Continuous overflows persisted during this time.
Activity in the eastern and central lakes began to decline in the late afternoon of 17 February. By 18 February HVO reported that the lava effusions had significantly declined, and that the eastern and central lakes were no longer erupting. The W lake in the basin remained active but at a greatly reduced level that continued to decline. HVO reported that this decrease in activity is attributed to notable deflationary tilt that began early on the morning of 17 February and lasted until early 19 February. By 19 February the W lake was mostly crusted over although some weak lava flows remained, which continued through 28 February. The sulfur dioxide emission rates ranged 250-2,800 t/d, the highest value of which was recorded on 6 February.
Activity during March 2023. The summit eruption at Halema’uma’u crater continued at greatly reduced levels compared to the previous two months. The E and central vents stopped effusing lava, and the W lava lake remained active with weak lava flows; the lake was mostly crusted over, although slowly circulating lava intermittently overturned the crust. By 6 March the lava lake in the W basin had stopped because the entire surface was crusted over. The only apparent surface eruptive activity during 5-6 March was minor ooze-outs of lava onto the crater floor, which had stopped by 7 March. Several hornitos on the crater floor still glowed through 12 March according to overnight webcam images, but they did not erupt any lava. A small ooze-out of lava was observed just after 1830 in the W lava lake on 8 March, which diminished overnight. The sulfur dioxide emission rate ranged from 155-321 t/d on 21 March. The VAL was lowered to Advisory, and the ACC was lowered to Yellow (the second lowest on a four-color scale) on 23 March due to a pause in the eruption since 7 March.
Activity during April-May 2023. The eruption at Halema’uma’u crater was paused; no lava effusions were visible on the crater floor. Sulfur dioxide emission rates ranged from 75-185 t/d, the highest of which was measured on 22 April. During May and June summit seismicity was elevated compared to seismicity that preceded the activity during January.
Activity during June 2023. Earthquake activity and changes in the patterns of ground deformation beneath the summit began during the evening of 6 June. The data indicated magma movement toward the surface, prompting HVO to raise the VAL to Watch and the ACC to Orange. At about 0444 on 7 June incandescence in Halema’uma’u crater was visible in webcam images, indicating that a new eruption had begun. HVO raised the VAL to Warning and the ACC to Red (the highest color on a four-color scale). Lava flowed from fissures that had opened on the crater floor. Multiple minor lava fountains were active in the central E portion of the Halema’uma’u crater, and one vent opened on the W wall of the caldera (figure 528). The eruptive vent on the SW wall of the crater continued to effuse into the lava lake in the far SW part of the crater (figure 529). The largest lava fountain consistently rose 15 m high; during the early phase of the eruption, fountain bursts rose as high as 60 m. Lava flows inundated much of the crater floor and added about 6 m depth of new lava within a few hours, covering approximately 10,000 m2. By 0800 on 7 June lava filled the crater floor to a depth of about 10 m. During 0800-0900 the sulfur dioxide emission rate was about 65,000 t/d. Residents of Pahala (30 km downwind of the summit) reported minor deposits of fine, gritty ash and Pele’s hair. A small spatter cone had formed at the vent on the SW wall by midday, and lava from the cone was flowing into the active lava lake. Fountain heights had decreased from the onset of the eruption and were 4-9 m high by 1600, with occasional higher bursts. Inflation switched to deflation and summit earthquake activity greatly diminished shortly after the eruption onset.
At 0837 on 8 June HVO lowered the VAL to Watch and the ACC to Orange because the initial high effusion rates had declined, and no infrastructure was threatened. The surface of the lava lake had dropped by about 2 m, likely due to gas loss by the morning of 8 June. The drop left a wall of cooled lava around the margins of the crater floor. Lava fountain heights decreased during 8-9 June but continued to rise to 10 m high. Active lava and vents covered much of the W half of Halema’uma’u crater in a broad, horseshoe-shape around a central, uplifted area (figure 530). The preliminary average effusion rate for the first 24 hours of the eruption was about 150 cubic meters per second, though the estimate did not account for vesiculated lava and variations in crater floor topography. The effusion rate during the very earliest phases of the eruption appeared significantly higher than the previous three summit eruptions based on the rapid coverage of the entire crater floor. An active lava lake, also referred to as the “western lava lake” was centered within the uplifted area and was fed by a vent in the NE corner. Two small active lava lakes were located just SE from the W lava lake and in the E portion of the crater floor.
During 8-9 June the lava in the central lava lake had a thickness of approximately 1.5 m, based on measurements from a laser rangefinder. During 9-12 June the height of the lava fountains decreased to 9 m high. HVO reported that the previously active lava lake in the E part of the crater appeared stagnant during 10-11 June. The surface of the W lake rose approximately 1 m overnight during 11-12 June, likely due to the construction of a levee around it. Only a few small fountains were active during 12-13 June; the extent of the active lava had retreated so that all activity was concentrated in the SW and central parts of Halema’uma’u crater. Intermittent spattering from the vent on the SW wall was visible in overnight webcam images during 13-18 June. On the morning of 14 June a weak lava effusion originated from near the western eruptive vent, but by 15 June there were no signs of continued activity. HVO reported that other eruptive vents in the SW lava lake had stopped during this time, following several days of waning activity; lava filled the lake by about 0.5 m. Lava circulation continued in the central lake and no active lava was reported in the northern or eastern parts of the crater. Around 0800 on 15 June the top of the SW wall spatter cone collapsed, which was followed by renewed and constant spattering from the top vent and a change in activity from the base vent; several new lava flows effused from the top of the cone, as well as from the pre-existing tube-fed flow from its base. Accumulation of lava on the floor resulted in a drop of the central basin relative to the crater floor, allowing several overflows from the SW lava lake to cascade into the basin during the night of 15 June into the morning of 16 June.
Renewed lava fountaining was reported at the eruptive vent on the SW side of the crater during 16-19 June, which effused lava into the far SW part of the crater. This activity was described as vigorous during midday on 16 June; a group of observatory geologists estimated that the lava was consistently ejected at least 10 m high, with some spatter ejected even higher and farther. Deposits from the fountain further heightened and widened the spatter cone built around the original eruptive vent in the lower section of the crater wall. Multiple lava flows from the base of the cone were fed into the SW lava lake and onto the southwestern-most block from the 2018 collapse within Halema’uma’u on 17 June (figure 531); by 18 June they focused into a single flow feeding into the SW lava lake. On the morning of 19 June a second lava flow from the base of the eruptive cone advanced into the SW lava lake.
Around 1600 on 19 June there was a rapid decline in lava fountaining and effusion at the eruptive vent on the SW side of the crater; vent activity had been vigorous up to that point (figure 532). Circulation in the lava lake also slowed, and the lava lake surface dropped by several meters. Overnight webcam images showed some previously eruptive lava still flowing onto the crater floor, which continued until those flows began to cool. By 21 June no lava was erupting in Halema’uma’u crater. Overnight webcam images during 29-30 June showed some incandescence from previously erupted lava flows as they continued to cool. Seismicity in the crater declined to low levels. Sulfur dioxide emission rates ranged 160-21,000 t/d throughout the month, the highest measurement of which was recorded on 8 June. On 30 June the VAL was lowered to Advisory (the second level on a four-level scale) and the ACC was lowered to Yellow. Gradual inflation was detected at summit tiltmeters during 19-30 June.
Activity during July-August 2023. During July, the eruption paused; no lava was erupting in Halema’uma’u crater. Nighttime webcam images showed some incandescence from previously erupted lava as it continued to cool on the crater floor. During the week of 14 August HVO reported that the rate in seismicity increased, with 467 earthquakes of Mw 3.2 and smaller occurring. Sulfur dioxide emission rates remained low, ranging from 75-86 t/d, the highest of which was recorded on 10 and 15 August. On 15 August beginning at 0730 and lasting for several hours, a swarm of approximately 50 earthquakes were detected at a depth of 2-3 km below the surface and about 2 km long directly S of Halema’uma’u crater. HVO reported that this was likely due to magma movement in the S caldera region. During 0130-0500 and 1700-2100 on 21 August two small earthquake swarms of approximately 20 and 25 earthquakes, respectively, occurred at the same location and at similar depths. Another swarm of 50 earthquakes were recorded during 0430-0830 on 23 August. Elevated seismicity continued in the S area through the end of the month.
Activity during September 2023. Elevated seismicity persisted in the S summit with occasional small, brief seismic swarms. Sulfur dioxide measurements were relatively low and were 70 t/d on 8 September. About 150 earthquakes occurred during 9-10 September, and tiltmeter and Global Positioning System (GPS) data showed inflation in the S portion of the crater.
At 0252 on 10 September HVO raised the VAL to Watch and the ACC to Orange due to increased earthquake activity and changes in ground deformation that indicated magma moving toward the surface. At 1515 the summit eruption resumed in the E part of the caldera based on field reports and webcam images. Fissures opened on the crater floor and produced multiple minor lava fountains and flows (figure 533). The VAL and ACC were raised to Warning and Red, respectively. Gas-and-steam plumes rose from the fissures and drifted downwind. A line of eruptive vents stretched approximately 1.4 km from the E part of the crater into the E wall of the down dropped block by 1900. The lava fountains at the onset of the eruption had an estimated 50 m height, which later rose 20-25 m high. Lava erupted from fissures on the down dropped block and expanded W toward Halema’uma’u crater. Data from a laser rangefinder recorded about 2.5 m thick of new lava added to the W part of the crater. Sulfur dioxide emissions were elevated in the eruptive area during 1600-1500 on 10 September, measuring at least 100,000 t/d.
At 0810 on 11 September HVO lowered the VAL and ACC back to Watch and Orange due to the style of eruption and the fissure location had stabilized. The initial extremely high effusion rates had declined (but remained at high levels) and no infrastructure was threatened. An eruption plume, mainly comprised of sulfur dioxide and particulates, rose as high as 3 km altitude. Several lava fountains were active on the W side of the down dropped block during 11-15 September, while the easternmost vents on the down dropped block and the westernmost vents in the crater became inactive on 11 September (figure 534). The remaining vents spanned approximately 750 m and trended roughly E-W. The fed channelized lava effusions flowed N and W into Halema’uma’u. The E rim of the crater was buried by new lava flows; pahoehoe lava flows covered most of the crater floor except areas of higher elevation in the SW part of the crater. The W part of the crater filled about 5 m since the start of the eruption, according to data from a laser rangefinder during 11-12 September. Lava fountaining continued, rising as high as 15 m by the morning of 12 September. During the morning of 13 September active lava flows were moving on the N and E parts of the crater. The area N of the eruptive vents that had active lava on its surface became perched and was about 3 m higher than the surrounding ground surface. By the morning of 14 September active lava was flowing on the W part of the down dropped block and the NE parts of the crater. The distances of the active flows progressively decreased. Spatter had accumulated on the S (downwind) side of the vents, forming ramparts about 20 m high.
Vigorous spattering was restricted to the westernmost large spatter cone with fountains rising 10-15 m high. Minor spattering occurred within the cone to the E of the main cone, but HVO noted that the fountains remained mostly below the rim of the cone. Lava continued to effuse from these cones and likely from several others as well, traveled N and W, confined to the W part of the down-dropped block and the NE parts of Halema’uma’u. Numerous ooze-outs of lava were visible over other parts of the crater floor at night. Laser range-finder measurements taken of the W part of the crater during 14-15 September showed that lava filled the crater by 10 m since the start of the eruption. Sulfur dioxide emissions remained elevated after the onset of the eruption, ranging 20,000-190,000 t/d during the eruption activity, the highest of which occurred on 10 September.
Field crews observed the eruptive activity on 15 September; they reported a notable decrease or stop in activity at several vents. Webcam images showed little to no fountaining since 0700 on 16 September, though intermittent spattering continued from the westernmost large cone throughout the night of 15-16 September. Thermal images showed that lava continued to flow onto the crater floor. On 16 September HVO reported that the eruption stopped around 1200 and that there was no observable activity anywhere overnight or on the morning of 17 September. HVO field crews reported that active lava was no longer flowing onto Halema’uma’u crater floor and was restricted to a ponded area N of the vents on the down dropped block. They reported that spattering stopped around 1115 on 16 September. Nighttime webcam images showed some incandescence on the crater floor as lava continued to cool. Field observations supported by geophysical data showed that eruptive tremor in the summit region decreased over 15-16 September and returned to pre-eruption levels by 1700 on 16 September. Sulfur dioxide emissions were measured at a rate of 800 t/d on 16 September while the eruption was waning, and 200 t/d on 17 September, which were markedly lower compared to measurements taken the previous week of 20,000-190,000 t/d.
Geologic Background. Kilauea overlaps the E flank of the massive Mauna Loa shield volcano in the island of Hawaii. Eruptions are prominent in Polynesian legends; written documentation since 1820 records frequent summit and flank lava flow eruptions interspersed with periods of long-term lava lake activity at Halemaumau crater in the summit caldera until 1924. The 3 x 5 km caldera was formed in several stages about 1,500 years ago and during the 18th century; eruptions have also originated from the lengthy East and Southwest rift zones, which extend to the ocean in both directions. About 90% of the surface of the basaltic shield volcano is formed of lava flows less than about 1,100 years old; 70% of the surface is younger than 600 years. The long-term eruption from the East rift zone between 1983 and 2018 produced lava flows covering more than 100 km2, destroyed hundreds of houses, and added new coastline.
Information Contacts: Hawaiian Volcano Observatory (HVO), U.S. Geological Survey, PO Box 51, Hawai'i National Park, HI 96718, USA (URL: http://hvo.wr.usgs.gov/).
Tinakula (Solomon Islands) — December 2023 Cite this Report
Tinakula
Solomon Islands
10.386°S, 165.804°E; summit elev. 796 m
All times are local (unless otherwise noted)
Continued lava flows and thermal activity during June through November 2023
Tinakula is a remote 3.5 km-wide island in the Solomon Islands, located 640 km ESE of the capital, Honiara. The current eruption period began in December 2018 and has more recently been characterized by intermittent lava flows and thermal activity (BGVN 48:06). This report covers similar activity during June through November 2023 using satellite data.
During clear weather days (20 July, 23 September, 23 October, and 12 November), infrared satellite imagery showed lava flows that mainly affected the W side of the island and were sometimes accompanied by gas-and-steam emissions (figure 54). The flow appeared more intense during July and September compared to October and November. According to the MODVOLC thermal alerts, there were a total of eight anomalies detected on 19 and 21 July, 28 and 30 October, and 16 November. Infrared MODIS satellite data processed by MIROVA (Middle InfraRed Observation of Volcanic Activity) detected a small cluster of thermal activity occurring during late July, followed by two anomalies during August, two during September, five during October, and five during November (figure 55).
Geologic Background. The small 3.5-km-wide island of Tinakula is the exposed summit of a massive stratovolcano at the NW end of the Santa Cruz islands. It has a breached summit crater that extends from the summit to below sea level. Landslides enlarged this scarp in 1965, creating an embayment on the NW coast. The Mendana cone is located on the SE side. The dominantly andesitic volcano has frequently been observed in eruption since the era of Spanish exploration began in 1595. In about 1840, an explosive eruption apparently produced pyroclastic flows that swept all sides of the island, killing its inhabitants. Recorded eruptions have frequently originated from a cone constructed within the large breached crater. These have left the upper flanks and the steep apron of lava flows and volcaniclastic debris within the breach unvegetated.
Information Contacts: MIROVA (Middle InfraRed Observation of Volcanic Activity), a collaborative project between the Universities of Turin and Florence (Italy) supported by the Centre for Volcanic Risk of the Italian Civil Protection Department (URL: http://www.mirovaweb.it/); Hawai'i Institute of Geophysics and Planetology (HIGP) - MODVOLC Thermal Alerts System, School of Ocean and Earth Science and Technology (SOEST), Univ. of Hawai'i, 2525 Correa Road, Honolulu, HI 96822, USA (URL: http://modis.higp.hawaii.edu/); Copernicus Browser, Copernicus Data Space Ecosystem, European Space Agency (URL: https://dataspace.copernicus.eu/browser/).
Fuego (Guatemala) — December 2023 Cite this Report
Fuego
Guatemala
14.4748°N, 90.8806°W; summit elev. 3799 m
All times are local (unless otherwise noted)
Daily explosions, gas-and-ash plumes, and block avalanches during August-November 2023
Fuego is one of three large stratovolcanoes overlooking the city of Antigua, Guatemala. It has been erupting since January 2002, with observed eruptions dating back to 1531 CE. Typical activity is characterized by ashfall, pyroclastic flows, lava flows, and lahars. Frequent explosions with ash emissions, block avalanches, and lava flows have been reported since 2018. More recently, activity has been characterized by multiple explosions and ash plumes each day, ashfall, block avalanches, and pyroclastic flows (BGVN 48:09). This report describes similar activity of explosions, gas-and-ash plumes, and block avalanches during August through November 2023 based on daily reports from the Instituto Nacional de Sismologia, Vulcanología, Meteorología e Hidrologia (INSIVUMEH) and various satellite data.
Multiple explosions each day were reported during August through November 2023 that produced ash plumes that rose to 4.9 km altitude and drifted as far as 30 km in different directions. The explosions also caused rumbling sounds of varying intensities, with shock waves that vibrated the roofs and windows of homes near the volcano. Incandescent pulses of material rose as high as 350 m above the crater, accompanied by block avalanches that descended multiple drainages. Light ashfall was often reported in nearby communities (table 29). MIROVA (Middle InfraRed Observation of Volcanic Activity) analysis of MODIS satellite data showed intermittent low-to-moderate power thermal activity during the reporting period (figure 175). A total of seven MODVOLC thermal alerts were issued on 11 August, 1, 13, and 23 September, and 10, 17, and 18 November. On clear weather days thermal anomalies were also visible in infrared satellite imagery in the summit crater (figure 176).
Table 29. Activity at Fuego during August through November 2023 included multiple explosions every hour. Ash emissions rose as high as 4.9 km altitude and drifted in multiple directions as far as 30 km, causing ashfall in many communities around the volcano. Data from daily INSIVUMEH reports.
| Month |
Explosions per hour |
Maximum ash plume altitude (km) |
Ash plume direction and distance (km) |
Drainages affected by block avalanches |
Communities reporting ashfall |
| Aug 2023 |
1-11 |
4.8 |
W, NW, SW, N, NE, and E 8-30 km |
Ceniza, Santa Teresa, Seca, Taniluyá, Las Lajas, El Jute, Trinidad, and Honda |
Panimaché, Morelia, Santa Sofía, Yepocapa, Finca Palo Verde, Sangre de Cristo, Acatenango, Aldeas, El Porvenir, La Reunión, San Miguel Dueñas, Cuidad Vieja, Antigua, Quisaché, and El Sendero |
| Sep 2023 |
3-11 |
4.8 |
SW, W, NW, S, and SE 10-30 km |
Seca, Taniluyá, Ceniza, Las Lajas, Honda, Santa Teresa, Trinidad, and El Jute |
Panimaché I and II, Morelia, Palo Verde, Sangre de Cristo, Yepocapa, El Porvenir, Aldeas, Santa Sofía, Montellano, El Socorro, La Rochela, La Asunción, San Andrés Osuna, Guadalupe, and La Trinidad |
| Oct 2023 |
2-10 |
4.9 |
W, SW, S, NW, N, NE, and SE 10-30 km |
Ceniza, Santa Teresa, Taniluyá, Trinidad, Seca, El Jute, Las Lajas, and Honda |
Aldeas, Panimaché I and II, Morelia, Santa Sofía, El Porvenir, Sangre de Cristo, Yepocapa, Yucales, Palo Verde, Acatenango, Patzicía, San Miguel Dueñas, Alotenango, La Soledad, El Campamento, La Rochela, Las Palmas, and Quisaché |
| Nov 2023 |
1-10 |
4.8 |
W, SW, S, E, SE, NW, and N 10-30 km |
Seca, Taniluyá, Ceniza, Las Lajas, EL Jute, Honda, Santa Teresa, and Trinidad |
Panimaché I and II, Morelia, Yepocapa, Santa Sofía, Aldeas, Sangre de Cristo, Palo Verde, El Porvenir, Yucales, La Rochela, San Andrés Osuna, Ceilán, Quisaché, Acatenango, and La Soledad |
Activity during August consisted of 1-11 explosions each day, which generated ash plumes that rose to 4-4.8 km altitude and drifted 8-30 km W, NW, SW, N, NE, and E. Fine ashfall was reported in Panimaché I and II (8 km SW), Morelia (9 km SW), Santa Sofía (12 km SW), Yepocapa (8 km NW), Finca Palo Verde (10 km WSW), Sangre de Cristo (8 km WSW), Acatenango (8 km E), Aldeas, El Porvenir (11 km SW), La Reunión (7 km SE), San Miguel Dueñas (10 km NE), Ciudad Vieja (13.5 km NE), Antigua (18 km NE), Quisaché (8 km NW), and El Sendero. The explosions sometimes ejected incandescent material 50-250 m above the crater and generated weak-to-moderate block avalanches that descended the Santa Teresa (W), Seca (W), Taniluyá (SW), Ceniza (SSW), Las Lajas (SE), El Jute (ESE), Trinidad (S), and Honda (E) drainages. Lahars were reported in the Ceniza drainage on 8-9, 16, 26-27, and 29 August, carrying fine and hot volcanic material, branches, tree trunks, and blocks measured 30 cm up to 1.5 m in diameter. Similar lahars affected the Las Lajas, El Jute, Seca, and El Mineral (W) drainages on 27 August.
Daily explosions ranged from 3-11 during September, which produced ash plumes that rose to 4-4.8 km altitude and drifted 10-30 km SW, W, NW, S, and SE. The explosions were accompanied by block avalanches that affected the Seca, Taniluyá, Ceniza, Las Lajas, Honda, Santa Teresa, Trinidad, and El Jute drainages and occasional incandescent ejecta rose 50-300 m above the crater. Fine ashfall was reported in Panimaché I and II, Morelia, Palo Verde, Sangre de Cristo, Yepocapa, El Porvenir, Aldeas, Santa Sofía, Montellano, El Socorro, La Rochela (8 km SSW), La Asunción (12 km SW), San Andrés Osuna (11 km SSW), Guadalupe, La Trinidad (S). Lahars triggered by rainfall were detected in the Ceniza drainage on 3-4, 8, 13-14, 17, 20-21, 24, 26, 29-30 September, which carried fine and hot volcanic material, branches, tree trunks, and blocks measuring 30 cm to 3 m in diameter. Similar lahars were also detected in the Seca, El Mineral, Las Lajas, and El Jute drainages on 27 September.
There were 2-10 explosions recorded each day during October, which produced ash plumes that rose to 4-4.9 km altitude and drifted 10-30 km W, SW, S, NW, N, NE, and SE. Incandescent pulses of material rose 50-350 m above the crater. Many of the explosions generated avalanches that descended the Ceniza, Santa Teresa, Taniluyá, Trinidad, Seca, El Jute, Las Lajas, and Honda drainages. Ashfall was reported in Aldeas, Panimaché I and II, Morelia, Santa Sofía, El Porvenir, Sangre de Cristo, Yepocapa, Yucales, Palo Verde, Acatenango, Patzicía, Alotenango, La Soledad (11 km N), El Campamento, La Rochela, Las Palmas, and Quisaché. Lahars continued to be observed on 2-5, 7, 9, 11, and 21-22 October, carrying fine and hot volcanic material, branches, tree trunks, and blocks measuring 30 cm to 3 m in diameter. Similar lahars were also reported in the Seca and Las Lajas drainage on 2 October and in the Las Lajas drainage on 4 October. On 4 October lahars overflowed the Ceniza drainage toward the Zarco and Mazate drainages, which flow from Las Palmas toward the center of Siquinalá, resulting from intense rainfall and the large volume of pyroclastic material in the upper part of the drainage. On 9 October a lahar was reported in the Seca and Las Lajas drainages, and lahars in the Las Lajas and El Jute drainages were reported on 11 October. A lahar on 22 October was observed in the Seca drainage, which interrupted transportation between San Pedro Yepocapa and the communities in Santa Sofía, Morelia, and Panimaché.
During November, 1-10 daily explosions were recorded, sometimes accompanied by avalanches, rumbling sounds, and shock waves. Gas-and-ash plumes rose 4.5-4.8 km altitude and extended 10-30 km W, SW, S, E, SE, NW, and N. Incandescent pulses of material rose 50-200 m above the crater. Fine ashfall was reported in Panimaché I and II, Morelia, Yepocapa, El Porvenir, Palo Verde, Santa Sofía, Aldeas, Sangre de Cristo, Yucales, La Rochela, San Andrés Osuna, Ceilán (9 km S), Quisaché, Acatenango, La Soledad. Avalanches of material descended the Seca, Taniluyá, Ceniza, Las Lajas, El Jute, Honda, Santa Teresa, and Trinidad drainages.
Geologic Background. Volcán Fuego, one of Central America's most active volcanoes, is also one of three large stratovolcanoes overlooking Guatemala's former capital, Antigua. The scarp of an older edifice, Meseta, lies between Fuego and Acatenango to the north. Construction of Meseta dates back to about 230,000 years and continued until the late Pleistocene or early Holocene. Collapse of Meseta may have produced the massive Escuintla debris-avalanche deposit, which extends about 50 km onto the Pacific coastal plain. Growth of the modern Fuego volcano followed, continuing the southward migration of volcanism that began at the mostly andesitic Acatenango. Eruptions at Fuego have become more mafic with time, and most historical activity has produced basaltic rocks. Frequent vigorous eruptions have been recorded since the onset of the Spanish era in 1524, and have produced major ashfalls, along with occasional pyroclastic flows and lava flows.
Information Contacts: Instituto Nacional de Sismologia, Vulcanologia, Meteorologia e Hydrologia (INSIVUMEH), Unit of Volcanology, Geologic Department of Investigation and Services, 7a Av. 14-57, Zona 13, Guatemala City, Guatemala (URL: http://www.insivumeh.gob.gt/ ); MIROVA (Middle InfraRed Observation of Volcanic Activity), a collaborative project between the Universities of Turin and Florence (Italy) supported by the Centre for Volcanic Risk of the Italian Civil Protection Department (URL: http://www.mirovaweb.it/); Hawai'i Institute of Geophysics and Planetology (HIGP) - MODVOLC Thermal Alerts System, School of Ocean and Earth Science and Technology (SOEST), Univ. of Hawai'i, 2525 Correa Road, Honolulu, HI 96822, USA (URL: http://modis.higp.hawaii.edu/); Copernicus Browser, Copernicus Data Space Ecosystem, European Space Agency (URL: https://dataspace.copernicus.eu/browser/).
Santa Maria (Guatemala) — December 2023 Cite this Report
Santa Maria
Guatemala
14.757°N, 91.552°W; summit elev. 3745 m
All times are local (unless otherwise noted)
Continuing lava effusion, explosions, ash plumes, and pyroclastic flows during August-November 2023
The Santiaguito lava dome complex of Guatemala’s Santa María volcano has been actively erupting since 1922. The lava dome complex lies within a large crater on the SW flank of Santa María that was formed during the 1902 eruption. Ash explosions, pyroclastic flows, and lava flows have emerged from Caliente, the youngest of the four vents in the complex for more than 40 years. A lava dome that appeared within Caliente’s summit crater in October 2016 has continued to grow, producing frequent block avalanches down the flanks. More recently, activity has been characterized by frequent explosions, lava flows, ash plumes, and pyroclastic flows (BGVN 48:09). This report covers activity during August through November 2023 based on information from Guatemala's INSIVUMEH (Instituto Nacional de Sismologia, Vulcanologia, Meterologia e Hidrologia) and various satellite data.
Activity during August consisted of weak-to-moderate explosions, avalanches of material, gas-and-ash plumes, and incandescence observed at night and in the early morning. Weak degassing plumes rose 300-600 m above the crater. Frequent explosions were detected at a rate of 1-2 per hour, which produced gas-and-ash plumes that rose 200-1,000 m above the crater and drifted W, NW, SW, S, E, and NE. Two active lava flows continued mainly in the Zanjón Seco (SW) and San Isidro (W) drainages. Incandescent block avalanches and occasional block-and-ash flows were reported on the W, S, E, SE, and SW flanks, as well as on the lava flows. On 26 and 29 August, fine ash plumes rose to 3.5 km altitude and drifted E and NE, causing ashfall in Belén (10 km S) and Calaguache (9 km S), as well as Santa María de Jesús (5 km SE) on 29 August.
Daily degassing, weak-to-moderate explosions, gas-and-ash plumes, and nighttime and early morning incandescence in the upper part of the dome continued during September. Explosions occurred at a rate of 1-2 per hour. Gas-and-ash plumes rose 200-1,000 m above the crater and drifted SW, W, SE, and NW. Block avalanches descended the SW, S, SE, and E flanks, often reaching the base of the Caliente dome. These avalanches were sometimes accompanied by short pyroclastic flows, resulting in fires in some vegetated areas. Block-and-ash flows descended all flanks of the Caliente dome on 16 and 24 September following the eruption of gas-and-ash plumes that rose 700-1,000 m above the crater. Gray ash was primarily deposited in the drainages.
Continuous gas-and-steam emissions occurred in October, along with weak-to-moderate explosions, block avalanches, crater incandescence, and an active lava flow on the WSW flank. Explosions occurred at a rate of 1-4 per hour, that generated gas-and-ash plumes rose 200-1,000 m above the crater and drifted in different directions. Block avalanches traveled down the SW, S, SE, and E flanks, sometimes accompanied by small pyroclastic flows. On 21 and 25 October as many as 50 explosions occurred over the course of 24 hours.
Similar activity persisted during November, with frequent explosions, crater incandescence, and block avalanches. The active lava flow persisted on the WSW flank. Weak-to-moderate explosions occurred at a rate of 1-4 per hour. Incandescence was observed at night and in the early morning. Gas-and-ash emissions rose 700-900 m above the crater and drifted W, SW, S, and NW. Block avalanches were reported on the SW, W, S, SE, and E flanks, which deposited gray ash material in the drainages, sometimes reaching the base of the Caliente dome. Those avalanches were sometimes accompanied by small pyroclastic flows that reached the base of the dome on the W, SW, and S flanks. Ashfall was reported in Las Marías (10 km S), El Viejo Palmar (12 km SSW), El Patrocinio, and San Marcos (8 km SW) on 18 and 22 November. On 26 and 30 November ashfall was reported in San Marcos and Loma Linda Palajunoj (7 km SW).
The MIROVA (Middle InfraRed Observation of Volcanic Activity) graph showed frequent moderate-power thermal anomalies during the reporting period (figure 140). A total of 26 MODVOLC thermal alerts were issued on 6, 7, 7, 15, 16, and 21 August, 15 and 23 September, 19, 26, 27, and 29 October, and 2, 7, 11, 27, 28, and 29 November. Clouds covered the summit of the volcano on most days, so thermal anomalies could not be identified in most Sentinel infrared satellite images.
Geologic Background. Symmetrical, forest-covered Santa María volcano is part of a chain of large stratovolcanoes that rise above the Pacific coastal plain of Guatemala. The sharp-topped, conical profile is cut on the SW flank by a 1.5-km-wide crater. The oval-shaped crater extends from just below the summit to the lower flank, and was formed during a catastrophic eruption in 1902. The renowned Plinian eruption of 1902 that devastated much of SW Guatemala followed a long repose period after construction of the large basaltic andesite stratovolcano. The massive dacitic Santiaguito lava-dome complex has been growing at the base of the 1902 crater since 1922. Compound dome growth at Santiaguito has occurred episodically from four vents, with activity progressing E towards the most recent, Caliente. Dome growth has been accompanied by almost continuous minor explosions, with periodic lava extrusion, larger explosions, pyroclastic flows, and lahars.
Information Contacts: Instituto Nacional de Sismologia, Vulcanologia, Meteorologia e Hydrologia (INSIVUMEH), Unit of Volcanology, Geologic Department of Investigation and Services, 7a Av. 14-57, Zona 13, Guatemala City, Guatemala (URL: http://www.insivumeh.gob.gt/); MIROVA (Middle InfraRed Observation of Volcanic Activity), a collaborative project between the Universities of Turin and Florence (Italy) supported by the Centre for Volcanic Risk of the Italian Civil Protection Department (URL: http://www.mirovaweb.it/); Hawai'i Institute of Geophysics and Planetology (HIGP) - MODVOLC Thermal Alerts System, School of Ocean and Earth Science and Technology (SOEST), Univ. of Hawai'i, 2525 Correa Road, Honolulu, HI 96822, USA (URL: http://modis.higp.hawaii.edu/); Copernicus Browser, Copernicus Data Space Ecosystem, European Space Agency (URL: https://dataspace.copernicus.eu/browser/).
Karangetang (Indonesia) — November 2023 Cite this Report
Karangetang
Indonesia
2.781°N, 125.407°E; summit elev. 1797 m
All times are local (unless otherwise noted)
Incandescent avalanches, pyroclastic flows, and ash plumes during July-September 2023
Karangetang (also known as Api Siau), at the northern end of the island of Siau, Indonesia, contains five summit craters along a N-S line. More than 40 eruptions have been recorded since 1675; recent eruptions have included frequent explosive activity, sometimes accompanied by pyroclastic flows and lahars. Lava dome growth has occurred in the summit craters and collapses of lava flow fronts have also produced pyroclastic flows. The two active summit craters are Kawah Dua (the N crater) and Kawah Utama (the S crater, also referred to as the “Main Crater”). The most recent eruption began in early February 2023 and was characterized by lava flows, incandescent avalanches, and ash plumes (BGVN 48:07). This report covers similar activity through the end of the eruption during July through September 2023 using reports from Pusat Vulkanologi dan Mitigasi Bencana Geologi (PVMBG, also known as CVGHM, or the Center of Volcanology and Geological Hazard Mitigation), MAGMA Indonesia, the Darwin VAAC (Volcano Ash Advisory Center), and satellite data.
Webcam images occasionally showed crater incandescence and lava flows on the flanks of Main Crater during July. Near daily white gas-and-steam plumes rose 50-400 m above the crater and drifted in multiple directions. A webcam image taken at 1732 on 1 July suggested that a pyroclastic flow descended the SE flank, as evident from a linear plume of gas-and-ash rising along its path (figure 66). Incandescent material extended about 1 km down the S flank and about 600 m down the SSW and SW flank, based on a Sentinel satellite image taken on 2 July (figure 67). During the evening of 3 July a lava avalanche descended the Kahetang drainage (SE), extending 1-1.8 km, and the Timbelang and Beha drainages, extending 700-1,000 m. There were 53 earthquakes also detected that day. According to a news article from 6 July the lava avalanche from 2 July continued down the SW flank of Main Crater toward the Batang, Timbelang, and Beha Barat drainages for 1.5 km. An avalanche was also visible on the S flank, affecting the Batuawang and Kahetang drainages, and extending 1.8 km. Incandescent avalanches were reported during 8-9 July, traveling 1.8 km toward the Kahetang, Batuawang (S), and Timbelang drainages (figure 68). PVMBG issued two VONAs (Volcano Observatory Notices for Aviation) at 0759 and 0850 on 10 July, which reported two pyroclastic flows that traveled about 2 km toward the Kahetang drainage (figure 69). There were also 55 earthquakes detected on 10 July. As a result, 17 residents from Bolo Hamlet, Tarorane Village, East Siau District, Sitaro Islands Regency, North Sulawesi were evacuated.
An incandescent avalanche of material descended 1-1.8 km down the Kahetang drainage and 1 km down the Batang drainage on 14 July. During 18-29 July lava avalanches continued to move 1-1.8 km toward the Kahetang drainage, 700-1,000 m toward the Batuawang and Batang drainages, 700-1,000 m toward the Timbelang and Beha Barat drainage, and 1.5 km toward the West Beha drainage. Gray-and-white plumes accompanied the lava avalanches. During 20 July crater incandescence was visible in the gas-and-steam column 10-25 m above the crater. The Darwin VAAC reported that ash plumes rose to 2.4 km altitude at 1710 on 21 July, at 1530 on 22 July, and at 0850 on 23 July, which drifted NE and E. According to a news article, there were 1,189 earthquakes associated with lava avalanches recorded during 24-31 July.
Incandescent avalanches originating from Main Crater and extending SW, S, and SE persisted during August. Frequent white gas-and-steam plumes rose 25-350 m above the crater and drifted in different directions during August. Incandescent avalanches of material traveled S as far as 1.5 km down the Batuawang drainage, 1.8-1.9 km down the Kahetang drainage, and 2-2.1 km down the Keting drainage and SW 800-1,500 m down the Batang, Timbelang, and Beha Barat drainages. Occasional gray plumes accompanied this activity. According to a news article, 1,899 earthquakes associated with lava avalanches were recorded during 1-7 August. Incandescent ejecta from Main Crater was visible up to 10-25 m above the crater. Nighttime crater incandescence was visible in the N summit crater. There were 104 people evacuated from Tatahadeng and Tarorane during the first week of August, based on information from a news article that was published on 9 August. According to a news article published on 14 August the frequency of both earthquakes and lava avalanches decreased compared to the previous week; there were 731 earthquakes associated with avalanches detected during 8-15 August, and 215 during 24-31 August . Lava avalanches descending the Batang and Timbelang drainages continued through 24 August and the Batuawang, Kahetang, and Keting through 30 August. A news article published on 17 August reported pyroclastic flows due to collapsing accumulated material from lava flows.
Near-daily white gas-and-steam plumes rose 25-300 m above the crater and drifted in multiple directions during September. According to news articles, lava avalanches from Main Crater continued toward the Batuawang, Kahetang, and Keting drainages, reaching distances of 1-1.8 km. Lava avalanches also descended the Batang, Timbelang, and Beha Barat drainages as far as 1 km from Main Crater. Main Crater and N Crater incandescence were visible as high as 10 m above the crater. During 1-7 September the number of earthquakes associated with avalanches declined, although effusive activity continued. During 8-15 September lava effusion at Main Crater was not visible, although sounds of avalanches were sometimes intense, and rumbling was also occasionally heard. According to a news article published on 26 September, avalanches were no longer observed.
On 29 November PVMG lowered the Volcano Alert Level (VAL) to 2 (the second lowest level on a scale of 1-4) due to declining activity. Seismic data and visual observations indicated that effusion had decreased or stopped, and lava avalanches were no longer observed.
MIROVA (Middle InfraRed Observation of Volcanic Activity) analysis of MODIS satellite data showed strong thermal activity during July through August 2023, which was mainly characterized by incandescent avalanches of material and lava flows (figure 70). During August, the frequency and intensity of the thermal anomalies declined and remained relatively low through December. There was a brief gap in activity in late September. According to data recorded by the MODVOLC thermal algorithm, there were a total of 22 during July and 19 during August. Infrared satellite images showed summit crater incandescence at both the N and S craters and occasional incandescent avalanches of material affecting mainly the S flank (figure 67).
Geologic Background. Karangetang (Api Siau) volcano lies at the northern end of the island of Siau, about 125 km NNE of the NE-most point of Sulawesi. The stratovolcano contains five summit craters along a N-S line. It is one of Indonesia's most active volcanoes, with more than 40 eruptions recorded since 1675 and many additional small eruptions that were not documented (Neumann van Padang, 1951). Twentieth-century eruptions have included frequent explosive activity sometimes accompanied by pyroclastic flows and lahars. Lava dome growth has occurred in the summit craters; collapse of lava flow fronts have produced pyroclastic flows.
Information Contacts: Pusat Vulkanologi dan Mitigasi Bencana Geologi (PVMBG, also known as Indonesian Center for Volcanology and Geological Hazard Mitigation, CVGHM), Jalan Diponegoro 57, Bandung 40122, Indonesia (URL: http://www.vsi.esdm.go.id/); MAGMA Indonesia, Kementerian Energi dan Sumber Daya Mineral (URL: https://magma.esdm.go.id/v1); Badan Nasional Penanggulangan Bencana (BNPB), National Disaster Management Agency, Graha BNPB - Jl. Scout Kav.38, East Jakarta 13120, Indonesia (URL: http://www.bnpb.go.id/); Darwin Volcanic Ash Advisory Centre (VAAC), Bureau of Meteorology, Northern Territory Regional Office, PO Box 40050, Casuarina, NT 0811, Australia (URL: http://www.bom.gov.au/info/vaac/); MIROVA (Middle InfraRed Observation of Volcanic Activity), a collaborative project between the Universities of Turin and Florence (Italy) supported by the Centre for Volcanic Risk of the Italian Civil Protection Department (URL: http://www.mirovaweb.it/); Hawai'i Institute of Geophysics and Planetology (HIGP) - MODVOLC Thermal Alerts System, School of Ocean and Earth Science and Technology (SOEST), Univ. of Hawai'i, 2525 Correa Road, Honolulu, HI 96822, USA (URL: http://modis.higp.hawaii.edu/); Copernicus Browser, Copernicus Data Space Ecosystem, European Space Agency (URL: https://dataspace.copernicus.eu/browser/); Antara News, Jalan Antara Kav. 53-61 Pasar Baru, Jakarta Pusat 10710, Indonesia (URL: antaranews.com).
Langila (Papua New Guinea) — November 2023 Cite this Report
Langila
Papua New Guinea
5.525°S, 148.42°E; summit elev. 1330 m
All times are local (unless otherwise noted)
Intermittent thermal activity and few ash plumes during April-October 2023
Langila consists of a group of four small overlapping composite cones on the lower E flank of the extinct Talawe volcano in the Cape Gloucester area of NW New Britain, Papua New Guinea. It was constructed NE of the breached crater of Talawe. Frequent mild-to-moderate explosive eruptions, sometimes accompanied by lava flows, have been recorded since the 19th century from three active craters at the summit. The youngest and smallest crater (no. 3 crater) was formed in 1960 and has a diameter of 150 m. The current eruption period began in October 2015 and recent activity has consisted of small thermal anomalies and an ash plume (BGVN 48:04). This report covers similar low-level activity during April through October 2023, based on information from the Darwin Volcanic Ash Advisory Center (VAAC) and satellite images.
Activity was relatively low during the reporting period and primarily consisted of thermal activity. The MIROVA (Middle InfraRed Observation of Volcanic Activity) graph showed intermittent low-power thermal anomalies: three anomalies were detected during late April, one during May, one during late June, four during mid-July, two during mid-August, one during mid-September, and seven during October (figure 33). A total of two thermal hotspots were detected by the MODVOLC thermal alerts algorithm on 20 July and 18 August. Some of this activity was also visible as a small thermal anomaly on clear weather days in infrared satellite images in the SE crater (figure 34). Small sulfur dioxide plumes, some of which had column densities exceeding 2 Dobson Units (DU), drifted in different directions, based on data from the TROPOMI instrument on the Sentinel-5P satellite (figure 35).
The Darwin VAAC reported that diffuse ash plumes were visible in satellite images at 1440 on 14 July that rose to 1.8 km altitude and drifted N. Diffuse ash emissions continued into most of the next day. By 1500 on 15 July the ash emissions dissipated, but gas-and-steam emissions continued. On 19 July the Darwin VAAC reported ash plumes that were visible in satellite images that rose to 1.8-2.4 km altitude and drifted SE.
Geologic Background. Langila, one of the most active volcanoes of New Britain, consists of a group of four small overlapping composite basaltic-andesitic cones on the lower E flank of the extinct Talawe volcano in the Cape Gloucester area of NW New Britain. A rectangular, 2.5-km-long crater is breached widely to the SE; Langila was constructed NE of the breached crater of Talawe. An extensive lava field reaches the coast on the N and NE sides of Langila. Frequent mild-to-moderate explosive eruptions, sometimes accompanied by lava flows, have been recorded since the 19th century from three active craters at the summit. The youngest and smallest crater (no. 3 crater) was formed in 1960 and has a diameter of 150 m.
Information Contacts: Darwin Volcanic Ash Advisory Centre (VAAC), Bureau of Meteorology, Northern Territory Regional Office, PO Box 40050, Casuarina, NT 0811, Australia (URL: http://www.bom.gov.au/info/vaac/);
Hawai'i Institute of Geophysics and Planetology (HIGP) - MODVOLC Thermal Alerts System, School of Ocean and Earth Science and Technology (SOEST), Univ. of Hawai'i, 2525 Correa Road, Honolulu, HI 96822, USA (URL: http://modis.higp.hawaii.edu/);
MIROVA (Middle InfraRed Observation of Volcanic Activity), a collaborative project between the Universities of Turin and Florence (Italy) supported by the Centre for Volcanic Risk of the Italian Civil Protection Department (URL: http://www.mirovaweb.it/);
NASA Global Sulfur Dioxide Monitoring Page, Atmospheric Chemistry and Dynamics Laboratory, NASA Goddard Space Flight Center (NASA/GSFC), 8800 Greenbelt Road, Goddard, Maryland, USA (URL: https://so2.gsfc.nasa.gov/);
Copernicus Browser, Copernicus Data Space Ecosystem, European Space Agency (URL: https://dataspace.copernicus.eu/br
Search Bulletin Archive by Publication Date
Select a month and year from the drop-downs and click "Show Issue" to have that issue displayed in this tab.
The default month and year is the latest issue available.
Bulletin of the Global Volcanism Network - Volume 32, Number 11 (November 2007)
Bezymianny (Russia)
Continued activity May-December 2007 with ash plumes and lava emission
Fuego (Guatemala)
Variable explosive activity continues sporadically, July 2005-December 2006
Irazu (Costa Rica)
Seismicity and degassing remain low, January 2004-September 2007
Lengai, Ol Doinyo (Tanzania)
New lava linked to Plinian eruptions of August-September 2007
Ruapehu (New Zealand)
Additional data on hydrothermal eruption's distribution and damage
Soputan (Indonesia)
Ash plumes and seismic activity continue through November 2007
Suwanosejima (Japan)
Eruptions of July 2005-December 2007 send plumes to varying heights
Bezymianny (Russia) — November 2007 Cite this Report
Bezymianny
Russia
55.972°N, 160.595°E; summit elev. 2882 m
All times are local (unless otherwise noted)
Continued activity May-December 2007 with ash plumes and lava emission
As reported in BGVN 31:11, after a period of moderate volcanic activity following the extensive eruption of 9 May 2006, heightened activity occurred at Bezymianny during December 2006 before returning to moderate activity through early 2007. This report covers the period from May through December 2007. It was drawn mainly from reports of the Kamchatkan Volcanic Eruption Response Team (KVERT).
Based on satellite data from 10 May 2007, KVERT reported that a large thermal anomaly with a temperature of ~ 51°C appeared over Bezymianny's summit lava dome.
At about 0330-0400 on 12 May, an explosive eruption may have occurred, according to seismic data from Kozyrevsk. Ash plumes rose to an altitude of 4 km and were visible on satellite imagery drifting in multiple directions. Ashfall was reported in the town of Klyuchi, a spot ~ 47 km NE of the volcano. On 13 May, an elongated thermal anomaly was seen on satellite imagery to the SE of the dome, which decreased in size through 17 May. That day, hunters saw a large (200 m wide) mudflow along the Sukhaya Khapitsa river.
KVERT reported that Bezymianny seismicity was at background during May-September 2007, but increased in early October. Satellite imagery observations showed a thermal anomaly in the crater on 4, 6, 8, and 11 October; fumarolic activity was observed during 6-7 and 10-11 October. Based on seismic interpretation, a hot avalanche probably occurred on 10 October and small eruptions also occurred on 14 October.
The Tokyo Volcanic Ash Advisory Center (VAAC) reported ash plumes to altitudes of ~ 10 km on 14 October. Those of 15 October reached 7.3-9.1 km altitude and drifted E and SE. A strong thermal anomaly was present in the crater around this time. Slightly elevated seismicity occurred during 16-19 October before returning to background during19-20 October. Based on observations of NOAA satellite images by the Tokyo VAAC, a stripe of ash deposits appeared on the ESE flank by 18 October.
Based on seismicity, KVERT interpreted that a series of explosions or collapses from lava flow fronts occurred on 5 November 2007. Two avalanches and an ash plume were also detected. Satellite imagery revealed a thermal anomaly over the lava dome. According to Aleksei Ozerov, the 5 November activity was caused by dome collapse. This demolished a significant section of the SE dome, involving a total volume of almost 200,000 m3. The collapse produced a debris avalanche that traveled almost 3 km downslope.
According to a TERRA MODIS image on 9 November, a very bright (probably high temperature) gas-steam plume rose to about 35 km altitude. [This unusually tall plume height has not been confirmed.] On 10 November, KVERT reported continued growth of a viscous lava flow from the summit dome.
During an overflight around this time observers saw a 4-km-long deposit on the SE flank laid down by pyroclastic flows on 5 November. Lava flow-front collapses from older lava flows on the SE flank were also evident. Visual observations and video footage analysis indicated that gas-and-steam plumes drifted NE on 9 November and S on 13 November. Based on observations of satellite imagery, the Washington VAAC reported that an ash plume at an altitude of ~6.4 km drifted E on 15 November. Visual observations and video footage showed gas-and-steam plumes on 17 and 18 November.
Seismicity was above background during 19-20 November. A thermal anomaly occurred at the crater during 16-17 and 21 November. An ash plume reached 4.3 km altitude on 2 December. Seismicity was at background through the rest of December, except during 21-25 December, when it again rose. Ash plumes up to 4.5 km altitude and avalanches were registered on 23 December.
A paroxysmal explosive eruption occurred between 0917 and 1020 UTC on 24 December 2007 and a large column rose to ~ 13.0 km altitude. According to satellite data, ash clouds extended from the volcano over 850 km to the NE on 24-25 December. According to KVERT volcanologists, who circled the volcano by helicopter with cameras, this eruption destroyed a part of lava dome.
Geologic Background. The modern Bezymianny, much smaller than its massive neighbors Kamen and Kliuchevskoi on the Kamchatka Peninsula, was formed about 4,700 years ago over a late-Pleistocene lava-dome complex and an edifice built about 11,000-7,000 years ago. Three periods of intensified activity have occurred during the past 3,000 years. The latest period, which was preceded by a 1,000-year quiescence, began with the dramatic 1955-56 eruption. This eruption, similar to that of St. Helens in 1980, produced a large open crater that was formed by collapse of the summit and an associated lateral blast. Subsequent episodic but ongoing lava-dome growth, accompanied by intermittent explosive activity and pyroclastic flows, has largely filled the 1956 crater.
Information Contacts: Olga Girina, Kamchatka Volcanic Eruptions Response Team (KVERT), a cooperative program of the Institute of Volcanic Geology and Geochemistry, Far East Division, Russian Academy of Sciences, Piip Ave. 9, Petropavlovsk-Kamchatsky, 683006, Russia (URL: http://www.kscnet.ru/ivs/eng/), the Kamchatka Experimental and Methodical Seismological Department (KEMSD), GS RAS (Russia), and the Alaska Volcano Observatory (USA); Alaska Volcano Observatory (AVO), cooperative program of the U.S. Geological Survey, 4200 University Drive, Anchorage, AK 99508-4667, USA (URL: http://www.avo.alaska.edu/), the Geophysical Institute, University of Alaska, PO Box 757320, Fairbanks, AK 99775-7320, USA, and the Alaska Division of Geological and Geophysical Surveys, 794 University Ave., Suite 200, Fairbanks, AK 99709, USA; Washington Volcanic Ash Advisory Center (VAAC), Satellite Analysis Branch (SAB), NOAA/NESDIS E/SP23, NOAA Science Center Room 401, 5200 Auth Rd, Camp Springs, MD 20746, USA (URL: http://www.ospo.noaa.gov/Products/atmosphere/vaac/); Hawai'i Institute of Geophysics and Planetology (HIGP) Hot Spots System, University of Hawai'i, 2525 Correa Road, Honolulu, HI 96822, USA (URL: http://modis.higp.hawaii.edu/); Vladivostok Times (URL: http://www.vladivostoktimes.ru/).
Fuego (Guatemala) — November 2007 Cite this Report
Fuego
Guatemala
14.4748°N, 90.8806°W; summit elev. 3799 m
All times are local (unless otherwise noted)
Variable explosive activity continues sporadically, July 2005-December 2006
Fuego was previously discussed in BGVN 30:08. This report discusses ongoing developments at Fuego since July 2005 and through December 2006. In general, the volcano erupts vesicular, olivine-bearing basaltic lava flows. They traveled from the central crater hundreds of meters down the S, SW and W flanks, and the lava flow fronts released occasional blocky avalanches of incandescent material. The latter process is generally omitted from the rest of this report unless the avalanche(s) were particularly noteworthy, as in cases where pyroclastic flows were also noted.
On 17 July 2005, an ash plume ~ 3.5-4 km high accompanied small pyroclastic flows down Santa Teresa and Taniluyá ravines. This activity continued sporadically through October 2005.
From 2-7 November 2005, weak explosions and low ash plumes occurred along with lava flows that traveled down the volcano's S and SW flanks, extending 600 m towards the Taniluyá ravine, and 300 m towards the Cenizas ravine. On 14 November, two lava flows traveled from the S edge of the central crater 150 m toward the Cenizas ravine, and 400 m toward the Taniluyá ravine. A third lava flow traveled 600 m W towards the Santa Teresa ravine. Between 17 and 21 November, lava flows traveled S towards the Cenizas and Taniluyá ravines and W towards Santa Teresa ravine.
On 13 December 2005, two lava flows from Fuego extended 200-300 m W and SW of the central crater. On 27 December 2005 an ash plume rising ~ 7.6 km altitude extended SSW and SSE of the volcano; lava flows traveled ~ 2 km S down Taniluyá ravine, and W down Seca ravine, initially extending ~ 800 m and 1,200 m, respectively.
At 0602 on 27 December, a pyroclastic flow descended S. Ash fell S of the volcano in the port of San Jose. Later that day, lava flows extended 1.2 and 1.3 km, and pyroclastic flows descended 1.8 and 2 km down the Taniluyá and Seca ravines, respectively. Lava flows also traveled W toward Santa Teresa ravine, and SE towards the Jute and Lajas ravines. An ash plume rose ~ 7.6 km, and a small amount of ash fell W and SW of the volcano in the villages of Morelia, Santa Sofía, Los Tarros, and Panimaché (~ 7 km SSW). This activity continued through 29 December with more lava flows and bombs. The emissions hurled incandescent lava clots ~ 75 m high, spawned lava flows, and generated a dark plume rising to ~ 1 km above the crater rim.
January 2006 activity was essentially a continuation of December's with moderate-to-strong explosions and incandescent lava ejecta hurled ~ 40 m high. Explosions could be heard 25-30 km away. The explosions were accompanied by rumbling sounds and acoustic waves that shook windows and doors in villages near the volcano. Ash plumes rose ~ 1 km to ~ 1.5 km. On 22-23 January, there were Strombolian lava ejections rising ~ 100 m above the crater rim accompanied by block avalanches down the SW flank.
During February and March 2006, explosions moderated but activity continued. Weak-to-moderate explosions occurred; shock waves were sometimes felt in villages near the volcano. On 6-7 March, ash emissions up to ~ 4.6 km altitude were visible on satellite imagery.
From 22 through 28 March, Fuego ejected incandescent material up to ~ 50-75 m and gas plumes to ~ 300 m above the crater rim. Short pyroclastic flows from avalanches occurred on the upper flanks. On 28 March, pyroclastic flows traveled ~ 450 m S, and avalanches occurred from the lava-flow fronts.
On 17 April 2006, explosive ejections threw lava ~ 50-75 m above crater rim, and gas plumes rose to ~ 150-200 m. Lava flowed ~ 400 m S towards Taniluyá ravine.
During 17-18 May 2006 lava flows reached ~ 100 m SW towards the Taniluyá river and ~ 500 m SW towards the Cenizas river. Fumarolic gases rose to ~ 600 m above the crater rim and drifted E and W.
On 29 June 2006 fumarolic gases rose to ~ 125 m , spatter to tens of meters, and ash plumes ~ 2.2 km respectively above the crater rim. Lava flows extended ~ 400 m SW toward the Cenizas river. Pyroclastic flows traveled mainly SW along the Cenizas river, with a lesser number moving SW along the Taniluyá river.
On 3 July 2006, explosions discharged incandescent material hundreds of meters above the central crater and avalanches traveled ~ 300-500 m SW along the Cenizas river.
The only activity reported in August occurred on the 16-17th, when ash explosions reached 300-800 m above the crater rim, and explosions of incandescent material produced avalanches that descended 300-500 m SW towards the Cenizas, Taniluyá, and Santa Teresa river valleys.
The latter half of September 2006 continued the characteristic previous activity with explosions that sent incandescent lava 75-100 m above the crater rim and that generated hot avalanches SW towards the Taniluyá River.
On 15 November, lava flows traveled about 150 m SW, and avalanches occurred from the lava-flow fronts. On 17 November, three out of seven explosions propelled incandescent material 100 m above the central crater rim. Relative quiescence followed through December 2006.
Geologic Background. Volcán Fuego, one of Central America's most active volcanoes, is also one of three large stratovolcanoes overlooking Guatemala's former capital, Antigua. The scarp of an older edifice, Meseta, lies between Fuego and Acatenango to the north. Construction of Meseta dates back to about 230,000 years and continued until the late Pleistocene or early Holocene. Collapse of Meseta may have produced the massive Escuintla debris-avalanche deposit, which extends about 50 km onto the Pacific coastal plain. Growth of the modern Fuego volcano followed, continuing the southward migration of volcanism that began at the mostly andesitic Acatenango. Eruptions at Fuego have become more mafic with time, and most historical activity has produced basaltic rocks. Frequent vigorous eruptions have been recorded since the onset of the Spanish era in 1524, and have produced major ashfalls, along with occasional pyroclastic flows and lava flows.
Information Contacts: Instituto Nacional de Sismologia, Vulcanología, Meteorología e Hidrologia (INSIVUMEH), Ministero de Communicaciones, Transporto, Obras Públicas y Vivienda, 7a. Av. 14-57, zona 13, Guatemala City 01013, Guatemala (URL: http://www.insivumeh.gob.gt/); Coordinadora Nacional para la Reducción de Desastres (CONRED), Av. Hincapié 21-72, Zona 13, Guatemala City, Guatemala; Washington Volcanic Ash Advisory Center (VAAC), Satellite Analysis Branch (SAB), NOAA/NESDIS E/SP23, NOAA Science Center Room 401, 5200 Auth Rd, Camp Springs, MD 20746, USA (URL: http://www.ospo.noaa.gov/Products/atmosphere/vaac/).
Irazu (Costa Rica) — November 2007 Cite this Report
Irazu
Costa Rica
9.979°N, 83.852°W; summit elev. 3436 m
All times are local (unless otherwise noted)
Seismicity and degassing remain low, January 2004-September 2007
The Observatorio Vulcanológico y Sismológico de Costa Rica (OVSICORI-UNA) reported small-magnitude seismicity and stable fumarolic and crater lake conditions at Irazú over the period September 2001 to December 2003 (BGVN 28:12). This report summarizes monthly contributions from OVSICORI-UNA from January 2004 through September 2007.
Activity during January-December 2004. The lake level at Irazú remained high through 2004 with a green color from January to September and a light green and greenish yellow color in October and November. Convection cells occurred in the NW, SW, SE, NE, N edges of the lake throughout the year. Small areas of minor mass wasting occurred in the NE and SW walls, and fumarolic activity on the NW side remained constant with a low level of gas emission. A seismograph located 5 km SW of the active crater registered mild tectonic and low-frequency earthquakes throughout 2004. Peak activity occurred on 19 July 2004, with nine earthquakes occurring over four hours and an intensity of M 1.2-1.8 at focal depths of 5-15 km.
Activity during January-November 2005. The lake level remained high through 2005 with a greenish yellow color through April and darker green from May through November. A ring of lighter yellow color indicating iron-oxide deposits was visible from March through November 2005. Convection cells occurred in similar manner to the 2004 interval, and toward the lake's center of the lake. Small areas of minor mass wasting occurred in the NE and SW walls and fumarolic activity on the NW side remained constantly low. From January through March and again in October 2005, earthquakes (M 1-2) 3-16 km deep occurred from the active crater to a distance of 20 km NW and 15 km SE .
Activity during March-December 2006. During March through December 2006, the lake level at Irazú was high with a yellowish green color. The SW crater wall showed areas of minor mass wasting moving toward the lake. Similar to January-November 2005, convection cells were observed in various areas. In August, the gas emission temperature of the NW-flank fumarole was measured at 86°C (N-flank fumarole temperatures over 80°C have been reported for almost 40 years). In November 2006, the lake level, convection cells, and fumarolic activity remained constant but the lake color changed to light green. A seismograph located 5 km SW of the active crater registered continuing low level tectonic and low-frequency earthquakes. In mid-December, earthquake activity was reported by local residents, but no other changes were recorded.
Activity during 2007. In February 2007, the lake level receded, and the color changed to yellowish green. In March, measurements of the lake level indicated a descent of 4.48 m, with regard to September of the 2005 and lake color remained a greenish yellow with a temperature of 15 °C. Temperature at a convection cell at the NE edge was 34 °C. During the period March-September, the lake level continued to descend and fell an additional 3.87 m. The lake retained a light green color, with convection calls in the NE, at the N edge, and toward the center. Small areas of minor mass wasting continued in the SW crater wall, and fumaroles on the NW side continued minor degassing.
Geologic Background. The massive Irazú volcano in Costa Rica, immediately E of the capital city of San José, covers an area of 500 km2 and is vegetated to within a few hundred meters of its broad summit crater complex. At least 10 satellitic cones are located on its S flank. No lava effusion is known since the eruption of the Cervantes lava flows from S-flank vents about 14,000 years ago, and all known Holocene eruptions have been explosive. The focus of eruptions at the summit crater complex has migrated to the W towards the main crater, which contains a small lake. The first well-documented eruption occurred in 1723, and frequent explosive eruptions have occurred since. Ashfall from the last major eruption during 1963-65 caused significant disruption to San José and surrounding areas. Phreatic activity reported in 1994 may have been a landslide event from the fumarolic area on the NW summit (Fallas et al., 2018).
Information Contacts: E. Fernández, E. Duarte, R. Van der Laat, W. Sáenz, M. Martínez, V. Barboza, E. Malavassi, R. Sáenz, and J. Brenes, Observatorio Vulcanologico Sismologica de Costa Rica-Universidad Nacional (OVSICORI-UNA), Apartado 86-3000, Heredia, Costa Rica (URL: http://www.ovsicori.una.ac.cr/).
Ol Doinyo Lengai (Tanzania) — November 2007 Cite this Report
Ol Doinyo Lengai
Tanzania
2.764°S, 35.914°E; summit elev. 2962 m
All times are local (unless otherwise noted)
New lava linked to Plinian eruptions of August-September 2007
Following explosive eruptions beginning on 1 January 1983, Ol Doinyo Lengai (hereafter called 'Lengai') entered a stage consisting chiefly of the effusion of numerous small fluid, carbonatitic lava flows in its active N summit crater. During March 1983 to early 2007, reports focused almost exclusively on the summit crater, the scene of numerous, often-changing hornitos (or spatter cones) and carbonatitic lava flows that slowly filled the crater. Lava began overflowing the crater, first to the W around 14 June 1993 (BGVN 18:07), then onto the NW flank (beginning in late October 1998, BGVN 24:02), E flank (beginning in early November 1998, BGVN 24:02), W flank (beginning in February 2002, BGVN 27:10), and N flank (beginning in January 2005, BGVN 30:04), making it important to chronicle changes on the flanks. Observations of activity throughout 2007 are summarized in table 14.
Table 14. Summary of visitors to Ol Doinyo Lengai and their brief observations (from a climb, aerial overflight, flank, or satellite) during 2007. Observations for 2006 were reported in BGVN 32:02. Much of this list is courtesy of Frederick Belton; see Belton's website for most of the contributor's contact information.
| Date |
Observer |
Observation Location |
Brief Observations |
| 31 Jan-02 Feb 2007 |
Tom Pfeiffer |
Climb |
See BGVN 32:02. |
| 03 Mar 2007 |
Annette Loettrup |
Climb |
No activity; no significant changes to crater. |
| 04 Mar 2007 |
Janet Davis |
Aerial |
No activity; no significant changes to crater. |
| 24 Mar 2007 |
Unnamed |
Climb |
No activity; no significant changes to crater. |
| 17 Jun-20 Jun 2007 |
Rohit Nandedkar, Hannes Mattsson, Barbara Tripoli |
Climb |
High but variable activity of the inner crater (see text). |
| 22-23 Jul 2007 |
Lindsay McHenry |
Climb |
Activity in inner crater (see text). |
| 03 Aug-05 Aug 2007 |
Julie Machault and the group "Aventure et Volcans" |
Climb, Aerial |
Small lava flows and an open vent cradling lava (see text). |
| 15 Aug-16 Aug 2007 |
Gaston Gonnet |
Climb |
Mild strombolian activity from 3 cones. |
| 23 Aug 2007 |
Gwynne Morson |
Aerial |
| 21, 23 Aug 2007 |
Christoph Weber |
Climb |
Active eruption with lava flows (see text). |
| 01 Sep-02 Sep 2007 |
Chiara Montaldo |
Climb |
Eruption (see text). |
| 03 Sep 2007 |
Gwynne Morson |
Aerial |
Newly formed and erupting cinder cone (see text). |
| 04 Sep 2007 |
Sian Brown (pilot) |
Aerial |
Large ash plume above Lengai. |
| 04 Sep 2007 |
NASA satellite |
Satellite |
ASTER image on NASA's Terra Satellite (see text). |
| 06 Sep 2007 |
Gwynne Morson |
Aerial |
-- |
| 10 Sep 2007 |
Jens Fissenebert, Sandra Kliegalhoefer |
Flank |
High ash plume photographed from Lake Natron Camp. |
| 11 Sep-13 Sep 2007 |
Leander Ward |
Flank |
Eruption (see text). |
| 13 Sep 2007 |
Gwynne Morson |
Aerial |
Heavy ash plumes. |
| 19 Sep-21 Sep 2007 |
Jelle Schouten, Stan Brouwer |
Aerial |
Plumes flowing from Lengai. |
| 22-23 Sep 2007 |
Roger Mitchell, Barry Dawson |
Aerial |
Continuous activity (see text). |
| 24 Sep 2007 |
Jen Schoemburg |
Flank |
Continuous activity (see text). |
| 23 Sep-30 Sep 2007 |
Roger Mitchell, Barry Dawson |
Flank |
Continuous activity (see text). |
| 27 Sep 2007 |
Jen Schoemburg |
Aerial |
Continuous activity (see text). |
| 1st week Oct 2007 |
Unnamed pilot |
Aerial |
Ash plumes rising to 3 km above summit. |
| 05 Oct 2007 |
Message forwarded from Louise Leakey |
Flank |
Ash plume to 3 km. |
| 12 Oct 2007 |
Colin Church |
Flank |
Ash falls on W side of Lengai. |
| mid-Oct 2007 |
L. Dudley |
Aerial |
Heavy ash plume blowing to NW. |
| 09 Oct-16 Oct 2007 |
Graham Wickenden |
Flank |
Ash plumes viewed from Lake Natron Camp. |
| 16 Oct 2007 |
Leander Ward |
Flank camp N of Lengai on lower slopes of Gelai |
Lightning in ash clouds. |
| 16 Oct 2007 |
Unnamed |
Aerial |
Ash cone now dominates entire active crater. |
| 19 Oct 2007 |
Kathy Moore (pilot) |
Aerial |
Eruption at 0830, plumes of smoke and ash to altitude above 7.6 km. |
| 21 Oct 2007 |
Leander Ward |
Flank |
Dark and light ash clouds being erupted from the ash cone. |
| 23 Oct 2007 |
Gwynne Morson |
Aerial |
Dark ash clouds; cone (possibly T49B) still exists. |
| 25 Oct 2007 |
Benoit Wilhelmi |
Aerial |
"extremely aggressive" activity. |
| 29 Oct 2007 |
Gwynne Morson |
Aerial |
Pause in eruption. |
| 31 Oct 2007 |
Gwynne Morson |
Aerial |
Dark ash clouds. |
| 04 Nov 2007 |
Tim Leach |
Flank Lake Natron Camp |
Daily ash eruptions, some lava eruptions at night. |
| 07 Nov 2007 |
Toulouse VAAC |
Satellite |
Lengai remained active, but ash not identified on satellite imagery. |
| 10 Nov 2007 |
Michael Dalton-Smith |
Flank |
Activity continues, constant 'smoke' rising 300-600 m above summit, drifting WSW toward Gol Mountains. |
| 11 Nov 2007 |
Tim Leach |
Flank Lake Natron Camp |
Activity seems to have decreased. |
| 21 Nov 2007 |
Toulouse VAAC |
Satellite |
Lengai remained active, but ash not identified on satellite imagery. |
| 27 Nov 2007 |
Tim Leach |
Flank Lake Natron Camp |
Activity "off and on"; heard report of large "lava eruption" about a week ago. |
As this report goes to press, contradictory reports exist concerning impacts of eruptions on the volcano's flanks, with the key question concerning the amount of impact on those flanks by fires, lava flows, ashfall, or conceivably, volcanic bombs large enough to start fires on impact with the ground surface-or perhaps some combination of these and other processes.
Observations during 17-20 June 2007. A report posted on Frederick Belton's Ol Doinyo Lengai website described a visit by Rohit Nandedkar, Hannes B. Mattsson, and Barbara Tripoli during 17-20 June. They observed generally high, but variable, activity of the inner crater. A lot of sulfuric gasses escaped, mainly at fractures in the outer crater, but also from the big hornito on the SW side. Three spatter cones situated on the S and W side of the inner crater discharged spatter that splashed up to 15-20 m high at intervals of 20 minutes, with 30 minute breaks. All three cones were never active at the same time. The group saw three active interconnected lava ponds (mainly on the E side of the inner crater). The molten material was eroding the E side and destabilizing the adjacent cliff. The ponds were always active, but more vigorous activity lasted for intervals of several hours. On 19 June the crust of the inner crater burst near a big, half-collapsed hornito, sending a lava flow E.
Activity on 19 July 2007. On 20 July 2007 the Associated Press (AP) reported that "Lengai was believed to be the source of a series of shallow earthquakes experienced in the region over the past week" according to Alfred Mutua, the Kenyan government spokesman. On 19 July BBC News reported that hundreds of villagers fled their homes on the slopes in response to the above-mentioned seismic swarm, fearing an imminent eruption. A BBC correspondent reported that lava flowing down a flank was causing panic among villagers. The East African Standard indicated that products of the 19 July eruption had entered inhabited areas, stating that " . . . . more than 1,500 people, most of them Maasai families, vacated their homes in Ngaresero, Orbalal and Nayobi villages following the tremors that triggered the volcanic eruption . . . . Villagers are reported to have heard roaring . . . . before the volcano started discharging ash and lava." There were also reports of a damaged school and two injuries, but no deaths. Subsequent inquiries about the incident have cast doubt on these earlier claims.
Volcanologist Gerald Ernst contacted aviators, guides, scientists, and local inhabitants in the region; they had seen no dramatic eruptive events at the mountain during late July 2007. Overall, the compiled comments indicated that the summit crater was intact and eruptions were confined to the summit area. Keith Roberts was reported to have observed that a landslide kicked up a lot of dust, which could have been confused from a distance with ash from a large flank eruption.
Greg Vaughan of the Jet Propulsion Labs subsequently took a preliminary look at some ASTER satellite imagery and concluded that in mid-June through late July the summit crater was likely to have continued to emit lava. The 20 July thermal emissions supported summit lava eruptions but failed to document any lava that had spilled over the crater rim. In addition, no thermal anomalies were measured by MODIS instruments as reported by the Hawai'i Institute of Geophysics and Planetology (HIGP) Thermal Alerts System from 7 July through 22 August (UTC).
Belton's website contained a report by Lindsay McHenry, who had climbed Lengai on 22-23 July 2007. She reported: "There were frequent minor earthquakes in the days preceding the climb. There were two active spatter cones, one on the far eastern side of the crater and a small one just to the east of the central spire. Both were throwing small blocks ? locally, and occasionally raining ash over the entire crater. Our guides directed us to an aa flow on the northern side of the crater that they claimed was only 4 days old. The interior was still warm and showed no signs of alteration. The flow was confined to the crater."
MODIS (MODVOLC) measurements. Data from MODIS satellites and analyzed with the MODVOLC algorithm revealed no thermal anomalies for the period 7 July-22 August 2007. Instead, multiple thermal anomalies were measured at and around the crater particularly during 23 August-3 September and 10-20 September 2007 (table 15). It is plausible that a brief ash-bearing eruption like the alleged 19 July event could have been missed by the MODIS satellites or not detected by the MODVOLC algorithm.
Table 15. MODIS/MODVOLC thermal anomalies measured at Ol Doinyo Lengai during 2007. No anomalies were detected during 1 January-1 June, 7 July-22 August, 21 September-16 October, 18-30 October, and 1 November-29 December 2007. Anomalies measured by MODIS during 2006 were reported in BGVN 32:02. Courtesy of the Hawai'i Institute of Geophysics and Planetology (HIGP) Thermal Alerts System.
| Date |
Time (UTC) |
Number of pixels |
Satellite |
| 02 Jun 2007 |
0745 |
1 |
Terra |
| 23 Jun 2007 |
2025 |
3 |
Terra |
| 23 Jun 2007 |
2320 |
1 |
Aqua |
| 25 Jun 2007 |
2015 |
1 |
Terra |
| 29 Jun 2007 |
1950 |
1 |
Terra |
| 29 Jun 2007 |
2245 |
1 |
Aqua |
| 30 Jun 2007 |
2030 |
1 |
Terra |
| 30 Jun 2007 |
2330 |
1 |
Aqua |
| 02 Jul 2007 |
2315 |
1 |
Aqua |
| 06 Jul 2007 |
1955 |
1 |
Terra |
| 06 Jul 2007 |
2250 |
1 |
Aqua |
| 23 Aug 2007 |
1955 |
1 |
Terra |
| 23 Aug 2007 |
2250 |
1 |
Aqua |
| 25 Aug 2007 |
1940 |
2 |
Terra |
| 26 Aug 2007 |
2320 |
1 |
Aqua |
| 28 Aug 2007 |
2310 |
1 |
Aqua |
| 30 Aug 2007 |
2000 |
2 |
Terra |
| 30 Aug 2007 |
2300 |
1 |
Aqua |
| 31 Aug 2007 |
0825 |
2 |
Terra |
| 31 Aug 2007 |
1120 |
2 |
Aqua |
| 31 Aug 2007 |
2045 |
2 |
Terra |
| 31 Aug 2007 |
2340 |
2 |
Aqua |
| 01 Sep 2007 |
1950 |
10 |
Terra |
| 01 Sep 2007 |
2245 |
2 |
Aqua |
| 02 Sep 2007 |
0810 |
2 |
Terra |
| 02 Sep 2007 |
1105 |
2 |
Aqua |
| 03 Sep 2007 |
1935 |
2 |
Terra |
| 10 Sep 2007 |
1940 |
1 |
Terra |
| 10 Sep 2007 |
2240 |
2 |
Aqua |
| 19 Sep 2007 |
2235 |
1 |
Aqua |
| 20 Sep 2007 |
0800 |
4 |
Terra |
| 17 Oct 2007 |
2000 |
2 |
Terra |
| 31 Oct 2007 |
2310 |
1 |
Aqua |
| 30 Dec 2007 |
0815 |
1 |
Terra |
Observations during early August 2007. The European Association of Volcanologists (LAVE), a group that visits many volcanoes and publishes an informative and colorful newsletter, ascended and camped in the active crater on 3-5 August 2007 (Machault, 2008). Machault (2008) discussed a crater still strewn with multiple hornitos. Many of their observations concerned the emissions at these hornitos and abundant still fresh lava flows of small volume seen spreading over the crater floor. They departed the crater at 0700 on 5 August at which point they saw no activity.
In more detail, one vent at a hornito was particularly active on 3-4 August. The active vent was open and cradling molten lava. It was located well up on the cone of a hornito to the near E of T49B. This vent emitted lapilli on 4 August and the next day it emitted lava. On 4 August the same vent E of T49B discharged a lava flow on the crater floor, 100 m long with several arms. The afternoon of 4 August the same vent issued black "smoke" and clouds. A 'black geyser' rose above the hornitos in the center of the crater but the exact source vent was uncertain.
Eruptions of late August and September 2007. Matthieu Kervyn analyzed MODIS data with the MODLEN algorithm (tailored to the lower temperature lavas at Lengai) and recorded multiple and repeated thermal anomalies at and around the crater after 21 August 2007. This indicated a new eruptive event during 21-23 August, with a peak on 23 August (MODVOLC data in table 15 show anomalies starting 23 August). Anomalies at that time seemed to be restricted to the crater, but moved out to the flanks on 31 August and 1 September. On 23 August, pilot Gwynne Morson photographed the recent lava flows (figure 95), which, when freshly cooled are black in color (later altering to white due to weathering).
Ashley Davies reported that thermal emissions were detected on 27 August 2007 from the NASA Earth Observing-1 (EO-1) spacecraft, which combined both the Hyperion hyperspectral imager and the ALI multispectral imager, yielding coverage of both visible and short-wavelength infrared (SWIR). Hyperion data (30 m/pixel resolution) showed two very bright sources in the summit crater with spectra consistent with erupting lava. There was also an indication of a short lava flow to the NW. Based on a preliminary analysis of the Hyperion data, effusion rate was estimated at ~ 0.5 m3/s. [Note: As part of the JPL Volcano Sensor Web, the EO-1 observation was triggered autonomously by an alert from the MODVOLC system. This in turn triggered a series of data transmissions and rapid processing at JPL. Notification was received at JPL within 2 hours of data acquisition. JPL processed the Hyperion data within 36 hours of acquisition.]
Chiara Montaldo and her husband climbed Lengai on the night of 1-2 September. Lava started to come out of the crater on the afternoon of 1 September and flowed down the flank all night (figure 96). At 0500 on 2 September, the crater was erupting; the noise and smell was very strong. From time to time there was an explosion sound (like fireworks) and a column of ash and lapilli could be seen. The column was not continuous, and it was incandescent with black smoke and ash. They felt very strong earthquakes on the top. A few hours after they climbed down on 2 September, the column and the noise were higher and the wind changed direction, blowing the ash toward them. On the following night (2-3 September) another group tried to climb the volcano, but retreated about halfway up because the eruption was getting more intense.
According to Burra Gadiye, a mountain guide, an ash eruption began during the night of 3-4 September 2007. On 3 September pilot Gywnne Morson observed a new erupting cone in the central to E side of the crater. Thomas Holden relayed a pilot's account of a large ash plume on 4 September. The ash plume and strong thermal activity in the crater and probably lava flows to the W and NW may have spawned fires that burned large areas of the W and NW flank, as can be seen in a 4 September 2007 ASTER image (figure 97). Kervyn observed that the volcano erupted on 4 September, first at midnight and then at 0500, causing significant ash clouds. Ash fallout was observed at Engare Sero village, 18 km N of the summit. Ashfall lasted for over 12 hours. The ash cloud was imaged by ASTER on the morning of 4 September drifting SSW. Roger Mitchell attributed the large burned areas on figure 97 as due to fires ignited after the ash eruption of 3-4 September.
Chris Weber reported that during the night of 3-4 September, lapilli- and ash-bearing eruptions rose about 3 km above the vent. Pictures taken from a plane on 5 September indicated that the hornitos and other crater morphology remained without dramatic change. Satellite images around this time showed vast areas of burned vegetation on the S, W, and NW slopes. The charred area at the S was caused by a bush fire that started before 20 August (observed by Weber), while he attributed such areas to the W and NW as caused by lava flows. A sketch of the inner crater was drawn on 23 August by Weber (figure 98).
At about 1100 on 24 September, Jen Schoemburg reported seeing ash rising to an altitude of ~ 4 km, drifting NW. A local safari vehicle driver said that there had often been a 'mirage' visible above the volcano (from gases), but that for the previous two weeks or so the volcano had been emitting ash. He also said that people in surrounding villages had reported skin rashes on themselves and their animals. Additionally, 2-3 weeks prior, there had been earthquakes felt in the region. Near noon on 27 September, Schoemburg flew over going N, with the volcano passing on the W side of the plane (figure 99). The pilot said that in recent weeks ash rose to 6 km altitude; during the fly-over, it was rising to about 4.6 km, still drifting NW.
Observations during late September and ash petrology. Barry Dawson and Roger Mitchell reported on activity during 22-30 September 2007 and their petrologic investigations. During an overflight on 22 September, Dawson observed that there had been a complete collapse of the area around former T49 hornito/ash cone area, with the formation of an ash pit surrounded by new black ejecta. A large hornito (T40) between the pit and the N wall of the crater was still in existence. Small emissions of ash, probably less than 100 m high, were drifting N. There was much new whitened ash around the whole summit area, but with most to the S where the S crater and the higher parts of the S slopes were most thickly blanketed, possibly from the plume recorded on the ASTER image (figure 97) of 4 September 2007.
As observed from the foot of the volcano on 23 September and on the early morning of 24 September, there were small, intermittent ash eruptions. At about 0900 on 24 September a strong eruption started, giving rise to a black eruption column that quickly built up to a height estimated to be ~ 6 km (figure 100), where it spread out into a typical Plinian-type cloud. From the lower W slopes, explosions were distinctly heard. This strong eruptive phase lasted till around 1300 with the ash cloud drifting NW and lapilli falling on the NW slopes; lapilli were gathered for a comparative study with lapilli from the 1966 eruption (Dawson and others, 1992). Smaller, intermittent lapilli-bearing eruptions continued until nightfall (around 1830).
On 25 September there was minor activity until about 1300, when new eruptions ejected white material. A lapilli cone could be seen from the lower S slopes, and subsequently fountaining took place from two distinct centers within the crater. Activity continued for about four hours. On 26 September there was only minor activity with fine ash drifting to the NW, but in the late afternoon an ash column with a whitened head rose ~ 3 km. In the evening, the atmospheric dust resulted in the sun having a halo, being red in color. The moon that night also had a halo.
On 27 September, the volcano was quiet, but at 0900 on 28 September it erupted again, though no plume developed. There was fountaining from three centers over the next hour, with regular migration of the fountains from N to S; black lapilli was ejected to ~ 200 m above the vent. Activity recommenced at 1330 and lasted all afternoon, with an eruption column up to 2 km high. After this event, the prominent hornito near the N rim of the crater that was previously visible from the lower slopes was no longer visible.
There was no sign of activity on 29 September until 1200, when large eruptions sent material up to 3 km above the volcano. Initially black, the billowing top of the eruption column became white at and above the level of the surrounding atmospheric clouds. This could be interpreted as due to either (1) a higher albedo of finer material at the top of the eruption column, (2) dust forming nucleation sites for condensing atmospheric water, or (3) a combination of the two. In the late afternoon and early evening, dark material from the eruption plume, now much reduced in height, continued to spill down the NW slopes rather like a density flow. On 30 September, when last observed by Dawson, there were only minor ash eruptions that drifted NW.
Dawson noted that up to 30 September, the volume of material erupted and the height of the eruption column appeared smaller than the last major phase of ash eruptions in 1966-67, when plume heights of ~ 10,000 m were estimated, and ash distribution was as far as Seronera (130 km to the W) and Loliondo (72 km to the NW) (Dawson and others, 1968). For comparison, on 27 September 2007 when Dawson visited Sale (a Wasonjo settlement 45 km NW of Lengai), there were no signs of ashfall; during the July 1967 eruption, there was ashfall at Arusha (110 km SE) and at Wilson airfield, Nairobi (190 km NE) (Dawson and others, 1995). Natrocarbonatite lava in the gully immediately S of the climbing track (the overflow from the crater extruded roughly 25 March-5 April 2006, BGVN 32:02) was of two types; (a) a pahoehoe flow containing entrained blocks of wollastonite nephelinite, that was overlain and mainly buried beneath (b) a later aa flow that extended 3 km from the crater. On the upper SE slopes, ~ 200-300 m below the rim of the S crater, there had been extrusion of a short, thin, then-whitened natrocarbonatite flow; flank eruptions are unusual at Lengai.
Mitchell and Dawson collected ash samples on 24 September and subsequently described them as follows. "The lapilli contain nuclei of nepheline, clinopyroxene, Ti-melanite and wollastonite, collectively wollastonite ijolite, probably xenocrystic. Wollastonite and clinopyroxene are replaced by combeite. However the mantling ash consists of nepheline, melilite, combeite (Na2Ca2Si3O9), a Na-Ca carbonate-phosphate, Mn magnetite, and a K-Fe sulphide in a volumetrically-insignificant (less than 5%) sodium carbonate matrix. In lacking clinopyroxene the mantling ash is not nephelinite or melilitite, and is unlike any other magma type previously recorded from the volcano. The mantling ash is interpreted as a hybrid magma formed when nephelinite interacted with natrocarbonatite magma, forming combeite and melilite at the expense of clinopyroxene. The resulting decarbonation reaction released the CO2 that drove the eruption." Mitchell added that the ash seemed to be an extreme variant of the 1996 ash.
Activity during October-November 2007. On his website, Belton reported that Leander Ward saw lightning in some of the ash clouds in the early morning of 16 October 2007. Ward observed that the ash cone then dominated the entire active crater and appeared to have grown significantly in diameter; no other cones were visible. Charter pilot Kathy Moore reported an eruption on 19 October around 0830, sending plumes of smoke and ash into the atmosphere to an altitude of ~ 7.6 km. The plume was visible for ~ 160 km, but the eruption (one large blast followed by a smaller one) lasted only for a few minutes. Within half an hour the large cloud of ash had dispersed and only smaller clouds remained close to the mountain.
Tim Leach, owner of Lake Natron Camp on the S shore of Lake Natron, reported on 4 November that the ash eruption continued on a daily basis. His crew had occasionally seen night-time "lava eruptions." Leach advised against climbing the active crater and stated that they were working on developing safer routes terminating in the inactive S Crater. One difficult route that has been climbed twice from the Kerimasi side was vegetated in September, but by the end of October it was ash covered.
Michael Dalton-Smith reported that as of 10 November activity continued. From a distance he saw constant "smoke" rising 300-600 m above the summit. At one point it appeared that a light colored but strong ash cloud formed a column, but it was difficult to tell for sure due to clouds. Jean-Claude Tanguy sent an aerial photograph (figure 101) taken by Maxime Le Goff on 23 November 2007 that showed pronounced changes in the active crater. A large crater had clearly developed in the center of the N crater and the complex array of hornitos nearly all buried in ash were not in evidence.
References. Dawson, J. B., Bowden, P., and Clark, G. C., 1968, Activity of the carbonatite volcano Oldoinyo Lengai, 1966, International Journal of Earth Sciences (Geologische Rundshau), v. 57, no. 3, p. 865-879.
Dawson, J. B., Smith, J. V., and Steele, I. M., 1992, 1966 ash eruption of t he carbonatite volcano Oldoinyo Lengai: mineralogy of lapilli and mixing of silicate and carbonate magmas, Mineralogical Magazine, v. 56, p. 1-16.
Dawson, J. B., Keller, J., and Nyamweru, C., 1995, Historic and recent eruptive activity of Oldoinyo Lengai, p. 4-22 in Bell, K., and Keller, J. (eds), Carbonatite Volcanism, Oldoinyo Lengai and the Petrogenesis of Natrocarbonatites, Springer-Verlag, Berlin, p. 4-22.
Machault, J., 2007, Lengai du 3 au 5 ao?t 2007, LAVE, Revue de L'Association Volcanologique Européene, no. 129, p. 29-32, November 2007, 7 rue de la Guadeloupe, 75018 Paris, France (http://www.lave-volcans.com) ISSN 0982-9601.
Geologic Background. The symmetrical Ol Doinyo Lengai is the only volcano known to have erupted carbonatite tephras and lavas in historical time. The prominent stratovolcano, known to the Maasai as "The Mountain of God," rises abruptly above the broad plain south of Lake Natron in the Gregory Rift Valley. The cone-building stage ended about 15,000 years ago and was followed by periodic ejection of natrocarbonatitic and nephelinite tephra during the Holocene. Historical eruptions have consisted of smaller tephra ejections and emission of numerous natrocarbonatitic lava flows on the floor of the summit crater and occasionally down the upper flanks. The depth and morphology of the northern crater have changed dramatically during the course of historical eruptions, ranging from steep crater walls about 200 m deep in the mid-20th century to shallow platforms mostly filling the crater. Long-term lava effusion in the summit crater beginning in 1983 had by the turn of the century mostly filled the northern crater; by late 1998 lava had begun overflowing the crater rim.
Information Contacts: Gerald Ernst, Centre for Environmental & Geophysical Flows, Department of Earth Sciences, University of Bristol, Wills Memorial Building, Queens Road, Bristol BS8 1RJ, United Kingdom; Greg Vaughan, Jet Propulsion Laboratory, Mail Stop 183-501, 4800 Oak. Grove Dr., Pasadena, CA 91109, USA; Frederick Belton, Developmental Studies Department, PO Box 16, Middle Tennessee State University, Murfreesboro, TN 37132, USA (URL: http://oldoinyolengai.pbworks.com/); Hawai'i Institute of Geophysics and Planetology (HIGP) Thermal Alerts System, School of Ocean and Earth Science and Technology (SOEST), Univ. of Hawai'i, 2525 Correa Road, Honolulu, HI 96822, USA (URL: http://modis.higp.hawaii.edu/); Matthieu Kervyn, University of Ghent, Geology Department, Ghent, Belgium (URL: http://homepages.vub.ac.be/~makervyn/); Ashley Davies, NMP-ST6 Autonomous Sciencecraft Experiment Asteroids, Comets and Satellites Group (3224), ms 183-501, Jet Propulsion Laboratory, 4800 Oak Grove Dr., Pasadena, CA 91109-8099, USA; Christoph Weber, Volcano Expeditions International, Muehlweg 11, 74199 Untergruppenbach, Germany (URL: http://www.v-e-i.de/); J. Barry Dawson, Grant Institute of Earth Science, University of Edinburgh, King's Building, Edinburgh EH9 3JW, United Kingdom; Roger Mitchell, Lakehead University, 955 Oliver Road, Thunder Bay, ON P7B 5EI, Canada; Jennifer Fela Schoemburg, Cologne, Germany; Lake Natron Camp, Tim Leach (URL: http://www.ngare-sero-lodge.com/Natron_camp.htm); Kathy Moore; Celia Nyamweru, Department of Anthropology, St. Lawrence University, Canton, NY 13617, USA (URL: http://blogs.stlawu.edu/lengai/); Michael Dalton-Smith (URL: http://digitalcrossing.ca/); Jean-Claude Tanguy, Centre National de la Recherche Scientifique-Institut de Physique du Globe (CNRS-IPGP), Observatoire de Saint-Maur, 4, avenue de Neptune, 94107 Saint-Maur des Fossés Cedex, France; Julie Machault, LAVE "Aventure et Volcans" (sponsored by L'Association Volcanologique Européene, 7 rue de la Guadeloupe, 75018 Paris, France (URL: http://www.lave-volcans.com); USGS National Earthquake Information Center (URL: http://earthquakes.usgs.gov/).
Ruapehu (New Zealand) — November 2007 Cite this Report
Ruapehu
New Zealand
39.28°S, 175.57°E; summit elev. 2797 m
All times are local (unless otherwise noted)
Additional data on hydrothermal eruption's distribution and damage
A hydrothermal explosion at Ruapehu on 25 September 2007 was previously described (BGVN 32:10), with a plume and lahars discharged from Crater Lake. Since publication, new photos and additional information was provided by Brad Scott of New Zealand's Institute of Geological & Nuclear Sciences. In addition, an article came out on the tephra dam failure and subsequent lahar (Manville and Cronin, 2007). The tephra dam broke in March 2007 (BGVN 32:10) sending a big lahar down the Whangaehu Gorge and River (figure 36).
Photos of hydrothermal and lahar deposits on snow and alpine glacial ice were taken within days of the hydrothermal explosion. By 4 October, the mountain was blanketed in fresh snow, completely masking the recent deposits. Photos such as those included in this report (fresh deposits laid down on ice and snow from erupting high-altitude crater lakes) are comparatively rare.
Dome Shelter, located just N of Crater Lake, was directly in the path of the explosion. It was extensively buried by debris from the explosion and one person inside was badly injured.
Instruments recorded seismic and air-pressure signals associated with the hydrothermal explosion (figure 37). The seismic plot shows a strong wave initially arriving at 2026 NZ local time. The velocity of sound in air is several-fold slower that the velocity of vibrations through rock (seismic waves). In addition, the sound waves were recorded at a station ~ 6 km farther away from the signal source. Consequently the sound signal's first arrival was later.
Work is still in progress to understand the complicated lahar dynamics of this event. Three main lahars descended the mountain on 25 September. Two headed roughly E (one via the outlet and associated Whangaehu Gorge, the other, larger, out over the crater walls and down a glacier). Another lahar went N (over the crater walls).
The photo of Ruapehu's summit taken from a plane, shown in figure 35 in BGVN 32:10, was a view from the NE illustrating the scene shortly after the eruption. A similar photo appears here as figure 38, although this photo was taken from the E. In both these photos, the largest (most conspicuous) lahar follows a straight path from the summit area adjacent Crater Lake. It traveled over the Whangaehu glacier.
Ejecta apparently accumulated in the N Crater basin (figure 39) before some of it flowed down the Whangaehu glacier. The latter lahar was complex, owing to eruption-blasted water followed by runoff and other possible complexities still under study. The third lahar was small and came down the Ruapehu's N side. It passed near a ski slope (figures 40 and 41).
A view of Crater Lake looking S into the crater from the Dome Shelter (figure 42) shows the strong directionality of the blast to the N (towards Dome Shelter). Numerous small blocks and bombs are visible in the foreground. Near the lake appear some lighter textured deposits on the snow (figure 42). These are rather thin (less than 0.5-1 m thick) and cross some of the darker deposits. Initial field interpretations were that these lighter deposits formed in two ways. One is the deposits mark the absorption of ejected Crater Lake water into the snow pack. The second is that they preserve the aerosol developed on the fringes of a directed blast of steam and water discharged from the Lake. Figure 43 is similar to the previous one, only viewed standing on debris farther to the E, an area where significant runoff formed a long narrow channel, which in the foreground traveled downslope towards the viewer.
Dome Shelter and news-reported injury. Dome Shelter was partly buried by typical snow accumulation, over which came the deposits from the hydrothermal eruption, some of which invaded the structure (figure 44). To summarize news stories in the New Zealand Herald and The Sydney Morning Herald, four mountaineers were camped in the Shelter during the explosion. William Pike's left leg was injured and his right leg below the knee was crushed and pinned by deposits. He was rescued and ultimately flown out by helicopter but had suffered severe hypothermia. Doctors said at one point he was very near death, with body temperature in the 25-26°C range. They managed to save him after amputating the lower portion of his right leg. The news also reported that the Shelter was designated for emergency use only (not as a camping shelter).
GNS noted that the Shelter also houses monitoring instruments, equipment less damaged than initially thought. Data from one of the two seismic systems continued to flow, although the data were rather noisy. Accordingly, GNS began relying on nearby monitoring stations.
Reference. Manville, V., and Cronin, S.J., 2007, Breakout lahar from New Zealand's Crater Lake, Earth Observing Satellite, Transactions, American Geophysical Union, v. 88, no. 43, p. 441-442.
Geologic Background. Ruapehu, one of New Zealand's most active volcanoes, is a complex stratovolcano constructed during at least four cone-building episodes dating back to about 200,000 years ago. The dominantly andesitic 110 km3 volcanic massif is elongated in a NNE-SSW direction and surrounded by another 100 km3 ring plain of volcaniclastic debris, including the NW-flank Murimoto debris-avalanche deposit. A series of subplinian eruptions took place between about 22,600 and 10,000 years ago, but pyroclastic flows have been infrequent. The broad summait area and flank contain at least six vents active during the Holocene. Frequent mild-to-moderate explosive eruptions have been recorded from the Te Wai a-Moe (Crater Lake) vent, and tephra characteristics suggest that the crater lake may have formed as recently as 3,000 years ago. Lahars resulting from phreatic eruptions at the summit crater lake are a hazard to a ski area on the upper flanks and lower river valleys.
Information Contacts: Brad Scott, Institute of Geological & Nuclear Sciences (IGNS), Private Bag 2000, Wairakei, New Zealand (URL: http://www.gns.cri.nz/); New Zealand GeoNet Project (URL: http://www.geonet.org.nz/); New Zealand Herald (URL: http://www.nzherald.co.nz/); Sydney Morning Herald (URL: http://www.smh.com.au/).
Soputan (Indonesia) — November 2007 Cite this Report
Soputan
Indonesia
1.112°N, 124.737°E; summit elev. 1785 m
All times are local (unless otherwise noted)
Ash plumes and seismic activity continue through November 2007
Our last report on Soputan (BGVN 32:01) indicated that Soputan's lava dome was still emitting gas and generating rockfalls and ash plumes to 12 km in altitude through December 2006. This report, which includes a map (figure 3), discusses activity through November 2007.
According to the Center of Volcanology and Geological Hazard Mitigation (CVGHM), diffuse ash plumes rose from Soputan to an altitude of 1.8 km during 20-25 June 2007. The Alert Level remained at 3 (on a scale of 1-4), where it had been since 15 December 2006. Between 11 June and 1 July 2007 the only seismicity recorded was caused by rockfalls, with 107 events during 11-17 June, 124 events during 18-24 June, and 78 events during 25 June-1 July.
News accounts reported that Soputan erupted on 14 August, producing ash plumes that, according to the Darwin Volcanic Ash Advisory Centre (VAAC), rose to 4.6 km altitude and drifted W. Lava and rock avalanches were also observed. According to Yahoo! Canada News, volcanologist Sandy Manengke indicated that no injuries or damage were reported, but that villages along Soputan's base were covered in volcanic dust, and many residents were wearing face masks. According to Reuters, Saut Simatupang, head of Indonesia's Volcanology Survey, told the news agency that no evacuation was ordered and the Alert Level was not raised to 4 (maximum) because Soputan was unlikely to erupt in a way that would threaten the nearest village, 11 km from its crater. On 15 August seismicity decreased.
Based on observations of satellite imagery and information from CVGHM, the Darwin VAAC reported that an ash plume rose to an altitude of 4.6 km and drifted W during 14-15 August. Visual observations were made on 24-25 October and 30-31 October 2007 of white and gray plumes that rose to altitudes of 1.8-3.3 km and drifted W. In addition, based upon pilot reports and satellite imagery, the Darwin VAAC reported that on 25-26 October, ash plumes rose to 13.7 km altitude and drifted WSW. On 25 October, lava flowed 500-600 m down the W flank and flowed again on 30 October. Villagers and tourists were warned not to travel within a 6 km radius of the summit.
MODVOLC data (which is MODIS satellite thermal infrared data processed to indicate possible volcanism) is sometimes helpful in assessing lava and dome emissions at volcanoes. Alerts for 2007 appeared in August (7 alerts), October (23 alerts), and November (2 alerts). During 2006, alerts took place in December (11 alerts) and October (5).
According to CVGHM, the Alert Status was lowered from 3 to 2 on 23 November, based on a decrease in the number of earthquakes and seismic intensity, deformation measurements, and visual observations.
Geologic Background. The Soputan stratovolcano on the southern rim of the Quaternary Tondano caldera on the northern arm of Sulawesi Island is one of Sulawesi's most active volcanoes. The youthful, largely unvegetated volcano is the only active cone in the Sempu-Soputan volcanic complex, which includes the Soputan caldera, Rindengan, and Manimporok (3.5 km ESE). Kawah Masem maar was formed in the W part of the caldera and contains a crater lake; sulfur has been extracted from fumarolic areas in the maar since 1938. Recent eruptions have originated at both the summit crater and Aeseput, a prominent NE-flank vent that formed in 1906 and was the source of intermittent major lava flows until 1924.
Information Contacts: Center of Volcanology and Geological Hazard Mitigation (CVGHM), Diponegoro 57, Bandung, Jawa Barat 40122, Indonesia (URL: http://vsi.esdm.go.id/); Jenny Farlow, Darwin Volcanic Ash Advisory Centre, Bureau of Meteorology, Australia (URL: http://www.bom.gov.au/info/vaac/); Hawai'i Institute of Geophysics and Planetology (HIGP) Hot Spots System, University of Hawai'i, 2525 Correa Road, Honolulu, HI 96822, USA (URL: http://modis.higp.hawaii.edu/); Reuters (URL: http://www.reuters.com/); Yahoo! Canada News (URL: http://ca.news.yahoo.com/).
Suwanosejima (Japan) — November 2007 Cite this Report
Suwanosejima
Japan
29.638°N, 129.714°E; summit elev. 796 m
All times are local (unless otherwise noted)
Eruptions of July 2005-December 2007 send plumes to varying heights
Suwanose-jima, in the East China sea, is one of Japan's most active volcanoes. Our last report on Suwanose-jima (BGVN 30:07) tabulated the seismicity and the numerous ash plumes seen between April 2004 and July 2005. The current report continues the tabulation from August 2005 to December 2007 (table 4).
Table 4. Summary of activity reported at Suwanose-jima from August 2005 to December 2007, based on information from the Tokyo VAAC. "--" indicates that data were not reported.
| Date |
Activity |
Plume Altitude (km) |
Drift Direction |
| 11 Aug-12 Aug 2005 |
Small eruptions |
~ 3.4 |
-- |
| 22 Sep 2005 |
Plume |
~ 1.8 |
W |
| 07 Oct-09 Oct 2005 |
Eruptions |
max. 1.8 |
SW, E, SE |
| 01 Jan 2006 |
Explosions |
-- |
-- |
| 10 Jan 2006 |
Explosions |
~ 1.8 |
E |
| 24 Jan 2006 |
Plume |
1.5 |
E |
| 28 Jan 2006 |
Plume |
max. 1.8 |
W |
| 29 Jan 2006 |
Explosion |
-- |
-- |
| 31 Jan 2006 |
Plume |
1.5 |
W |
| 01 Feb 2006 |
Explosions |
-- |
-- |
| 06 Feb-07 Feb 2006 |
Explosions |
1.2 |
NW |
| 08 Feb-10 Feb 2006 |
Plumes |
max. 1.5 |
E and SE |
| 15 Feb-18 Feb 2006 |
Plumes |
max. 1.5 |
E and S |
| 22 Feb-24 Feb 2006 |
Eruptions |
max. ~ 3 |
S, E, NE |
| 02 Mar-08 Mar 2006 |
Explosions |
max. ~ 1.8 |
E, SE, S, NW |
| 16 Apr 2006 |
Ash plume |
~ 1.5 |
-- |
| 07 Jun 2006 |
Ash plume |
2.4 |
-- |
| 30 Jun 2006 |
Plume |
1.2 |
NE |
| 16 Jul 2006 |
Ash plume |
1.8 |
N |
| 26 Jul-30 Jul 2006 |
Explosions |
max. ~ 1.8 |
N, straight up |
| 11 Aug-14 Aug 2006 |
Explosions |
max. ~ 1.8 |
N and W |
| 26 Aug 2006 |
Plumes |
1.8 |
Straight up |
| 28 Aug 2006 |
Plumes |
1.5 |
E |
| 19 Sep 2006 |
Ash plumes |
3.4 |
E |
| 20 Sep 2006 |
Ash and steam |
2.1 |
N |
| 06 Oct 2006 |
Explosion |
-- |
-- |
| 14, 16-17 Oct 2006 |
Ash plumes |
3 |
-- |
| 18 Oct 2006 |
Explosion |
-- |
-- |
| 27 Oct-28 Oct 2006 |
Ash plumes |
1.8 |
E |
| 04 Nov-06 Nov 2006 |
Plumes |
1.2 |
E and SW |
| 09 Nov 2006 |
Plume |
1.5 |
W |
| 17 Nov 2006 |
Plume |
2.1 |
Straight up |
| 19 Dec 2006 |
Eruption |
-- |
-- |
| 09 Jan 2007 |
Plume |
-- |
-- |
| 28 Jan 2007 |
Plume |
-- |
-- |
| 05 Feb-07 Feb 2007 |
Plume |
-- |
-- |
| 19 Feb-20 Feb 2007 |
Plumes |
-- |
-- |
| 02 Mar 2007 |
Plume |
1.2 |
W |
| 17 Mar 2007 |
Explosion |
-- |
-- |
| 30 Mar 2007 |
Explosion |
-- |
-- |
| 02 Apr 2007 |
Explosion |
-- |
-- |
| 08 May 2007 |
Explosions |
-- |
-- |
| 26 Jul 2007 |
Ash plume |
1.5 |
SW |
| 17 Sep 2007 |
Explosions |
-- |
-- |
| 16 Oct 2007 |
Plume |
1.5 |
E |
| 22 Oct 2007 |
Plume |
1.5 |
W |
| 26 Oct-28 Oct 2007 |
Plumes |
1.5 |
E and W |
| 29 Nov-02 Dec 2007 |
Plumes |
1.2-1.8 |
E |
| 10 Dec 2007 |
Plumes |
1.5-1.8 |
W |
| 14 Dec-17 Dec 2007 |
Plumes |
1.5-1.8 |
E |
During the reporting interval, the Tokyo Volcanic Ash Advisory Center reported small explosions or eruptions, usually accompanied by ash plumes, every month during this period, except for November and December 2005, May 2006, and June 2007. Ash was seldom identified on satellite imagery. On 20 September 2006, the Moderate Resolution Imaging Spectroradiometer (MODIS) on NASA's Terra satellite detected ash-and-steam emissions (figure 11).
Geologic Background. The 8-km-long island of Suwanosejima in the northern Ryukyu Islands consists of an andesitic stratovolcano with two active summit craters. The summit is truncated by a large breached crater extending to the sea on the E flank that was formed by edifice collapse. One of Japan's most frequently active volcanoes, it was in a state of intermittent Strombolian activity from Otake, the NE summit crater, between 1949 and 1996, after which periods of inactivity lengthened. The largest recorded eruption took place in 1813-14, when thick scoria deposits covered residential areas, and the SW crater produced two lava flows that reached the western coast. At the end of the eruption the summit of Otake collapsed, forming a large debris avalanche and creating an open collapse scarp extending to the eastern coast. The island remained uninhabited for about 70 years after the 1813-1814 eruption. Lava flows reached the eastern coast of the island in 1884. Only about 50 people live on the island.
Information Contacts: Tokyo Volcanic Ash Advisory Center (Tokyo VAAC), Japan Meteorological Agency (JMA), 1-3-4 Ote-machi, Chiyoda-ku, Tokyo 100, Japan (URL: https://ds.data.jma.go.jp/svd/vaac/data/); NASA Moderate Resolution Imaging Spectroradiometer (MODIS) program (URL: http://modis.gsfc.nasa.gov/).