Recently Published Bulletin Reports
Erebus (Antarctica) Lava lake remains active; most thermal alerts recorded since 2019
Rincon de la Vieja (Costa Rica) Frequent phreatic explosions during July-December 2023
Bezymianny (Russia) Explosion on 18 October 2023 sends ash plume 8 km high; lava flows and incandescent avalanches
Kilauea (United States) Low-level lava effusions in the lava lake at Halema’uma’u during July-December 2022
Nyamulagira (DR Congo) Lava flows and thermal activity during May-October 2023
Bagana (Papua New Guinea) Explosions, ash plumes, ashfall, and lava flows during April-September 2023
Mayon (Philippines) Lava flows, pyroclastic flows, ash emissions, and seismicity during April-September 2023
Nishinoshima (Japan) Eruption plumes and gas-and-steam plumes during May-August 2023
Krakatau (Indonesia) White gas-and-steam plumes and occasional ash plumes during May-August 2023
Merapi (Indonesia) Frequent incandescent avalanches during April-September 2023
Villarrica (Chile) Strombolian activity, gas-and-ash emissions, and crater incandescence during April-September 2023
Ebeko (Russia) Moderate explosive activity with ash plumes continued during June-November 2023
Erebus (Antarctica) — January 2024  Cite this Report
Erebus
Antarctica
77.53°S, 167.17°E; summit elev. 3794 m
All times are local (unless otherwise noted)
Lava lake remains active; most thermal alerts recorded since 2019
The lava lake in the summit crater of Erebus has been active since at least 1972. Located in Antarctica overlooking the McMurdo Station on Ross Island, it is the southernmost active volcano on the planet. Because of the remote location, activity is primarily monitored by satellites. This report covers activity during 2023.
The number of thermal alerts recorded by the Hawai'i Institute of Geophysics and Planetology’s MODVOLC Thermal Alerts System increased considerably in 2023 compared to the years 2020-2022 (table 9). In contrast to previous years, the MODIS instruments aboard the Aqua and Terra satellites captured data from Erebus every month during 2023. Consistent with previous years, the lowest number of anomalous pixels were recorded in January, November, and December.
Table 9. Number of monthly MODIS-MODVOLC thermal alert pixels recorded at Erebus during 2017-2023. See BGVN 42:06 for data from 2000 through 2016. The table was compiled using data provided by the HIGP – MODVOLC Thermal Alerts System.
| Year |
Jan |
Feb |
Mar |
Apr |
May |
Jun |
Jul |
Aug |
Sep |
Oct |
Nov |
Dec |
SUM |
| 2017 |
0 |
21 |
9 |
0 |
0 |
1 |
11 |
61 |
76 |
52 |
0 |
3 |
234 |
| 2018 |
0 |
21 |
58 |
182 |
55 |
17 |
137 |
172 |
103 |
29 |
0 |
0 |
774 |
| 2019 |
2 |
21 |
162 |
151 |
55 |
56 |
75 |
53 |
29 |
19 |
1 |
0 |
624 |
| 2020 |
0 |
2 |
16 |
18 |
4 |
4 |
1 |
3 |
18 |
3 |
1 |
6 |
76 |
| 2021 |
0 |
9 |
1 |
0 |
2 |
56 |
46 |
47 |
35 |
52 |
5 |
3 |
256 |
| 2022 |
1 |
13 |
55 |
22 |
15 |
32 |
39 |
19 |
31 |
11 |
0 |
0 |
238 |
| 2023 |
2 |
33 |
49 |
82 |
41 |
32 |
70 |
64 |
42 |
17 |
5 |
11 |
448 |
Sentinel-2 infrared images showed one or two prominent heat sources within the summit crater, accompanied by adjacent smaller sources, similar to recent years (see BGVN 46:01, 47:02, and 48:01). A unique image was obtained on 25 November 2023 by the OLI-2 (Operational Land Imager-2) on Landsat 9, showing the upper part of the volcano surrounded by clouds (figure 32).
Geologic Background. Mount Erebus, the world's southernmost historically active volcano, overlooks the McMurdo research station on Ross Island. It is the largest of three major volcanoes forming the crudely triangular Ross Island. The summit of the dominantly phonolitic volcano has been modified by one or two generations of caldera formation. A summit plateau at about 3,200 m elevation marks the rim of the youngest caldera, which formed during the late-Pleistocene and within which the modern cone was constructed. An elliptical 500 x 600 m wide, 110-m-deep crater truncates the summit and contains an active lava lake within a 250-m-wide, 100-m-deep inner crater; other lava lakes are sometimes present. The glacier-covered volcano was erupting when first sighted by Captain James Ross in 1841. Continuous lava-lake activity with minor explosions, punctuated by occasional larger Strombolian explosions that eject bombs onto the crater rim, has been documented since 1972, but has probably been occurring for much of the volcano's recent history.
Information Contacts: Hawai'i Institute of Geophysics and Planetology (HIGP) - MODVOLC Thermal Alerts System, School of Ocean and Earth Science and Technology (SOEST), Univ. of Hawai'i, 2525 Correa Road, Honolulu, HI 96822, USA (URL: http://modis.higp.hawaii.edu/); Copernicus Browser, Copernicus Data Space Ecosystem, European Space Agency (URL: https://dataspace.copernicus.eu/browser/); NASA Earth Observatory, EOS Project Science Office, NASA Goddard Space Flight Center, Goddard, Maryland, USA (URL: https://earthobservatory.nasa.gov/images/152134/erebus-breaks-through).
Rincon de la Vieja (Costa Rica) — January 2024 Cite this Report
Rincon de la Vieja
Costa Rica
10.83°N, 85.324°W; summit elev. 1916 m
All times are local (unless otherwise noted)
Frequent phreatic explosions during July-December 2023
Rincón de la Vieja is a volcanic complex in Costa Rica with a hot convecting acid lake that exhibits frequent weak phreatic explosions, gas-and-steam emissions, and occasional elevated sulfur dioxide levels (BGVN 45:10, 46:03, 46:11). The current eruption period began June 2021. This report covers activity during July-December 2023 and is based on weekly bulletins and occasional daily reports from the Observatorio Vulcanologico Sismologica de Costa Rica-Universidad Nacional (OVSICORI-UNA).
Numerous weak phreatic explosions continued during July-December 2023, along with gas-and-steam emissions and plumes that rose as high as 3 km above the crater rim. Many weekly OVSICORI-UNA bulletins included the previous week's number of explosions and emissions (table 9). For many explosions, the time of explosion was given (table 10). Frequent seismic activity (long-period earthquakes, volcano-tectonic earthquakes, and tremor) accompanied the phreatic activity.
Table 9. Number of reported weekly phreatic explosions and gas-and-steam emissions at Rincón de la Vieja, July-December 2023. Counts are reported for the week before the Weekly Bulletin date; not all reports included these data. Courtesy of OVSICORI-UNA.
| OVSICORI Weekly Bulletin |
Number of explosions |
Number of emissions |
| 28 Jul 2023 |
6 |
14 |
| 4 Aug 2023 |
10 |
12 |
| 1 Sep 2023 |
13 |
11 |
| 22 Sep 2023 |
12 |
13 |
| 29 Sep 2023 |
6 |
11 |
| 6 Oct 2023 |
12 |
5 |
| 13 Oct 2023 |
7 |
9 |
| 20 Oct 2023 |
1 |
15 |
| 27 Oct 2023 |
3 |
23 |
| 3 Nov 2023 |
3 |
10 |
| 17 Nov 2023 |
0 |
Some |
| 24 Nov 2023 |
0 |
14 |
| 8 Dec 2023 |
4 |
16 |
| 22 Dec 2023 |
8 |
18 |
Table 10. Summary of activity at Rincón de la Vieja during July-December 2023. Weak phreatic explosions and gas emissions are noted where the time of explosion was indicated in the weekly or daily bulletins. Height of plumes or emissions are distance above the crater rim. Courtesy of OVSICORI-UNA.
| Date |
Time |
Description of Activity |
| 1 Jul 2023 |
0156 |
Explosion. |
| 2 Jul 2023 |
0305 |
Explosion. |
| 4 Jul 2023 |
0229, 0635 |
Event at 0635 produced a gas-and-steam plume that rose 700 m and drifted W; seen by residents in Liberia (21 km SW). |
| 9 Jul 2023 |
1843 |
Explosion. |
| 21 Jul 2023 |
0705 |
Explosion. |
| 26 Jul 2023 |
1807 |
Explosion. |
| 28 Jul 2023 |
0802 |
Explosion generated a gas-and-steam plume that rose 500 m. |
| 30 Jul 2023 |
1250 |
Explosion. |
| 31 Jul 2023 |
2136 |
Explosion. |
| 11 Aug 2023 |
0828 |
Explosion. |
| 18 Aug 2023 |
1304 |
Explosion. |
| 21 Aug 2023 |
1224 |
Explosion generated gas-and-steam plumes rose 500-600 m. |
| 22 Aug 2023 |
0749 |
Explosion generated gas-and-steam plumes rose 500-600 m. |
| 24 Aug 2023 |
1900 |
Explosion. |
| 25 Aug 2023 |
0828 |
Event produced a steam-and-gas plume that rose 3 km and drifted NW. |
| 27-28 Aug 2023 |
0813 |
Four small events; the event at 0813 on 28 August lasted two minutes and generated a steam-and-gas plume that rose 2.5 km. |
| 1 Sep 2023 |
1526 |
Explosion generated plume that rose 2 km and ejected material onto the flanks. |
| 2-3 Sep 2023 |
- |
Small explosions detected in infrasound data. |
| 4 Sep 2023 |
1251 |
Gas-and-steam plume rose 1 km and drifted W. |
| 7 Nov 2023 |
1113 |
Explosion. |
| 8 Nov 2023 |
0722 |
Explosion. |
| 12 Nov 2023 |
0136 |
Small gas emissions. |
| 14 Nov 2023 |
0415 |
Small gas emissions. |
According to OVSICORI-UNA, during July-October the average weekly sulfur dioxide (SO2) flux ranged from 68 to 240 tonnes/day. However, in mid-November the flux increased to as high as 334 tonnes/day, the highest value measured in recent years. The high SO2 flux in mid-November was also detected by the TROPOMI instrument on the Sentinel-5P satellite (figure 43).
Geologic Background. Rincón de la Vieja, the largest volcano in NW Costa Rica, is a remote volcanic complex in the Guanacaste Range. The volcano consists of an elongated, arcuate NW-SE-trending ridge constructed within the 15-km-wide early Pleistocene Guachipelín caldera, whose rim is exposed on the south side. Sometimes known as the "Colossus of Guanacaste," it has an estimated volume of 130 km3 and contains at least nine major eruptive centers. Activity has migrated to the SE, where the youngest-looking craters are located. The twin cone of Santa María volcano, the highest peak of the complex, is located at the eastern end of a smaller, 5-km-wide caldera and has a 500-m-wide crater. A Plinian eruption producing the 0.25 km3 Río Blanca tephra about 3,500 years ago was the last major magmatic eruption. All subsequent eruptions, including numerous historical eruptions possibly dating back to the 16th century, have been from the prominent active crater containing a 500-m-wide acid lake located ENE of Von Seebach crater.
Information Contacts: Observatorio Vulcanológico Sismológica de Costa Rica-Universidad Nacional (OVSICORI-UNA), Apartado 86-3000, Heredia, Costa Rica (URL: http://www.ovsicori.una.ac.cr/); NASA Global Sulfur Dioxide Monitoring Page, Atmospheric Chemistry and Dynamics Laboratory, NASA Goddard Space Flight Center (NASA/GSFC), 8800 Greenbelt Road, Goddard MD 20771, USA (URL: https://so2.gsfc.nasa.gov/).
Bezymianny (Russia) — November 2023 Cite this Report
Bezymianny
Russia
55.972°N, 160.595°E; summit elev. 2882 m
All times are local (unless otherwise noted)
Explosion on 18 October 2023 sends ash plume 8 km high; lava flows and incandescent avalanches
Bezymianny, located on Russia’s Kamchatka Peninsula, has had eruptions since 1955 characterized by dome growth, explosions, pyroclastic flows, ash plumes, and ashfall. Activity during November 2022-April 2023 included gas-and-steam emissions, lava dome collapses generating avalanches, and persistent thermal activity. Similar eruptive activity continued from May through October 2023, described here based on information from weekly and daily reports of the Kamchatka Volcano Eruptions Response Team (KVERT), notices from Tokyo VAAC (Volcanic Ash Advisory Center), and from satellite data.
Overall activity decreased after the strong period of activity in late March through April 2023, which included ash explosions during 29 March and 7-8 April 2023 that sent plumes as high as 10-12 km altitude, along with dome growth and lava flows (BGVN 48:05). This reduced activity can be seen in the MIROVA thermal detection system graph (figure 56), which was consistent with data from the MODVOLC thermal detection system and with Sentinel-2 satellite images that showed persistent hotspots in the summit crater when conditions allowed observations. A renewed period of strong activity began in mid-October 2023.
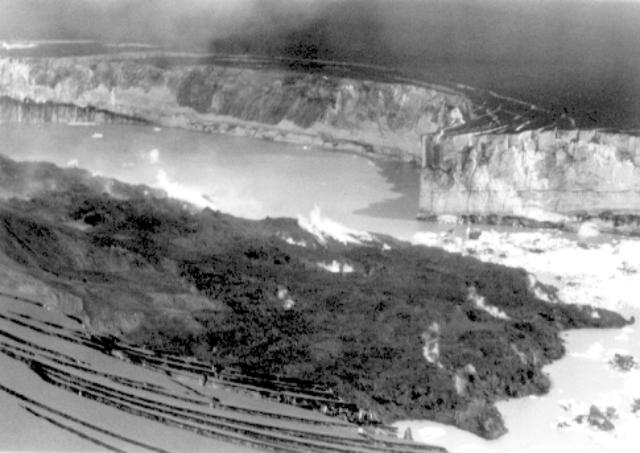
Activity increased significantly on 17 October 2023 when large collapses began during 0700-0830 on the E flanks of the lava dome and continued to after 0930 the next day (figure 57). Ash plumes rose to an altitude of 4.5-5 km, extending 220 km NNE by 18 October. A large explosion at 1630 on 18 October produced an ash plume that rose to an altitude of 11 km (8 km above the summit) and drifted NNE and then NW, extending 900 km NW within two days at an altitude of 8 km. Minor ashfall was noted in Kozyrevsk (45 km WNW). At 0820 on 20 October an ash plume was identified in satellite images drifting 100 km ENE at altitudes of 4-4.5 km.
Lava flows and hot avalanches from the dome down the SE flank continued over the next few days, including 23 October when clear conditions allowed good observations (figures 58 and 59). A large thermal anomaly was observed over the volcano through 24 October, and in the summit crater on 30 October (figure 60). Strong fumarolic activity continued, with numerous avalanches and occasional incandescence. By the last week of October, volcanic activity had decreased to a level consistent with that earlier in the reporting period.
Aviation warnings were frequently updated during 17-20 October. KVERT issued a Volcano Observatory Notice for Aviation (VONA) on 17 October at 1419 and 1727 (0219 and 0527 UTC) raising the Aviation Color Code (ACC) from Yellow to Orange (second highest level). The next day, KVERT issued a VONA at 1705 (0505 UTC) raising the ACC to Red (highest level) but lowered it back to Orange at 2117 (0917 UTC). After another decrease to Yellow and back to Orange, the ACC was reduced to Yellow on 20 October at 1204 (0004 UTC). In addition, the Tokyo VAAC issued a series of Volcanic Ash Advisories beginning on 16 October and continuing through 30 October.
Geologic Background. The modern Bezymianny, much smaller than its massive neighbors Kamen and Kliuchevskoi on the Kamchatka Peninsula, was formed about 4,700 years ago over a late-Pleistocene lava-dome complex and an edifice built about 11,000-7,000 years ago. Three periods of intensified activity have occurred during the past 3,000 years. The latest period, which was preceded by a 1,000-year quiescence, began with the dramatic 1955-56 eruption. This eruption, similar to that of St. Helens in 1980, produced a large open crater that was formed by collapse of the summit and an associated lateral blast. Subsequent episodic but ongoing lava-dome growth, accompanied by intermittent explosive activity and pyroclastic flows, has largely filled the 1956 crater.
Information Contacts: Kamchatka Volcanic Eruptions Response Team (KVERT), Far Eastern Branch, Russian Academy of Sciences, 9 Piip Blvd., Petropavlovsk-Kamchatsky, 683006, Russia (URL: http://www.kscnet.ru/ivs/kvert/); Kamchatka Volcanological Station, Kamchatka Branch of Geophysical Survey, (KB GS RAS), Klyuchi, Kamchatka Krai, Russia (URL: http://volkstat.ru/); Tokyo Volcanic Ash Advisory Center (VAAC), 1-3-4 Otemachi, Chiyoda-ku, Tokyo 100-8122, Japan (URL: http://ds.data.jma.go.jp/svd/vaac/data/); Hawai'i Institute of Geophysics and Planetology (HIGP) - MODVOLC Thermal Alerts System, School of Ocean and Earth Science and Technology (SOEST), Univ. of Hawai'i, 2525 Correa Road, Honolulu, HI 96822, USA (URL: http://modis.higp.hawaii.edu/); MIROVA (Middle InfraRed Observation of Volcanic Activity), a collaborative project between the Universities of Turin and Florence (Italy) supported by the Centre for Volcanic Risk of the Italian Civil Protection Department (URL: http://www.mirovaweb.it/); Copernicus Browser, Copernicus Data Space Ecosystem, European Space Agency (URL: https://dataspace.copernicus.eu/browser/).chr
Kilauea (United States) — January 2023 Cite this Report
Kilauea
United States
19.421°N, 155.287°W; summit elev. 1222 m
All times are local (unless otherwise noted)
Low-level lava effusions in the lava lake at Halema’uma’u during July-December 2022
Kīlauea is the southeastern-most volcano in Hawaii and overlaps the E flank of the Mauna Loa volcano. Its East Rift Zone (ERZ) has been intermittently active for at least 2,000 years. An extended eruption period began in January 1983 and was characterized by open lava lakes and lava flows from the summit caldera and the East Rift Zone. During May 2018 magma migrated into the Lower East Rift Zone (LERZ) and opened 24 fissures along a 6-km-long NE-trending fracture zone that produced lava flows traveling in multiple directions. As lava emerged from the fissures, the lava lake at Halema'uma'u drained and explosions sent ash plumes to several kilometers altitude (BGVN 43:10).
The current eruption period started during September 2021 and has recently been characterized by lava effusions, spatter, and sulfur dioxide emissions in the active Halema’uma’u lava lake (BGVN 47:08). Lava effusions, some spatter, and sulfur dioxide emissions have continued during this reporting period of July through December 2022 using daily reports, volcanic activity notices, and abundant photo, map, and video data from the US Geological Survey's (USGS) Hawaiian Volcano Observatory (HVO).
Summary of activity during July-December 2022. Low-level effusions have continued at the western vent of the Halema’uma’u crater during July through early December 2022. Occasional weak ooze-outs (also called lava break outs) would occur along the margins of the crater floor. The overall level of the active lava lake throughout the reporting period gradually increased due to infilling, however it stagnated in mid-September (table 13). During September through November, activity began to decline, though lava effusions persisted at the western vent. By 9 December, the active part of the lava lake had completely crusted over, and incandescence was no longer visible.
Table 13. Summary of measurements taken during overflights at Kīlauea that show a gradual increase in the active lava lake level and the volume of lava effused since 29 September 2021. Lower activity was reported during September-October. Data collected during July-December 2022. Courtesy of HVO.
| Date: |
Level of the active lava lake (m): |
Cumulative volume of lava effused (million cubic meters): |
| 7 Jul 2022 |
130 |
95 |
| 19 Jul 2022 |
133 |
98 |
| 4 Aug 2022 |
136 |
102 |
| 16 Aug 2022 |
137 |
104 |
| 12 Sep 2022 |
143 |
111 |
| 5 Oct 2022 |
143 |
111 |
| 28 Oct 2022 |
143 |
111 |
Activity during July 2022. Lava effusions were reported from the western vent in the Halema’uma’u crater, along with occasional weak ooze-outs along the margins of the crater floor. The height of the lava lake was variable due to deflation-inflation tilt events; for example, the lake level dropped approximately 3-4 m during a summit deflation-inflation event reported on 1 July. Webcam images taken during the night of 6-12 July showed intermittent low-level spattering at the western vent that rose less than 10 m above the vent (figure 519). Measurements made during an overflight on 7 July indicated that the crater floor was infilled about 130 m and that 95 million cubic meters of lava had been effused since 29 September 2021. A single, relatively small lava ooze-out was active to the S of the lava lake. Around midnight on 8 July there were two brief periods of lava overflow onto the lake margins. On 9 July lava ooze-outs were reported near the SE and NE edges of the crater floor and during 10-11 July they occurred near the E, NE, and NW edges. On 16 July crater incandescence was reported, though the ooze-outs and spattering were not visible. On 18 July overnight webcam images showed incandescence in the western vent complex and two ooze-outs were reported around 0000 and 0200 on 19 July. By 0900 there were active ooze-outs along the SW edge of the crater floor. Measurements made from an overflight on 19 July indicated that the crater floor was infilled about 133 m and 98 million cubic meters of lava had erupted since 29 September 2021 (figure 520). On 20 July around 1600 active ooze-outs were visible along the N edge of the crater, which continued through the next day. Extensive ooze-outs occurred along the W margin during 24 July until 1900; on 26 July minor ooze-outs were noted along the N margin. Minor spattering was visible on 29 July along the E margin of the lake. The sulfur dioxide emission rates ranged 650-2,800 tons per day (t/d), the higher of which was measured on 8 July (figure 519).
Activity during August 2022. The eruption continued in the Halema’uma’u crater at the western vent. According to HVO the lava in the active lake remained at the level of the bounding levees. Occasional minor ooze-outs were observed along the margins of the crater floor. Strong nighttime crater incandescence was visible after midnight on 6 August over the western vent cone. During 6-7 August scattered small lava lobes were active along the crater floor and incandescence persisted above the western vent through 9 August. During 7-9 August HVO reported a single lava effusion source was active along the NW margin of the crater floor. Measurements from an overflight on 4 August indicated that the crater floor was infilled about 136 m total and that 102 million cubic meters of lava had been erupted since the start of the eruption. Lava breakouts were reported along the N, NE, E, S, and W margins of the crater during 10-16 August. Another overflight survey conducted on 16 August indicated that the crater floor infilled about 137 m and 104 million cubic meters of lava had been erupted since September 2021. Measured sulfur dioxide emissions rates ranged 1,150-2,450 t/d, the higher of which occurred on 8 August.
Activity during September 2022. During September, lava effusion continued from the western vent into the active lava lake and onto the crater floor. Intermittent minor ooze-outs were reported through the month. A small ooze-out was visible on the W crater floor margin at 0220 on 2 September, which showed decreasing surface activity throughout the day, but remained active through 3 September. On 3 September around 1900 a lava outbreak occurred along the NW margin of the crater floor but had stopped by the evening of 4 September. Field crews monitoring the summit lava lake on 9 September observed spattering on the NE margin of the lake that rose no higher than 10 m, before falling back onto the lava lake crust (figure 521). Overflight measurements on 12 September indicated that the crater floor was infilled a total of 143 m and 111 million cubic meters of lava had been erupted since September 2021. Extensive breakouts in the W and N part of the crater floor were reported at 1600 on 20 September and continued into 26 September. The active part of the lava lake dropped by 10 m while other parts of the crater floor dropped by several meters. Summit tiltmeters recorded a summit seismic swarm of more than 80 earthquakes during 1500-1800 on 21 September, which occurred about 1.5 km below Halema’uma’u; a majority of these were less than Mw 2. By 22 September the active part of the lava lake was infilled about 2 m. On 23 September the western vent areas exhibited several small spatter cones with incandescent openings, along with weak, sporadic spattering (figure 522). The sulfur dioxide emission rate ranged from 930 t/d to 2,000 t/d, the higher of which was measured on 6 September.
Activity during October 2022. Activity during October declined slightly compared to previous months, though lava effusions persisted from the western vent into the active lava lake and onto the crater floor during October (figure 523). Slight variations in the lava lake were noted throughout the month. HVO reported that around 0600 on 3 October the level of the lava lake has lowered slightly. Overflight measurements taken on 5 October indicated that the crater floor was infilled a total of about 143 m and that 111 million cubic meters of lava had been effused since September 2021. During 6-7 October the lake gradually rose 0.5 m. Sulfur dioxide measurements made on 22 October had an emission rate of 700 t/d. Another overflight taken on 28 October showed that there was little to no change in the elevation of the crater floor: the crater floor was infilled a total of 143 m and 111 million cubic meters of lava had erupted since the start of the eruption.
Activity during November 2022. Activity remained low during November, though HVO reported that lava from the western vent continued to effuse into the active lava lake and onto the crater floor throughout the month. The rate of sulfur dioxide emissions during November ranged from 300-600 t/d, the higher amount of which occurred on 9 November.
Activity during December 2022. Similar low activity was reported during December, with lava effusing from the western vent into the active lava lake and onto the crater floor. During 4-5 December the active part of the lava lake was slightly variable in elevation and fluctuated within 1 m. On 9 December HVO reported that lava was no longer erupting from the western vent in the Halema’uma’u crater and that sulfur dioxide emissions had returned to near pre-eruption background levels; during 10-11 December, the lava lake had completely crusted over, and no incandescence was visible (figure 524). Time lapse camera images covering the 4-10 December showed that the crater floor showed weak deflation and no inflation. Some passive events of crustal overturning were reported during 14-15 December, which brought fresh incandescent lava to the lake surface. The sulfur dioxide emission rate was approximately 200 t/d on 14 December. A smaller overturn event on 17 December and another that occurred around 0000 and into the morning of 20 December were also detected. A small seismic swarm was later detected on 30 December.
Geologic Background. Kilauea overlaps the E flank of the massive Mauna Loa shield volcano in the island of Hawaii. Eruptions are prominent in Polynesian legends; written documentation since 1820 records frequent summit and flank lava flow eruptions interspersed with periods of long-term lava lake activity at Halemaumau crater in the summit caldera until 1924. The 3 x 5 km caldera was formed in several stages about 1,500 years ago and during the 18th century; eruptions have also originated from the lengthy East and Southwest rift zones, which extend to the ocean in both directions. About 90% of the surface of the basaltic shield volcano is formed of lava flows less than about 1,100 years old; 70% of the surface is younger than 600 years. The long-term eruption from the East rift zone between 1983 and 2018 produced lava flows covering more than 100 km2, destroyed hundreds of houses, and added new coastline.
Information Contacts: Hawaiian Volcano Observatory (HVO), U.S. Geological Survey, PO Box 51, Hawai'i National Park, HI 96718, USA (URL: http://hvo.wr.usgs.gov/).
Nyamulagira (DR Congo) — November 2023 Cite this Report
Nyamulagira
DR Congo
1.408°S, 29.2°E; summit elev. 3058 m
All times are local (unless otherwise noted)
Lava flows and thermal activity during May-October 2023
Nyamulagira (also known as Nyamuragira) is a shield volcano in the Democratic Republic of Congo with the summit truncated by a small 2 x 2.3 km caldera with walls up to about 100 m high. Documented eruptions have occurred within the summit caldera, as well as from numerous flank fissures and cinder cones. The current eruption period began in April 2018 and has more recently been characterized by summit crater lava flows and thermal activity (BGVN 48:05). This report describes lava flows and variable thermal activity during May through October 2023, based on information from the Observatoire Volcanologique de Goma (OVG) and various satellite data.
Lava lake activity continued during May. The MIROVA (Middle InfraRed Observation of Volcanic Activity) system recorded moderate-to-strong thermal activity throughout the reporting period; activity was more intense during May and October and relatively weaker from June through September (figure 95). The MODVOLC thermal algorithm, detected a total of 209 thermal alerts. There were 143 hotspots detected during May, eight during June, nine during September, and 49 during October. This activity was also reflected in infrared satellite images, where a lava flow was visible in the NW part of the crater on 7 May and strong activity was seen in the center of the crater on 4 October (figure 96). Another infrared satellite image taken on 12 May showed still active lava flows along the NW margin of the crater. According to OVG lava effusions were active during 7-29 May and moved to the N and NW parts of the crater beginning on 9 May. Strong summit crater incandescence was visible from Goma (27 km S) during the nights of 17, 19, and 20 May (figure 97). On 17 May there was an increase in eruptive activity, which peaked at 0100 on 20 May. Notable sulfur dioxide plumes drifted NW and W during 19-20 May (figure 98). Drone footage acquired in partnership with the USGS (United States Geological Survey) on 20 May captured images of narrow lava flows that traveled about 100 m down the W flank (figure 99). Data from the Rumangabo seismic station indicated a decreasing trend in activity during 17-21 May. Although weather clouds prevented clear views of the summit, a strong thermal signature on the NW flank was visible in an infrared satellite image on 22 May, based on an infrared satellite image. On 28 May the lava flows on the upper W flank began to cool and solidify. By 29 May seismicity returned to levels similar to those recorded before the 17 May increase. Lava effusion continued but was confined to the summit crater; periodic crater incandescence was observed.
Low-level activity was noted during June through October. On 1 June OVG reported that seismicity remained at lower levels and that crater incandescence had been absent for three days, though infrared satellite imagery showed continued lava effusion in the summit crater. The lava flows on the flanks covered an estimated 0.6 km2. Satellite imagery continued to show thermal activity confined to the lava lake through October (figure 96), although no lava flows or significant sulfur dioxide emissions were reported.
Geologic Background. Africa's most active volcano, Nyamulagira (also known as Nyamuragira), is a massive high-potassium basaltic shield about 25 km N of Lake Kivu and 13 km NNW of the steep-sided Nyiragongo volcano. The summit is truncated by a small 2 x 2.3 km caldera that has walls up to about 100 m high. Documented eruptions have occurred within the summit caldera, as well as from the numerous flank fissures and cinder cones. A lava lake in the summit crater, active since at least 1921, drained in 1938, at the time of a major flank eruption. Recent lava flows extend down the flanks more than 30 km from the summit as far as Lake Kivu; extensive lava flows from this volcano have covered 1,500 km2 of the western branch of the East African Rift.
Information Contacts: Observatoire Volcanologique de Goma (OVG), Departement de Geophysique, Centre de Recherche en Sciences Naturelles, Lwiro, D.S. Bukavu, DR Congo; Hawai'i Institute of Geophysics and Planetology (HIGP) - MODVOLC Thermal Alerts System, School of Ocean and Earth Science and Technology (SOEST), Univ. of Hawai'i, 2525 Correa Road, Honolulu, HI 96822, USA (URL: http://modis.higp.hawaii.edu/); MIROVA (Middle InfraRed Observation of Volcanic Activity), a collaborative project between the Universities of Turin and Florence (Italy) supported by the Centre for Volcanic Risk of the Italian Civil Protection Department (URL: http://www.mirovaweb.it/); NASA Global Sulfur Dioxide Monitoring Page, Atmospheric Chemistry and Dynamics Laboratory, NASA Goddard Space Flight Center (NASA/GSFC), 8800 Greenbelt Road, Goddard, Maryland, USA (URL: https://so2.gsfc.nasa.gov/); Copernicus Browser, Copernicus Data Space Ecosystem, European Space Agency (URL: https://dataspace.copernicus.eu/browser/); Charles Balagizi, Goma Volcano Observatory, Departement de Geophysique, Centre de Recherche en Sciences Naturelles, Lwiro, D.S. Bukavu, DR Congo.
Bagana (Papua New Guinea) — October 2023 Cite this Report
Bagana
Papua New Guinea
6.137°S, 155.196°E; summit elev. 1855 m
All times are local (unless otherwise noted)
Explosions, ash plumes, ashfall, and lava flows during April-September 2023
The remote volcano of Bagana is located in central Bougainville Island, Papua New Guinea. Recorded eruptions date back to 1842 and activity has consisted of effusive activity that has built a small lava dome in the summit crater and occasional explosions that produced pyroclastic flows. The most recent eruption has been ongoing since February 2000 and has produced occasional explosions, ash plumes, and lava flows. More recently, activity has been characterized by ongoing effusive activity and ash emissions (BGVN 48:04). This report updates activity from April through September 2023 that has consisted of explosions, ash plumes, ashfall, and lava flows, using information from the Darwin Volcanic Ash Advisory Center (VAAC) and satellite data.
An explosive eruption was reported on 7 July that generated a large gas-and-ash plume to high altitudes and caused significant ashfall in local communities; the eruption plume had reached upper tropospheric (16-18 km altitude) altitudes by 2200, according to satellite images. Sulfur dioxide plumes were detected in satellite images on 8 July and indicated that the plume was likely a mixture of gas, ice, and ash. A report issued by the Autonomous Bougainville Government (ABG) (Torokina District, Education Section) on 10 July noted that significant ash began falling during 2000-2100 on 7 July and covered most areas in the Vuakovi, Gotana (9 km SW), Koromaketo, Laruma (25 km W) and Atsilima (27 km NW) villages. Pyroclastic flows also occurred, according to ground-based reports; small deposits confined to one drainage were inspected by RVO during an overflight on 17 July and were confirmed to be from the 7 July event. Ashfall continued until 10 July and covered vegetation, which destroyed bushes and gardens and contaminated rivers and streams.
RVO reported another eruption on 14 July. The Darwin VAAC stated that an explosive event started around 0830 on 15 July and produced an ash plume that rose to 16.5 km altitude by 1000 and drifted N, according to satellite images. The plume continued to drift N and remained visible through 1900, and by 2150 it had dissipated.
Ashfall likely from both the 7 and 15 July events impacted about 8,111 people in Torokina (20 km SW), including Tsito/Vuakovi, Gotana, Koromaketo, Kenaia, Longkogari, Kenbaki, Piva (13 km SW), and Atsinima, and in the Tsitovi district, according to ABG. Significant ashfall was also reported in Ruruvu (22 km N) in the Wakunai District of Central Bougainville, though the thickness of these deposits could not be confirmed. An evacuation was called for the villages in Wakunai, where heavy ashfall had contaminated water sources; the communities of Ruruvu, Togarau, Kakarapaia, Karauturi, Atao, and Kuritaturi were asked to evacuate to a disaster center at the Wakunai District Station, and communities in Torokina were asked to evacuate to the Piva District station. According to a news article, more than 7,000 people needed temporary accommodations, with about 1,000 people in evacuation shelters. Ashfall had deposited over a broad area, contaminating water supplies, affecting crops, and collapsing some roofs and houses in rural areas. Schools were temporarily shut down. Intermittent ash emissions continued through the end of July and drifted NNW, NW, and SW. Fine ashfall was reported on the coast of Torokina, and ash plumes also drifted toward Laruma and Atsilima.
A small explosive eruption occurred at 2130 on 28 July that ejected material from the crater vents, according to reports from Torokina, in addition to a lava flow that contained two lobes. A second explosion was detected at 2157. Incandescence from the lava flow was visible from Piva as it descended the W flank around 2000 on 29 July (figure 47). The Darwin VAAC reported that a strong thermal anomaly was visible in satellite images during 30-31 July and that ash emissions rose to 2.4 km altitude and drifted WSW on 30 July. A ground report from RVO described localized emissions at 0900 on 31 July.
The Darwin VAAC reported that ash plumes were identified in satellite imagery at 0800 and 1220 on 12 August and rose to 2.1 km and 3 km altitude and drifted NW and W, respectively. A news report stated that aid was sent to more than 6,300 people that were adversely affected by the eruption. Photos taken during 17-19 August showed ash emissions rising no higher than 1 km above the summit and drifting SE. A small explosion generated an ash plume during the morning of 19 August. Deposits from small pyroclastic flows were also captured in the photos. Satellite images captured lava flows and pyroclastic flow deposits. Two temporary seismic stations were installed near Bagana on 17 August at distances of 7 km WSW (Vakovi station) and 11 km SW (Kepox station). The Kepox station immediately started to record continuous, low-frequency background seismicity.
Satellite data. Little to no thermal activity was detected during April through mid-July 2023; only one anomaly was recorded during early April and one during early June, according to MIROVA (Middle InfraRed Observation of Volcanic Activity) data (figure 48). Thermal activity increased in both power and frequency during mid-July through September, although there were still some short gaps in detected activity. MODVOLC also detected increased thermal activity during August; thermal hotspots were detected a total of five times on 19, 20, and 27 August. Weak thermal anomalies were also captured in infrared satellite images on clear weather days throughout the reporting period on 7, 12, and 17 April, 27 May, 1, 6, 16, and 31 July, and 19 September (figure 48); a strong thermal anomaly was visible on 31 July. Distinct sulfur dioxide plumes that drifted generally NW were intermittently captured by the TROPOMI instrument on the Sentinel-5P satellite and sometimes exceeded two Dobson Units (DUs) (figure 49).
Geologic Background. Bagana volcano, in a remote portion of central Bougainville Island, is frequently active. This massive symmetrical cone was largely constructed by an accumulation of viscous andesitic lava flows. The entire edifice could have been constructed in about 300 years at its present rate of lava production. Eruptive activity is characterized by non-explosive effusion of viscous lava that maintains a small lava dome in the summit crater, although occasional explosive activity produces pyroclastic flows. Lava flows with tongue-shaped lobes up to 50 m thick and prominent levees descend the flanks on all sides.
Information Contacts: Rabaul Volcano Observatory (RVO), Geohazards Management Division, Department of Mineral Policy and Geohazards Management (DMPGM), PO Box 3386, Kokopo, East New Britain Province, Papua New Guinea; Darwin Volcanic Ash Advisory Centre (VAAC), Bureau of Meteorology, Northern Territory Regional Office, PO Box 40050, Casuarina, NT 0811, Australia (URL: http://www.bom.gov.au/info/vaac/); MIROVA (Middle InfraRed Observation of Volcanic Activity), a collaborative project between the Universities of Turin and Florence (Italy) supported by the Centre for Volcanic Risk of the Italian Civil Protection Department (URL: http://www.mirovaweb.it/); Hawai'i Institute of Geophysics and Planetology (HIGP) - MODVOLC Thermal Alerts System, School of Ocean and Earth Science and Technology (SOEST), Univ. of Hawai'i, 2525 Correa Road, Honolulu, HI 96822, USA (URL: http://modis.higp.hawaii.edu/); NASA Global Sulfur Dioxide Monitoring Page, Atmospheric Chemistry and Dynamics Laboratory, NASA Goddard Space Flight Center (NASA/GSFC), 8800 Greenbelt Road, Goddard, Maryland, USA (URL: https://so2.gsfc.nasa.gov/); Copernicus Browser, Copernicus Data Space Ecosystem, European Space Agency (URL: https://dataspace.copernicus.eu/browser/); Autonomous Bougainville Government, P.O Box 322, Buka, AROB, PNG (URL: https://abg.gov.pg/); Andrew Tupper (Twitter: @andrewcraigtupp); Simon Carn, Geological and Mining Engineering and Sciences, Michigan Technological University, 1400 Townsend Drive, Houghton, MI 49931, USA (URL: http://www.volcarno.com/, Twitter: @simoncarn); Radio NZ (URL: https://www.rnz.co.nz/news/pacific/494464/more-than-7-000-people-in-bougainville-need-temporary-accommodation-after-eruption); USAID, 1300 Pennsylvania Ave, NW, Washington DC 20004, USA (URL: https://www.usaid.gov/pacific-islands/press-releases/aug-08-2023-united-states-provides-immediate-emergency-assistance-support-communities-affected-mount-bagana-volcanic-eruptions).
Mayon (Philippines) — October 2023 Cite this Report
Mayon
Philippines
13.257°N, 123.685°E; summit elev. 2462 m
All times are local (unless otherwise noted)
Lava flows, pyroclastic flows, ash emissions, and seismicity during April-September 2023
Mayon is located in the Philippines and has steep upper slopes capped by a small summit crater. Historical eruptions date back to 1616 CE that have been characterized by Strombolian eruptions, lava flows, pyroclastic flows, and mudflows. Eruptions mostly originated from a central conduit. Pyroclastic flows and mudflows have commonly descended many of the approximately 40 drainages that surround the volcano. The most recent eruption occurred during June through October 2022 and consisted of lava dome growth and gas-and-steam emissions (BGVN 47:12). A new eruption was reported during late April 2023 and has included lava flows, pyroclastic density currents, ash emissions, and seismicity. This report covers activity during April through September 2023 based on daily bulletins from the Philippine Institute of Volcanology and Seismology (PHIVOLCS).
During April through September 2023, PHIVOLCS reported near-daily rockfall events, frequent volcanic earthquakes, and sulfur dioxide measurements. Gas-and-steam emissions rose 100-900 m above the crater and drifted in different directions. Nighttime crater incandescence was often visible during clear weather and was accompanied by incandescent avalanches of material. Activity notably increased during June when lava flows were reported on the S, SE, and E flanks (figure 52). The MIROVA graph (Middle InfraRed Observation of Volcanic Activity) showed strong thermal activity coincident with these lava flows, which remained active through September (figure 53). According to the MODVOLC thermal algorithm, a total of 110 thermal alerts were detected during the reporting period: 17 during June, 40 during July, 27 during August, and 26 during September. During early June, pyroclastic density currents (PDCs) started to occur more frequently.
Low activity was reported during much of April and May; gas-and-steam emissions rose 100-900 m above the crater and generally drifted in different directions. A total of 52 rockfall events and 18 volcanic earthquakes were detected during April and 147 rockfall events and 13 volcanic events during May. Sulfur dioxide flux measurements ranged between 400-576 tons per day (t/d) during April, the latter of which was measured on 29 April and between 162-343 t/d during May, the latter of which was measured on 13 May.
Activity during June increased, characterized by lava flows, pyroclastic density currents (PDCs), crater incandescence and incandescent rockfall events, gas-and-steam emissions, and continued seismicity. Weather clouds often prevented clear views of the summit, but during clear days, moderate gas-and-steam emissions rose 100-2,500 m above the crater and drifted in multiple directions. A total of 6,237 rockfall events and 288 volcanic earthquakes were detected. The rockfall events often deposited material on the S and SE flanks within 700-1,500 m of the summit crater and ash from the events drifted SW, S, SE, NE, and E. Sulfur dioxide emissions ranged between 149-1,205 t/d, the latter of which was measured on 10 June. Short-term observations from EDM and electronic tiltmeter monitoring indicated that the upper slopes were inflating since February 2023. Longer-term ground deformation parameters based on EDM, precise leveling, continuous GPS, and electronic tilt monitoring indicated that the volcano remained inflated, especially on the NW and SE flanks. At 1000 on 5 June the Volcano Alert Level (VAL) was raised to 2 (on a 0-5 scale). PHIVOLCS noted that although low-level volcanic earthquakes, ground deformation, and volcanic gas emissions indicated unrest, the steep increase in rockfall frequency may indicate increased dome activity.
A total of 151 dome-collapse PDCs occurred during 8-9 and 11-30 June, traveled 500-2,000 m, and deposited material on the S flank within 2 km of the summit crater. During 8-9 June the VAL was raised to 3. At approximately 1947 on 11 June lava flow activity was reported; two lobes traveled within 500 m from the crater and deposited material on the S (Mi-isi), SE (Bonga), and E (Basud) flanks. Weak seismicity accompanied the lava flow and slight inflation on the upper flanks. This lava flow remained active through 30 June, moving down the S and SE flank as far as 2.5 km and 1.8 km, respectively and depositing material up to 3.3 km from the crater. During 15-16 June traces of ashfall from the PDCs were reported in Sitio Buga, Nabonton, City of Ligao and Purok, and San Francisco, Municipality of Guinobatan. During 28-29 June there were two PDCs generated by the collapse of the lava flow front, which generated a light-brown ash plume 1 km high. Satellite monitors detected significant concentrations of sulfur dioxide beginning on 29 June. On 30 June PDCs primarily affected the Basud Gully on the E flank, the largest of which occurred at 1301 and lasted eight minutes, based on the seismic record. Four PDCs generated between 1800 and 2000 that lasted approximately four minutes each traveled 3-4 km on the E flank and generated an ash plume that rose 1 km above the crater and drifted N and NW. Ashfall was recorded in Tabaco City.
Similar strong activity continued during July; slow lava effusion remained active on the S and SE flanks and traveled as far as 2.8 km and 2.8 km, respectively and material was deposited as far as 4 km from the crater. There was a total of 6,983 rockfall events and 189 PDCs that affected the S, SE, and E flanks. The volcano network detected a total of 2,124 volcanic earthquakes. Continuous gas-and-steam emissions rose 200-2,000 m above the crater and drifted in multiple directions. Sulfur dioxide emissions averaged 792-4,113 t/d, the latter of which was measured on 28 July. During 2-4 July three PDCs were generated from the collapse of the lava flow and resulting light brown plumes rose 200-300 m above the crater. Continuous tremor pulses were reported beginning at 1547 on 3 July through 7 July at 1200, at 2300 on 8 July and going through 0300 on 10 July, and at 2300 on 16 July, as recorded by the seismic network. During 6-9 July there were 10 lava flow-collapse-related PDCs that generated light brown plumes 300-500 m above the crater. During 10-11 July light ashfall was reported in some areas of Mabinit, Legazpi City, Budiao and Salvacion, Daraga, and Camalig, Albay. By 18 July the lava flow advanced 600 m on the E flank as well.
During 1733 on 18 July and 0434 on 19 July PHIVOLCS reported 30 “ashing” events, which are degassing events accompanied by audible thunder-like sounds and entrained ash at the crater, which produced short, dark plumes that drifted SW. These events each lasted 20-40 seconds, and plume heights ranged from 150-300 m above the crater, as recorded by seismic, infrasound, visual, and thermal monitors. Three more ashing events occurred during 19-20 July. Short-term observations from electronic tilt and GPS monitoring indicate deflation on the E lower flanks in early July and inflation on the NW middle flanks during the third week of July. Longer-term ground deformation parameters from EDM, precise leveling, continuous GPS, and electronic tilt monitoring indicated that the volcano was still generally inflated relative to baseline levels. A short-lived lava pulse lasted 28 seconds at 1956 on 21 July, which was accompanied by seismic and infrasound signals. By 22 July, the only lava flow that remained active was on the SE flank, and continued to extend 3.4 km, while those on the S and E flanks weakened markedly. One ashing event was detected during 30-31 July, whereas there were 57 detected during 31 July-1 August; according to PHIVOLCS beginning at approximately 1800 on 31 July eruptive activity was dominated by phases of intermittent ashing, as well as increased in the apparent rates of lava effusion from the summit crater. The ashing phases consisted of discrete events recorded as low-frequency volcanic earthquakes (LFVQ) typically 30 seconds in duration, based on seismic and infrasound signals. Gray ash plume rose 100 m above the crater and generally drifted NE. Shortly after these ashing events began, new lava began to effuse rapidly from the crater, feeding the established flowed on the SE, E, and E flanks and generating frequent rockfall events.
Intensified unrest persisted during August. There was a total of 4,141 rockfall events, 2,881 volcanic earthquakes, which included volcanic tremor events, 32 ashing events, and 101 PDCs detected throughout the month. On clear weather days, gas-and-steam emissions rose 300-1,500 m above the crater and drifted in different directions (figure 54). Sulfur dioxide emissions averaged 735-4,756 t/d, the higher value of which was measured on 16 August. During 1-2 August the rate of lava effusion decreased, but continued to feed the flows on the SE, S, and E flanks, maintaining their advances to 3.4 km, 2.8 km, and 1.1 km from the crater, respectively (figure 55). Rockfall and PDCs generated by collapses at the lava flow margins and from the summit dome deposited material within 4 km of the crater. During 3-4 August there were 10 tremor events detected that lasted 1-4 minutes. Short-lived lava pulse lasted 35 seconds and was accompanied by seismic and infrasound signals at 0442 on 6 August. Seven collapses were recorded at the front of the lava flow during 12-14 August.
During September, similar activity of slow lava effusion, PDCs, gas-and-steam emissions, and seismicity continued. There was a total of 4,452 rockfall events, 329 volcanic earthquakes, which included volcanic tremor events, two ashing events, and 85 PDCs recorded throughout the month. On clear weather days, gas-and-steam emissions rose 100-1,500 m above the crater and drifted in multiple directions. Sulfur dioxide emissions averaged 609-2,252 t/d, the higher average of which was measured on 6 September. Slow lava effusion continued advancing on the SE, S, and E flanks, maintaining lengths of 3.4 km, 2.8 km, and 1.1 km, respectively. Rockfall and PDC events generated by collapses along the lava flow margins and at the summit dome deposited material within 4 km of the crater.
Geologic Background. Symmetrical Mayon, which rises above the Albay Gulf NW of Legazpi City, is the most active volcano of the Philippines. The steep upper slopes are capped by a small summit crater. Recorded eruptions since 1616 CE range from Strombolian to basaltic Plinian, with cyclical activity beginning with basaltic eruptions, followed by longer periods of andesitic lava flows. Eruptions occur predominately from the central conduit and have also produced lava flows that travel far down the flanks. Pyroclastic density currents and mudflows have commonly swept down many of the approximately 40 ravines that radiate from the summit and have often damaged populated lowland areas. A violent eruption in 1814 killed more than 1,200 people and devastated several towns.
Information Contacts: Philippine Institute of Volcanology and Seismology (PHIVOLCS), Department of Science and Technology, University of the Philippines Campus, Diliman, Quezon City, Philippines (URL: http://www.phivolcs.dost.gov.ph/); MIROVA (Middle InfraRed Observation of Volcanic Activity), a collaborative project between the Universities of Turin and Florence (Italy) supported by the Centre for Volcanic Risk of the Italian Civil Protection Department (URL: http://www.mirovaweb.it/); Hawai'i Institute of Geophysics and Planetology (HIGP) - MODVOLC Thermal Alerts System, School of Ocean and Earth Science and Technology (SOEST), Univ. of Hawai'i, 2525 Correa Road, Honolulu, HI 96822, USA (URL: http://modis.higp.hawaii.edu/); Copernicus Browser, Copernicus Data Space Ecosystem, European Space Agency (URL: https://dataspace.copernicus.eu/browser/); William Rogers, Legazpi City, Albay Province, Philippines.
Nishinoshima (Japan) — October 2023 Cite this Report
Nishinoshima
Japan
27.247°N, 140.874°E; summit elev. 100 m
All times are local (unless otherwise noted)
Eruption plumes and gas-and-steam plumes during May-August 2023
Nishinoshima, located about 1,000 km S of Tokyo, is a small island in the Ogasawara Arc in Japan. The island is the summit of a massive submarine volcano that has prominent submarine peaks to the S, W, and NE. Eruptions date back to 1973 and the current eruption period began in October 2022. Recent activity has consisted of small ash plumes and fumarolic activity (BGVN 48:07). This report covers activity during May through August 2023, using information from monthly reports of the Japan Meteorological Agency (JMA) monthly reports and satellite data.
Activity during May through June was relatively low. The Japan Coast Guard (JCG) did overflights on 14 and 22 June and reported white gas-and-steam emissions rising 600 m and 1,200 m from the central crater of the pyroclastic cone, respectively (figure 125). In addition, multiple white gas-and-steam emissions rose from the inner rim of the W side of the crater and from the SE flank of the pyroclastic cone. Discolored brown-to-green water was observed around almost the entire perimeter of the island; on 22 June light green discolored water was observed off the S coast of the island.
Observations from the Himawari meteorological satellite confirmed an eruption on 9 and 10 July. An eruption plume rose 1.6 km above the crater and drifted N around 1300 on 9 July. Satellite images acquired at 1420 and 2020 on 9 July and at 0220 on 10 July showed continuing emissions that rose 1.3-1.6 km above the crater and drifted NE and N. The Tokyo VAAC reported that an ash plume seen by a pilot and identified in a satellite image at 0630 on 21 July rose to 3 km altitude and drifted S.
Aerial observations conducted by JCG on 8 August showed a white-and-gray plume rising from the central crater of the pyroclastic cone, and multiple white gas-and-steam emissions were rising from the inner edge of the western crater and along the NW-SE flanks of the island (figure 126). Brown-to-green discolored water was also noted around the perimeter of the island.
Intermittent low-to-moderate power thermal anomalies were recorded in the MIROVA graph (Middle InfraRed Observation of Volcanic Activity), showing an increase in both frequency and power beginning in July (figure 127). This increase in activity coincides with eruptive activity on 9 and 10 July, characterized by eruption plumes. According to the MODVOLC thermal alert algorithm, one thermal hotspot was recorded on 20 July. Weak thermal anomalies were also detected in infrared satellite imagery, accompanied by strong gas-and-steam plumes (figure 128).
Geologic Background. The small island of Nishinoshima was enlarged when several new islands coalesced during an eruption in 1973-74. Multiple eruptions that began in 2013 completely covered the previous exposed surface and continued to enlarge the island. The island is the summit of a massive submarine volcano that has prominent peaks to the S, W, and NE. The summit of the southern cone rises to within 214 m of the ocean surface 9 km SSE.
Information Contacts: Japan Meteorological Agency (JMA), 1-3-4 Otemachi, Chiyoda-ku, Tokyo 100-8122, Japan (URL: http://www.jma.go.jp/jma/indexe.html); Tokyo Volcanic Ash Advisory Center (VAAC), 1-3-4 Otemachi, Chiyoda-ku, Tokyo 100-8122, Japan (URL: http://ds.data.jma.go.jp/svd/vaac/data/); MIROVA (Middle InfraRed Observation of Volcanic Activity), a collaborative project between the Universities of Turin and Florence (Italy) supported by the Centre for Volcanic Risk of the Italian Civil Protection Department (URL: http://www.mirovaweb.it/); Copernicus Browser, Copernicus Data Space Ecosystem, European Space Agency (URL: https://dataspace.copernicus.eu/browser/).
Krakatau (Indonesia) — October 2023 Cite this Report
Krakatau
Indonesia
6.1009°S, 105.4233°E; summit elev. 285 m
All times are local (unless otherwise noted)
White gas-and-steam plumes and occasional ash plumes during May-August 2023
Krakatau is located in the Sunda Strait between Java and Sumatra, Indonesia. Caldera collapse during the catastrophic 1883 eruption destroyed Danan and Perbuwatan cones and left only a remnant of Rakata. The post-collapse cone of Anak Krakatau (Child of Krakatau) was constructed within the 1883 caldera at a point between the former Danan and Perbuwatan cones; it has been the site of frequent eruptions since 1927. The current eruption period began in May 2021 and has recently consisted of Strombolian eruptions and ash plumes (BGVN 48:07). This report describes lower levels of activity consisting of ash and white gas-and-steam plumes during May through August 2023, based on information provided by the Indonesian Center for Volcanology and Geological Hazard Mitigation, referred to as Pusat Vulkanologi dan Mitigasi Bencana Geologi (PVMBG), MAGMA Indonesia, and satellite data.
Activity was relatively low during May and June. Daily white gas-and-steam emissions rose 25-200 m above the crater and drifted in different directions. Five ash plumes were detected at 0519 on 10 May, 1241 on 11 May, 0920 on 12 May, 2320 on 12 May, and at 0710 on 13 May, and rose 1-2.5 km above the crater and drifted SW. A webcam image taken on 12 May showed ejection of incandescent material above the vent. A total of nine ash plumes were detected during 6-11 June: at 1434 and 00220 on 6 and 7 June the ash plumes rose 500 m above the crater and drifted NW, at 1537 on 8 June the ash plume rose 1 km above the crater and drifted SW, at 0746 and at 0846 on 9 June the ash plumes rose 800 m and 3 km above the crater and drifted SW, respectively, at 0423, 1431, and 1750 on 10 June the ash plumes rose 2 km, 1.5 km, and 3.5 km above the crater and drifted NW, respectively, and at 0030 on 11 June an ash plume rose 2 km above the crater and drifted NW. Webcam images taken on 10 and 11 June at 0455 and 0102, respectively, showed incandescent material ejected above the vent. On 19 June an ash plume at 0822 rose 1.5 km above the crater and drifted SE.
Similar low activity of white gas-and-steam emissions and few ash plumes were reported during July and August. Daily white gas-and-steam emissions rose 25-300 m above the crater and drifted in multiple directions. Three ash plumes were reported at 0843, 0851, and 0852 on 20 July that rose 500-2,000 m above the crater and drifted NW.
The MIROVA (Middle InfraRed Observation of Volcanic Activity) graph of MODIS thermal anomaly data showed intermittent low-to-moderate power thermal anomalies during May through August 2023 (figure 140). Although activity was often obscured by weather clouds, a thermal anomaly was visible in an infrared satellite image of the crater on 12 May, accompanied by an eruption plume that drifted SW (figure 141).
Geologic Background. The renowned Krakatau (frequently mis-named as Krakatoa) volcano lies in the Sunda Strait between Java and Sumatra. Collapse of an older edifice, perhaps in 416 or 535 CE, formed a 7-km-wide caldera. Remnants of that volcano are preserved in Verlaten and Lang Islands; subsequently the Rakata, Danan, and Perbuwatan cones were formed, coalescing to create the pre-1883 Krakatau Island. Caldera collapse during the catastrophic 1883 eruption destroyed Danan and Perbuwatan, and left only a remnant of Rakata. This eruption caused more than 36,000 fatalities, most as a result of tsunamis that swept the adjacent coastlines of Sumatra and Java. Pyroclastic surges traveled 40 km across the Sunda Strait and reached the Sumatra coast. After a quiescence of less than a half century, the post-collapse cone of Anak Krakatau (Child of Krakatau) was constructed within the 1883 caldera at a point between the former Danan and Perbuwatan cones. Anak Krakatau has been the site of frequent eruptions since 1927.
Information Contacts: Pusat Vulkanologi dan Mitigasi Bencana Geologi (PVMBG, also known as Indonesian Center for Volcanology and Geological Hazard Mitigation, CVGHM), Jalan Diponegoro 57, Bandung 40122, Indonesia (URL: http://www.vsi.esdm.go.id/); MAGMA Indonesia, Kementerian Energi dan Sumber Daya Mineral (URL: https://magma.esdm.go.id/v1); MIROVA (Middle InfraRed Observation of Volcanic Activity), a collaborative project between the Universities of Turin and Florence (Italy) supported by the Centre for Volcanic Risk of the Italian Civil Protection Department (URL: http://www.mirovaweb.it/); Copernicus Browser, Copernicus Data Space Ecosystem, European Space Agency (URL: https://dataspace.copernicus.eu/browser/).
Merapi (Indonesia) — October 2023 Cite this Report
Merapi
Indonesia
7.54°S, 110.446°E; summit elev. 2910 m
All times are local (unless otherwise noted)
Frequent incandescent avalanches during April-September 2023
Merapi, located just north of the major city of Yogyakarta in central Java, Indonesia, has had activity within the last 20 years characterized by pyroclastic flows and lahars accompanying growth and collapse of the steep-sided active summit lava dome. The current eruption period began in late December 2020 and has more recently consisted of ash plumes, intermittent incandescent avalanches of material, and pyroclastic flows (BGVN 48:04). This report covers activity during April through September 2023, based on information from Balai Penyelidikan dan Pengembangan Teknologi Kebencanaan Geologi (BPPTKG), the Center for Research and Development of Geological Disaster Technology, a branch of PVMBG which specifically monitors Merapi. Additional information comes from the Pusat Vulkanologi dan Mitigasi Bencana Geologi (PVMBG, also known as Indonesian Center for Volcanology and Geological Hazard Mitigation, CVGHM), MAGMA Indonesia, the Darwin Volcanic Ash Advisory Centre (VAAC), and various satellite data.
Activity during April through September 2023 primarily consisted of incandescent avalanches of material that mainly affected the SW and W flanks and traveled as far as 2.3 km from the summit (table 25) and white gas-and-steam emissions that rose 10-1,000 m above the crater.
Table 25. Monthly summary of avalanches and avalanche distances recorded at Merapi during April through September 2023. The number of reported avalanches does not include instances where possible avalanches were heard but could not be visually confirmed as a result of inclement weather. Data courtesy of BPPTKG (April-September 2023 daily reports).
| Month |
Average number of avalanches per day |
Distance avalanches traveled (m) |
| Apr 2023 |
19 |
1,200-2,000 |
| May 2023 |
22 |
500-2,000 |
| Jun 2023 |
18 |
1,200-2,000 |
| Jul 2023 |
30 |
300-2,000 |
| Aug 2023 |
25 |
400-2,300 |
| Sep 2023 |
23 |
600-2,000 |
BPPTKG reported that during April and May white gas-and-steam emissions rose 10-750 m above the crater, incandescent avalanches descended 500-2,000 m on the SW and W flanks (figure 135). Cloudy weather often prevented clear views of the summit, and sometimes avalanches could not be confirmed. According to a webcam image, a pyroclastic flow was visible on 17 April at 0531. During the week of 28 April and 4 May a pyroclastic flow was reported on the SW flank, traveling up to 2.5 km. According to a drone overflight taken on 17 May the SW lava dome volume was an estimated 2,372,800 cubic meters and the dome in the main crater was an estimated 2,337,300 cubic meters.
During June and July similar activity persisted with white gas-and-steam emissions rising 10-350 m above the crater and frequent incandescent avalanches that traveled 300-2,000 m down the SW, W, and S flanks (figure 136). Based on an analysis of aerial photos taken on 24 June the volume of the SW lava dome was approximately 2.5 million cubic meters. A pyroclastic flow was observed on 5 July that traveled 2.7 km on the SW flank. According to the Darwin VAAC multiple minor ash plumes were identified in satellite images on 19 July that rose to 3.7 km altitude and drifted S and SW. During 22, 25, and 26 July a total of 17 avalanches descended as far as 1.8 km on the S flank.
Frequent white gas-and-steam emissions continued during August and September, rising 10-450 m above the crater. Incandescent avalanches mainly affected the SW and W flanks and traveled 400-2,300 m from the vent (figure 137). An aerial survey conducted on 10 August was analyzed and reported that estimates of the SW dome volume was 2,764,300 cubic meters and the dome in the main crater was 2,369,800 cubic meters.
Frequent and moderate-power thermal activity continued throughout the reporting period, according to a MIROVA (Middle InfraRed Observation of Volcanic Activity) analysis of MODIS satellite data (figure 138). There was an increase in the number of detected anomalies during mid-May. The MODVOLC thermal algorithm recorded a total of 47 thermal hotspots: six during April, nine during May, eight during June, 15 during July, four during August, and five during September. Some of this activity was captured in infrared satellite imagery on clear weather days, sometimes accompanied by incandescent material on the SW flank (figure 139).
Geologic Background. Merapi, one of Indonesia's most active volcanoes, lies in one of the world's most densely populated areas and dominates the landscape immediately north of the major city of Yogyakarta. It is the youngest and southernmost of a volcanic chain extending NNW to Ungaran volcano. Growth of Old Merapi during the Pleistocene ended with major edifice collapse perhaps about 2,000 years ago, leaving a large arcuate scarp cutting the eroded older Batulawang volcano. Subsequent growth of the steep-sided Young Merapi edifice, its upper part unvegetated due to frequent activity, began SW of the earlier collapse scarp. Pyroclastic flows and lahars accompanying growth and collapse of the steep-sided active summit lava dome have devastated cultivated lands on the western-to-southern flanks and caused many fatalities.
Information Contacts: Balai Penyelidikan dan Pengembangan Teknologi Kebencanaan Geologi (BPPTKG), Center for Research and Development of Geological Disaster Technology (URL: http://merapi.bgl.esdm.go.id/, Twitter: @BPPTKG); MAGMA Indonesia, Kementerian Energi dan Sumber Daya Mineral (URL: https://magma.esdm.go.id/v1); Pusat Vulkanologi dan Mitigasi Bencana Geologi (PVMBG, also known as Indonesian Center for Volcanology and Geological Hazard Mitigation, CVGHM), Jalan Diponegoro 57, Bandung 40122, Indonesia (URL: http://www.vsi.esdm.go.id/); Darwin Volcanic Ash Advisory Centre (VAAC), Bureau of Meteorology, Northern Territory Regional Office, PO Box 40050, Casuarina, NT 0811, Australia (URL: http://www.bom.gov.au/info/vaac/); MIROVA (Middle InfraRed Observation of Volcanic Activity), a collaborative project between the Universities of Turin and Florence (Italy) supported by the Centre for Volcanic Risk of the Italian Civil Protection Department (URL: http://www.mirovaweb.it/); Hawai'i Institute of Geophysics and Planetology (HIGP) - MODVOLC Thermal Alerts System, School of Ocean and Earth Science and Technology (SOEST), Univ. of Hawai'i, 2525 Correa Road, Honolulu, HI 96822, USA (URL: http://modis.higp.hawaii.edu/); Copernicus Browser, Copernicus Data Space Ecosystem, European Space Agency (URL: https://dataspace.copernicus.eu/browser/); Øystein Lund Andersen (URL: https://www.oysteinlundandersen.com/, https://twitter.com/oysteinvolcano).
Villarrica (Chile) — October 2023 Cite this Report
Villarrica
Chile
39.42°S, 71.93°W; summit elev. 2847 m
All times are local (unless otherwise noted)
Strombolian activity, gas-and-ash emissions, and crater incandescence during April-September 2023
Villarrica, in central Chile, consists of a 2-km-wide caldera that formed about 3,500 years ago and is located at the base of the presently active cone at the NW margin of a 6-km-wide caldera. Historical eruptions eruptions date back to 1558 and have been characterized by mild-to-moderate explosive activity with occasional lava effusions. The current eruption period began in December 2014 and has recently consisted of nighttime crater incandescence, ash emissions, and seismicity (BGVN 48:04). This report covers activity during April through September 2023 and describes occasional Strombolian activity, gas-and-ash emissions, and nighttime crater incandescence. Information for this report primarily comes from the Southern Andes Volcano Observatory (Observatorio Volcanológico de Los Andes del Sur, OVDAS), part of Chile's National Service of Geology and Mining (Servicio Nacional de Geología y Minería, SERNAGEOMIN) and satellite data.
Seismicity during April consisted of long period (LP) events and tremor (TRE); a total of 9,413 LP-type events and 759 TR-type events were detected throughout the month. Nighttime crater incandescence persisted and was visible in the degassing column. Sulfur dioxide data was obtained using Differential Absorption Optical Spectroscopy Equipment (DOAS) that showed an average value of 1,450 ± 198 tons per day (t/d) during 1-15 April and 1,129 ± 201 t/d during 16-30 April, with a maximum daily value of 2,784 t/d on 9 April. Gas-and-steam emissions of variable intensities rose above the active crater as high as 1.3 km above the crater on 13 April. Strombolian explosions were not observed and there was a slight decrease in the lava lake level.
There were 14,123 LP-type events and 727 TR-type events detected during May. According to sulfur dioxide measurements taken with DOAS equipment, the active crater emitted an average value of 1,826 ± 482 t/d during 1-15 May and 912 ± 41 t/d during 16-30 May, with a daily maximum value of 5,155 t/d on 13 May. Surveillance cameras showed continuous white gas-and-steam emissions that rose as high as 430 m above the crater on 27 May. Nighttime incandescence illuminated the gas column less than 300 m above the crater rim was and no pyroclastic emissions were reported. A landslide was identified on 13 May on the E flank of the volcano 50 m from the crater rim and extending 300 m away; SERNAGEOMIN noted that this event may have occurred on 12 May. During the morning of 27 and 28 May minor Strombolian explosions characterized by incandescent ejecta were recorded at the crater rim; the last reported Strombolian explosions had occurred at the end of March.
Seismic activity during June consisted of five volcano-tectonic (VT)-type events, 21,606 LP-type events, and 2,085 TR-type events. The average value of sulfur dioxide flux obtained by DOAS equipment was 1,420 ± 217 t/d during 1-15 June and 2,562 ± 804 t/d, with a maximum daily value of 4,810 t/d on 17 June. White gas-and-steam emissions rose less than 480 m above the crater; frequent nighttime crater incandescence was reflected in the degassing plume. On 12 June an emission rose 100 m above the crater and drifted NNW. On 15 June one or several emissions resulted in ashfall to the NE as far as 5.5 km from the crater, based on a Skysat satellite image. Several Strombolian explosions occurred within the crater; activity on 15 June was higher energy and ejected blocks 200-300 m on the NE slope. Surveillance cameras showed white gas-and-steam emissions rising 480 m above the crater on 16 June. On 19 and 24 June low-intensity Strombolian activity was observed, ejecting material as far as 200 m from the center of the crater to the E.
During July, seismicity included 29,319 LP-type events, 3,736 TR-type events, and two VT-type events. DOAS equipment recorded two days of sulfur dioxide emissions of 4,220 t/d and 1,009 t/d on 1 and 13 July, respectively. Constant nighttime incandescence was also recorded and was particularly noticeable when accompanied by eruptive columns on 12 and 16 July. Minor explosive events were detected in the crater. According to Skysat satellite images taken on 12, 13, and 16 July, ashfall deposits were identified 155 m S of the crater. According to POVI, incandescence was visible from two vents on the crater floor around 0336 on 12 July. Gas-and-ash emissions rose as high as 1.2 km above the crater on 13 July and drifted E and NW. A series of gas-and-steam pulses containing some ash deposited material on the upper E flank around 1551 on 13 July. During 16-31 July, average sulfur dioxide emissions of 1,679 ± 406 t/d were recorded, with a maximum daily value of 2,343 t/d on 28 July. Fine ash emissions were also reported on 16, 17, and 23 July.
Seismicity persisted during August, characterized by 27,011 LP-type events, 3,323 TR-type events, and three VT-type events. The average value of sulfur dioxide measurements taken during 1-15 August was 1,642 ± 270 t/d and 2,207 ± 4,549 t/d during 16-31 August, with a maximum daily value of 3,294 t/d on 27 August. Nighttime crater incandescence remained visible in degassing columns. White gas-and-steam emissions rose 480 m above the crater on 6 August. According to a Skysat satellite image from 6 August, ash accumulation was observed proximal to the crater and was mainly distributed toward the E slope. White gas-and-steam emissions rose 320 m above the crater on 26 August. Nighttime incandescence and Strombolian activity that generated ash emissions were reported on 27 August.
Seismicity during September was characterized by five VT-type events, 12,057 LP-type events, and 2,058 TR-type events. Nighttime incandescence persisted. On 2 September an ash emission rose 180 m above the crater and drifted SE at 1643 (figure 125) and a white gas-and-steam plume rose 320 m above the crater. According to the Buenos Aires VAAC, periods of continuous gas-and-ash emissions were visible in webcam images from 1830 on 2 September to 0110 on 3 September. Strombolian activity was observed on 2 September and during the early morning of 3 September, the latter event of which generated an ash emission that rose 60 m above the crater and drifted 100 m from the center of the crater to the NE and SW. Ashfall was reported to the SE and S as far as 750 m from the crater. The lava lake was active during 3-4 September and lava fountaining was visible for the first time since 26 March 2023, according to POVI. Fountains captured in webcam images at 2133 on 3 September and at 0054 on 4 September rose as high as 60 m above the crater rim and ejected material onto the upper W flank. Sulfur dioxide flux of 1,730 t/d and 1,281 t/d was measured on 3 and 4 September, respectively, according to data obtained by DOAS equipment.
Strong Strombolian activity and larger gas-and-ash plumes were reported during 18-20 September. On 18 September activity was also associated with energetic LP-type events and notable sulfur dioxide fluxes (as high as 4,277 t/d). On 19 September Strombolian activity and incandescence were observed. On 20 September at 0914 ash emissions rose 50 m above the crater and drifted SSE, accompanied by Strombolian activity that ejected material less than 100 m SSE, causing fall deposits on that respective flank. SERNAGEOMIN reported that a Planet Scope satellite image taken on 20 September showed the lava lake in the crater, measuring 32 m x 35 m and an area of 0.001 km2. Several ash emissions were recorded at 0841, 0910, 1251, 1306, 1312, 1315, and 1324 on 23 September and rose less than 150 m above the crater. The sulfur dioxide flux value was 698 t/d on 23 September and 1,097 t/d on 24 September. On 24 September the Volcanic Alert Level (VAL) was raised to Orange (the third level on a four-color scale). SENAPRED maintained the Alert Level at Yellow (the middle level on a three-color scale) for the communities of Villarrica, Pucón (16 km N), Curarrehue, and Panguipulli.
During 24-25 September there was an increase in seismic energy (observed at TR-events) and acoustic signals, characterized by 1 VT-type event, 213 LP-type events, and 124 TR-type events. Mainly white gas-and-steam emissions, in addition to occasional fine ash emissions were recorded. During the early morning of 25 September Strombolian explosions were reported and ejected material 250 m in all directions, though dominantly toward the NW. On 25 September the average value of sulfur dioxide flux was 760 t/d. Seismicity during 25-30 September consisted of five VT-type events, 1,937 LP-type events, and 456 TR-type events.
During 25-29 September moderate Strombolian activity was observed and ejected material as far as the crater rim. In addition, ash pulses lasting roughly 50 minutes were observed around 0700 and dispersed ENE. During 26-27 September a TR episode lasted 6.5 hours and was accompanied by discrete acoustic signals. Satellite images from 26 September showed a spatter cone on the crater floor with one vent that measured 10 x 14 m and a smaller vent about 35 m NE of the cone. SERNAGEOMIN reported an abundant number of bomb-sized blocks up to 150 m from the crater, as well as impact marks on the snow, which indicated explosive activity. A low-altitude ash emission was observed drifting NW around 1140 on 28 September, based on webcam images. Between 0620 and 0850 on 29 September an ash emission rose 60 m above the crater and drifted NW. During an overflight taken around 1000 on 29 September scientists observed molten material in the vent, a large accumulation of pyroclasts inside the crater, and energetic degassing, some of which contained a small amount of ash. Block-sized pyroclasts were deposited on the internal walls and near the crater, and a distal ash deposit was also visible. The average sulfur dioxide flux measured on 28 September was 344 t/d. Satellite images taken on 29 September ashfall was deposited roughly 3 km WNW from the crater and nighttime crater incandescence remained visible. The average sulfur dioxide flux value from 29 September was 199 t/d. On 30 September at 0740 a pulsating ash emission rose 1.1 km above the crater and drifted NNW (figure 126). Deposits on the S flank extended as far as 4.5 km from the crater rim, based on satellite images from 30 September.
Infrared MODIS satellite data processed by MIROVA (Middle InfraRed Observation of Volcanic Activity) showed intermittent thermal activity during April through September, with slightly stronger activity detected during late September (figure 127). Small clusters of thermal activity were detected during mid-June, early July, early August, and late September. According to the MODVOLC thermal alert system, a total of four thermal hotspots were detected on 7 July and 3 and 23 September. This activity was also intermittently captured in infrared satellite imagery on clear weather days (figure 128).
Geologic Background. The glacier-covered Villarrica stratovolcano, in the northern Lakes District of central Chile, is ~15 km south of the city of Pucon. A 2-km-wide caldera that formed about 3,500 years ago is located at the base of the presently active, dominantly basaltic to basaltic andesite cone at the NW margin of a 6-km-wide Pleistocene caldera. More than 30 scoria cones and fissure vents are present on the flanks. Plinian eruptions and pyroclastic flows that have extended up to 20 km from the volcano were produced during the Holocene. Lava flows up to 18 km long have issued from summit and flank vents. Eruptions documented since 1558 CE have consisted largely of mild-to-moderate explosive activity with occasional lava effusion. Glaciers cover 40 km2 of the volcano, and lahars have damaged towns on its flanks.
Information Contacts: Servicio Nacional de Geología y Minería (SERNAGEOMIN), Observatorio Volcanológico de Los Andes del Sur (OVDAS), Avda Sta María No. 0104, Santiago, Chile (URL: http://www.sernageomin.cl/); Proyecto Observación Villarrica Internet (POVI) (URL: http://www.povi.cl/); Sistema y Servicio Nacional de Prevención y Repuesta Ante Desastres (SENAPRED), Av. Beauchef 1671, Santiago, Chile (URL: https://web.senapred.cl/); Buenos Aires Volcanic Ash Advisory Center (VAAC), Servicio Meteorológico Nacional-Fuerza Aérea Argentina, 25 de mayo 658, Buenos Aires, Argentina (URL: http://www.smn.gov.ar/vaac/buenosaires/inicio.php); MIROVA (Middle InfraRed Observation of Volcanic Activity), a collaborative project between the Universities of Turin and Florence (Italy) supported by the Centre for Volcanic Risk of the Italian Civil Protection Department (URL: http://www.mirovaweb.it/); Hawai'i Institute of Geophysics and Planetology (HIGP) - MODVOLC Thermal Alerts System, School of Ocean and Earth Science and Technology (SOEST), Univ. of Hawai'i, 2525 Correa Road, Honolulu, HI 96822, USA (URL: http://modis.higp.hawaii.edu/); Copernicus Browser, Copernicus Data Space Ecosystem, European Space Agency (URL: https://dataspace.copernicus.eu/browser/).
Ebeko
Russia
50.686°N, 156.014°E; summit elev. 1103 m
All times are local (unless otherwise noted)
Moderate explosive activity with ash plumes continued during June-November 2023
Ebeko, located on the N end of Paramushir Island in Russia’s Kuril Islands just S of the Kamchatka Peninsula, consists of three summit craters along a SSW-NNE line at the northern end of a complex of five volcanic cones. Observed eruptions date back to the late 18th century and have been characterized as small-to-moderate explosions from the summit crater, accompanied by intense fumarolic activity. The current eruptive period began in June 2022, consisting of frequent explosions, ash plumes, and thermal activity (BGVN 47:10, 48:06). This report covers similar activity during June-November 2023, based on information from the Kamchatka Volcanic Eruptions Response Team (KVERT) and satellite data.
Moderate explosive activity continued during June-November 2023 (figures 50 and 51). According to visual data from Severo-Kurilsk, explosions sent ash 2-3.5 km above the summit (3-4.5 km altitude) during most days during June through mid-September. Activity after mid-September was slightly weaker, with ash usually reaching less than 2 km above the summit. According to KVERT the volcano in October and November was, with a few exceptions, either quiet or obscured by clouds that prevented satellite observations. KVERT issued Volcano Observatory Notices for Aviation (VONA) on 8 and 12 June, 13 and 22 July, 3 and 21 August, and 31 October warning of potential aviation hazards from ash plumes drifting 3-15 km from the volcano. Based on satellite data, KVERT reported a persistent thermal anomaly whenever weather clouds permitted viewing.
Geologic Background. The flat-topped summit of the central cone of Ebeko volcano, one of the most active in the Kuril Islands, occupies the northern end of Paramushir Island. Three summit craters located along a SSW-NNE line form Ebeko volcano proper, at the northern end of a complex of five volcanic cones. Blocky lava flows extend west from Ebeko and SE from the neighboring Nezametnyi cone. The eastern part of the southern crater contains strong solfataras and a large boiling spring. The central crater is filled by a lake about 20 m deep whose shores are lined with steaming solfataras; the northern crater lies across a narrow, low barrier from the central crater and contains a small, cold crescentic lake. Historical activity, recorded since the late-18th century, has been restricted to small-to-moderate explosive eruptions from the summit craters. Intense fumarolic activity occurs in the summit craters, on the outer flanks of the cone, and in lateral explosion craters.
Information Contacts: Kamchatka Volcanic Eruptions Response Team (KVERT), Far Eastern Branch, Russian Academy of Sciences, 9 Piip Blvd., Petropavlovsk-Kamchatsky, 683006, Russia (URL: http://www.kscnet.ru/ivs/kvert/).
Search Bulletin Archive by Publication Date
Select a month and year from the drop-downs and click "Show Issue" to have that issue displayed in this tab.
The default month and year is the latest issue available.
Scientific Event Alert Network Bulletin - Volume 08, Number 07 (July 1983)
Managing Editor: Lindsay McClelland
Aira (Japan)
Explosions, tephra emission, and seismicity
Atmospheric Effects (1980-1989) (Unknown)
El Chichón aerosols weaken gradually; new layer sometimes present near tropopause
Colo (Indonesia)
Pyroclastic flows devastate island; clouds to stratosphere; evacuations prevent large death toll
Etna (Italy)
Eruption ends after four months of lava extrusion
False Reports (Unknown)
Papua New Guinea: Earthquake swarm; sounds and glow
Fournaise, Piton de la (France)
12-hour earthquake swarm
Gamalama (Indonesia)
Ash ejection; several thousand evacuated
Kilauea (United States)
Lava flows move ENE along east rift for 4 days
Kusatsu-Shiranesan (Japan)
Small plume emitted; volcanic tremor; A-type events
Langila (Papua New Guinea)
Explosions; ashfalls; strong harmonic tremor
Long Valley (United States)
New collapse pits and fumarole
Manam (Papua New Guinea)
Moderate ash, vapor emissions; B-type events continue
Sangay (Ecuador)
Eruption continues with ash emission every 10 minutes
St. Helens (United States)
Lava dome growth continues; plumes emitted
Ulawun (Papua New Guinea)
Strong seismicity but no change in plume
Veniaminof (United States)
Lava flow melts large pit in caldera ice, then eruption weakens
Aira
Japan
31.5772°N, 130.6589°E; summit elev. 1117 m
All times are local (unless otherwise noted)
Explosions, tephra emission, and seismicity
In June, 33 explosions were recorded from the summit crater of Minami-dake and 31 in July. Although the explosion rate from June to mid-July was above its usual level, rarely was a large amount of ejecta observed in any explosion. Only about 1/8 of the explosions ejected much lapilli, or produced eruption columns that rose to more than 2 km above the summit.
Activity intensified slightly 19-24 July. Most explosions produced large amounts of ejecta and ash frequently fell on the cities of Miyakonojo (40 km ENE) and Miyazaki (80 km NE). The end of explosive activity on 25 July was followed by continuous ash ejection. Bad weather limited visual observation, but volcanic tremor that was assumed to be accompanied by ash ejection was recorded until 29 July. The number of large B-type earthquakes suddenly increased at about 1800 on 29 July and remained high until 0300 the next day. Earthquake size then returned to its usual level, but the recorded events were still more numerous than usual.
Explosive activity resumed on 31 July, accompanied by a decrease in seismic activity. An explosion at 1445 on 2 August ejected large amounts of lapilli, which fell near Kyoto University's Sakura-jima Volcano Observatory (about 1.7 km SW of the summit) and the site of sand trap wall construction, where 1 worker [originally reported as 4] was slightly burned. [Blocks] made many craters [near the University Observatory and the construction site]; the largest was 1.5 m in diameter and 1 m deep [produced by a block 50 cm in diameter].
Geologic Background. The Aira caldera in the northern half of Kagoshima Bay contains the post-caldera Sakurajima volcano, one of Japan's most active. Eruption of the voluminous Ito pyroclastic flow accompanied formation of the 17 x 23 km caldera about 22,000 years ago. The smaller Wakamiko caldera was formed during the early Holocene in the NE corner of the caldera, along with several post-caldera cones. The construction of Sakurajima began about 13,000 years ago on the southern rim and built an island that was joined to the Osumi Peninsula during the major explosive and effusive eruption of 1914. Activity at the Kitadake summit cone ended about 4,850 years ago, after which eruptions took place at Minamidake. Frequent eruptions since the 8th century have deposited ash on the city of Kagoshima, located across Kagoshima Bay only 8 km from the summit. The largest recorded eruption took place during 1471-76.
Information Contacts: JMA, Tokyo.
Atmospheric Effects (1980-1989) (Unknown) — July 1983 Cite this Report
Atmospheric Effects (1980-1989)
Unknown
Unknown, Unknown; summit elev. m
All times are local (unless otherwise noted)
El Chichón aerosols weaken gradually; new layer sometimes present near tropopause
Lidar data showed a continuing gradual decline in backscattering ratios from El Chichón aerosols. However, lidar in Hampton, Virginia and Fukuoka, Japan detected layers near the local tropopause that may have been from another eruption. A weak layer peaking at 13.5 km altitude was present over Hampton 23 June and aerosols were also observed at 9-14 km on 7 July and 11-13.5 km on 26 July. In July, this material was associated with a "double tropopause", a condition in which 2 temperature inversions were found instead of the single one that typically marks the boundary between the troposphere (where temperature decreases with altitude) and the lower stratosphere (where temperature increases with altitude). No aerosols were detected below the El Chichón material 12 and 27 July. From Fukuoka, new thin layers were observed 1-5 August between 12 and 16 km altitudes, at or below the local tropopause. The layers had fine structures of 100 m and were much more stable than the often-observed cirrus clouds in that altitude range, indicating the possibility that they were volcanic ejecta. Their peak scattering ratios were about 3-30 using YAG lidar. Aerosol layers were observed below the El Chichón material at Mauna Loa, Hawaii on some nights in May and June, but none were detected in July and early August. The source of this material and its relationship to the recently-erupted volcanic material collected in late April by a NASA aircraft over the central United States remain uncertain. Although the eruption of Una Una, Indonesia (0.17°S, 120.61°E) that began 18 July probably injected tephra into the stratosphere, meteorologists anticipated little northward migration of this material until autumn.
From Norwich, England, H. H. Lamb observed little change in optical phenomena. Skies in the direction of the sun continued to be whitish with much diffuse radiation; broken clouds seen against this background appeared an unusually pale gray. Clear twilight skies still produced abnormal colors, often bronze or sepia near the horizon, and whitish shades sometimes with a magenta or purplish patch above, in the direction of the sun. Before sunset, a fan-shaped area of brilliant bluish-white glow above the sun was common. On 30 June between 2245 and 2315 GMT (and probably for some time before and after) noctilucent clouds, structured like dense cirrus, were seen glowing strongly with a soft bluish-white light against the background of the brightest part of the twilight sky, between the horizon and about 9° elevation. The implied altitude of the clouds was about 80 km. Noctilucent clouds are rare at England's latitude and are seen only within about 2-3 weeks of the summer solstice. Lamb last observed noctilucent clouds a year or 2 after the 1963 Agung eruption, which injected large quantities of aerosols into the stratosphere.
Richard Keen reported that enhanced twilights returned to Boulder, Colorado on 14 June, after an absence of 5 months. Unusual twilights were observed 14 and 17 June, and 2-5, 13-14, 17, 22, and 24 July. The twilights were salmon-colored, with brightest and most pronounced coloring at solar depression angle (SDA) of 4°, disappearing on the horizon at SDA 5-6°. In addition, the 3, 13, and 17 July twilights included fainter purplish color that continued to an SDA of about 11°. None of the twilights were as bright as those seen in January, and they ended at somewhat smaller SDA's, suggesting that they were produced by aerosols at somewhat lower altitudes. Cloudy weather February-May made observations difficult but no unusual twilights were observed on clear evenings. Raymond Chuan began to see similar salmon-colored twilights about 10 July from Costa Mesa, California (33.65°N, 117.93°W) and these continued through the week of 18 July, but no enhanced colors were present in early August.
From Millville, New Jersey, Fred Schaaf observed twilight glows in June, July, and early August that were the strongest since January. Skies were whitened by volcanic aerosols 9 June and a 20° Bishop's Ring was seen the next evening. Purple light after sunset indicated aerosols to more than 8 km altitude 13-14 June. Faint but very late color 22 June was followed by a 2-stage twilight the next evening suggesting the presence of both lower-altitude material and aerosols extending to 24 km. Colors caused by high-altitude material were not evident 24-25 June but returned on the 26th, from aerosols at 24-27 km. Sunsets showed no evidence of high-altitude material for the rest of June, but Bishop's Ring was seen on the 30th. Poor weather prevented additional observations until 10 July, when a 2-stage twilight again indicated aerosols at low and high altitudes; if aerosols were being directly illuminated, continued color at 2200 suggests material extended to 40-48 km. Twilight was spectacular the next evening. Shortly after sunset, an intense narrow red band was observed, indicating strong low-altitude aerosols, but late color was also the strongest since January; if caused by direct illumination, aerosols reached more than 50 km altitude. Twilights were similar 12-13 July. Poor weather limited observations during the next 2 weeks. Moderately-colored 2-stage twilights were observed 22 and 26 July, with a mid-level layer at 13-19 km altitude. This layer was still present 27 July, but higher material seemed absent. Dawn observations 1, 2, and 5 August continued to show mid-level aerosols but no high-altitude material was observed.
Late June observations by Edward Brooks of dawns and twilights from Jeddah, Saudi Arabia were hampered by haze, sand, and occasional clouds. However, very early dawns, although often nearly colorless, suggested the presence of high-altitude aerosols. Brilliant dusk colors were observed 3 July and and faint bands of volcanic aerosols were observed with a very early dawn the next day.
Geologic Background. The enormous aerosol cloud from the March-April 1982 eruption of Mexico's El Chichón persisted for years in the stratosphere, and led to the Atmospheric Effects section becoming a regular feature of the Bulletin. Descriptions of the initial dispersal of major eruption clouds remain with the individual eruption reports, but observations of long-term stratospheric aerosol loading will be found here.
Information Contacts: T. DeFoor, MLO; W. Fuller, NASA; M. Hirono, Kyushu Univ., Japan; R. Reiter, Garmisch-Partenkirchen, W. Germany; H. Lamb, Univ. of East Anglia, England; F. Schaaf, Millville, NJ; R. Keen, Univ. of Colorado; E. Brooks, Saudi Arabia; R. Chuan, Brunswick Corp.
Colo
Indonesia
0.162°S, 121.601°E; summit elev. 404 m
All times are local (unless otherwise noted)
Pyroclastic flows devastate island; clouds to stratosphere; evacuations prevent large death toll
An explosive eruption produced pyroclastic flows that destroyed most homes, vegetation, and animal life on 40 km2 Una Una Island and probably injected tephra into the stratosphere. Initial activity prompted evacuation of everyone on the island before the devastating explosions.
The eruption was preceded by seismicity that increased from 9-11 felt events/day on 8 July to 30-40/day on 15 July. The number of recorded events was 33 on 14 July, increasing the following days to 49, 53, and 73 then to an average of more than 90/day 18-21 July. The strongest earthquake was felt 400 km away on 18 July. That morning, a 1-km column of ash and incandescent material was ejected. AFP reported that a strong explosion occurred 19 July, and thick gray clouds containing incandescent tephra were visible from Ampana, more than 100 km to the S, the next day.
By the 20th, almost all houses and buildings in the eight villages near the volcano had been destroyed and nearly half of the residents of the island had been evacuated. All had left by the time of a major explosion on 21 July at 1623 that subjected 80% of the island to temperatures of up to 200°C. Tephra as large as 5-10 cm in diameter fell near a VSI observation vessel and the monitoring team reported flames on parts of the island. A government geologist estimated that all 700,000 coconut trees and all livestock on the island must have been burned, probably by pyroclastic flows. Ash darkened much of the region. People in Falu, 250 km away, were forced to protect themselves from ashfall until late 23 July. A VSI field party arriving on the island 22 July at 0100 felt ten earthquakes during their 15-hour stay and observed a 1.5-km eruption column at 1649.
On 23 July at 2055, a British Airways jet (en route from Singapore to Perth) flying at 10.6 km altitude encountered an eruption cloud at 1.4°S, 120.71°E, about 150 km S of Una Una (figure 1). Pilots noted a volcanic smell, lack of visibility, and St. Elmo's Fire around the windshield. The aircraft returned immediately to Singapore and suffered no damage. On 24 July at 1930, a satellite image showed a cloud about 120 km wide, extending about 600 km S from Una Una. Earlier in the eruption, weather clouds had obscured the Una Una area. Press reports quoted a local government official who said that 80% of the island was covered by volcanic clouds on 24 July, burning vegetation and destroying trees. On 26 July at 0000, the Japanese GMS satellite showed what appeared to be a dense eruption column rising from the island. On the next image, two hours later, a fan-shaped plume was visible, probably in or near the stratosphere. High-altitude material was blowing SW and W, while low and mid-level debris was drifting slowly S to SSE.
On 28 July at 0200 the GMS satellite showed a small plume over the island. By 0500 a plume about 60 km wide extended about 200 km WSW from the volcano. The plume appeared denser at 0800 and by 1100 vigorous activity fed a cloud that reached 118 E and at least 13.5 km altitude. At 1400 the plume stretched about 500 km to the WSW and was very dense within 250 km of the volcano. Temperatures and wind directions at the tropopause (15 km altitude) were consistent with the plume's direction of movement and coldest temperature (-76°C) from a NOAA 7 image at 1430 (figure 2). By the next image, at 2000, the plume had dissipated. The GMS satellite showed the beginning of another eruptive episode on 30 July at 1630. At 2000, a NOAA 7 image contained a WSW-drifting plume, similar to the one on 28 July but not as spectacular. Feeding of this plume was continuing at 2300; it drifted SW, then W toward Sulawesi. It extended from the volcano about 200 km to 1.5°S, 119.5°E on 31 July at 0200, but was dissipating three hours later. At 2000 an image showed what appeared to be an eruption column, but little activity was visible three hours later.
Another explosive episode first appeared on the imagery 2 August at 0500. Before activity ended at 1700, a plume had moved about 200 km to theSW and reached roughly 9-12 km altitude. A dense eruption column appeared over the island 3 August at 0000 and extended roughly 120 km to the W and SW two hours later. The plume was relatively diffuse and appeared to have reached only the mid-troposphere. Satellite images indicated that another explosion started 4 August at about 1000, feeding a plume that moved about 350 km to the NNW. The different direction of drift was the result of a weather change; this plume probably remained in the troposphere. AFP reported an eruption on 9 August at 0835 that ejected a gray plume to 3 km. No activity was evident on satellite images until 12 August at 0130, when a plume was observed that was not visible two hours earlier. At 0300, NOAA 7 data showed a dense plume, similar to that of 28 July, extending about 300 km SW to central Sulawesi.
Geologic Background. Colo volcano forms the isolated small island of Una Una in the middle of the Gulf of Tomini in northern Sulawesi. The broad, low volcano contains a 2-km-wide caldera with a small central cone. Three eruptions have been recorded since the late 1800's, but two of those caused widespread damage over the island. The last eruption, in 1983, produced pyroclastic flows that swept over most of the island shortly after all residents had been evacuated.
Information Contacts: A. Sudradjat, VSI; N. Banks, HVO; M. Matson, J. Hawkins, O. Karst, and S. Kusselson, NOAA/NESDIS; AFP; Antara News Agency, Jakarta; UPI.
Etna
Italy
37.748°N, 14.999°E; summit elev. 3357 m
All times are local (unless otherwise noted)
Eruption ends after four months of lava extrusion
After 131 days of activity, the eruption stopped during the morning of 6 August. The July activity was similar to that of the second half of June. The main lava channel was almost completely roofed over, but moving lava was visible through four "windows" in the channel roof. Numerous overflows from the upper "windows" produced modest lava flows of short duration during the first 10 days of July. Through the end of the month, lava emerged from scattered short-lived pseudo-vents at about 1,860-1,800 m above sea level and flowed onto the S flank lava field that has accumulated during the eruption (figure 13). These small superposed flows approached the E and W edges of the lava field; one advanced beyond the field's W margin on 13 July but stopped quickly. Efforts to contain the lava flows continued with the construction of new small embankments. None of the July flows moved below 1,600 m altitude.
Ash emissions occurred at irregular intervals from Bocca Nuova, but were not as strong as in the previous month. High-altitude winds carried ash to Catania (~30 km to the SSE) on 9, 10, and 11 July. No significant activity stoccurred from other vents.
Preliminary estimates suggest that the 131-day eruption extruded ~100 x 106 m3 of lava, at a rate of 10 m3/s. Lava flowed a maximum of 7 km from the vent, reaching 1,100 m altitude (E of Mt. Mazzo), and covered an area of ~6 km2.
Further References. Kieffer, G., 1983, L'Eruption de l'Etna commencée le 28 Mars, 1983: sa place dans l'exceptionnel cycle eruptif en cours (1971-1983): Comptes Rendus Acad. Sci. Paris, Ser. II, v. 296, p. 1689-1692.
Barberi, F., and Villari, L., eds., 1984, Special issue on Mt. Etna and its 1983 eruption: BV, v. 47, no. 2, p. 877-1177 (22 papers).
Lockwood, J.P., and Romano, R., 1985, Diversion of lava during the 1983 eruption of Mount Etna: Earthquake Information Bull., v. 17, no. 4, p. 124-133.
Geologic Background. Mount Etna, towering above Catania on the island of Sicily, has one of the world's longest documented records of volcanism, dating back to 1500 BCE. Historical lava flows of basaltic composition cover much of the surface of this massive volcano, whose edifice is the highest and most voluminous in Italy. The Mongibello stratovolcano, truncated by several small calderas, was constructed during the late Pleistocene and Holocene over an older shield volcano. The most prominent morphological feature of Etna is the Valle del Bove, a 5 x 10 km caldera open to the east. Two styles of eruptive activity typically occur, sometimes simultaneously. Persistent explosive eruptions, sometimes with minor lava emissions, take place from one or more summit craters. Flank vents, typically with higher effusion rates, are less frequently active and originate from fissures that open progressively downward from near the summit (usually accompanied by Strombolian eruptions at the upper end). Cinder cones are commonly constructed over the vents of lower-flank lava flows. Lava flows extend to the foot of the volcano on all sides and have reached the sea over a broad area on the SE flank.
Information Contacts: R. Romano, IIV.
False Reports (Unknown) — July 1983 Cite this Report
False Reports
Unknown
Unknown, Unknown; summit elev. m
All times are local (unless otherwise noted)
Papua New Guinea: Earthquake swarm; sounds and glow
"An unnamed seamount, 30 km NNE of Cape Gloucester, western New Britain, may have been the site of a short-lived eruption on 15-16 June. A subcontinuous swarm of long-period earthquakes was registered by several seismic stations in Papua New Guinea at 1913-2001 on 15 June and 0427-0450 on 16 June. The swarm was recognized when the records were analyzed at RVO in early July. Preliminary determinations indicated shallow origins over a broad area at the W extremity of New Britain.
"Inquiries with the local people resulted in accounts of sounds like a jet plane coming from the sea, and glow in the sea a long distance from the coast. Northeastward migration of the incandescence was also reported, possibly suggesting a fissure eruption. Airborne observations on 28 July failed to find water discolouration or any other evidence of the 6-week-old event.
"Until further information is obtained, the most likely source for these phenomena is a large seamount mapped in the general area of earthquake locations and visible reports."
Geologic Background. False or otherwise incorrect reports of volcanic activity.
Information Contacts: P. de Saint Ours and C. McKee, RVO.
Piton de la Fournaise (France) — July 1983 Cite this Report
Piton de la Fournaise
France
21.244°S, 55.708°E; summit elev. 2632 m
All times are local (unless otherwise noted)
12-hour earthquake swarm
A 12-hour earthquake swarm occurred 15 July at Piton de la Fournaise, the first seismic crisis there since shortly after the 3 February-5 May 1981 eruption, which produced 10 x 106 m3 of lava during three active phases. Since then, background seismicity had been less than 0.5 events/day. The 21 events between 0830 and 2015 on 15 July occurred in the central area at shallow depth but were poorly located because they were recorded on only 1-3 stations, have emergent onsets, and poorly-defined phases. Event durations ranged from 15 to 150 seconds. The seismic crisis prompted the resurvey of deformation networks, but no significant changes were measured.
The Observatoire Volcanologique du Piton de la Fournaise noted that for the past 50 years the mean eruption frequency has been one every 12-14 months. The 27 months since the last eruption is one of the longer repose intervals during that period.
Geologic Background. Piton de la Fournaise is a massive basaltic shield volcano on the French island of Réunion in the western Indian Ocean. Much of its more than 530,000-year history overlapped with eruptions of the deeply dissected Piton des Neiges shield volcano to the NW. Three scarps formed at about 250,000, 65,000, and less than 5,000 years ago by progressive eastward slumping, leaving caldera-sized embayments open to the E and SE. Numerous pyroclastic cones are present on the floor of the scarps and their outer flanks. Most recorded eruptions have originated from the summit and flanks of Dolomieu, a 400-m-high lava shield that has grown within the youngest scarp, which is about 9 km wide and about 13 km from the western wall to the ocean on the E side. More than 150 eruptions, most of which have produced fluid basaltic lava flows, have occurred since the 17th century. Only six eruptions, in 1708, 1774, 1776, 1800, 1977, and 1986, have originated from fissures outside the scarps.
Information Contacts: Observatoire Volcanologique du Piton de la Fournaise (OVPDLF), Réunion.
Gamalama (Indonesia) — July 1983 Cite this Report
Gamalama
Indonesia
0.81°N, 127.3322°E; summit elev. 1714 m
All times are local (unless otherwise noted)
Ash ejection; several thousand evacuated
AFP reported that an eruption began 9 August. Residents of villages closest to the volcano were awakened at 0445 by the activity. A thick black eruption column containing incandescent material rose 1.5 km and "red-hot lava" moved down the N flank, destroying scores of homes and plantations. Ash fell W of the volcano, closing an airport. Explosions on 10 August at about 1000 and 1200 produced 1.5-km ash columns. A wind shift threatened to cause ashfalls E of Gamalama. Earthquakes centered on the volcano accompanied the eruption.
More than 5,000 persons living near the volcano evacuated to the town of Ternate, capital of North Moluccas regency. No casualties were reported. Despite bad weather, vessels were standing by in case Ternate required evacuation.
Geologic Background. Gamalama is a near-conical stratovolcano that comprises the entire island of Ternate off the western coast of Halmahera, and is one of Indonesia's most active volcanoes. The island was a major regional center in the Portuguese and Dutch spice trade for several centuries, which contributed to the extensive documentation of activity. Three cones, progressively younger to the north, form the summit. Several maars and vents define a rift zone, parallel to the Halmahera island arc, that cuts the volcano; the S-flank Ngade maar formed after about 14,500–13,000 cal. BP (Faral et al., 2022). Eruptions, recorded frequently since the 16th century, typically originated from the summit craters, although flank eruptions have occurred in 1763, 1770, 1775, and 1962-63.
Information Contacts: AFP.
Kilauea (United States) — July 1983 Cite this Report
Kilauea
United States
19.421°N, 155.287°W; summit elev. 1222 m
All times are local (unless otherwise noted)
Lava flows move ENE along east rift for 4 days
EPISODE 6
"Kīlauea's E rift zone eruption was in its sixth episode from 21 to 25 July. The episode 6 eruptive vent was the same spatter cone, approximately 750 m NE of Pu'u Kamoamoa, that was the major source of episode 4 and 5 lavas (figure 19). Between eruptive episodes the vent contained incandescent cracks and continued to emit magmatic gases.
"The first episode 6 eruptive activity was seen from a passing aircraft at about 0600 on 21 July. From then until midafternoon the next day, extrusive activity consisted of cyclic filling and draining of the funnel-shaped interior of the spatter cone. Fountain activity at this stage ranged from intermittent bursts of spatter to the more steady play of a 3-4-m-high dome fountain.
"At approximately 1530 on 22 July, the pond filled to a depth of about 20 m, and lava spilled over low places on the rim of the spatter cone to begin feeding flows to the N, NE, and SE. Lava production rapidly increased, and a major aa flow advanced NE, fed by a vigorous pahoehoe river issuing from the pond at spillways on the N and NE flanks of the cone. Blocked from advancing SE by flows and vent deposits of earlier episodes, this flow moved ENE through the rain forest on the N side of Pu'u Kahaualea. During the period of greatest lava discharge, estimated on 24 July at about 0.25 x 10⁶ m3/hour, the flow advanced at more than 200 m/hour. Ultimately it extended 6 km from the vent, covering an area of about 2 x 10⁶ m2 with a volume on the order of 10 x 106 m3.
"During the period of active lava flow production, a fountain played continuously from the surface of the pond within the vent. The fountain was at its most vigorous on 23 July, when it often reached heights ranging from 50 to 150 m. It produced flows of spatter-fed pahoehoe and a local tephra blanket that extended SW from the vent. Subsequently the fountain was less vigorous and 30-60 m high, approximately 1.5 times its height at the end of episode 5.
"Lava temperatures measured by thermocouple ranged from 1128°C on 22 and 23 July to 1138°C (a new high temperature for the 1983 eruption) on 24 July. Hand-lens inspection indicated that episode 6 basalt contains scattered small phenocrysts of plagioclase and olivine. Thus, it generally resembles, except for the more olivine-phyric basalt of episode 5, the earlier 1983 lavas.
"Harmonic tremor, which had persisted at a low level after the end of episode 5 eruptive activity on 3 July, began to fluctuate slightly and increase gradually during the period of cyclic filling and draining of the lava pond on 21 and 22 July. Shortly before 1600 on 22 July, tremor intensity increased rapidly in concert with increasing eruptive vigor. Tremor reached a high level at about 1800 and maintained it through the 3-day period of strong effusion. At about 1620 on 25 July, tremor decreased rapidly as the eruption came to an end. Low-level tremor, like that characteristic of other inter-eruptive periods, has continued in the vent area since 25 July.
"The Uwekahuna water-tube tiltmeter recorded about 17 µrad of summit deflation during episode 6. Following gradual inflation that had been underway since the end of episode 5, the summit of Kīlauea began to deflate at about 1600 on 22 July, approximately coincident with the increases in tremor amplitude and lava emission. Summit deflation increased to a maximum rate of 3-4 µrad/hour on 23 and 24 July. The rate decreased thereafter until about 1800 on 25 July. Since then the summit has been gradually reinflating."
Addendum: Eruptive activity resumed at the episode 6 vent on 15 August. Harmonic tremor increased at approximately 0700; lava fountains 20-30 m high and a 1 km-long lava flow to the NE were reported by field crews that arrived at the vent at 0845. At press time on 17 August, Tina Neal reported that lava fountains had decreased to 5-10 m high, the lava flow extended about 6 km NE with lobes both N and S of the episode 6 flow, and summit deflation continued.
Geologic Background. Kilauea overlaps the E flank of the massive Mauna Loa shield volcano in the island of Hawaii. Eruptions are prominent in Polynesian legends; written documentation since 1820 records frequent summit and flank lava flow eruptions interspersed with periods of long-term lava lake activity at Halemaumau crater in the summit caldera until 1924. The 3 x 5 km caldera was formed in several stages about 1,500 years ago and during the 18th century; eruptions have also originated from the lengthy East and Southwest rift zones, which extend to the ocean in both directions. About 90% of the surface of the basaltic shield volcano is formed of lava flows less than about 1,100 years old; 70% of the surface is younger than 600 years. The long-term eruption from the East rift zone between 1983 and 2018 produced lava flows covering more than 100 km2, destroyed hundreds of houses, and added new coastline.
Information Contacts: E. Wolfe, A. Okamura, R. Koyanagi, and T. Neal, HVO.
Kusatsu-Shiranesan (Japan) — July 1983 Cite this Report
Kusatsu-Shiranesan
Japan
36.618°N, 138.528°E; summit elev. 2165 m
All times are local (unless otherwise noted)
Small plume emitted; volcanic tremor; A-type events
On 26 July a small phreatic explosion occurred at the NW rim of Yugama Crater, at the volcano's summit. JMA personnel observed the eruption, at Pit No. 6, formed during the 26 October phreatic explosion and the site of a similar explosion on 29 December. Volcanic tremor (amplitude 0.2-0.3 µm) started at 1031. About 1110, the dominant frequency of the tremor decreased and white vapor was ejected. Volcanic rumbling intensified at 1140; about 1/3 of the crater lake was covered with ash by 1150. Accompanied by strong rumbling, a dark plume was ejected at [1204]; it had risen above the crater rim by [1212]. Volcanic tremor returned to a higher frequency at 1213, but shifted back to lower frequency about 20 minutes later. Emission of a white vapor plume that rose to about 100 m above the pit was continuous in the afternoon. Volcanic tremor ended at 1720. The plume weakened suddenly at 1730.
Local seismicity had been at a high level since last autumn. Seismographs recorded 209 volcanic earthquakes in June and 227 in July. On 22 July, swarms of A-type earthquakes occurred. After the 26 July eruptive episode, seismicity declined slightly but remained above background level.
Geologic Background. The Kusatsu-Shiranesan complex, located immediately north of Asama volcano, consists of a series of overlapping pyroclastic cones and three crater lakes. The andesitic-to-dacitic volcano was formed in three eruptive stages beginning in the early to mid-Pleistocene. The Pleistocene Oshi pyroclastic flow produced extensive welded tuffs and non-welded pumice that covers much of the E, S, and SW flanks. The latest eruptive stage began about 14,000 years ago. Historical eruptions have consisted of phreatic explosions from the acidic crater lakes or their margins. Fumaroles and hot springs that dot the flanks have strongly acidified many rivers draining from the volcano. The crater was the site of active sulfur mining for many years during the 19th and 20th centuries.
Information Contacts: JMA, Tokyo; T. Tiba, National Science Museum, Tokyo.
Langila (Papua New Guinea) — July 1983 Cite this Report
Langila
Papua New Guinea
5.525°S, 148.42°E; summit elev. 1330 m
All times are local (unless otherwise noted)
Explosions; ashfalls; strong harmonic tremor
"Stronger activity that commenced at Crater 2 on 26 June continued into July. During the first week of July, ash emissions blown down the volcano's flanks by strong winds occasionally obscured the active vent. A few large Vulcanian explosions were observed, and associated detonations and rumblings were heard frequently at the beginning of the month. Ashfalls continued during this period in inhabited coastal areas about 10 km to the NW and N. Weak crater glow was noted on 2 July.
"Seismic records indicate an average of about five Vulcanian explosions per day in the first week of July, accompanied by large-amplitude harmonic tremor on most days. A decline in activity was evident after 7 July as emissions became less voluminous and less ash-rich, and explosive sounds less frequent.
"Activity re-intensified somewhat from 15 July. Greater quantities of ash were ejected, resulting in renewed ashfalls in coastal areas. On a few days the volcano was again obscured by its own ash emissions. Vulcanian explosions continued to register on seismograms at an average of about 3 per day.
"Crater 3 remained relatively inactive, mainly releasing white vapours. However, pale grey and blue emissions were reported on 9 July.
Geologic Background. Langila, one of the most active volcanoes of New Britain, consists of a group of four small overlapping composite basaltic-andesitic cones on the lower E flank of the extinct Talawe volcano in the Cape Gloucester area of NW New Britain. A rectangular, 2.5-km-long crater is breached widely to the SE; Langila was constructed NE of the breached crater of Talawe. An extensive lava field reaches the coast on the N and NE sides of Langila. Frequent mild-to-moderate explosive eruptions, sometimes accompanied by lava flows, have been recorded since the 19th century from three active craters at the summit. The youngest and smallest crater (no. 3 crater) was formed in 1960 and has a diameter of 150 m.
Information Contacts: C. McKee and P. de Saint Ours, RVO.
Long Valley (United States) — July 1983 Cite this Report
Long Valley
United States
37.7°N, 118.87°W; summit elev. 3390 m
All times are local (unless otherwise noted)
New collapse pits and fumarole
As of early August, no significant earthquake swarms had been detected since 4 June. An average of 2-4 events per day larger than M 1 were recorded in July. Completion of deformation measurements in the caldera is expected at the end of the summer.
The following is from Dartmouth College geologists:
"While conducting an extensive geochemical study of Rn and Hg° concentration at Long Valley, Dartmouth College geologists found evidence of activity in two previously unreported places. Very recent ground breakage (one large collapse pit 3 m long, 2.5 m wide, and 1.5 m deep; another pit 0.5 m in diameter and 0.5 m deep) was found along a fault sag approximately 0.5 km long bearing 340°. The fault is approximately 350 m W of Deer Mountain, the southernmost of the Inyo Domes in the NW part of the caldera (at UTM coordinates 321450 E and 4175800 N). A fumarole located in the Casa Diablo area (just S of the resurgent dome in the S part of the caldera) and associated with older alteration also appears to be previously unreported. New ground breakage may have allowed its formation (at UTM coordinates 333190 E and 4169370 N)."
Geologic Background. The large 17 x 32 km Long Valley caldera east of the central Sierra Nevada Range formed as a result of the voluminous Bishop Tuff eruption about 760,000 years ago. Resurgent doming in the central part of the caldera occurred shortly afterwards, followed by rhyolitic eruptions from the caldera moat and the eruption of rhyodacite from outer ring fracture vents, ending about 50,000 years ago. During early resurgent doming the caldera was filled with a large lake that left strandlines on the caldera walls and the resurgent dome island; the lake eventually drained through the Owens River Gorge. The caldera remains thermally active, with many hot springs and fumaroles, and has had significant deformation, seismicity, and other unrest in recent years. The late-Pleistocene to Holocene Inyo Craters cut the NW topographic rim of the caldera, and along with Mammoth Mountain on the SW topographic rim, are west of the structural caldera and are chemically and tectonically distinct from the Long Valley magmatic system.
Information Contacts: D. Hill, R. Cockerham, USGS, Menlo Park, CA; S. Williams, K. Hudnut, E. Lawrence, J. Lytle, Dartmouth College.
Manam (Papua New Guinea) — July 1983 Cite this Report
Manam
Papua New Guinea
4.08°S, 145.037°E; summit elev. 1807 m
All times are local (unless otherwise noted)
Moderate ash, vapor emissions; B-type events continue
"Most observed parameters showed little or no change in July. Visible activity at Southern crater was unchanged from that of June: pale grey ash-laden emissions in moderate volumes ejected to no more than about 100 m above the crater rim. Occasional weak rumbling and booming sounds accompanied these emissions. Blue vapour emissions also continued at the same rate. On several days a bluish emission plume stretched several tens of kilometers downwind. The crater was often obscured at night, and incandescence was seen only on the nights of 2, 4, 12, and 13 July, as weak fluctuating glow. On 2 July ejections of incandescent tephra to heights of about 250 m were also seen.
"Main crater activity was weaker in July than in June. Usually, pale grey ash-laden clouds were emitted in small to moderate volumes. Blue vapour emissions were seen on 12 and 14 July, and 26-31 July. No eruption sounds could be detected from Main crater, and no instances of nighttime incandescence were reported.
"A helicopter inspection on 26 July revealed that Main crater was a deep funnel-shaped structure having a central vent from which weakly ash-laden, blue-tinged clouds were being released. Abundant fumaroles were noted on the crater walls. Views of Southern crater were obscured by steady emission of ash-laden clouds that filled the entire crater.
"Amplitudes of B-type volcanic earthquakes were remarkably steady throughout July at about double non-eruptive levels, but representing a distinct decline from the high levels of mid-June. Daily totals of seismic events were about 2,000 at the beginning and end of the month, but varied up to about 3,000 in mid-month. Tilt measurements showed a continuation of the flat trend evident in June."
Geologic Background. The 10-km-wide island of Manam, lying 13 km off the northern coast of mainland Papua New Guinea, is one of the country's most active volcanoes. Four large radial valleys extend from the unvegetated summit of the conical basaltic-andesitic stratovolcano to its lower flanks. These valleys channel lava flows and pyroclastic avalanches that have sometimes reached the coast. Five small satellitic centers are located near the island's shoreline on the northern, southern, and western sides. Two summit craters are present; both are active, although most observed eruptions have originated from the southern crater, concentrating eruptive products during much of the past century into the SE valley. Frequent eruptions, typically of mild-to-moderate scale, have been recorded since 1616. Occasional larger eruptions have produced pyroclastic flows and lava flows that reached flat-lying coastal areas and entered the sea, sometimes impacting populated areas.
Information Contacts: C. McKee and P. de Saint Ours, RVO.
Sangay
Ecuador
2.005°S, 78.341°W; summit elev. 5286 m
All times are local (unless otherwise noted)
Eruption continues with ash emission every 10 minutes
. . . During overflights on 4 and 6 August, Maurice Krafft observed frequent ash emission from 1 of 4 WSW-ENE-trending vents in the summit area. The westernmost vent was filled by a blocky lava dome 15-20 m in diameter, partially covered by ash. ENE of the dome, explosions at least every 10 minutes from a 15-m-diameter crater produced thick black cauliflower-shaped ash columns 100-300 m high. Winds blew ash from these explosions to the SW, toward the dome. Each explosion also triggered small ash avalanches from deposits on the upper W and SW flanks. The largest of the four vents, ENE of the active crater, was 80-100 m across and contained two fumaroles that were emitting vapor. The fourth vent, 20-30 m in diameter and slightly N of the trend of the other 3 vents, was not active during the overflights.
Minard Hall reported that activity was generally similar when he visited the volcano in 1976. Although lava was oozing from the westernmost vent at that time, it had not yet built a dome.
Geologic Background. The isolated Sangay volcano, located east of the Andean crest, is the southernmost of Ecuador's volcanoes and its most active. The steep-sided, glacier-covered, dominantly andesitic volcano grew within the open calderas of two previous edifices which were destroyed by collapse to the east, producing large debris avalanches that reached the Amazonian lowlands. The modern edifice dates back to at least 14,000 years ago. It towers above the tropical jungle on the east side; on the other sides flat plains of ash have been eroded by heavy rains into steep-walled canyons up to 600 m deep. The earliest report of an eruption was in 1628. Almost continuous eruptions were reported from 1728 until 1916, and again from 1934 to the present. The almost constant activity has caused frequent changes to the morphology of the summit crater complex.
Information Contacts: M. Krafft, Cernay, France; M. Hall, Escuela Politécnica, Quito.
St. Helens (United States) — July 1983 Cite this Report
St. Helens
United States
46.2°N, 122.18°W; summit elev. 2549 m
All times are local (unless otherwise noted)
Lava dome growth continues; plumes emitted
Growth of the composite lava dome continued through early August (figure 24). Net advance of the active lobe was reduced to roughly 10-20 m in July by frequent rockfalls from its front, but one area on the lobe thickened 11 m during the month. Deformation measurements showed continuing intrusive activity. The highest rates of expansion were on the NE side of the dome, where outward movement averaged 60-70 cm/day, although fluctuations by a factor of two to three were observed for periods lasting a maximum of 3-4 days. The station on the SE side of the dome typically moved outward 1-2 cm/day but this rate sometimes briefly increased to several centimeters per day. A short-term acceleration of endogenous growth in mid-July was accompanied by a slowing in extrusion of the new lobe.
Two vents on the summit of the dome were the sources of three to six small steam-and-ash explosions per day in July and early August. Plumes from most of the explosions barely cleared the crater rim, typically causing a fallout of fine ash within the crater, but little or none outside. A larger explosion in late July produced ballistic fragments 1 cm in diameter and a plume with considerable lightning. A steam and ash plume reached 4.5 km altitude 4 August and another rose to 3.5 km on 6 August.
The average rate of SO2 emission in July was 120 ± 80 t/d. Measurements 4, 5, 6, and 10 July yielded mean values of 85 ± 15 t/d, then the emission rate increased 15, 17, and 21 July to 225 ± 70 t/d before dropping back to 80 ± 50 t/d 22-29 July and roughly 50 t/d 1-9 August. Mid-month increases in endogenous-dome growth and seismicity were also noted (see first and last paragraphs of this report).
Measurements were made of the SO2 content of two plumes produced by vapor-and-ash ejections. On 1 August, data collection began with the onset of the explosion and continued for 30 minutes after plume ejection ended. No change in the SO2 emission rate (55 ± 5 t/d) was observed. Two measurements before a plume ejection 9 August yielded rates of about 40 t/d. Values within the plume were initially 105 t/d before dropping gradually back to 40 t/d as it dissipated.
July seismic activity was similar to that of previous months. Vigorous surface activity was recorded, some of which was thought to be caused by avalanching from the crater walls on warm days. Several brief periods of increased seismicity were noted, and the largest, around the middle of the month, produced a noticeable step in the seismic energy release curve.
Geologic Background. Prior to 1980, Mount St. Helens was a conical volcano sometimes known as the Fujisan of America. During the 1980 eruption the upper 400 m of the summit was removed by slope failure, leaving a 2 x 3.5 km breached crater now partially filled by a lava dome. There have been nine major eruptive periods beginning about 40-50,000 years ago, and it has been the most active volcano in the Cascade Range during the Holocene. Prior to 2,200 years ago, tephra, lava domes, and pyroclastic flows were erupted, forming the older edifice, but few lava flows extended beyond the base of the volcano. The modern edifice consists of basaltic as well as andesitic and dacitic products from summit and flank vents. Eruptions in the 19th century originated from the Goat Rocks area on the N flank, and were witnessed by early settlers.
Information Contacts: D. Swanson, R. Symonds, E. Iwatsubo, B. Myers, USGS CVO, Vancouver, WA.
Ulawun (Papua New Guinea) — July 1983 Cite this Report
Ulawun
Papua New Guinea
5.05°S, 151.33°E; summit elev. 2334 m
All times are local (unless otherwise noted)
Strong seismicity but no change in plume
"The moderate white vapour plume released at Ulawun's summit crater was undisturbed by the volcano's continuing unstable seismicity. A seismic crisis that started on 26 June was the longest since March when this pattern of activity started. It consisted of several periods of tremor up to 13 hours long, and sub-continuous volcanic earthquakes. This activity declined progressively 2-3 July to return to a rate of 1000-1500 B-type events per day. However, the average amplitude of discrete events remained fairly high (about 3 times normal levels) until 20 July. Further seismic crises on 16, 17, and 19 July marked the end of this particular period of stronger seismicity. No significant tilt changes were evident in July."
Geologic Background. The symmetrical basaltic-to-andesitic Ulawun stratovolcano is the highest volcano of the Bismarck arc, and one of Papua New Guinea's most frequently active. The volcano, also known as the Father, rises above the N coast of the island of New Britain across a low saddle NE of Bamus volcano, the South Son. The upper 1,000 m is unvegetated. A prominent E-W escarpment on the south may be the result of large-scale slumping. Satellitic cones occupy the NW and E flanks. A steep-walled valley cuts the NW side, and a flank lava-flow complex lies to the south of this valley. Historical eruptions date back to the beginning of the 18th century. Twentieth-century eruptions were mildly explosive until 1967, but after 1970 several larger eruptions produced lava flows and basaltic pyroclastic flows, greatly modifying the summit crater.
Information Contacts: C. McKee and P. de Saint Ours, RVO.
Veniaminof (United States) — July 1983 Cite this Report
Veniaminof
United States
56.17°N, 159.38°W; summit elev. 2507 m
All times are local (unless otherwise noted)
Lava flow melts large pit in caldera ice, then eruption weakens
The eruption remained vigorous through mid-July, but appeared to be declining in late July and early August. During an overflight on 13 July, the active cinder cone filled most of the summit crater of the pre-existing intra-caldera cone. From a breach in the S side of the cinder cone, molten material was ejected every 1-2 minutes to 150-300 m height. A blocky lava flow 15-20 m wide moved from the breach down the slope of the intra-caldera cone and ponded at the bottom of a vertically walled ice pit about 1,600 m long, 400-800 m wide and 60-100 m deep. The pit, elongate roughly E-W with a slight curvature to the N at its E end, appeared to result from coalescence of smaller ice pits observed in mid-June. It contained a water lake of unknown depth, and white vapor columns rose from the vicinity of the lava flow. The active cone also emitted a thin discontinuous brown-gray eruption column that rose to about 4.2 km altitude, feeding a long narrow plume that extended 30 km or more ENE. Additional tephra had been deposited inside and outside the caldera since the previous month's observations.
Although lava continued to flow down the S side of the cone on 26 July, activity appeared weaker. Yellow sublimates were observed around the vent. By the next overflight, on 3 August, no incandescent tephra was being ejected and the lava flow did not appear to be moving. A few bright reddish-brown patches were noted along the lower part of the flow, but it was not possible to determine whether these were incandescent areas or heavily oxidized zones. Yellow sublimates were visible on the N portion of the active cone and the upper part of the lava flow. The nose of the flow was steaming, especially where it was in contact with the ice pit's meltwater lake (figure 4). The flow had advanced farther into the ice pit and was within 50 m of dividing the meltwater lake into two parts. No ice was seen falling into the lake, but its S portion was ice-choked. Concentric fractures extended SW from the lake almost to the caldera rim. Ash covered the entire caldera, the slopes outside its rim, and mountains to the S. Glacier ice outside the caldera was colored light chocolate brown by ash. Three fissures, not visible on a 7 June airphoto, extended from an older cinder cone in the N-central part of the caldera about a quater of the way to the active cone 2.5 km to the SW.
Geologic Background. Veniaminof, on the Alaska Peninsula, is truncated by a steep-walled, 8 x 11 km, glacier-filled caldera that formed around 3,700 years ago. The caldera rim is up to 520 m high on the north, is deeply notched on the west by Cone Glacier, and is covered by an ice sheet on the south. Post-caldera vents are located along a NW-SE zone bisecting the caldera that extends 55 km from near the Bering Sea coast, across the caldera, and down the Pacific flank. Historical eruptions probably all originated from the westernmost and most prominent of two intra-caldera cones, which rises about 300 m above the surrounding icefield. The other cone is larger, and has a summit crater or caldera that may reach 2.5 km in diameter, but is more subdued and barely rises above the glacier surface.
Information Contacts: T. Miller, M.E. Yount, S. Nelson, and R. Emanuel, USGS, Anchorage.