Recently Published Bulletin Reports
Manam (Papua New Guinea) Few ash plumes during November-December 2022
Krakatau (Indonesia) Strombolian activity and ash plumes during November 2022-April 2023
Stromboli (Italy) Strombolian explosions and lava flows continue during January-April 2023
Nishinoshima (Japan) Small ash plumes and fumarolic activity during November 2022 through April 2023
Karangetang (Indonesia) Lava flows, incandescent avalanches, and ash plumes during January-June 2023
Ahyi (United States) Intermittent hydroacoustic signals and discolored plumes during November 2022-June 2023
Kadovar (Papua New Guinea) An ash plume and weak thermal anomaly during May 2023
San Miguel (El Salvador) Small gas-and-ash explosions during March and May 2023
Semisopochnoi (United States) Occasional explosions, ash deposits, and gas-and-steam plumes during December 2022-May 2023
Ebeko (Russia) Continued explosions, ash plumes, and ashfall during October 2022-May 2023
Home Reef (Tonga) Discolored plumes continued during November 2022-April 2023
Ambae (Vanuatu) New lava flow, ash plumes, and sulfur dioxide plumes during February-May 2023
Manam (Papua New Guinea) — July 2023  Cite this Report
Manam
Papua New Guinea
4.08°S, 145.037°E; summit elev. 1807 m
All times are local (unless otherwise noted)
Few ash plumes during November-December 2022
Manam is a 10-km-wide island that consists of two active summit craters: the Main summit crater and the South summit crater and is located 13 km off the northern coast of mainland Papua New Guinea. Frequent mild-to-moderate eruptions have been recorded since 1616. The current eruption period began during June 2014 and has more recently been characterized by intermittent ash plumes and thermal activity (BGVN 47:11). This report updates activity that occurred from November 2022 through May 2023 based on information from the Darwin Volcanic Ash Advisory Center (VAAC) and various satellite data.
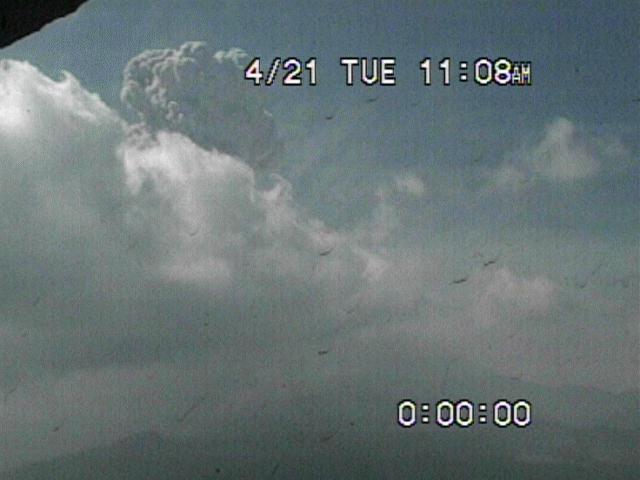
Ash plumes were reported during November and December 2022 by the Darwin VAAC. On 7 November an ash plume rose to 2.1 km altitude and drifted NE based on satellite images and weather models. On 14 November an ash plume rose to 2.1 km altitude and drifted W based on RVO webcam images. On 20 November ash plumes rose to 1.8 km altitude and drifted NW. On 26 December an ash plume rose to 3 km altitude and drifted S and SSE.
Intermittent sulfur dioxide plumes were detected using the TROPOMI instrument on the Sentinel-5P satellite, some of which exceeded at least two Dobson Units (DU) and drifted in different directions (figure 93). Occasional low-to-moderate power thermal anomalies were recorded by the MIROVA (Middle InfraRed Observation of Volcanic Activity) system; less than five anomalies were recorded each month during November 2022 through May 2023 (figure 94). Two thermal hotspots were detected by the MODVOLC thermal alerts system on 10 December 2022. On clear weather days, thermal activity was also captured in infrared satellite imagery in both the Main and South summit craters, accompanied by gas-and-steam emissions (figure 95).
Geologic Background. The 10-km-wide island of Manam, lying 13 km off the northern coast of mainland Papua New Guinea, is one of the country's most active volcanoes. Four large radial valleys extend from the unvegetated summit of the conical basaltic-andesitic stratovolcano to its lower flanks. These valleys channel lava flows and pyroclastic avalanches that have sometimes reached the coast. Five small satellitic centers are located near the island's shoreline on the northern, southern, and western sides. Two summit craters are present; both are active, although most observed eruptions have originated from the southern crater, concentrating eruptive products during much of the past century into the SE valley. Frequent eruptions, typically of mild-to-moderate scale, have been recorded since 1616. Occasional larger eruptions have produced pyroclastic flows and lava flows that reached flat-lying coastal areas and entered the sea, sometimes impacting populated areas.
Information Contacts: Rabaul Volcano Observatory (RVO), Geohazards Management Division, Department of Mineral Policy and Geohazards Management (DMPGM), PO Box 3386, Kokopo, East New Britain Province, Papua New Guinea; Darwin Volcanic Ash Advisory Centre (VAAC), Bureau of Meteorology, Northern Territory Regional Office, PO Box 40050, Casuarina, NT 0811, Australia (URL: http://www.bom.gov.au/info/vaac/); MIROVA (Middle InfraRed Observation of Volcanic Activity), a collaborative project between the Universities of Turin and Florence (Italy) supported by the Centre for Volcanic Risk of the Italian Civil Protection Department (URL: http://www.mirovaweb.it/); Hawai'i Institute of Geophysics and Planetology (HIGP) - MODVOLC Thermal Alerts System, School of Ocean and Earth Science and Technology (SOEST), Univ. of Hawai'i, 2525 Correa Road, Honolulu, HI 96822, USA (URL: http://modis.higp.hawaii.edu/); NASA Global Sulfur Dioxide Monitoring Page, Atmospheric Chemistry and Dynamics Laboratory, NASA Goddard Space Flight Center (NASA/GSFC), 8800 Greenbelt Road, Goddard, Maryland, USA (URL: https://so2.gsfc.nasa.gov/); Copernicus Browser, Copernicus Data Space Ecosystem, European Space Agency (URL: https://dataspace.copernicus.eu/browser/).
Krakatau (Indonesia) — July 2023 Cite this Report
Krakatau
Indonesia
6.1009°S, 105.4233°E; summit elev. 285 m
All times are local (unless otherwise noted)
Strombolian activity and ash plumes during November 2022-April 2023
Krakatau is located in the Sunda Strait between Java and Sumatra, Indonesia. Caldera collapse during the catastrophic 1883 eruption destroyed Danan and Perbuwatan cones and left only a remnant of Rakata. The post-collapse cone of Anak Krakatau (Child of Krakatau) was constructed within the 1883 caldera at a point between the former Danan and Perbuwatan cones; it has been the site of frequent eruptions since 1927. The current eruption period began in May 2021 and has recently consisted of explosions, ash plumes, and thermal activity (BGVN 47:11). This report covers activity during November 2022 through April 2023 based on information provided by the Indonesian Center for Volcanology and Geological Hazard Mitigation, referred to as Pusat Vulkanologi dan Mitigasi Bencana Geologi (PVMBG), MAGMA Indonesia, the Darwin Volcanic Ash Advisory Center (VAAC), and several sources of satellite data.
Activity was relatively low during November and December 2022. Daily white gas-and-steam plumes rose 25-100 m above the summit and drifted in different directions. Gray ash plumes rose 200 m above the summit and drifted NE at 1047 and at 2343 on 11 November. On 14 November at 0933 ash plumes rose 300 m above the summit and drifted E. An ash plume was reported at 0935 on 15 December that rose 100 m above the summit and drifted NE. An eruptive event at 1031 later that day generated an ash plume that rose 700 m above the summit and drifted NE. A gray ash plume at 1910 rose 100 m above the summit and drifted E. Incandescent material was ejected above the vent based on an image taken at 1936.
During January 2023 daily white gas-and-steam plumes rose 25-300 m above the summit and drifted in multiple directions. Gray-to-brown ash plumes were reported at 1638 on 3 January, at 1410 and 1509 on 4 January, and at 0013 on 5 January that rose 100-750 m above the summit and drifted NE and E; the gray-to-black ash plume at 1509 on 4 January rose as high as 3 km above the summit and drifted E. Gray ash plumes were recorded at 1754, 2241, and 2325 on 11 January and at 0046 on 12 January and rose 200-300 m above the summit and drifted NE. Toward the end of January, PVMBG reported that activity had intensified; Strombolian activity was visible in webcam images taken at 0041, 0043, and 0450 on 23 January. Multiple gray ash plumes throughout the day rose 200-500 m above the summit and drifted E and SE (figure 135). Webcam images showed progressively intensifying Strombolian activity at 1919, 1958, and 2113 on 24 January; a gray ash plume at 1957 rose 300 m above the summit and drifted E (figure 135). Eruptive events at 0231 and 2256 on 25 January and at 0003 on 26 January ejected incandescent material from the vent, based on webcam images. Gray ash plumes observed during 26-27 January rose 300-500 m above the summit and drifted NE, E, and SE.
Low levels of activity were reported during February and March. Daily white gas-and-steam plumes rose 25-300 m above the summit and drifted in different directions. The Darwin VAAC reported that continuous ash emissions rose to 1.5-1.8 km altitude and drifted W and NW during 1240-1300 on 10 March, based on satellite images, weather models, and PVMBG webcams. White-and-gray ash plumes rose 500 m and 300 m above the summit and drifted SW at 1446 and 1846 on 18 March, respectively. An eruptive event was recorded at 2143, though it was not visible due to darkness. Multiple ash plumes were reported during 27-29 March that rose as high as 2.5 km above the summit and drifted NE, W, and SW (figure 136). Webcam images captured incandescent ejecta above the vent at 0415 and around the summit area at 2003 on 28 March and at 0047 above the vent on 29 March.
Daily white gas-and-steam plumes rose 25-300 m above the summit and drifted in multiple directions during April and May. White-and-gray and black plumes rose 50-300 m above the summit on 2 and 9 April. On 11 May at 1241 a gray ash plume rose 1-3 km above the summit and drifted SW. On 12 May at 0920 a gray ash plume rose 2.5 km above the summit and drifted SW and at 2320 an ash plume rose 1.5 km above the summit and drifted SW. An accompanying webcam image showed incandescent ejecta. On 13 May at 0710 a gray ash plume rose 2 km above the summit and drifted SW (figure 137).
The MIROVA (Middle InfraRed Observation of Volcanic Activity) graph of MODIS thermal anomaly data showed intermittent low-to-moderate power thermal anomalies during November 2022 through April 2023 (figure 138). Some of this thermal activity was also visible in infrared satellite imagery at the crater, accompanied by gas-and-steam and ash plumes that drifted in different directions (figure 139).
Geologic Background. The renowned Krakatau (frequently mis-named as Krakatoa) volcano lies in the Sunda Strait between Java and Sumatra. Collapse of an older edifice, perhaps in 416 or 535 CE, formed a 7-km-wide caldera. Remnants of that volcano are preserved in Verlaten and Lang Islands; subsequently the Rakata, Danan, and Perbuwatan cones were formed, coalescing to create the pre-1883 Krakatau Island. Caldera collapse during the catastrophic 1883 eruption destroyed Danan and Perbuwatan, and left only a remnant of Rakata. This eruption caused more than 36,000 fatalities, most as a result of tsunamis that swept the adjacent coastlines of Sumatra and Java. Pyroclastic surges traveled 40 km across the Sunda Strait and reached the Sumatra coast. After a quiescence of less than a half century, the post-collapse cone of Anak Krakatau (Child of Krakatau) was constructed within the 1883 caldera at a point between the former Danan and Perbuwatan cones. Anak Krakatau has been the site of frequent eruptions since 1927.
Information Contacts: Pusat Vulkanologi dan Mitigasi Bencana Geologi (PVMBG, also known as Indonesian Center for Volcanology and Geological Hazard Mitigation, CVGHM), Jalan Diponegoro 57, Bandung 40122, Indonesia (URL: http://www.vsi.esdm.go.id/); MAGMA Indonesia, Kementerian Energi dan Sumber Daya Mineral (URL: https://magma.esdm.go.id/v1); Darwin Volcanic Ash Advisory Centre (VAAC), Bureau of Meteorology, Northern Territory Regional Office, PO Box 40050, Casuarina, NT 0811, Australia (URL: http://www.bom.gov.au/info/vaac/); MIROVA (Middle InfraRed Observation of Volcanic Activity), a collaborative project between the Universities of Turin and Florence (Italy) supported by the Centre for Volcanic Risk of the Italian Civil Protection Department (URL: http://www.mirovaweb.it/); Copernicus Browser, Copernicus Data Space Ecosystem, European Space Agency (URL: https://dataspace.copernicus.eu/browser/).
Stromboli
Italy
38.789°N, 15.213°E; summit elev. 924 m
All times are local (unless otherwise noted)
Strombolian explosions and lava flows continue during January-April 2023
Stromboli, located in Italy, has exhibited nearly constant lava fountains for the past 2,000 years; recorded eruptions date back to 350 BCE. Eruptive activity occurs at the summit from multiple vents, which include a north crater area (N area) and a central-southern crater (CS area) on a terrace known as the ‘terrazza craterica’ at the head of the Sciara del Fuoco, a large scarp that runs from the summit down the NW side of the volcano-island. Activity typically consists of Strombolian explosions, incandescent ejecta, lava flows, and pyroclastic flows. Thermal and visual monitoring cameras are located on the nearby Pizzo Sopra La Fossa, above the terrazza craterica, and at multiple flank locations. The current eruption period has been ongoing since 1934 and recent activity has consisted of frequent Strombolian explosions and lava flows (BGVN 48:02). This report updates activity during January through April 2023 primarily characterized by Strombolian explosions and lava flows based on reports from Italy's Istituto Nazionale di Geofisica e Vulcanologia (INGV) and various satellite data.
Frequent explosive activity continued throughout the reporting period, generally in the low-to-medium range, based on the number of hourly explosions in the summit crater (figure 253, table 16). Intermittent thermal activity was recorded by the MIROVA (Middle InfraRed Observation of Volcanic Activity) analysis of MODIS satellite data (figure 254). According to data collected by the MODVOLC thermal algorithm, a total of 9 thermal alerts were detected: one on 2 January 2023, one on 1 February, five on 24 March, and two on 26 March. The stronger pulses of thermal activity likely reflected lava flow events. Infrared satellite imagery captured relatively strong thermal hotspots at the two active summit craters on clear weather days, showing an especially strong event on 8 March (figure 255).
Table 16. Summary of type, frequency, and intensity of explosive activity at Stromboli by month during January-April 2023; information from webcam observations. Courtesy of INGV weekly reports.
| Month |
Explosive Activity |
| Jan 2023 |
Typical Strombolian activity with spattering and lava overflows in the N crater area. Explosions were reported from 4 vents in the N area and 1-2 vents in the CS area. The average hourly frequency of explosions was low-to-medium (1-12 events/hour). The intensity of the explosions varied from low (less than 80 m high) to medium (less than 150 m high) in the N crater area and up to high (greater than 150 m high) in the CS crater area. |
| Feb 2023 |
Typical Strombolian activity with spattering in the N crater area. Explosions were reported from 2-3 vents in the N area and 1-4 vents in the CS area. The average hourly frequency of explosions was low-to-medium (1-14 events/hour). The intensity of the explosions varied from low (less than 80 m high) to medium (less than 150 m high) in the N crater area and up to high (greater than 150 m high) in the CS crater area. |
| Mar 2023 |
Typical Strombolian activity with spattering and lava overflows in the N crater area. Explosions were reported from 2-3 vents in the N area and 2-4 vents in the CS area. The average hourly frequency of explosions was low-to-medium (1-18 events/hour). The intensity of the explosions varied from low (less than 80 m high) to medium (less than 150 m high) in the N crater area and up to high (greater than 150 m high) in the CS crater area. |
| Apr 2023 |
Typical Strombolian activity. Explosions were reported from 2 vents in the N area and 2-3 vents in the CS area. The average hourly frequency of explosions was low-to-high (1-16 events/hour). The intensity of the explosions varied from low (less than 80 m high) to medium (less than 150 m high) in both the N and CS crater areas. |
Activity during January-February 2023. Strombolian explosions were reported in the N crater area, as well as lava effusion. Explosive activity in the N crater area ejected coarse material (bombs and lapilli). Intense spattering was observed in both the N1 and N2 craters. In the CS crater area, explosions generally ejected fine material (ash), sometimes to heights greater than 250 m. The intensity of the explosions was characterized as low-to-medium in the N crater and medium-to-high in the CS crater. After intense spattering activity from the N crater area, a lava overflow began at 2136 on 2 January that flowed part way down the Sciara del Fuoco, possibly moving down the drainage that formed in October, out of view from webcams. The flow remained active for a couple of hours before stopping and beginning to cool. A second lava flow was reported at 0224 on 4 January that similarly remained active for a few hours before stopping and cooling. Intense spattering was observed on 11 and 13 January from the N1 crater. After intense spattering activity at the N2 crater at 1052 on 17 January another lava flow started to flow into the upper part of the Sciara del Fuoco (figure 256), dividing into two: one that traveled in the direction of the drainage formed in October, and the other one moving parallel to the point of emission. By the afternoon, the rate of the flow began to decrease, and at 1900 it started to cool. A lava flow was reported at 1519 on 24 January following intense spattering in the N2 area, which began to flow into the upper part of the Sciara del Fuoco. By the morning of 25 January, the lava flow had begun to cool. During 27 January the frequency of eruption in the CS crater area increased to 6-7 events/hour compared to the typical 1-7 events/hour; the following two days showed a decrease in frequency to less than 1 event/hour. Starting at 1007 on 30 January a high-energy explosive sequence was produced by vents in the CS crater area. The sequence began with an initial energetic pulse that lasted 45 seconds, ejecting predominantly coarse products 300 m above the crater that fell in an ESE direction. Subsequent and less intense explosions ejected material 100 m above the crater. The total duration of this event lasted approximately two minutes. During 31 January through 6, 13, and 24 February spattering activity was particularly intense for short periods in the N2 crater.
An explosive sequence was reported on 16 February that was characterized by a major explosion in the CS crater area (figure 257). The sequence began at 1817 near the S2 crater that ejected material radially. A few seconds later, lava fountains were observed in the central part of the crater. Three explosions of medium intensity (material was ejected less than 150 m high) were recorded at the S2 crater. The first part of this sequence lasted approximately one minute, according to INGV, and material rose 300 m above the crater and then was deposited along the Sciara del Fuoco. The second phase began at 1818 at the S1 crater; it lasted seven seconds and material was ejected 150 m above the crater. Another event 20 seconds later lasted 12 seconds, also ejecting material 150 m above the crater. The sequence ended with at least three explosions of mostly fine material from the S1 crater. The total duration of this sequence was about two minutes.
Short, intense spattering activity was noted above the N1 crater on 27 and 28 February. A lava overflow was first reported at 0657 from the N2 crater on 27 February that flowed into the October 2022 drainage. By 1900 the flow had stopped. A second lava overflow also in the N crater area occurred at 2149, which overlapped the first flow and then stopped by 0150 on 28 February. Material detached from both the lava overflows rolled down the Sciara del Fuoco, some of which was visible in webcam images.
Activity during March-April 2023. Strombolian activity continued with spattering activity and lava overflows in the N crater area during March. Explosive activity at the N crater area varied from low (less than 80 m high) to medium (less than 150 m high) and ejected coarse material, such as bombs and lapilli. Spattering was observed above the N1 crater, while explosive activity at the CS crater area varied from medium to high (greater than 150 m high) and ejected coarse material. Intense spattering activity was observed for short periods on 6 March above the N1 crater. At approximately 0610 a lava overflow was reported around the N2 crater on 8 March, which then flowed into the October 2022 drainage. By 1700 the flow started to cool. A second overflow began at 1712 on 9 March and overlapped the previous flow. It had stopped by 2100. Material from both flows was deposited along the Sciara del Fuoco, though much of the activity was not visible in webcam images. On 11 March a lava overflow was observed at 0215 that overlapped the two previous flows in the October 2022 drainage. By late afternoon on 12 March, it had stopped.
During a field excursion on 16 March, scientists noted that a vent in the central crater area was degassing. Another vent showed occasional Strombolian activity that emitted ash and lapilli. During 1200-1430 low-to-medium intense activity was reported; the N1 crater emitted ash emissions and the N2 crater emitted both ash and coarse material. Some explosions also occurred in the CS crater area that ejected coarse material. The C crater in the CS crater area occasionally showed gas jetting and low intensity explosions on 17 and 22 March; no activity was observed at the S1 crater. Intense, longer periods of spattering were reported in the N1 crater on 19, 24, and 25 March. Around 2242 on 23 March a lava overflow began from the N1 crater that, after about an hour, began moving down the October 2022 drainage and flow along the Sciara del Fuoco (figure 258). Between 0200 and 0400 on 26 March the flow rate increased, which generated avalanches of material from collapses at the advancing flow front. By early afternoon, the flow began to cool. On 25 March at 1548 an explosive sequence began from one of the vents at S2 in the CS crater area (figure 258). Fine ash mixed with coarse material was ejected 300 m above the crater rim and drifted SSE. Some modest explosions around Vent C were detected at 1549 on 25 March, which included an explosion at 1551 that ejected coarse material. The entire explosive sequence lasted approximately three minutes.
During April explosions persisted in both the N and CS crater areas. Fine material was ejected less than 80 m above the N crater rim until 6 April, followed by ejection of coarser material. Fine material was also ejected less than 80 m above the CS crater rim. The C and S2 crater did not show significant eruptive activity. On 7 April an explosive sequence was detected in the CS crater area at 1203 (figure 259). The first explosion lasted approximately 18 seconds and ejected material 400 m above the crater rim, depositing pyroclastic material in the upper part of the Sciara del Fuoco. At 1204 a second, less intense explosion lasted approximately four seconds and deposited pyroclastic products outside the crater area and near Pizzo Sopra La Fossa. A third explosion at 1205 was mainly composed of ash that rose about 150 m above the crater and lasted roughly 20 seconds. A fourth explosion occurred at 1205 about 28 seconds after the third explosion and ejected a mixture of coarse and fine material about 200 m above the crater; the explosion lasted roughly seven seconds. Overall, the entire explosive sequence lasted about two minutes and 20 seconds. After the explosive sequence on 7 April, explosions in both the N and CS crater areas ejected material as high as 150 m above the crater.
On 21 April research scientists from INGV made field observations in the summit area of Stromboli, and some lapilli samples were collected. In the N crater area near the N1 crater, a small cone was observed with at least two active vents, one of which was characterized by Strombolian explosions. The other vent produced explosions that ejected ash and chunks of cooled lava. At the N2 crater at least one vent was active and frequently emitted ash. In the CS crater area, a small cone contained 2-3 degassing vents and a smaller, possible fissure area also showed signs of degassing close to the Pizzo Sopra La Fossa. In the S part of the crater, three vents were active: a small hornito was characterized by modest and rare explosions, a vent that intermittently produced weak Strombolian explosions, and a vent at the end of the terrace that produced frequent ash emissions. Near the S1 crater there was a hornito that generally emitted weak gas-and-steam emissions, sometimes associated with “gas rings”. On 22 April another field inspection was carried out that reported two large sliding surfaces on the Sciara del Fuoco that showed where blocks frequently descended toward the sea. A thermal anomaly was detected at 0150 on 29 April.
Geologic Background. Spectacular incandescent nighttime explosions at Stromboli have long attracted visitors to the "Lighthouse of the Mediterranean" in the NE Aeolian Islands. This volcano has lent its name to the frequent mild explosive activity that has characterized its eruptions throughout much of historical time. The small island is the emergent summit of a volcano that grew in two main eruptive cycles, the last of which formed the western portion of the island. The Neostromboli eruptive period took place between about 13,000 and 5,000 years ago. The active summit vents are located at the head of the Sciara del Fuoco, a prominent scarp that formed about 5,000 years ago due to a series of slope failures which extends to below sea level. The modern volcano has been constructed within this scarp, which funnels pyroclastic ejecta and lava flows to the NW. Essentially continuous mild Strombolian explosions, sometimes accompanied by lava flows, have been recorded for more than a millennium.
Information Contacts: Istituto Nazionale di Geofisica e Vulcanologia (INGV), Sezione di Catania, Piazza Roma 2, 95123 Catania, Italy, (URL: http://www.ct.ingv.it/en/); MIROVA (Middle InfraRed Observation of Volcanic Activity), a collaborative project between the Universities of Turin and Florence (Italy) supported by the Centre for Volcanic Risk of the Italian Civil Protection Department (URL: http://www.mirovaweb.it/); Hawai'i Institute of Geophysics and Planetology (HIGP) - MODVOLC Thermal Alerts System, School of Ocean and Earth Science and Technology (SOEST), Univ. of Hawai'i, 2525 Correa Road, Honolulu, HI 96822, USA (URL: http://modis.higp.hawaii.edu/); Copernicus Browser, Copernicus Data Space Ecosystem, European Space Agency (URL: https://dataspace.copernicus.eu/browser/).
Nishinoshima (Japan) — July 2023 Cite this Report
Nishinoshima
Japan
27.247°N, 140.874°E; summit elev. 100 m
All times are local (unless otherwise noted)
Small ash plumes and fumarolic activity during November 2022 through April 2023
Nishinoshima is a small island located about 1,000 km S of Tokyo in the Ogasawara Arc in Japan. The island is the summit of a massive submarine volcano that has prominent peaks to the S, W, and NE. Eruptions date back to 1973; the most recent eruption period began in October 2022 and was characterized by ash plumes and fumarolic activity (BGVN 47:12). This report describes ash plumes and fumarolic activity during November 2022 through April 2023 based on monthly reports from the Japan Meteorological Agency (JMA) monthly reports and satellite data.
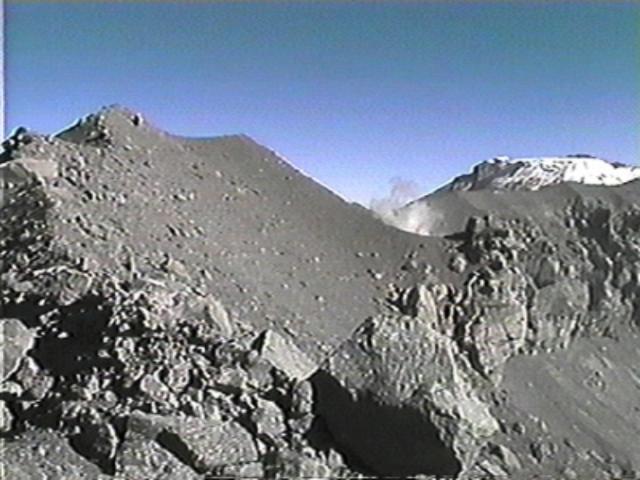
The most recent eruptive activity prior to the reporting internal occurred on 12 October 2022, when an ash plume rose 3.5 km above the crater rim. An aerial observation conducted by the Japan Coast Guard (JCG) on 25 November reported that white fumaroles rose approximately 200 m above the central crater of a pyroclastic cone (figure 119), and multiple plumes were observed on the ESE flank of the cone. Discolored water ranging from reddish-brown to brown and yellowish-green were visible around the perimeter of the island (figure 119). No significant activity was reported in December.
During an overflight conducted by JCG on 25 January 2023 intermittent activity and small, blackish-gray plumes rose 900 m above the central part of the crater were observed (figure 120). The fumarolic zone of the E flank and base of the cone had expanded and emissions had intensified. Dark brown discolored water was visible around the perimeter of the island.
No significant activity was reported during February through March. Ash plumes at 1050 and 1420 on 11 April rose 1.9 km above the crater rim and drifted NW and N. These were the first ash plumes observed since 12 October 2022. On 14 April JCG carried out an overflight and reported that no further eruptive activity was visible, although white gas-and-steam plumes were visible from the central crater and rose 900 m high (figure 121). Brownish and yellow-green discolored water surrounded the island.
Intermittent low-to-moderate power thermal anomalies were recorded in the MIROVA graph (Middle InfraRed Observation of Volcanic Activity) during November 2022 through April 2023 (figure 123). A cluster of six to eight anomalies were detected during November while a smaller number were detected during the following months: two to three during December, one during mid-January 2023, one during February, five during March, and two during April. Thermal activity was also reflected in infrared satellite data at the summit crater, accompanied by occasional gas-and-steam plumes (figure 124).
Geologic Background. The small island of Nishinoshima was enlarged when several new islands coalesced during an eruption in 1973-74. Multiple eruptions that began in 2013 completely covered the previous exposed surface and continued to enlarge the island. The island is the summit of a massive submarine volcano that has prominent peaks to the S, W, and NE. The summit of the southern cone rises to within 214 m of the ocean surface 9 km SSE.
Information Contacts: Japan Meteorological Agency (JMA), 1-3-4 Otemachi, Chiyoda-ku, Tokyo 100-8122, Japan (URL: http://www.jma.go.jp/jma/indexe.html); MIROVA (Middle InfraRed Observation of Volcanic Activity), a collaborative project between the Universities of Turin and Florence (Italy) supported by the Centre for Volcanic Risk of the Italian Civil Protection Department (URL: http://www.mirovaweb.it/); Copernicus Browser, Copernicus Data Space Ecosystem, European Space Agency (URL: https://dataspace.copernicus.eu/browser/).
Karangetang (Indonesia) — July 2023 Cite this Report
Karangetang
Indonesia
2.781°N, 125.407°E; summit elev. 1797 m
All times are local (unless otherwise noted)
Lava flows, incandescent avalanches, and ash plumes during January-June 2023
Karangetang (also known as Api Siau), at the northern end of the island of Siau, Indonesia, contains five summit craters along a N-S line. More than 40 eruptions have been recorded since 1675; recent eruptions have included frequent explosive activity, sometimes accompanied by pyroclastic flows and lahars. Lava dome growth has occurred in the summit craters and collapses of lava flow fronts have produced pyroclastic flows. The two active summit craters are Kawah Dua (the N crater) and Kawah Utama (the S crater, also referred to as the “Main Crater”). The most recent eruption began in late November 2018 and has more recently consisted of weak thermal activity and gas-and-steam emissions (BGVN 48:01). This report updates activity characterized by lava flows, incandescent avalanches, and ash plumes during January through June 2023 using reports from Pusat Vulkanologi dan Mitigasi Bencana Geologi (PVMBG, also known as CVGHM, or the Center of Volcanology and Geological Hazard Mitigation), MAGMA Indonesia, the Darwin VAAC (Volcano Ash Advisory Center), and satellite data.
Activity during January was relatively low and mainly consisted of white gas-and-steam emissions that rose 25-150 m above Main Crater (S crater) and drifted in different directions. Incandescence was visible from the lava dome in Kawah Dua (the N crater). Weather conditions often prevented clear views of the summit. On 18 January the number of seismic signals that indicated avalanches of material began to increase. In addition, there were a total of 71 earthquakes detected during the month.
Activity continued to increase during the first week of February. Material from Main Crater traveled as far as 800 m down the Batuawang (S) and Batang (W) drainages and as far as 1 km W down the Beha (W) drainage on 4 February. On 6 February 43 earthquake events were recorded, and on 7 February, 62 events were recorded. White gas-and-steam emissions rose 25-250 m above both summit craters throughout the month. PVMBG reported an eruption began during the evening of 8 February around 1700. Photos showed incandescent material at Main Crater. Incandescent material had also descended the flank in at least two unconfirmed directions as far as 2 km from Main Crater, accompanied by ash plumes (figure 60). As a result, PVMBG increased the Volcano Alert Level (VAL) to 3 (the second highest level on a 1-4 scale).
Occasional nighttime webcam images showed three main incandescent lava flows of differing lengths traveling down the S, SW, and W flanks (figure 61). Incandescent rocks were visible on the upper flanks, possibly from ejected or collapsed material from the crater, and incandescence was the most intense at the summit. Based on analyses of satellite imagery and weather models, the Darwin VAAC reported that daily ash plumes during 16-20 February rose to 2.1-3 km altitude and drifted NNE, E, and SE. BNPB reported on 16 February that as many as 77 people were evacuated and relocated to the East Siau Museum. A webcam image taken at 2156 on 17 February possibly showed incandescent material descending the SE flank. Ash plumes rose to 2.1 km altitude and drifted SE during 22-23 February, according to the Darwin VAAC.
Incandescent avalanches of material and summit incandescence at Main Crater continued during March. White gas-and-steam emissions during March generally rose 25-150 m above the summit crater; on 31 March gas-and-steam emissions rose 200-400 m high. An ash plume rose to 2.4 km altitude and drifted S at 1710 on 9 March and a large thermal anomaly was visible in images taken at 0550 and 0930 on 10 March. Incandescent material was visible at the summit and on the flanks based on webcam images taken at 0007 and 2345 on 16 March, at 1828 on 17 March, at 1940 on 18 March, at 2311 on 19 March, and at 2351 on 20 March. Incandescence was most intense on 18 and 20 March and webcam images showed possible Strombolian explosions (figure 62). An ash plume rose to 2.4 km altitude and drifted SW on 18 March, accompanied by a thermal anomaly.
Summit crater incandescence at Main Crater and on the flanks persisted during April. Incandescent material at the S crater and on the flanks was reported at 0016 on 1 April. The lava flows had stopped by 1 April according to PVMBG, although incandescence was still visible up to 10 m high. Seismic signals indicating effusion decreased and by 6 April they were no longer detected. Incandescence was visible from both summit craters. On 26 April the VAL was lowered to 2 (the second lowest level on a 1-4 scale). White gas-and-steam emissions rose 25-200 m above the summit crater.
During May white gas-and-steam emissions generally rose 50-250 m above the summit, though it was often cloudy, which prevented clear views; on 21 May gas-and-steam emissions rose 50-400 m high. Nighttime N summit crater incandescence rose 10-25 m above the lava dome, and less intense incandescence was noted above Main Crater, which reached about 10 m above the dome. Sounds of falling rocks at Main Crater were heard on 15 May and the seismic network recorded 32 rockfall events in the crater on 17 May. Avalanches traveled as far as 1.5 km down the SW and S flanks, accompanied by rumbling sounds on 18 May. Incandescent material descending the flanks was captured in a webcam image at 2025 on 19 May (figure 63) and on 29 May; summit crater incandescence was observed in webcam images at 2332 on 26 May and at 2304 on 29 May. On 19 May the VAL was again raised to 3.
Occasional Main Crater incandescence was reported during June, as well as incandescent material on the flanks. White gas-and-steam emissions rose 10-200 m above the summit crater. Ash plumes rose to 2.1 km altitude and drifted SE and E during 2-4 June, according to the Darwin VAAC. Material on the flanks of Main Crater were observed at 2225 on 7 June, at 2051 on 9 June, at 0007 on 17 June, and at 0440 on 18 June. Webcam images taken on 21, 25, and 27 June showed incandescence at Main Crater and from material on the flanks.
MIROVA (Middle InfraRed Observation of Volcanic Activity) analysis of MODIS satellite data showed strong thermal activity during mid-February through March and mid-May through June, which represented incandescent avalanches and lava flows (figure 64). During April through mid-May the power of the anomalies decreased but frequent anomalies were still detected. Brief gaps in activity occurred during late March through early April and during mid-June. Infrared satellite images showed strong lava flows mainly affecting the SW and S flanks, accompanied by gas-and-steam emissions (figure 65). According to data recorded by the MODVOLC thermal algorithm, there were a total of 79 thermal hotspots detected: 28 during February, 24 during March, one during April, five during May, and 21 during June.
Geologic Background. Karangetang (Api Siau) volcano lies at the northern end of the island of Siau, about 125 km NNE of the NE-most point of Sulawesi. The stratovolcano contains five summit craters along a N-S line. It is one of Indonesia's most active volcanoes, with more than 40 eruptions recorded since 1675 and many additional small eruptions that were not documented (Neumann van Padang, 1951). Twentieth-century eruptions have included frequent explosive activity sometimes accompanied by pyroclastic flows and lahars. Lava dome growth has occurred in the summit craters; collapse of lava flow fronts have produced pyroclastic flows.
Information Contacts: Pusat Vulkanologi dan Mitigasi Bencana Geologi (PVMBG, also known as Indonesian Center for Volcanology and Geological Hazard Mitigation, CVGHM), Jalan Diponegoro 57, Bandung 40122, Indonesia (URL: http://www.vsi.esdm.go.id/); MAGMA Indonesia, Kementerian Energi dan Sumber Daya Mineral (URL: https://magma.esdm.go.id/v1); Badan Nasional Penanggulangan Bencana (BNPB), National Disaster Management Agency, Graha BNPB - Jl. Scout Kav.38, East Jakarta 13120, Indonesia (URL: http://www.bnpb.go.id/); Darwin Volcanic Ash Advisory Centre (VAAC), Bureau of Meteorology, Northern Territory Regional Office, PO Box 40050, Casuarina, NT 0811, Australia (URL: http://www.bom.gov.au/info/vaac/); MIROVA (Middle InfraRed Observation of Volcanic Activity), a collaborative project between the Universities of Turin and Florence (Italy) supported by the Centre for Volcanic Risk of the Italian Civil Protection Department (URL: http://www.mirovaweb.it/); Hawai'i Institute of Geophysics and Planetology (HIGP) - MODVOLC Thermal Alerts System, School of Ocean and Earth Science and Technology (SOEST), Univ. of Hawai'i, 2525 Correa Road, Honolulu, HI 96822, USA (URL: http://modis.higp.hawaii.edu/); Copernicus Browser, Copernicus Data Space Ecosystem, European Space Agency (URL: https://dataspace.copernicus.eu/browser/); IDN Times, Jl. Jend. Gatot Subroto Kav. 27 3rd Floor Kuningan, Jakarta, Indonesia 12950, Status of Karangetang Volcano in Sitaro Islands Increases (URL: https://sulsel.idntimes.com/news/indonesia/savi/status-gunung-api-karangetang-di-kepulauan-sitaro-meningkat?page=all).
Ahyi (United States) — July 2023 Cite this Report
Ahyi
United States
20.42°N, 145.03°E; summit elev. -75 m
All times are local (unless otherwise noted)
Intermittent hydroacoustic signals and discolored plumes during November 2022-June 2023
Ahyi seamount is a large, conical submarine volcano that rises to within 75 m of the ocean surface about 18 km SE of the island of Farallon de Pajaros in the Northern Marianas. The remote location of the seamount has made eruptions difficult to document, but seismic stations installed in the region confirmed an eruption in the vicinity in 2001. No new activity was detected until April-May 2014 when an eruption was detected by NOAA (National Oceanic and Atmospheric Administration) divers, hydroacoustic sensors, and seismic stations (BGVN 42:04). New activity was first detected on 15 November by hydroacoustic sensors that were consistent with submarine volcanic activity. This report covers activity during November 2022 through June 2023 based on daily and weekly reports from the US Geological Survey.
Starting in mid-October, hydroacoustic sensors at Wake Island (2.2 km E) recorded signals consistent with submarine volcanic activity, according to a report from the USGS issued on 15 November 2022. A combined analysis of the hydroacoustic signals and seismic stations located at Guam and Chichijima Island, Japan, suggested that the source of this activity was at or near the Ahyi seamount. After a re-analysis of a satellite image of the area that was captured on 6 November, USGS confirmed that there was no evidence of discoloration at the ocean surface. Few hydroacoustic and seismic signals continued through November, including on 18 November, which USGS suggested signified a decline or pause in unrest. A VONA (Volcano Observatory Notice for Aviation) reported that a discolored water plume was persistently visible in satellite data starting on 18 November (figure 6). Though clouds often obscured clear views of the volcano, another discolored water plume was captured in a satellite image on 26 November. The Aviation Color Code (ACC) was raised to Yellow (the second lowest level on a four-color scale) and the Volcano Alert Level (VAL) was raised to Advisory (the second lowest level on a four-level scale) on 29 November.
During December, occasional detections were recorded on the Wake Island hydrophone sensors and discolored water over the seamount remained visible. During 2-7, 10-12, and 16-31 December possible explosion signals were detected. A small area of discolored water was observed in high-resolution Sentinel-2 satellite images during 1-6 December (figure 7). High-resolution satellite images recorded discolored water plumes on 13 December that originated from the summit region; no observations indicated that activity breached the ocean surface. A possible underwater plume was visible in satellite images on 18 December, and during 19-20 December a definite but diffuse underwater plume located SSE from the main vent was reported. An underwater plume was visible in a satellite image taken on 26 December (figure 7).
Hydrophone sensors continued to detect signals consistent with possible explosions during 1-8 January 2023. USGS reported that the number of detections decreased during 4-5 January. The hydrophone sensors experienced a data outage that started at 0118 on 8 January and continued through 10 January, though according to USGS, possible explosions were recorded prior to the data outage and likely continued during the outage. A discolored water plume originating from the summit region was detected in a partly cloudy satellite image on 8 January. On 11-12 and 15-17 January possible explosion signals were recorded again. One small signal was detected during 22-23 January and several signals were recorded on 25 and 31 January. During 27-31 January a plume of discolored water was observed above the seamount in satellite imagery (figure 8).
Low levels of activity continued during February and March, based on data from pressure sensors on Wake Island. During 1 and 4-6 February activity was reported, and a submarine plume was observed on 4 February (figure 8). Possible explosion signals were detected during 7-8, 10, 13-14, and 24 February. During 1-2 and 3-5 March a plume of discolored water was observed in satellite imagery (figure 8). Almost continuous hydroacoustic signals were detected in remote pressure sensor data on Wake Island 2,270 km E from the volcano during 7-13 March. During 12-13 March water discoloration around the seamount was observed in satellite imagery, despite cloudy weather. By 14 March discolored water extended about 35 km, but no direction was noted. USGS reported that the continuous hydroacoustic signals detected during 13-14 March stopped abruptly on 14 March and no new detections were observed. Three 30 second hydroacoustic detections were reported during 17-19 March, but no activity was visible due to cloudy weather. A data outage was reported during 21-22 March, making pressure sensor data unavailable; a discolored water plume was, however, visible in satellite data. A possible underwater explosion signal was detected by pressure sensors at Wake Island on 26, 29, and 31 March, though the cause and origin of these events were unclear.
Similar low activity continued during April, May, and June. Several signals were detected during 1-3 April in pressure sensors at Wake Island. USGS suggested that these may be related to underwater explosions or earthquakes at the volcano, but no underwater plumes were visible in clear satellite images. The pressure sensors had data outages during 12-13 April and no data were recorded; no underwater plumes were visible in satellite images, although cloudy weather obscured most clear views. Eruptive activity was reported starting at 2210 on 21 May. On 22 May a discolored water plume that extended 4 km was visible in satellite images, though no direction was recorded. During 23-24 May some signals were detected by the underwater pressure sensors. Possible hydroacoustic signals were detected during 2-3 and 6-8 June. Multiple hydroacoustic signals were detected during 9-11 and 16-17 June, although no activity was visible in satellite images. One hydroacoustic signal was detected during 23-24 June, but there was some uncertainty about its association with volcanic activity. A single possible hydroacoustic signal was detected during 30 June to 1 July.
Geologic Background. Ahyi seamount is a large conical submarine volcano that rises to within 75 m of the ocean surface ~18 km SE of the island of Farallon de Pajaros in the northern Marianas. Water discoloration has been observed there, and in 1979 the crew of a fishing boat felt shocks over the summit area, followed by upwelling of sulfur-bearing water. On 24-25 April 2001 an explosive eruption was detected seismically by a station on Rangiroa Atoll, Tuamotu Archipelago. The event was well constrained (+/- 15 km) at a location near the southern base of Ahyi. An eruption in April-May 2014 was detected by NOAA divers, hydroacoustic sensors, and seismic stations.
Information Contacts: US Geological Survey, Volcano Hazards Program (USGS-VHP), 12201 Sunrise Valley Drive, Reston, VA, USA, https://volcanoes.usgs.gov/index.html; Copernicus Browser, Copernicus Data Space Ecosystem, European Space Agency (URL: https://dataspace.copernicus.eu/browser/).
Kadovar (Papua New Guinea) — June 2023 Cite this Report
Kadovar
Papua New Guinea
3.608°S, 144.588°E; summit elev. 365 m
All times are local (unless otherwise noted)
An ash plume and weak thermal anomaly during May 2023
Kadovar is a 2-km-wide island that is the emergent summit of a Bismarck Sea stratovolcano. It lies off the coast of New Guinea, about 25 km N of the mouth of the Sepik River. Prior to an eruption that began in 2018, a lava dome formed the high point of the volcano, filling an arcuate landslide scarp open to the S. Submarine debris-avalanche deposits occur to the S of the island. The current eruption began in January 2018 and has comprised lava effusion from vents at the summit and at the E coast; more recent activity has consisted of ash plumes, weak thermal activity, and gas-and-steam plumes (BGVN 48:02). This report covers activity during February through May 2023 using information from the Darwin Volcanic Ash Advisory Center (VAAC) and satellite data.
Activity during the reporting period was relatively low and mainly consisted of white gas-and-steam plumes that were visible in natural color satellite images on clear weather days (figure 67). According to a Darwin VAAC report, at 2040 on 6 May an ash plume rose to 4.6 km altitude and drifted W; by 2300 the plume had dissipated. MODIS satellite instruments using the MODVOLC thermal algorithm detected a single thermal hotspot on the SE side of the island on 7 May. Weak thermal activity was also detected in a satellite image on the E side of the island on 14 May, accompanied by a white gas-and-steam plume that drifted SE (figure 68).
Geologic Background. The 2-km-wide island of Kadovar is the emergent summit of a Bismarck Sea stratovolcano of Holocene age. It is part of the Schouten Islands, and lies off the coast of New Guinea, about 25 km N of the mouth of the Sepik River. Prior to an eruption that began in 2018, a lava dome formed the high point of the andesitic volcano, filling an arcuate landslide scarp open to the south; submarine debris-avalanche deposits occur in that direction. Thick lava flows with columnar jointing forms low cliffs along the coast. The youthful island lacks fringing or offshore reefs. A period of heightened thermal phenomena took place in 1976. An eruption began in January 2018 that included lava effusion from vents at the summit and at the E coast.
Information Contacts: Darwin Volcanic Ash Advisory Centre (VAAC), Bureau of Meteorology, Northern Territory Regional Office, PO Box 40050, Casuarina, NT 0811, Australia (URL: http://www.bom.gov.au/info/vaac/); Hawai'i Institute of Geophysics and Planetology (HIGP) - MODVOLC Thermal Alerts System, School of Ocean and Earth Science and Technology (SOEST), Univ. of Hawai'i, 2525 Correa Road, Honolulu, HI 96822, USA (URL: http://modis.higp.hawaii.edu/); Copernicus Browser, Copernicus Data Space Ecosystem, European Space Agency (URL: https://dataspace.copernicus.eu/browser/).
San Miguel (El Salvador) — June 2023 Cite this Report
San Miguel
El Salvador
13.434°N, 88.269°W; summit elev. 2130 m
All times are local (unless otherwise noted)
Small gas-and-ash explosions during March and May 2023
San Miguel in El Salvador is a broad, deep crater complex that has been frequently modified by eruptions recorded since the early 16th century and consists of the summit known locally as Chaparrastique. Flank eruptions have produced lava flows that extended to the N, NE, and SE during the 17-19th centuries. The most recent activity has consisted of minor ash eruptions from the summit crater. The current eruption period began in November 2022 and has been characterized by frequent phreatic explosions, gas-and-ash emissions, and sulfur dioxide plumes (BGVN 47:12). This report describes small gas-and-ash explosions during December 2022 through May 2023 based on special reports from the Ministero de Medio Ambiente y Recursos Naturales (MARN).
Activity has been relatively low since the last recorded explosions on 29 November 2022. Seismicity recorded by the San Miguel Volcano Station (VSM) located on the N flank at 1.7 km elevation had decreased by 7 December. Sulfur dioxide gas measurements taken with DOAS (Differential Optical Absorption Spectroscopy) mobile equipment were below typical previously recorded values: 300 tons per day (t/d). During December, small explosions were recorded by the seismic network and manifested as gas-and-steam emissions.
Gas-and-ash explosions in the crater occurred during January 2023, which were recorded by the seismic network. Sulfur dioxide values remained low, between 300-400 t/d through 10 March. At 0817 on 14 January a gas-and-ash emission was visible in webcam images, rising just above the crater rim. Some mornings during February, small gas-and-steam plumes were visible in the crater. On 7 March at 2252 MARN noted an increase in degassing from the central crater; gas emissions were constantly observed through the early morning hours on 8 March. During the early morning of 8 March through the afternoon on 9 March, 12 emissions were registered, some accompanied by ash. The last gas-and-ash emission was recorded at 1210 on 9 March; very fine ashfall was reported in El Tránsito (10 km S), La Morita (6 km W), and La Piedrita (3 km W). The smell of sulfur was reported in Piedra Azul (5 km SW). On 16 March MARN reported that gas-and-steam emissions decreased.
Low degassing and very low seismicity were reported during April; no explosions have been detected between 9 March and 27 May. The sulfur dioxide emissions remained between 350-400 t/d; during 13-20 April sulfur dioxide values fluctuated between 30-300 t/d. Activity remained low through most of May; on 23 May seismicity increased. An explosion was detected at 1647 on 27 May generated a gas-and-ash plume that rose 700 m high (figure 32); a decrease in seismicity and gas emissions followed. The DOAS station installed on the W flank recorded sulfur dioxide values that reached 400 t/d on 27 May; subsequent measurements showed a decrease to 268 t/d on 28 May and 100 t/d on 29 May.
Geologic Background. The symmetrical cone of San Miguel, one of the most active volcanoes in El Salvador, rises from near sea level to form one of the country's most prominent landmarks. A broad, deep, crater complex that has been frequently modified by eruptions recorded since the early 16th century caps the truncated unvegetated summit, also known locally as Chaparrastique. Flanks eruptions of the basaltic-andesitic volcano have produced many lava flows, including several during the 17th-19th centuries that extended to the N, NE, and SE. The SE-flank flows are the largest and form broad, sparsely vegetated lava fields crossed by highways and a railroad skirting the base of the volcano. Flank vent locations have migrated higher on the edifice during historical time, and the most recent activity has consisted of minor ash eruptions from the summit crater.
Information Contacts: Ministero de Medio Ambiente y Recursos Naturales (MARN), Km. 5½ Carretera a Nueva San Salvador, Avenida las Mercedes, San Salvador, El Salvador (URL: http://www.snet.gob.sv/ver/vulcanologia).
Semisopochnoi (United States) — June 2023 Cite this Report
Semisopochnoi
United States
51.93°N, 179.58°E; summit elev. 1221 m
All times are local (unless otherwise noted)
Occasional explosions, ash deposits, and gas-and-steam plumes during December 2022-May 2023
Semisopochnoi is located in the western Aleutians, is 20-km-wide at sea level, and contains an 8-km-wide caldera. The three-peaked Mount Young (formerly Cerberus) was constructed within the caldera during the Holocene. Each of these peaks contains a summit crater; the lava flows on the N flank appear younger than those on the S side. The current eruption period began in early February 2021 and has more recently consisted of intermittent explosions and ash emissions (BGVN 47:12). This report updates activity during December 2022 through May 2023 using daily, weekly, and special reports from the Alaska Volcano Observatory (AVO). AVO monitors the volcano using local seismic and infrasound sensors, satellite data, web cameras, and remote infrasound and lightning networks.
Activity during most of December 2022 was relatively quiet; according to AVO no eruptive or explosive activity was observed since 7 November 2022. Intermittent tremor and occasional small earthquakes were observed in geophysical data. Continuous gas-and-steam emissions were observed from the N crater of Mount Young in webcam images on clear weather days (figure 25). On 24 December, there was a slight increase in earthquake activity and several small possible explosion signals were detected in infrasound data. Eruptive activity resumed on 27 December at the N crater of Mount Young; AVO issued a Volcano Activity Notice (VAN) that reported minor ash deposits on the flanks of Mount Young that extended as far as 1 km from the vent, according to webcam images taken during 27-28 December (figure 26). No ash plumes were observed in webcam or satellite imagery, but a persistent gas-and-steam plume that might have contained some ash rose to 1.5 km altitude. As a result, AVO raised the Aviation Color Code (ACC) to Orange (the second highest level on a four-color scale) and the Volcano Alert Level (VAL) to Watch (the second highest level on a four-level scale). Possible explosions were detected during 21 December 2022 through 1 January 2023 and seismic tremor was recorded during 30-31 December.
During January 2023 eruptive activity continued at the active N crater of Mount Young. Minor ash deposits were observed on the flanks, extending about 2 km SSW, based on webcam images from 1 and 3 January. A possible explosion occurred during 1-2 January based on elevated seismicity recorded on local seismometers and an infrasound signal recorded minutes later by an array at Adak. Though no ash plumes were observed in webcam or satellite imagery, a persistent gas-and-steam plume rose to 1.5 km altitude that might have carried minor traces of ash. Ash deposits were accompanied by periods of elevated seismicity and infrasound signals from the local geophysical network, which AVO reported were likely due to weak explosive activity. Low-level explosive activity was also detected during 2-3 January, with minor gas-and-steam emissions and a new ash deposit that was visible in webcam images. Low-level explosive activity was detected in geophysical data during 4-5 January, with elevated seismicity and infrasound signals observed on local stations. Volcanic tremor was detected during 7-9 January and very weak explosive activity was detected in seismic and infrasound data on 9 January. Weak seismic and infrasound signals were recorded on 17 January, which indicated minor explosive activity, but no ash emissions were observed in clear webcam images; a gas-and-steam plume continued to rise to 1.5 km altitude. During 29-30 January, ash deposits near the summit were observed on fresh snow, according to webcam images.
The active N cone at Mount Young continued to produce a gas-and-steam plume during February, but no ash emissions or explosive events were detected. Seismicity remained elevated with faint tremor during early February. Gas-and-steam emissions from the N crater were observed in clear webcam images on 11-13 and 16 February; no explosive activity was detected in seismic, infrasound, or satellite data. Seismicity has also decreased, with no significant seismic tremor observed since 25 January. Therefore, the ACC was lowered to Yellow (the second lowest level on a four-color scale) and the VAL was lowered to Advisory (the second lowest level on a four-color scale) on 22 February.
Gas-and-steam emissions persisted during March from the N cone of Mount Young, based on clear webcam images. A few brief episodes of weak tremor were detected in seismic data, although seismicity decreased over the month. A gas-and-steam plume detected in satellite data extended 150 km on 18 March. Low-level ash emissions from the N cone at Mount Young were observed in several webcam images during 18-19 March, in addition to small explosions and volcanic tremor. The ACC was raised to Orange and the VAL increased to Watch on 19 March. A small explosion was detected in seismic and infrasound data on 21 March.
Low-level unrest continued during April, although cloudy weather often obscured views of the summit; periods of seismic tremor and local earthquakes were recorded. During 3-4 April a gas-and-steam plume was visible traveling more than 200 km overnight; no ash was evident in the plume, according to AVO. A gas-and-steam plume was observed during 4-6 April that extended 400 km but did not seem to contain ash. Small explosions were detected in seismic and infrasound data on 5 April. Occasional clear webcam images showed continuing gas-and-steam emissions rose from Mount Young, but no ash deposits were observed on the snow. On 19 April small explosions and tremor were detected in seismic and infrasound data. A period of seismic tremor was detected during 22-25 April, with possible weak explosions on 25 April. Ash deposits were visible near the crater rim, but it was unclear if these deposits were recent or due to older deposits.
Occasional small earthquakes were recorded during May, but there were no signs of explosive activity seen in geophysical data. Gas-and-steam emissions continued from the N crater of Mount Young, based on webcam images, and seismicity remained slightly elevated. A new, light ash deposit was visible during the morning of 5 May on fresh snow on the NW flank of Mount Young. During 10 May periods of volcanic tremor were observed. The ACC was lowered to Yellow and the VAL to Advisory on 17 May due to no additional evidence of activity.
Geologic Background. Semisopochnoi, the largest subaerial volcano of the western Aleutians, is 20 km wide at sea level and contains an 8-km-wide caldera. It formed as a result of collapse of a low-angle, dominantly basaltic volcano following the eruption of a large volume of dacitic pumice. The high point of the island is Anvil Peak, a double-peaked late-Pleistocene cone that forms much of the island's northern part. The three-peaked Mount Cerberus (renamed Mount Young in 2023) was constructed within the caldera during the Holocene. Each of the peaks contains a summit crater; lava flows on the N flank appear younger than those on the south side. Other post-caldera volcanoes include the symmetrical Sugarloaf Peak SSE of the caldera and Lakeshore Cone, a small cinder cone at the edge of Fenner Lake in the NE part of the caldera. Most documented eruptions have originated from Young, although Coats (1950) considered that both Sugarloaf and Lakeshore Cone could have been recently active.
Information Contacts: Alaska Volcano Observatory (AVO), a cooperative program of a) U.S. Geological Survey, 4200 University Drive, Anchorage, AK 99508-4667 USA (URL: https://avo.alaska.edu/), b) Geophysical Institute, University of Alaska, PO Box 757320, Fairbanks, AK 99775-7320, USA, and c) Alaska Division of Geological & Geophysical Surveys, 794 University Ave., Suite 200, Fairbanks, AK 99709, USA (URL: http://dggs.alaska.gov/).
Ebeko
Russia
50.686°N, 156.014°E; summit elev. 1103 m
All times are local (unless otherwise noted)
Continued explosions, ash plumes, and ashfall during October 2022-May 2023
Ebeko, located on the N end of Paramushir Island in the Kuril Islands, consists of three summit craters along a SSW-NNE line at the northern end of a complex of five volcanic cones. Eruptions date back to the late 18th century and have been characterized as small-to-moderate explosions from the summit crater, accompanied by intense fumarolic activity. The current eruption period began in June 2022 and has recently consisted of frequent explosions, ash plumes, and thermal activity (BGVN 47:10). This report covers similar activity during October 2022 through May 2023, based on information from the Kamchatka Volcanic Eruptions Response Team (KVERT) and satellite data.
Activity during October consisted of explosive activity, ash plumes, and occasional thermal anomalies. Visual data by volcanologists from Severo-Kurilsk showed explosions producing ash clouds up to 2.1-3 km altitude which drifted E, N, NE, and SE during 1-8, 10, 16, and 18 October. KVERT issued several Volcano Observatory Notices for Aviation (VONA) on 7, 13-15, and 27 October 2022, stating that explosions generated ash plumes that rose to 2.3-4 km altitude and drifted 5 km E, NE, and SE. Ashfall was reported in Severo-Kurilsk (Paramushir Island, about 7 km E) on 7 and 13 October. Satellite data showed a thermal anomaly over the volcano on 15-16 October. Visual data showed ash plumes rising to 2.5-3.6 km altitude on 22, 25-29, and 31 October and moving NE due to constant explosions.
Similar activity continued during November, with explosions, ash plumes, and ashfall occurring. KVERT issued VONAs on 1-2, 4, 6-7, 9, 13, and 16 November that reported explosions and resulting ash plumes that rose to 1.7-3.6 km altitude and drifted 3-5 km SE, ESE, E, and NE. On 1 November ash plumes extended as far as 110 km SE. On 5, 8, 12, and 24-25 November explosions and ash plumes rose to 2-3.1 km altitude and drifted N and E. Ashfall was observed in Severo-Kurilsk on 7 and 16 November. A thermal anomaly was visible during 1-4, 16, and 20 November. Explosions during 26 November rose as high as 2.7 km altitude and drifted NE (figure 45).
Explosions and ash plumes continued to occur in December. During 1-2 and 4 December volcanologists from Severo-Kurilsk observed explosions that sent ash to 1.9-2.5 km altitude and drifted NE and SE (figure 46). VONAs were issued on 5, 9, and 16 December reporting that explosions generated ash plumes rising to 1.9 km, 2.6 km, and 2.4 km altitude and drifted 5 km SE, E, and NE, respectively. A thermal anomaly was visible in satellite imagery on 16 December. On 18 and 27-28 December explosions produced ash plumes that rose to 2.5 km altitude and drifted NE and SE. On 31 December an ash plume rose to 2 km altitude and drifted NE.
Explosions continued during January 2023, based on visual observations by volcanologists from Severo-Kurilsk. During 1-7 January explosions generated ash plumes that rose to 4 km altitude and drifted NE, E, W, and SE. According to VONAs issued by KVERT on 2, 4, 10, and 23 January, explosions produced ash plumes that rose to 2-4 km altitude and drifted 5 km N, NE, E, and ENE; the ash plume that rose to 4 km altitude occurred on 10 January (figure 47). Satellite data showed a thermal anomaly during 3-4, 10, 13, 16, 21, 22, and 31 January. KVERT reported that an ash cloud on 4 January moved 12 km NE. On 6 and 9-11 January explosions sent ash plumes to 4.5 km altitude and drifted W and ESE. On 13 January an ash plume rose to 3 km altitude and drifted SE. During 20-24 January ash plumes from explosions rose to 3.7 km altitude and drifted SE, N, and NE. On 21 January the ash plume drifted as far as 40 km NE. During 28-29 and 31 January and 1 February ash plumes rose to 4 km altitude and drifted NE.
During February, explosions, ash plumes, and ashfall were reported. During 1, 4-5 and 7-8 February explosions generated ash plumes that rose to 4.5 km altitude and drifted E and NE; ashfall was observed on 5 and 8 February. On 6 February an explosion produced an ash plume that rose to 3 km altitude and drifted 7 km E, causing ashfall in Severo-Kurilsk. A thermal anomaly was visible in satellite data on 8, 9, 13, and 21 February. Explosions on 9 and 12-13 February produced ash plumes that rose to 4 km altitude and drifted E and NE; the ash cloud on 12 February extended as far as 45 km E. On 22 February explosions sent ash to 3 km altitude that drifted E. During 24 and 26-27 February ash plumes rose to 4 km altitude and drifted E. On 28 February an explosion sent ash to 2.5-3 km altitude and drifted 5 km E; ashfall was observed in Severo-Kurilsk.
Activity continued during March; visual observations showed that explosions generated ash plumes that rose to 3.6 km altitude on 3, 5-7, and 9-12 March and drifted E, NE, and NW. Thermal anomalies were visible on 10, 13, and 29-30 March in satellite imagery. On 18, 21-23, 26, and 29-30 March explosions produced ash plumes that rose to 2.8 km altitude and drifted NE and E; the ash plumes during 22-23 March extended up to 76 km E. A VONA issued on 21 March reported an explosion that produced an ash plume that rose to 2.8 km altitude and drifted 5 km E. Another VONA issued on 23 March reported that satellite data showed an ash plume rising to 3 km altitude and drifted 14 km E.
Explosions during April continued to generate ash plumes. On 1 and 4 April an ash plume rose to 2.8-3.5 km altitude and drifted SE and NE. A thermal anomaly was visible in satellite imagery during 1-6 April. Satellite data showed ash plumes and clouds rising to 2-3 km altitude and drifting up to 12 km SW and E on 3 and 6 April (figure 48). KVERT issued VONAs on 3, 5, 14, 16 April describing explosions that produced ash plumes rising to 3 km, 3.5 km, 3.5 km, and 3 km altitude and drifting 5 km S, 5 km NE and SE, 72 km NNE, and 5 km NE, respectively. According to satellite data, the resulting ash cloud from the explosion on 14 April was 25 x 7 km in size and drifted 72-104 km NNE during 14-15 April. According to visual data by volcanologists from Severo-Kurilsk explosions sent ash up to 3.5 km altitude that drifted NE and E during 15-16, 22, 25-26, and 29 April.
The explosive eruption continued during May. Explosions during 3-4, 6-7, and 9-10 May generated ash plumes that rose to 4 km altitude and drifted SW and E. Satellite data showed a thermal anomaly on 3, 9, 13-14, and 24 May. During 12-16, 23-25, and 27-28 May ash plumes rose to 3.5 km altitude and drifted in different directions due to explosions. Two VONA notices were issued on 16 and 25 May, describing explosions that generated ash plumes rising to 3 km and 3.5 km altitude, respectively and extending 5 km E. The ash cloud on 25 May drifted 75 km SE.
Thermal activity in the summit crater, occasionally accompanied by ash plumes and ash deposits on the SE and E flanks due to frequent explosions, were visible in infrared and true color satellite images (figure 49).
Geologic Background. The flat-topped summit of the central cone of Ebeko volcano, one of the most active in the Kuril Islands, occupies the northern end of Paramushir Island. Three summit craters located along a SSW-NNE line form Ebeko volcano proper, at the northern end of a complex of five volcanic cones. Blocky lava flows extend west from Ebeko and SE from the neighboring Nezametnyi cone. The eastern part of the southern crater contains strong solfataras and a large boiling spring. The central crater is filled by a lake about 20 m deep whose shores are lined with steaming solfataras; the northern crater lies across a narrow, low barrier from the central crater and contains a small, cold crescentic lake. Historical activity, recorded since the late-18th century, has been restricted to small-to-moderate explosive eruptions from the summit craters. Intense fumarolic activity occurs in the summit craters, on the outer flanks of the cone, and in lateral explosion craters.
Information Contacts: Kamchatka Volcanic Eruptions Response Team (KVERT), Far Eastern Branch, Russian Academy of Sciences, 9 Piip Blvd., Petropavlovsk-Kamchatsky, 683006, Russia (URL: http://www.kscnet.ru/ivs/kvert/); MIROVA (Middle InfraRed Observation of Volcanic Activity), a collaborative project between the Universities of Turin and Florence (Italy) supported by the Centre for Volcanic Risk of the Italian Civil Protection Department (URL: http://www.mirovaweb.it/); Copernicus Browser, Copernicus Data Space Ecosystem, European Space Agency (URL: https://dataspace.copernicus.eu/browser/).
Home Reef
Tonga
18.992°S, 174.775°W; summit elev. -10 m
All times are local (unless otherwise noted)
Discolored plumes continued during November 2022-April 2023
Home Reef is a submarine volcano located in the central Tonga islands between Lateiki (Metis Shoal) and Late Island. The first recorded eruption occurred in the mid-19th century, when an ephemeral island formed. An eruption in 1984 produced a 12-km-high eruption plume, a large volume of floating pumice, and an ephemeral island 500 x 1,500 m wide, with cliffs 30-50 m high that enclosed a water-filled crater. Another island-forming eruption in 2006 produced widespread pumice rafts that drifted as far as Australia; by 2008 the island had eroded below sea level. The previous eruption occurred during October 2022 and was characterized by a new island-forming eruption, lava effusion, ash plumes, discolored water, and gas-and-steam plumes (BGVN 47:11). This report covers discolored water plumes during November 2022 through April 2023 using satellite data.
Discolored plumes continued during the reporting period and were observed in true color satellite images on clear weather days. Satellite images show light green-yellow discolored water extending W on 8 and 28 November 2022 (figure 31), and SW on 18 November. Light green-yellow plumes extended W on 3 December, S on 13 December, SW on 18 December, and W and S on 23 December (figure 31). On 12 January 2023 discolored green-yellow plumes extended to the NE, E, SE, and N. The plume moved SE on 17 January and NW on 22 January. Faint discolored water in February was visible moving NE on 1 February. A discolored plume extended NW on 8 and 28 March and NW on 13 March (figure 31). During April, clear weather showed green-blue discolored plumes moving S on 2 April, W on 7 April, and NE and S on 12 April. A strong green-yellow discolored plume extended E and NE on 22 April for several kilometers (figure 31).
Geologic Background. Home Reef, a submarine volcano midway between Metis Shoal and Late Island in the central Tonga islands, was first reported active in the mid-19th century, when an ephemeral island formed. An eruption in 1984 produced a 12-km-high eruption plume, large amounts of floating pumice, and an ephemeral 500 x 1,500 m island, with cliffs 30-50 m high that enclosed a water-filled crater. In 2006 an island-forming eruption produced widespread dacitic pumice rafts that drifted as far as Australia. Another island was built during a September-October 2022 eruption.
Information Contacts: Copernicus Browser, Copernicus Data Space Ecosystem, European Space Agency (URL: https://dataspace.copernicus.eu/browser/).
Ambae
Vanuatu
15.389°S, 167.835°E; summit elev. 1496 m
All times are local (unless otherwise noted)
New lava flow, ash plumes, and sulfur dioxide plumes during February-May 2023
Ambae, also known as Aoba, is a large basaltic shield volcano in Vanuatu. A broad pyroclastic cone containing three crater lakes (Manaro Ngoru, Voui, and Manaro Lakua) is located at the summit within the youngest of at least two nested calderas. Periodic phreatic and pyroclastic explosions have been reported since the 16th century. A large eruption more than 400 years ago resulted in a volcanic cone within the summit crater that is now filled by Lake Voui; the similarly sized Lake Manaro fills the western third of the caldera. The previous eruption ended in August 2022 that was characterized by gas-and-steam and ash emissions and explosions of wet tephra (BGVN 47:10). This report covers a new eruption during February through May 2023 that consisted of a new lava flow, ash plumes, and sulfur dioxide emissions, using information from the Vanuatu Meteorology and Geo-Hazards Department (VMGD) and satellite data.
During the reporting period, the Alert Level remained at a 2 (on a scale of 0-5), which has been in place since December 2021. Activity during October 2022 through March 2023 remained relatively low and mostly consisted of gas-and-steam emissions in Lake Voui. VMGD reported that at 1300 on 15 November a satellite image captured a strong amount of sulfur dioxide rising above the volcano (figure 99), and that seismicity slightly increased. The southern and northern part of the island reported a strong sulfur dioxide smell and heard explosions. On 20 February 2023 a gas-and-ash plume rose 1.3 km above the summit and drifted SSW, according to a webcam image (figure 100). Gas-and-steam and possibly ash emissions continued on 23 February and volcanic earthquakes were recorded by the seismic network.
During April, volcanic earthquakes and gas-and-steam and ash emissions were reported from the cone in Lake Voui. VMGD reported that activity increased during 5-7 April; high gas-and-steam and ash plumes were visible, accompanied by nighttime incandescence. According to a Wellington VAAC report, a low-level ash plume rose as high as 2.5 km above the summit and drifted W and SW on 5 April, based on satellite imagery. Reports in Saratamata stated that a dark ash plume drifted to the WSW, but no loud explosion was heard. Webcam images from 2100 showed incandescence above the crater and reflected in the clouds. According to an aerial survey, field observations, and satellite data, water was no longer present in the lake. A lava flow was reported effusing from the vent and traveling N into the dry Lake Voui, which lasted three days. The next morning at 0745 on 6 April a gas-and-steam and ash plume rose 5.4 km above the summit and drifted ESE, based on information from VMGD (figure 101). The Wellington VAAC also reported that light ashfall was observed on the island. Intermittent gas-and-steam and ash emissions were visible on 7 April, some of which rose to an estimated 3 km above the summit and drifted E. Webcam images during 0107-0730 on 7 April showed continuing ash emissions. A gas-and-steam and ash plume rose 695 m above the summit crater at 0730 on 19 April and drifted ESE, based on a webcam image (figure 102).
According to visual and infrared satellite data, water was visible in Lake Voui as late as 24 March 2023 (figure 103). The vent in the caldera showed a gas-and-steam plume drifted SE. On 3 April thermal activity was first detected, accompanied by a gas-and-ash plume that drifted W (figure 103). The lava flow moved N within the dry lake and was shown cooling by 8 April. By 23 April much of the water in the lake had returned. Occasional sulfur dioxide plumes were detected by the TROPOMI instrument on the Sentinel-5P satellite that exceeded 2 Dobson Units (DU) and drifted in different directions (figure 104).
Geologic Background. The island of Ambae, also known as Aoba, is a massive 2,500 km3 basaltic shield that is the most voluminous volcano of the New Hebrides archipelago. A pronounced NE-SW-trending rift zone with numerous scoria cones gives the 16 x 38 km island an elongated form. A broad pyroclastic cone containing three crater lakes (Manaro Ngoru, Voui, and Manaro Lakua) is located at the summit within the youngest of at least two nested calderas, the largest of which is 6 km in diameter. That large central edifice is also called Manaro Voui or Lombenben volcano. Post-caldera explosive eruptions formed the summit craters about 360 years ago. A tuff cone was constructed within Lake Voui (or Vui) about 60 years later. The latest known flank eruption, about 300 years ago, destroyed the population of the Nduindui area near the western coast.
Information Contacts: Geo-Hazards Division, Vanuatu Meteorology and Geo-Hazards Department (VMGD), Ministry of Climate Change Adaptation, Meteorology, Geo-Hazards, Energy, Environment and Disaster Management, Private Mail Bag 9054, Lini Highway, Port Vila, Vanuatu (URL: http://www.vmgd.gov.vu/, https://www.facebook.com/VanuatuGeohazardsObservatory/); Wellington Volcanic Ash Advisory Centre (VAAC), Meteorological Service of New Zealand Ltd (MetService), PO Box 722, Wellington, New Zealand (URL: http://www.metservice.com/vaac/, http://www.ssd.noaa.gov/VAAC/OTH/NZ/messages.html); MIROVA (Middle InfraRed Observation of Volcanic Activity), a collaborative project between the Universities of Turin and Florence (Italy) supported by the Centre for Volcanic Risk of the Italian Civil Protection Department (URL: http://www.mirovaweb.it/); Global Sulfur Dioxide Monitoring Page, Atmospheric Chemistry and Dynamics Laboratory, NASA Goddard Space Flight Center (NASA/GSFC), 8800 Greenbelt Road, Goddard, Maryland, USA (URL: https://so2.gsfc.nasa.gov/); Copernicus Browser, Copernicus Data Space Ecosystem, European Space Agency (URL: https://dataspace.copernicus.eu/browser/).
Search Bulletin Archive by Publication Date
Select a month and year from the drop-downs and click "Show Issue" to have that issue displayed in this tab.
The default month and year is the latest issue available.
Bulletin of the Global Volcanism Network - Volume 23, Number 05 (May 1998)
Managing Editor: Richard Wunderman
Bezymianny (Russia)
Slowly growing hot spot seen on satellite image
Deception Island (Antarctica)
Stable conditions, 35 hours of tremor
Galeras (Colombia)
Continuing seismicity includes tornillo events
Manam (Papua New Guinea)
Short-lived Vulcanian episode unsettles month of mild activity
Pacaya (Guatemala)
May eruption shrouds capital in ash, harms crops, and spreads NW
Popocatepetl (Mexico)
Moderate activity continues, smoke hinders observation
Rabaul (Papua New Guinea)
Tripling of volcanic events; ash plumes
Sabancaya (Peru)
Summit activity, ice observed on visit in May
Sheveluch (Russia)
Satellite imagery detects large ash plume
Soufriere Hills (United Kingdom)
Low activity; deformation and volume measurements
St. Helens (United States)
Sudden rise in earthquake activity in May
Ukinrek Maars (United States)
Earthquake swarm decreases in rate and intensity
Bezymianny
Russia
55.972°N, 160.595°E; summit elev. 2882 m
All times are local (unless otherwise noted)
Slowly growing hot spot seen on satellite image
During 28-30 May, a fumarolic plume was seen rising to 50-300 m above the volcano and moving 5 km E. Visual observations made on 28 May indicated color changes in the fumarolic plume suggesting an increase in gas emission.
Satellite images of Bezymianny made during 1-10 June, when not obscured by clouds, indicated a persistent and slowly growing hot-spot more than 5 km2 in size. This thermal anomaly persisted until late June. It was similar to that observed shortly before the 5 December 1997 eruption (BGVN 22:11), which sent a short-lived eruption plume to over 9 km above sea level. It likely indicates that the summit lava dome is growing again and may be subject to a sudden partial collapse similar to the 5 December event. KVERT changed the level of concern color code to yellow-alert and will monitor the situation closely.
Seismicity during 1-10 June was at background levels. No seismicity was reported during the next three weeks. Fumarolic plumes were seen rising 100 to 800 m and moving up to 10 km to the SE and S during 9-11, 17, and 19-21 June.
Geologic Background. The modern Bezymianny, much smaller than its massive neighbors Kamen and Kliuchevskoi on the Kamchatka Peninsula, was formed about 4,700 years ago over a late-Pleistocene lava-dome complex and an edifice built about 11,000-7,000 years ago. Three periods of intensified activity have occurred during the past 3,000 years. The latest period, which was preceded by a 1,000-year quiescence, began with the dramatic 1955-56 eruption. This eruption, similar to that of St. Helens in 1980, produced a large open crater that was formed by collapse of the summit and an associated lateral blast. Subsequent episodic but ongoing lava-dome growth, accompanied by intermittent explosive activity and pyroclastic flows, has largely filled the 1956 crater.
Information Contacts: Olga Chubarova and Vladimir Kirianov, Kamchatka Volcanic Eruptions Response Team (KVERT), Institute of Volcanic Geology and Geochemistry, Piip Ave. 9, Petropavlovsk-Kamchatsky, 683006, Russia; Tom Miller, Alaska Volcano Observatory (AVO), a cooperative program of a) U.S. Geological Survey, 4200 University Drive, Anchorage, AK 99508-4667, USA (URL: http://www.avo.alaska.edu/), b) Geophysical Institute, University of Alaska, PO Box 757320, Fairbanks, AK 99775-7320, USA, and c) Alaska Division of Geological & Geophysical Surveys, 794 University Ave., Suite 200, Fairbanks, AK 99709, USA.
Deception Island (Antarctica) — May 1998 Cite this Report
Deception Island
Antarctica
62.9567°S, 60.6367°W; summit elev. 602 m
All times are local (unless otherwise noted)
Stable conditions, 35 hours of tremor
A Deception Volcano Observatory team has visited the island every austral summer since 1986. In comparison with measurements made during 1996-1997, the temperatures of fumaroles and hot soils generally remained stable: 96-98°C in Fumarole Bay, 64°C in Whaler's Bay, 43°C in Telefon Bay, and 60°C in Pendulum Cove. At Murature Point an increase of more than 20°C produced greater bubbling under the sea, and a large quantity of dead (boiled) krill at the shoreline.
Fumarolic gases were mainly composed of CO2 and H2S, similar to previous years. SO2 was not detected.
Seismicity was monitored with a digital seismic array having 16-bit dynamic range. The array included 6 vertical-component geophones (Mark L25B) located near the Spanish Antarctic Station Gabriel de Castilla (figure 12). Figure 13 shows seismic data collected from 18 December 1997 to 24 February 1998. A significant component of the seismicity was volcanic tremor of a few minutes to several hours duration totaling 35 hours over the reporting period. Also recorded were 72 hybrid events, 291 long-period events, 12 short-period events, and some regional events generated at 30-100 km distance. Recorded seismicity during this period was greater in both energy and number than in previous years.
Geologic Background. Ring-shaped Deception Island, at the SW end of the South Shetland Islands, NE of Graham Land Peninsula, was constructed along the axis of the Bransfield Rift spreading center. A narrow passageway named Neptunes Bellows provides an entrance to a natural harbor within the 8.5 x 10 km caldera that was utilized as an Antarctic whaling station. Numerous vents along ring fractures circling the low 14-km-wide island have been reported active for more than 200 years. Maars line the shores of 190-m-deep Port Foster caldera bay. Among the largest of these maars is 1-km-wide Whalers Bay, at the entrance to the harbor. Eruptions during the past 8,700 years have been dated from ash layers in lake sediments on the Antarctic Peninsula and neighboring islands.
Information Contacts: C. Risso, Observatorio Volcanológico Decepción, Instituto Antártico Argentino-UBA, Cerrito 1248 (1010) Buenos Aires, Argentina; A. García, R. Abella, and J. Peña, Dpto. Volcanologia, Museo Nacional de Ciencias Naturales-CSIS, José Guiterrez Abascal 2, 28006 Madrid-Spain; E. Vélez, Instituto de Astronomía y Geodesia-CSIS, Madrid-Spain; F. Navarro, Escuela Superior de Ingenieros de Telecomunicaciones-U.P.M., Madrid, Spain.
Galeras
Colombia
1.22°N, 77.37°W; summit elev. 4276 m
All times are local (unless otherwise noted)
Continuing seismicity includes tornillo events
Seismicity continued at low levels around Galeras during March and April. Over this period 92 volcano-tectonic (VT) earthquakes were located; of these, 53 were in the area called the North Source (dashed box in figure 88). On 16 March at 2124 (GMT) a VT event with a coda magnitude of 2.2 was felt in Pasto City and other towns in the area. The event was centered in the North Source 2 km N of the crater at a depth of 5 km below the summit. The most energetic VT event outside of the North Source occurred on 29 April. That event struck SW of the crater with a coda magnitude of 2.1 and a depth of 6.5 km.
Another aspect of seismicity during March and April was the continuation of Long Period (LP) events called Tornillos. Tornillo events characteristically have quasi-monochromatic wave-forms with slowly decaying coda values and hence leave a seismic record that looks like the threads of a screw. A record 38 such events have been recorded since November 1997 (BGVN 22:09 and 22:12). The last Tornillo was recorded 10 April.
On 19 April an event similar to spasmodic tremor was recorded. The cause was mud flow along the Azufral River, which runs west from the summit, resulting from heavy rain on volcanic deposits. The event lasted for about 1 hour.
Two electronic tiltmeters, located at the summit and on the E flank (figure 89), remained stable with minimum fluctuations during the period. Fumarole temperature, hot springs pH, radon, and gas-emission measurements showed no significant changes with respect to previous months. The Galeras Seismological Network monitors the volcano with five short-period and two broad-band telemeters, which are part of a cooperative project between OVP-INGEOMINAS (see below) and the German Federal Institute for Geosciences and Natural Resources.
Geologic Background. Galeras, a stratovolcano with a large breached caldera located immediately west of the city of Pasto, is one of Colombia's most frequently active volcanoes. The dominantly andesitic complex has been active for more than 1 million years, and two major caldera collapse eruptions took place during the late Pleistocene. Long-term extensive hydrothermal alteration has contributed to large-scale edifice collapse on at least three occasions, producing debris avalanches that swept to the west and left a large open caldera inside which the modern cone has been constructed. Major explosive eruptions since the mid-Holocene have produced widespread tephra deposits and pyroclastic flows that swept all but the southern flanks. A central cone slightly lower than the caldera rim has been the site of numerous small-to-moderate eruptions since the time of the Spanish conquistadors.
Information Contacts: Pablo Chamorro and Diego Gomez Martinez, Observatorio Vulcanologico y Sismologico de Pasto (OVP), INGEOMINAS, Carrera 31, No. 18-07 Parque Infantil, PO Box 1795, Pasto, Colombia (URL: https://www2.sgc.gov.co/volcanes/index.html).
Manam (Papua New Guinea) — May 1998 Cite this Report
Manam
Papua New Guinea
4.08°S, 145.037°E; summit elev. 1807 m
All times are local (unless otherwise noted)
Short-lived Vulcanian episode unsettles month of mild activity
Mild activity from Manam's two summit craters continued throughout May. Emissions at both Southern and Main craters chiefly consisted of white vapors released at weak to moderately high rates.
An hour-long Vulcanian episode occurred on 21 May. At 1300 a single large explosion at Southern crater produced a gray-brown ash cloud that rose ~ 500 m above the crater, followed by occasional gray ash emissions at 3-5 minute intervals. The ash clouds drifted to the SE of the island leaving a fine ashfall in its wake. There was no visible glow at night.
Seismicity remained at low levels. From 1,100 to 1,400 low-frequency events of very low amplitudes were recorded daily. The water-tube tiltmeter at Tabele Observatory, 4 km SW of the summit, showed an inflation of 2 µrad prior to the Vulcanian phase of 21 May, which remained to the end the month.
Geologic Background. The 10-km-wide island of Manam, lying 13 km off the northern coast of mainland Papua New Guinea, is one of the country's most active volcanoes. Four large radial valleys extend from the unvegetated summit of the conical basaltic-andesitic stratovolcano to its lower flanks. These valleys channel lava flows and pyroclastic avalanches that have sometimes reached the coast. Five small satellitic centers are located near the island's shoreline on the northern, southern, and western sides. Two summit craters are present; both are active, although most observed eruptions have originated from the southern crater, concentrating eruptive products during much of the past century into the SE valley. Frequent eruptions, typically of mild-to-moderate scale, have been recorded since 1616. Occasional larger eruptions have produced pyroclastic flows and lava flows that reached flat-lying coastal areas and entered the sea, sometimes impacting populated areas.
Information Contacts: Ben Talai and H. Patia, RVO.
Pacaya
Guatemala
14.382°N, 90.601°W; summit elev. 2569 m
All times are local (unless otherwise noted)
May eruption shrouds capital in ash, harms crops, and spreads NW
Pacaya erupted unusually vigorously on 20 May. As a result, ash falling in the adjacent highlands damaged crops; ash falling to the N choked the capital and its international airport; and ash located at about 10 km altitude entered the Gulf of Mexico and joined smoke from widespread forest fires. An airplane on final approach to landing at the Guatemala City airport hit ejecta, sustaining damage but landing without incident.
The outburst's greatest intensity occurred during the hours 1205-1900. For 30 hours prior to this outburst, relative quiet prevailed with the volcano generally emitting ash-bearing explosions of brown to coffee-brown color and very little incandescent lava. Beginning around 0930, explosions became continuous, and they proceeded to squirt and splatter abundant lava E and N of the active crater (MacKenney Crater).
An initial, higher-intensity phase began before noon, sending a gray ash column 800 m high. Such columns later reached roughly 1.5-2.0 km above the crater. The eruption was described in Spanish in a series of INSIVUMEH reports. Their update at 1400 on 20 May stated that ash with grain sizes up to 3-7 mm fell on Guatemala City (the capital), the center of which lies 30 km N of Pacaya. An update at 1700 told of 2.5 mm of ash at the international airport (La Aurora, ~23 km N of Pacaya) but eruptive plumes at the volcano had dropped to 200-300 m in height. The ash at the airport was described as 0.5-1.5 mm across and dark in color. About 1 mm of ash fell in part of the capital.
Although ash fell in the capital mainly during 1100-1700 on 20 May, the amount falling diminished around 1530, allowing the atmosphere to clear substantially. At 1700, Pacaya sent ash plumes 200-300 m above the summit, more typical of normal behavior at the volcano. At about 2000, the wind carried only very small particles toward the capital. Still, local vegetation tenuously held residual ash that could easily become wind blown. In response to the diminished eruptive vigor, at 2100 on 20 May the alert status was lowered from red to orange.
During the eruption, five lava flows or lobes formed, three oriented towards Cerro Chino. One of these reached 1.5 km in length and ~300-400 m in width. The two other flows proceeded down the N and S flanks for ~600 m. No lavas reached cultivated or populated areas. The eruption disrupted the crater sending blocks 2.5 m in diameter up to 1 km downslope (to "la meseta"). Ash thicknesses of 20-30 cm were reported in villages approximately 2-4 km from the volcano (including San Francisco de Sales, Calderas, Mesillas Altas, and El Bejucal).
Verbal conversations with INSIVUMEH's Eddie Sanchez indicated that ash fell on Guatemala City during 1100-1700 on 20 May. Also, volcanic bombs with masses up to 7 kg landed near Pacaya's summit (on Cerro Chino). They also learned that lapilli fell in a village a few kilometers away on Pacaya's flanks (San Francisco de Sales). Otoniel Mat¡as said the 20 May event prompted 252 people to evacuate local settlements. Authorities had several cautions for people in areas of ash fall: 1) drive at speeds below 30 km/hour; 2) avoid the use of their vehicle's windshield wipers because the ash would scratch glass; and 3) cover cisterns even though the ash was non-toxic.
Seismicity during the event on 20 May left records with amplitudes of 5-17 mm peak-to-peak and maintained RSAM values of 870 counts over 10-minute intervals.
The INSIVUMEH report at 1000 on 21 May described a substantial decrease in eruptive vigor but explosions still sent gray, ash-bearing plumes to ~800 m above the summit. A N wind with speeds of 12-17 km/hour carried ash to El Chupadero and El Caracol, spots located 2-2.5 km from the crater. This same morning, the longest lava flow had reached 1.1 km in length.
Other consequences. The previously mentioned aircraft was a commercial jet that was on final approach to the airport when it entered an ash cloud. A few seconds prior to landing, a Pacaya discharge burst forth propelling rocks into the air. Impact with these rocks damaged the pilot's forward windows (captain and first officer) but the landing was completed without further complications. Repairs and inspection were carried out over a 3-day interval; both the airline's technicians and a manufacturer's representative inspected the plane and found the engines undamaged.
At the airport, ash was removed by mechanical means (and to some extent thanks to rainfall) on 21, 22, and 23 May, returning to full service on Sunday 24 May. Rainfall during 22-24 May was never heavy but it apparently did much to wash the ash away. Not surprisingly, the ash clogged storm drains in the capital forcing crews to clean much of the 3-4 million tons of ash mechanically.
A news report in La Nación stated the National Coffee Association computed that the 20 May eruption caused "some $75 million in losses in the coffee harvest." This was the third time in recent history that Guatemala City had been ash choked: the two previous times, 1932 and 1974 were due to eruptions at Fuego, a stratovolcano that sits along the volcanic front roughly 30 km W of Pacaya.
Later activity. Other outbursts occurred during June. One on 14 June was somewhat weaker than the 20 May event; nevertheless it disrupted the crater's geometry and formed a distinct spatter cone. This outburst took place at 1045, exhaling for 10 minutes in conditions of little or no wind, sending brightly incandescent material to 1 km. The material fell harmlessly back on the crater area.
This type of comparatively short eruptive interval had been rare at Pacaya until recently; previous pulses were typically weaker and continued longer, often for 2-7 hours. The short blasts seen recently were thought to be related to water saturation of the ground associated with a wet rainy season; presumably, more groundwater has been driven toward the magma. The situation became difficult from a civil-defense policy perspective since these short, forceful pulses were typically unpredictable and could create conditions requiring rapid response in flank settlements.
Aviation reports. The NOAA/NESDIS Satellite Analysis Branch (SAB) produced tens of reports on Pacaya's mid-May and early June eruptions. For many of their reports before and well after the 20 May eruption, GOES-8 infrared, and multi spectral imagery did not indicate an ash plume, but channel 2 data often revealed a small hot spot. In accord with the rather sudden emergence of the eruption, no ash was detected during clear weather on GOES-8 visible, infrared, or multi spectral imagery through 1645 GMT on 20 May.
Hours later SAB reported a substantial ash cloud; it appeared in GOES-8 imagery taken at 1900 GMT on 20 May (table 2, first entry). Their same report noted that a sounding from Belize (station 78583) had yielded an estimated plume height of about 9-11 km altitude. The cloud extended 140 km NNE from the summit, reached a width of 46 km, and advanced NNE at about 120 km/hour. Table 2 shows a sample of some noteworthy reports posted during portions of 20-22 May.
Table 2. Several of the reports on Pacaya and its ash clouds during parts of 20-22 May put out by the NOAA/NESDIS Satellite Analysis Branch (SAB). Stated times are GMT. Courtesy of SAB.
| Report Date |
Report Time (GMT) |
Report Number |
Observations |
| 20 May 1998 |
2125 |
98-018 |
Ash cloud of dimensions and velocity discussed in text (extending to the point 16°N, 90°W). |
| 21 May 1998 |
0330 |
98-019 |
The plume extended NE across Central America and into W Gulf of Mexico (from 19°N, 88°W to 21°N, 86°W ) and was 55 km wide. Plume height was about 9-12 km. |
| 21 May 1998 |
0915 |
98-020 |
GOES-8 multi spectral imagery did not show any plume from the earlier eruption at 1900 GMT on May 20. The plume moved NW across Central America into the W Caribbean and dissipated as it approached W Cuba. |
| 21 May 1998 |
1535 |
98-021 |
Surface observations at 1500 GMT indicated Pacaya in eruption. No plume visible on GOES-8. |
| 21 May 1998 |
1745 |
98-022 |
Pacaya erupted through 1700. Although ash moved NE at about 50 knots, newly erupted ash was not discerned on GOES-8 imagery. As best as could be determined, the SIGMET issued earlier by Santo Domingo for ash to 10.4 km spread over large portions of the N Carribean was the result of ash resulting from the 1900 GMT 20 May Pacaya eruption. GOES-8 satellite imagery through 1645 GMT failed to reveal discernible ash in the Caribbean but the presence of thin diffuse ash could not be discounted. |
| 22 May 1998 |
0530 |
98-023 |
Surface observations indicated an eruption from 1500 GMT on 21 May to 0530 GMT on 22 May with uncertain amounts of ash ejecting. Highly different wind velocities at different altitudes. Weather clouds obscured the satellite view of the eruption. |
| 22 May 1998 |
1430 |
98-026 |
Surface observations repeatedly indicated that the eruption continued on 22 May during 0530-1300 GMT but no surface observations were reported during 0900-1200 GMT. Pilot reports around indicated ash near 9.1 km in the central Gulf of Mexico (near 24.3°N, 86.8°W). At some time during 1400-1430 GMT one pilot reported descending to an altitude of 8.2 km from 8.8 km to avoid volcanic ash. Another pilot reported no problem while flying at 10 km in the same area. At some time during 1415-1430 GMT a pilot located over 23.5°N, 86.8 observed a gray layer and smoky smell while flying at 8.8 km altitude. The pilot could not distinguish between volcanic ash and smoke. A velocity for ash moving over the central Gulf of Mexico was estimated based on upper air data from Key West, Florida: 55-65 km/hour directed ENE. |
Fires, El Nino, and smoky atmospheric conditions. During May and early June INSIVUMEH reported intervals of heavy rains and fog around Pacaya. Satellite data, now available on the web (SSEC, 1998 ), also revealed intervals of cloud cover. Despite this rain at Pacaya, thousands of fires remained burning throughout the region, ~40% of them located in the Petén, an area hundreds of kilometers to the N. These fires and associated atmospheric conditions warrant further discussion as they link to both public safety and the interest in understanding the Pacaya's contribution to the atmosphere.
According to news reports, smoke from forest fires burning out of control added to the airborne ash from 300-m-tall eruption columns during 15-18 May had caused breathing problems as far away as Houston, Texas. In addition, at least one news report said that reduced visibility had made airplane landing possible only through the use of instrument guidance in Guatemala City; Honduras was forced to close its two largest airports.
What follows came from a report by the U.S. Agency for International Development (21 May 1998). The report noted that since January, more than 10,650 fires have burned some 1,200 square miles [3,108 km2] in Mexico, an area nearly the size of the state of Rhode Island. As of 21 May, approximately 277 wildfires still raged throughout Guatemala.
"During 1998, Mexico and the entire Central American region have been affected by drought exacerbated by El Nino conditions. The drought has aggravated the effects of slash and burn agricultural practices in forest and grassland areas, leaving thousands of fires burning out of control. Tropical forest, usually too humid to burn, has become extremely vulnerable to fire. In addition to making the land more arid and therefore more flammable, the droughts have eliminated the cleaning effect that rains usually have on the region's air. The ground cover burning may be the driest ever recorded in this century, which has resulted in large quantities of smoke being emitted into the atmosphere. The fires have burned more than one million acres [>4,050 km2] and severely affected visibility and air quality in Mexico, Guatemala, Nicaragua, Honduras, El Salvador, and Costa Rica. In Guatemala, Honduras, and Nicaragua, an estimated 2,146 square miles [5,558 km2] have burned. The smoke from these fires also has entered the southern and Midwestern United States prompting local warnings for residents with respiratory conditions to limit their outdoor activities."
"According to NASA, more than 2,000 fires are currently raging in Guatemala. The U.S. Embassy in Guatemala City reported on May 19 that the fires are intensifying and are threatening human populations. The "red alert" on air quality declared by the Government of Guatemala (GOG) on May 15 remains in effect. Air quality monitors report that total suspended particulate levels in Guatemala City averaged 600 milligrams per cubic meter during the first two weeks of May, three times the World Health Organization maximum level. Since then, air quality has worsened significantly. According to the Embassy, the GOG's Ministry of Health's local health centers have found significant increases in respiratory ailments. The Ministry of Health says that the most heavily affected areas are Petén, Alta Verapaz, Baja Verapaz, and areas of Huehuetenango and Quiche. In Ixcan, 80% of the population are suffering from respiratory-related ailments, eye irritation, vomiting, and headaches, according to local community leaders."
References. SSEC, 1998, Real-time data, Volcano Watch (the world's ten most active volcanoes); Pacaya volcano, Guatemala: Graduate School, University of Wisconsin-Madison, Space Science and Engineering Center (SSEC), 1225 West Dayton Street, Madison, Wisconsin 53706 (URL: http://www.ssec.wisc.edu/data/volcano.html).
U.S. Agency for International Development, 21 May 1998, Fiscal Year (FY) 1998 Situation Report ##2, Mexico and Central America Fires [NAT-DSR:378][OFDA-02]: U.S. Agency for International Development, Bureau for Humanitarian Response (BHR), Office of U.S. Foreign Disaster Assistance (OFDA).
Geologic Background. Eruptions from Pacaya are frequently visible from Guatemala City, the nation's capital. This complex basaltic volcano was constructed just outside the southern topographic rim of the 14 x 16 km Pleistocene Amatitlán caldera. A cluster of dacitic lava domes occupies the southern caldera floor. The post-caldera Pacaya massif includes the older Pacaya Viejo and Cerro Grande stratovolcanoes and the currently active Mackenney stratovolcano. Collapse of Pacaya Viejo between 600 and 1,500 years ago produced a debris-avalanche deposit that extends 25 km onto the Pacific coastal plain and left an arcuate scarp inside which the modern Pacaya volcano (Mackenney cone) grew. The NW-flank Cerro Chino crater was last active in the 19th century. During the past several decades, activity has consisted of frequent Strombolian eruptions with intermittent lava flow extrusion that has partially filled in the caldera moat and covered the flanks of Mackenney cone, punctuated by occasional larger explosive eruptions that partially destroy the summit.
Information Contacts: Eddie Sanchez and Otoniel Matías, Seccion Vulconologia, INSIVUMEH (Instituto Nacional de Sismologia, Vulcanologia, Meteorologia e Hydrologia) of the Ministerio de Communicaciones, Transporte y Obras Publicas, 7A Avenida 14-57, Zona 13, Guatemala City, Guatemala; NOAA/NESDIS Satellite Analysis Branch, Room 401, 5200 Auth Road, Camp Springs, MD 20746, USA; La Nación, San José, Costa Rica; U.S. Agency for International Development, Bureau for Humanitarian Response (BHR), Office of U.S. Foreign Disaster Assistance (OFDA); Tom Fox, Air Navigation Bureau, International Civil Aviation Organization (ICAO), 999 University St., Montreal H3C 5H7, Canada (URL: https://www.icao.int/safety/airnavigation/); Tom Casadevall, U.S. Geological Survey, National Center, Reston, VA 20192.
Popocatepetl (Mexico) — May 1998 Cite this Report
Popocatepetl
Mexico
19.023°N, 98.622°W; summit elev. 5393 m
All times are local (unless otherwise noted)
Moderate activity continues, smoke hinders observation
Activity at the start of April showed an increase over that of late March. Small emissions of gas, steam, and light ash along with rockfalls and short harmonic tremors were typical events at Popocatépetl throughout April and May. Smoke from forest fires, mist, and air pollution made direct observation of the volcano difficult for much of both months.
Although not shown as a located A-type event (table 12), on 1 April a gas-and-steam plume was observed rising 500 m above the crater and dispersing to the NE. At 1653 on 2 April seismometers and flow detectors sensed a disturbance that turned out to be a flow of water and debris traveling down NE-flank ravines. The flow was attributed to glacial runoff after days of intensely hot weather. The flow continued for hours and reached points 8 km downstream from the glacier. For 12 hours after this event seismic activity steadily decreased. Only small, short exhalations occurred until 0522 on 3 April when another A-type event occurred.
Table 12. Located A-type events reported at Popocatépetl, April-May 1998. The columns for distance and direction define epicenters with respect to the summit. Data courtesy of CENAPRED.
| Date |
Local Time |
Magnitude |
Depth (km) |
Distance (km) |
Direction |
| 30 Mar 1998 |
2122 |
2.2 |
4 |
7.1 |
SE |
| 01 Apr 1998 |
0008 |
2.1 |
6.1 |
2 |
E |
| 01 Apr 1998 |
1439 |
2.3 |
3.2 |
1.8 |
NE |
| 02 Apr 1998 |
0522 |
2.8 |
9 |
2 |
N |
| 10 Apr 1998 |
1250 |
2.1 |
5 |
7 |
SE |
| 10 Apr 1998 |
1603 |
2.2 |
4.2 |
-- |
-- |
| 11 Apr 1998 |
1616 |
2.1 |
3.3 |
7 |
SE |
| 12 Apr 1998 |
0322 |
2.4 |
6.6 |
8 |
SE |
| 17 Apr 1998 |
1525 |
2.5 |
4.9 |
6.5 |
SE |
| 23 Apr 1998 |
2116 |
2.1 |
5.2 |
2 |
E |
| 04 May 1998 |
1042 |
2 |
6.4 |
0.5 |
NE |
| 05 May 1998 |
0256 |
2.3 |
4.9 |
7 |
SE |
| 25 May 1998 |
0128 |
2.2 |
6.9 |
6.9 |
NW |
| 25 May 1998 |
0202 |
1.8 |
4.2 |
-- |
-- |
| 28 May 1998 |
0404 |
2.5 |
701 |
10 |
N |
Activity remained low to moderate over the next week. At 0425 of 11 April there occurred a small harmonic tremor of 30-second duration. At 1632 the same day a medium-intensity exhalation was followed by 12 minutes of harmonic tremor. Other exhalations occurred that day at 1912 and 2321, and at 0235 the morning of 12 April, all of which were accompanied by small emissions of gas and steam.
At 1107 on 21 April a large exhalation took place that lasted 5 minutes and produced an ash column 4 km high. Although heavy clouds obstructed visibility, a video image of the ash column showed it clearly (figure 25). Incandescent fragments were ejected producing several grass fires on the upper slopes of the volcano. Vibration of windows in the city of Puebla was reported and some ash fell in both Cholula and La Paz. At 1453 the same day a similar exhalation occurred, but was smaller in magnitude and only 1 minute in duration. The last event possibly emitted ash, but this could not be confirmed because of limited visibility. Activity decreased slightly over the next few days, except for some A-type events. Bad weather engulfed the summit in cloud.
The broad-band seismometer recently installed at the Canario station (BGVN 22:10), located on the N flank at 4,300 m altitude 2 km from the crater, went out of operation 21 April probably because solar panels were damaged by ejected rocks. This is the second station damaged by volcanic activity this year (the first was the Espinera station, PFM2). Because of the danger of future explosions, an area within 4 km of the crater was deemed of high risk and restricted access.
On 24 April a large exhalation was recorded at 1257. It had a duration of three minutes and probably produced a small ash emission, which because of poor visibility could not be confirmed. At 1031 on 27 April another explosive exhalation occurred. The most intense phase lasted three minutes and was followed by high-frequency tremor that lasted an additional five minutes. It produced a 4-km-high ash column over the summit. Immediately afterwards the volcano returned to previous lower levels of activity. Mild ashfall was expected in the towns located to the E and NE of the volcano.
May began with a slight decrease in activity. Mist and clouds with occasional smoke persisted in obstructing visibility of the mountain. Activity increased slightly on 9 May and included seismic events at 0255 of 2.5 minutes duration, and at 0546 of two minutes duration, possibly due to small emissions of gas, steam, and ash. At 1205 an M 5.2 earthquake occurred on the coast of Guerrero and was recorded by all the stations monitoring the volcano. The event did not affect Popocatépetl.
Isolated low- to medium-intensity exhalations were recorded 10 May. The largest events occurred at 0744 (1.5 minutes duration) and at 0842 (one minute). Both events produced small emissions of gas and steam which rose to 1 km above the crater. Rockfalls were recorded on the N flank of the volcano. At 1322 a moderately large exhalation occurred, followed by four similar but smaller events during the next 5 minutes. Immediately after, one minute of low-frequency harmonic tremor of considerable amplitude was recorded followed by five minutes of high-frequency tremor.
Despite the limited visibility of the volcano at that time, an ash column with gas and steam could be observed rising several kilometers above the crater and was directed by low-speed winds to the NE. The appearance of the column was confirmed by observers viewing from a helicopter in the vicinity of the volcano. These events, due to their explosive nature, ejected solid and incandescent material from the crater over an area of 2-3 km radius. After the episode the volcano returned to previous levels of activity and remained stable for the rest of the day. No reports of damage or ashfall were received.
Beginning at 0426 of 11 May, a high-frequency tremor accompanied a gas-and-steam fumarole which ended with a moderate exhalation at 1505. The afternoon of 12 May at 1755 a column of gas and steam rose 2 km above the summit. The following day, emissions of gas and steam with slight amounts of fine ash generated puffs rising 500-1,000 m above the crater. At 1023 on 15 May three small exhalations mixed with harmonic tremors of low frequency occurred. Other tremor episodes lasting up to five minutes were recorded at 1030 and 1035. At 1043 a medium-intensity exhalation occurred which produced a puff of steam, gas and some light ash, dispersing to the NW. During the rest of the day several similar exhalations were recorded.
On 16 May at 1242 another strong M 5.2 earthquake located on the coast of Guerrero was recorded by all seismic stations at the volcano. This event did not produce any changes in the activity of Popocatépetl. At 1308 a small exhalation occurred accompanied by steam and followed by low-amplitude harmonic tremor lasting 6 minutes. Other short tremor episodes were recorded in the afternoon. During the next few weeks forest fires on the N flank of the volcano close to Tlamacas limited visibility.
The measured SO2 value on 30 March was 5,500 tons/day: on 27 April it was 10,600 tons/day. During the Holocene, Popocatépetl produced both effusive and pyroclastic activity. About 30 eruptions are known since 1345, although early documentation is poor. Most historical eruptions were apparently mild-to-moderate Vulcanian steam and ash emissions, with larger explosive eruptions in 1519 and possibly 1663. Activity in 1920-22 produced intermittent explosive eruptions and a small lava plug in the summit crater. Minor ash clouds were also reported in 1923-24, 1933, 1942-43, and 1947.
Geologic Background. Volcán Popocatépetl, whose name is the Aztec word for smoking mountain, rises 70 km SE of Mexico City to form North America's 2nd-highest volcano. The glacier-clad stratovolcano contains a steep-walled, 400 x 600 m wide crater. The generally symmetrical volcano is modified by the sharp-peaked Ventorrillo on the NW, a remnant of an earlier volcano. At least three previous major cones were destroyed by gravitational failure during the Pleistocene, producing massive debris-avalanche deposits covering broad areas to the south. The modern volcano was constructed south of the late-Pleistocene to Holocene El Fraile cone. Three major Plinian eruptions, the most recent of which took place about 800 CE, have occurred since the mid-Holocene, accompanied by pyroclastic flows and voluminous lahars that swept basins below the volcano. Frequent historical eruptions, first recorded in Aztec codices, have occurred since Pre-Columbian time.
Information Contacts: Servando de la Cruz-Reyna, Roberto Meli, Roberto Quaas, G. Castelan, F. Castillo-Alanis, J.L. Delgollado, F. Galicia, A. Gómez, A.O. González, G. Juarez M., A. Martínez, A. Montalvo, L. Orozco, and E. Ramos, Centro Nacional de Prevencion de Desastres (CENAPRED), Av. Delfin Madrigal 665, Col. Pedregal de Santo Domingo, Coyoacán, CP 04360, México D.F., México.
Rabaul (Papua New Guinea) — May 1998 Cite this Report
Rabaul
Papua New Guinea
4.2459°S, 152.1937°E; summit elev. 688 m
All times are local (unless otherwise noted)
Tripling of volcanic events; ash plumes
During May, the intracaldera cone Tavurvur continued Vulcanian eruptive activity with minor fluctuations. In the first few days of the month there was a sharp increase, from 15 to 200 per day, in the number of low-frequency seismic events related to ash emissions. However, activity soon returned to more normal levels; between the 11th and 18th there were an average 20 events per day.
Most ash plumes contained relatively low to moderate amounts of ash and rose to less than 1,000 m above sea level. Throughout the first week ash plumes were blown to the SE and SW resulting in fine ashfall at the abandoned village of Talwat and in the Kokopo area. For the remainder of the month winds shifted between N and W resulting in ashfall in villages on the W of the caldera and in Rabaul town were it continued to be a nuisance to inhabitants. There were larger explosions with dark-gray ash clouds that rose to 1.5-3.0 km. From 9 May until the end of the month occasional explosions and roaring noises ranging in intensity from weak to loud accompanied the ash emissions. A weak glow was observed above the crater rim throughout the nights of 7 and 8 May, and incandescent lava fragments were ejected during explosions on the 7th.
Activity continued with minor fluctuations from 19 May to the end of the month. The seismic system recorded a total of 3,265 low-frequency volcanic events during May, a significant increase over the 1,064 recorded during April. Five high-frequency events originating outside the caldera were also recorded. Only two of these were located: one W of the caldera on 13 May, and another to the NE on 29 May.
Ground-deformation data showed that the slow on-going inflationary trend associated with the current phase of the eruption temporarily stabilized in early May only to resume again at the end of the month. These data may indicate that Vulcanian activity is likely to continue.
Geologic Background. The low-lying Rabaul caldera on the tip of the Gazelle Peninsula at the NE end of New Britain forms a broad sheltered harbor utilized by what was the island's largest city prior to a major eruption in 1994. The outer flanks of the asymmetrical shield volcano are formed by thick pyroclastic-flow deposits. The 8 x 14 km caldera is widely breached on the east, where its floor is flooded by Blanche Bay and was formed about 1,400 years ago. An earlier caldera-forming eruption about 7,100 years ago is thought to have originated from Tavui caldera, offshore to the north. Three small stratovolcanoes lie outside the N and NE caldera rims. Post-caldera eruptions built basaltic-to-dacitic pyroclastic cones on the caldera floor near the NE and W caldera walls. Several of these, including Vulcan cone, which was formed during a large eruption in 1878, have produced major explosive activity during historical time. A powerful explosive eruption in 1994 occurred simultaneously from Vulcan and Tavurvur volcanoes and forced the temporary abandonment of Rabaul city.
Information Contacts: Ben Talai and H. Patia, Rabaul Volcano Observatory (RVO), P.O. Box 386, Rabaul, Papua New Guinea.
Sabancaya
Peru
15.787°S, 71.857°W; summit elev. 5960 m
All times are local (unless otherwise noted)
Summit activity, ice observed on visit in May
Sabancaya was observed by scientists of the National Air and Space Museum's Colca Valley Geohazard Project during a four-day visit (18-21 May) made in preparation for field work later in the year. Continuous fumarolic activity at the E side of the crater rim was observed during this visit. Seasonal snow patches were visible on the SE flank that were not present when the team made an aerial observation in July 1997 (BGVN 22:07).
On 18 May a seismic event was noted by observers traveling in a vehicle on the Pampa Lliullipampa, SE of the volcano. The disturbance produced a dust cloud that spanned the entire Ampato-Sabancaya-Hualca Hualca complex along its E slopes, a distance of 15 kilometers. A video camera recorded the disturbance at 1525 on 18 May. Roughly concurrently, scientists at the Instituto Geofísico in Arequipa detected a deep focus M 6 earthquake centered 250 km to the N near Ayacucho. Tremors occurred at this time in the pueblo of Cabana Conde located 15 kilometers NW of Hualca Hualca.
On 20 May A. Seimon of the University of Colorado ascended Sabancaya's SE flank and recorded a video of the fumarolic activity inside the crater rim, including the steady emission of gas from the crater floor (figure 8). He noticed ice along the route up the E flank. The ice lies beneath a layer of ash 5 to 10 cm thick, a depth that seemed sufficient to insulate it from higher surface temperatures. Ice was also observed filling a breach in the N side of the crater rim.
Sabancaya is the youngest of the three adjacent stratovolcanoes located 75 km NW of Arequipa. The volcano's 29 May 1990 eruption produced a plume reaching a maximum height of 7 km (BGVN 15:05). The plume traveled NE and carried fine ash that fell up to 20 km away. Extensive mudflows (not mudslides) had occurred in the area in the months after the Sabancaya eruptions that began in late May 1990. These mudflows resulted from fallen ash and the subsequent melting of snow and ice on Hualca Hualca (BGVN 16:05; v. 15, no. 5).
Geologic Background. Sabancaya, located in the saddle NE of Ampato and SE of Hualca Hualca volcanoes, is the youngest of these volcanic centers and the only one to have erupted in historical time. The oldest of the three, Nevado Hualca Hualca, is of probable late-Pliocene to early Pleistocene age. The name Sabancaya (meaning "tongue of fire" in the Quechua language) first appeared in records in 1595 CE, suggesting activity prior to that date. Holocene activity has consisted of Plinian eruptions followed by emission of voluminous andesitic and dacitic lava flows, which form an extensive apron around the volcano on all sides but the south. Records of historical eruptions date back to 1750.
Information Contacts: F. Engle, Center for Earth and Planetary Studies (CEPS), National Air and Space Museum, Smithsonian Institution, Washington, D.C. 20560 USA; A. Seimon, Department of Geography, University of Colorado, Boulder, CO 80309-0260 USA; S.O. Brooks, Department of Geography, University of Wisconsin, Madison, WI USA 53706-1491.
Sheveluch
Russia
56.653°N, 161.36°E; summit elev. 3283 m
All times are local (unless otherwise noted)
Satellite imagery detects large ash plume
A report of an ash plume 4 km above sea level extending 35 km from Shiveluch was received by the Alaska Volcano Observatory (AVO) via the Japan Meteorological Agency (JMA) and Anchorage VAAC early on 30 May. AVO analysis of various satellite images determined that the eruption began about 1739 on 29 May. A JMA satellite image taken at 1930 that day showed a small, narrow, well-defined ash plume detached from the vent, extending about 100 km downwind to the SSE. Satellite imagery analysis by AVO on the morning of 30 May showed the Shiveluch area clear with no volcanic activity. There was no ash detected in the area SSE of the volcano where the cloud diffused. Three pilot's reports from flights 9 km above sea level over the Shiveluch area on 30 May confirmed there was no ash cloud remaining in the region.
The ash plume did not act like an energetic, high-level eruption plume but rather a low-level short-lived eruption burst from the volcano. These types of eruption bursts are not uncommon from Shiveluch and are connected with the growing extrusive dome inside the crater. The level-of-concern color code was changed to yellow, but reverted to green on 1 June.
Seismicity was at background levels through most of June. During 11-15 June the system registered increased seismicity and volcanic tremor. On June 15 at 0247 it registered about 2 minutes of explosive activity. It was dark and the volcano was obscured by clouds when this explosive activity took place leaving researchers without visual information; they estimated plume height at 5 km.
On 31 May a gas-and-steam plume without ash rose 2 km above the volcano. During 9-11 June a fumarolic plume rose 100-500 m above the volcano, and during 17-19 a plume rose to 200-800 m. Clouds limited visibility throughout much of May.
Geologic Background. The high, isolated massif of Sheveluch volcano (also spelled Shiveluch) rises above the lowlands NNE of the Kliuchevskaya volcano group. The 1,300 km3 andesitic volcano is one of Kamchatka's largest and most active volcanic structures, with at least 60 large eruptions during the Holocene. The summit of roughly 65,000-year-old Stary Shiveluch is truncated by a broad 9-km-wide late-Pleistocene caldera breached to the south. Many lava domes occur on its outer flanks. The Molodoy Shiveluch lava dome complex was constructed during the Holocene within the large open caldera; Holocene lava dome extrusion also took place on the flanks of Stary Shiveluch. Widespread tephra layers from these eruptions have provided valuable time markers for dating volcanic events in Kamchatka. Frequent collapses of dome complexes, most recently in 1964, have produced debris avalanches whose deposits cover much of the floor of the breached caldera.
Information Contacts: Olga Chubarova and Vladimir Kirianov, Kamchatka Volcanic Eruptions Response Team (KVERT), Institute of Volcanic Geology and Geochemistry, Piip Ave. 9, Petropavlovsk-Kamchatsky, 683006, Russia; Tom Miller, Alaska Volcano Observatory (AVO), a cooperative program of a) U.S. Geological Survey, 4200 University Drive, Anchorage, AK 99508-4667, USA (URL: http://www.avo.alaska.edu/), b) Geophysical Institute, University of Alaska, PO Box 757320, Fairbanks, AK 99775-7320, USA, and c) Alaska Division of Geological & Geophysical Surveys, 794 University Ave., Suite 200, Fairbanks, AK 99709, USA.
Soufriere Hills (United Kingdom) — May 1998 Cite this Report
Soufriere Hills
United Kingdom
16.72°N, 62.18°W; summit elev. 915 m
All times are local (unless otherwise noted)
Low activity; deformation and volume measurements
The following condenses scientific reports from Montserrat Volcano Observatory (MVO) for 12 April-10 May 1998.
Summary. Activity during the reporting period continued at low levels: there were no changes in dome morphology and only a few pyroclastic flows occurred. Seismicity was generally low, with occasional volcano-tectonic (VT) earthquakes being the predominant signals recorded by the seismic network. Rockfall activity was particularly low but showed an increase after heavy rains. Several mudflows were generated during the reporting period, most of them moving down Dyers River into the Belham River valley.
Visual observations. Fresh pyroclastic-flow deposits were seen along the N side of the Tar River Valley on 14 April. A small pyroclastic flow occurred during the morning of 19 April and was seen by the remote video camera at MVO as it traveled down the Tar River as far as the site of the Tar River Estate House. Another small pyroclastic flow coursed down the Tar River on the morning of 25 April, but could not be seen from MVO due to low clouds. Three more small pyroclastic flows traveled halfway down the Tar River Valley during 26 April and the morning of 27 April. All of these flows were believed to have originated on the steep upper flanks to the E of the old dome. Each event lasted 2 minutes and generated small ash clouds.
Rockfall activity was minor with small rockfalls occurring down the E and SW flanks. Some of these events are gradually carving deeper chutes on the Tar River side and S flank of the new Galway's dome. Minor rockfall activity also began near the top of the dome over Galway's wall and traveled down a chute on the S flank of Chances Peak.
During a brief clearing in the weather around the dome early on 6 May observers on a reconnaissance flight saw no evidence of new growth, suggesting a lack of significant extrusion since the growth of the summit spine around 10 March (BGVN 23:04). They did see moderate fumarolic activity coming from a point in the main chute on the upper E flank, and in several areas within the trench located between the scar of 26 December (BGVN 22:12) and the fresh growth within it. They also noted that the summit area appeared blanketed by over 5 m of tephra including both fine ash and blocks of glassy dome rock (up to 1 m diameter).
The temperatures of the pyroclastic flows deposited at Trant's during the 21 September collapse (BGVN 22:10) were measured on 28 April. A maximum temperature of 348°C was obtained at a depth of 2 m. They showed only very minor changes since they were last measured 2 weeks ago.
Seismicity. Over the reporting period, seismicity remained low. Volcano-tectonic (VT) earthquake activity continued to be dominate (table 28). VT earthquakes mainly occurred in groups too few in number to constitute swarms, but exceptions to this are shown in table 29, including a swarm of hybrids on 6 May. These were the first hybrids of high amplitude seen for many weeks, but were not followed by others of similar type.
Table 28. Earthquake counts at Soufriere Hills listed by type (based on signal character), 12 April-9 May 1998. These counts were of events that triggered the broadband network's event-recording system between 0000 and 0000 each day. The type "Dome RF" denotes a dome rockfall. The type "Long-period / Rockfall" signifies a Long-period earthquake followed by rockfall signal. "Hybrid / Rockfall" is a hybrid earthquake followed by rockfall signal. Courtesy of MVO.
| Date |
Volcano-tectonic |
Hybrid |
Long-period |
Dome Rockfall |
Long-period / Rockfall |
Hybrid / Rockfall |
| 12 Apr 1998 |
15 |
1 |
-- |
-- |
10 |
-- |
| 13 Apr 1998 |
15 |
-- |
-- |
-- |
6 |
-- |
| 14 Apr 1998 |
1 |
-- |
-- |
-- |
-- |
-- |
| 15 Apr 1998 |
2 |
1 |
-- |
-- |
-- |
-- |
| 16 Apr 1998 |
4 |
-- |
-- |
-- |
-- |
-- |
| 17 Apr 1998 |
4 |
-- |
-- |
-- |
-- |
-- |
| 18 Apr 1998 |
1 |
-- |
-- |
-- |
-- |
-- |
| 19 Apr 1998 |
5 |
-- |
-- |
1 |
4 |
1 |
| 20 Apr 1998 |
14 |
-- |
-- |
2 |
5 |
-- |
| 21 Apr 1998 |
8 |
1 |
-- |
-- |
1 |
-- |
| 22 Apr 1998 |
-- |
-- |
-- |
-- |
1 |
-- |
| 23 Apr 1998 |
-- |
-- |
-- |
-- |
4 |
-- |
| 24 Apr 1998 |
1 |
-- |
-- |
1 |
4 |
-- |
| 25 Apr 1998 |
3 |
1 |
-- |
-- |
2 |
-- |
| 26 Apr 1998 |
17 |
-- |
-- |
1 |
2 |
-- |
| 27 Apr 1998 |
7 |
-- |
-- |
-- |
2 |
-- |
| 28 Apr 1998 |
8 |
-- |
-- |
-- |
6 |
-- |
| 29 Apr 1998 |
2 |
-- |
-- |
-- |
-- |
-- |
| 30 Apr 1998 |
3 |
-- |
-- |
-- |
-- |
-- |
| 01 May 1998 |
7 |
-- |
-- |
-- |
-- |
-- |
| 02 May 1998 |
10 |
-- |
-- |
-- |
3 |
-- |
| 03 May 1998 |
2 |
2 |
-- |
-- |
7 |
-- |
| 04 May 1998 |
4 |
-- |
-- |
-- |
4 |
-- |
| 05 May 1998 |
6 |
2 |
-- |
-- |
3 |
-- |
| 06 May 1998 |
5 |
12 |
-- |
-- |
-- |
-- |
| 07 May 1998 |
6 |
-- |
-- |
-- |
-- |
-- |
| 08 May 1998 |
25 |
-- |
-- |
-- |
2 |
-- |
Table 29. Swarms registered at Soufriere Hills during 12 April-10 May 1998. Courtesy of MVO.
| Date |
Local Time |
Duration (minutes) |
Hybrid |
Long-period |
Volcano-tectonic |
| 26 Apr 1998 |
2247 |
1.45 |
0 |
0 |
9 |
| 06 May 1998 |
0445 |
1.40 |
11 |
0 |
-- |
| 27 May 1998 |
2257 |
5.75 |
0 |
0 |
1 |
| 18 May 1998 |
0841 |
8.32 |
0 |
0 |
15 |
Epicenters were located on the E of the volcano at focal depths tightly clustered from 2.5 to 3.5 km below the summit. Fault-plane solutions were calculated using P-wave first-motions detected by the 7 broadband stations along with first motions from the Lee's Yard and Jack Boy Hill stations of the short-period network. The calculated fault-plane solutions are consistent with a strike-slip fault mechanism. The number of recorded rockfall signals was very low. However, in many cases there was a correlation between occurrence of the rockfalls and periods of heavy rainfall.
Ground deformation. With respect to the Harris GPS measuring station, the stations at Dagenham, Old Towne, Lookout Yard, and Windy Hill showed height increases of 5, 5.5, 6, and 4 cm respectively since December 1996. These values are preliminary, as the height component is the least well constrained by GPS. It was judged more likely that the reference at Harris was actually sinking. Height differences between Harris and sites on the E (Long Ground, Tar River and Perches) all showed continued slow movement to the NE of around 7 cm in the last year; Whites and Roches have moved slightly less and in different directions.
A survey from Windy Hill measured the distance to the N crater wall reflector and found it had shortened by only 1 cm since the middle of March. The line to Windy Hill from Harris is stable, as confirmed by repeated measurements since December 1997 that gave site positions lying within a box 3 mm by 7 mm. In contrast, the survey point at Brodericks had shown accelerated movement: 3 cm to the N between November 1997 and January 1998. This coincided with the period of rapid extrusion in the S area of the dome during December, 1997. Subsequently Brodericks appeared to stabilize in its new position.
A new permanent GPS site was installed in the South Soufriere Hills. Telemetry equipment used by the station was installed by the University of Puerto Rico on Antigua and in the Centre Hills.
Volume measurements. A new theodolite site known as Fergus Ridge was set up on the high ridge of the W flank of South Soufriere Hills, to the N of Fergus Mountain, overlooking the White River Valley. Measurements from this site triangulated with measurements from Perches Mountain were obtained on 16 April. In conjunction with the combined photo and GPS data collected on 6 April, a revised total dome volume was calculated to be 113 x 106 m3. This figure differed from the initial estimate of 120 x 106 m3; however, the revised figure incorporated a greater number of theodolite, photo, and GPS points that improved constraints on both the summit area and the new dome on the SW sector of the complex.
Environmental monitoring. Generally, low volcanic activity and the number of rain showers kept aerosol levels low through the reporting period. Extremely wet weather, 14-15 April, produced the lowest aerosol levels since the heavy ash fall at the beginning of February. Rain also prevented the ash produced by the small pyroclastic flow of 19 April from being transported N by wind to any of the sites that were being monitored.
The volcano's small ash output left inhabited N island areas comparatively ash free. Each disturbance of ash by moving vehicles seemed to help the wind and rain remove more ash.
The three pyroclastic flows that occurred on 26-27 April had no effect on the measured levels of airborne ash and dust. On 1 May observers saw a very small venting of ash escape at the top of the Tar River Valley. Scientists working in the SW of the island over the next few days noticed a strong smell of rotten eggs (hydrogen sulfide). Following the hybrid swarm on 6 May dust levels remained low, but aerosol levels doubled. Heavy rain two days later once more reduced levels. Aerosol levels continued low later in this period despite drier weather, except in Salem, an area likely affected by ash blown W from the pyroclastic flows.
Geologic Background. The complex, dominantly andesitic Soufrière Hills volcano occupies the southern half of the island of Montserrat. The summit area consists primarily of a series of lava domes emplaced along an ESE-trending zone. The volcano is flanked by Pleistocene complexes to the north and south. English's Crater, a 1-km-wide crater breached widely to the east by edifice collapse, was formed about 2000 years ago as a result of the youngest of several collapse events producing submarine debris-avalanche deposits. Block-and-ash flow and surge deposits associated with dome growth predominate in flank deposits, including those from an eruption that likely preceded the 1632 CE settlement of the island, allowing cultivation on recently devegetated land to near the summit. Non-eruptive seismic swarms occurred at 30-year intervals in the 20th century, but no historical eruptions were recorded until 1995. Long-term small-to-moderate ash eruptions beginning in that year were later accompanied by lava-dome growth and pyroclastic flows that forced evacuation of the southern half of the island and ultimately destroyed the capital city of Plymouth, causing major social and economic disruption.
Information Contacts: Montserrat Volcano Observatory (MVO), c/o Chief Minister's Office, PO Box 292, Plymouth, Montserrat (URL: http://www.mvo.ms/).
St. Helens (United States) — May 1998 Cite this Report
St. Helens
United States
46.2°N, 122.18°W; summit elev. 2549 m
All times are local (unless otherwise noted)
Sudden rise in earthquake activity in May
The level of earthquake activity at Mount St. Helens had been gradually increasing over the past several months and accelerated during May. Rates of activity increased from an average of ~60 well-located events per month last winter to 165 events in May. Most of the recent earthquakes were very small with only three events larger than M 2. The largest earthquake was on 1 May with M 2.2. These earthquakes occurred in two clusters directly beneath the lava dome in the crater. One cluster was in the range of 2-5 km and the other 7-9 km below the dome. Very few events were located in the very shallow region of 0-2 km below the dome. None of the earthquakes were low-frequency volcanic events that typically occur as precursors to major eruptions.
This increased activity seems to be similar to that which occurred in 1995, although the activity of May 1998 was more energetic. The 1995 activity lasted for several months, had a maximum earthquake rate of 95 events per month, and resulted in no volcanic activity. A similar increase in earthquake activity in the St. Helens system occurred in 1989-91. However, at that time there were also a number of very shallow earthquakes accompanied by a series of sudden steam explosions. These explosions were small eruptions of steam and gas that ejected rocks and ash from cracks in the dome. Rocks were thrown up to 1 km from the dome, ash clouds reached altitudes up to 6 km, and a dusting of ash was deposited locally downwind. Some explosions melted snow in the crater and generated small lahars that flowed N onto the Pumice Plain.
Because increased earthquake activity within the deep St. Helens system may reflect increased pressure at depth, it is possible that the current seismicity may eventually lead to renewed volcanic activity. However, it is unlikely to do so without significant additional precursors.
Geologic Background. Prior to 1980, Mount St. Helens was a conical volcano sometimes known as the Fujisan of America. During the 1980 eruption the upper 400 m of the summit was removed by slope failure, leaving a 2 x 3.5 km breached crater now partially filled by a lava dome. There have been nine major eruptive periods beginning about 40-50,000 years ago, and it has been the most active volcano in the Cascade Range during the Holocene. Prior to 2,200 years ago, tephra, lava domes, and pyroclastic flows were erupted, forming the older edifice, but few lava flows extended beyond the base of the volcano. The modern edifice consists of basaltic as well as andesitic and dacitic products from summit and flank vents. Eruptions in the 19th century originated from the Goat Rocks area on the N flank, and were witnessed by early settlers.
Information Contacts: Cascades Volcano Observatory, U.S. Geological Survey, 5400 MacArthur Blvd., Vancouver, WA 98661 USA (URL: http://volcanoes.usgs.gov/); Geophysics Program, University of Washington, Seattle, WA 98195 USA (URL: http://www.geophys.washington.edu/SEIS/PNSN/HELENS/).
Ukinrek Maars (United States) — May 1998 Cite this Report
Ukinrek Maars
United States
57.8344°N, 156.5203°W; summit elev. 91 m
All times are local (unless otherwise noted)
Earthquake swarm decreases in rate and intensity
During the last week of May, the anomalous seismic activity under SW Lake Becharof (BGVN 23:04) continued but at a decreased rate and intensity; magnitudes of 12 located earthquakes ranged from M 1.7 to 3.3. During 1-5 June, 20 earthquakes were located ranging from M 1.8 to 4.3. Activity decreased significantly during 6-12 June; only four earthquakes were located, all M > 3.0. Several overflights of the location by AVO scientists revealed no signs of volcanic activity or surface breakage. The area of seismicity was not monitored by real-time seismic instrumentation; however, a portable seismic instrument has recently been installed. AVO is in communication with local citizens and land managers who frequently overfly the area. There was no evidence of imminent hazard at the site.
Geologic Background. Ukinrek Maars are two explosion craters that were created in an area without previous volcanic activity during a 10-day phreatomagmatic eruption March-April 1977. The basaltic maars were erupted through glacial deposits in the Bering Sea lowlands 1.5 km S of Becharof Lake and 12 km W of Peulik volcano; their location is related to the regional Bruin Bay fault. The elliptical West Maar, which was the first to form, is 105 x 170 m and 35 m deep. The other maar, 600 m to the east, is 300 m wide and 70 m deep. Both maars are now filled by crater lakes; the eastern lake encircles a 49-m-high lava dome that was emplaced at the end of the eruption. Base surges were directed primarily to the NW. Juvenile material from the Ukinrek eruptions was of mantle-derived olivine basaltic composition. The dacitic Gas Rocks lava domes, of Quaternary age, are located on the shores of Becharof Lake, 3 km N of Ukinrek maars and were the site of a phreatic eruption about 2,300 years ago.
Information Contacts: Alaska Volcano Observatory (AVO), a cooperative program of a) U.S. Geological Survey, 4200 University Drive, Anchorage, AK 99508-4667, USA (URL: http://www.avo.alaska.edu/), b) Geophysical Institute, University of Alaska, PO Box 757320, Fairbanks, AK 99775-7320, USA, and c) Alaska Division of Geological & Geophysical Surveys, 794 University Ave., Suite 200, Fairbanks, AK 99709, USA.