Recently Published Bulletin Reports
Manam (Papua New Guinea) Few ash plumes during November-December 2022
Krakatau (Indonesia) Strombolian activity and ash plumes during November 2022-April 2023
Stromboli (Italy) Strombolian explosions and lava flows continue during January-April 2023
Nishinoshima (Japan) Small ash plumes and fumarolic activity during November 2022 through April 2023
Karangetang (Indonesia) Lava flows, incandescent avalanches, and ash plumes during January-June 2023
Ahyi (United States) Intermittent hydroacoustic signals and discolored plumes during November 2022-June 2023
Kadovar (Papua New Guinea) An ash plume and weak thermal anomaly during May 2023
San Miguel (El Salvador) Small gas-and-ash explosions during March and May 2023
Semisopochnoi (United States) Occasional explosions, ash deposits, and gas-and-steam plumes during December 2022-May 2023
Ebeko (Russia) Continued explosions, ash plumes, and ashfall during October 2022-May 2023
Home Reef (Tonga) Discolored plumes continued during November 2022-April 2023
Ambae (Vanuatu) New lava flow, ash plumes, and sulfur dioxide plumes during February-May 2023
Manam (Papua New Guinea) — July 2023  Cite this Report
Manam
Papua New Guinea
4.08°S, 145.037°E; summit elev. 1807 m
All times are local (unless otherwise noted)
Few ash plumes during November-December 2022
Manam is a 10-km-wide island that consists of two active summit craters: the Main summit crater and the South summit crater and is located 13 km off the northern coast of mainland Papua New Guinea. Frequent mild-to-moderate eruptions have been recorded since 1616. The current eruption period began during June 2014 and has more recently been characterized by intermittent ash plumes and thermal activity (BGVN 47:11). This report updates activity that occurred from November 2022 through May 2023 based on information from the Darwin Volcanic Ash Advisory Center (VAAC) and various satellite data.
Ash plumes were reported during November and December 2022 by the Darwin VAAC. On 7 November an ash plume rose to 2.1 km altitude and drifted NE based on satellite images and weather models. On 14 November an ash plume rose to 2.1 km altitude and drifted W based on RVO webcam images. On 20 November ash plumes rose to 1.8 km altitude and drifted NW. On 26 December an ash plume rose to 3 km altitude and drifted S and SSE.
Intermittent sulfur dioxide plumes were detected using the TROPOMI instrument on the Sentinel-5P satellite, some of which exceeded at least two Dobson Units (DU) and drifted in different directions (figure 93). Occasional low-to-moderate power thermal anomalies were recorded by the MIROVA (Middle InfraRed Observation of Volcanic Activity) system; less than five anomalies were recorded each month during November 2022 through May 2023 (figure 94). Two thermal hotspots were detected by the MODVOLC thermal alerts system on 10 December 2022. On clear weather days, thermal activity was also captured in infrared satellite imagery in both the Main and South summit craters, accompanied by gas-and-steam emissions (figure 95).
Geologic Background. The 10-km-wide island of Manam, lying 13 km off the northern coast of mainland Papua New Guinea, is one of the country's most active volcanoes. Four large radial valleys extend from the unvegetated summit of the conical basaltic-andesitic stratovolcano to its lower flanks. These valleys channel lava flows and pyroclastic avalanches that have sometimes reached the coast. Five small satellitic centers are located near the island's shoreline on the northern, southern, and western sides. Two summit craters are present; both are active, although most observed eruptions have originated from the southern crater, concentrating eruptive products during much of the past century into the SE valley. Frequent eruptions, typically of mild-to-moderate scale, have been recorded since 1616. Occasional larger eruptions have produced pyroclastic flows and lava flows that reached flat-lying coastal areas and entered the sea, sometimes impacting populated areas.
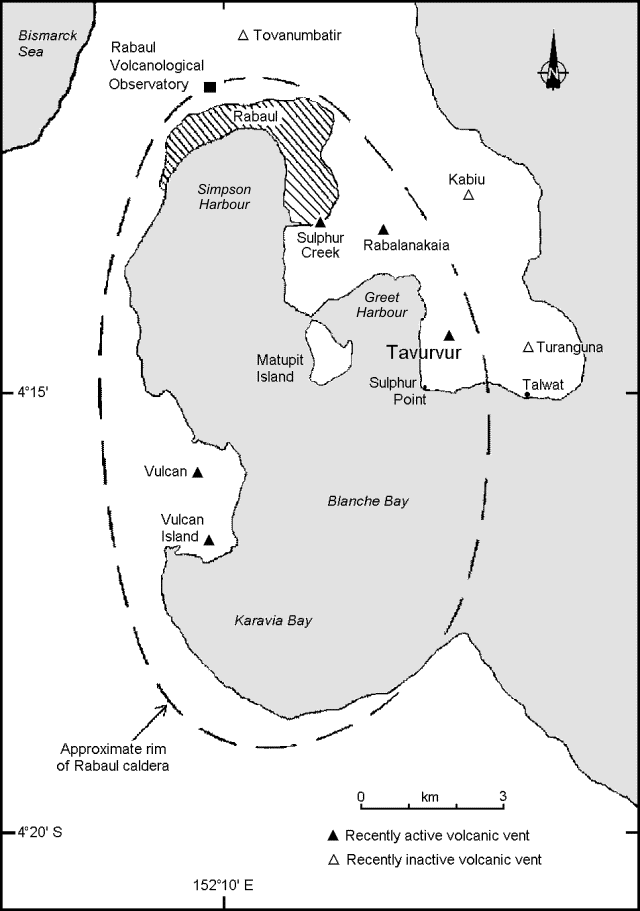
Information Contacts: Rabaul Volcano Observatory (RVO), Geohazards Management Division, Department of Mineral Policy and Geohazards Management (DMPGM), PO Box 3386, Kokopo, East New Britain Province, Papua New Guinea; Darwin Volcanic Ash Advisory Centre (VAAC), Bureau of Meteorology, Northern Territory Regional Office, PO Box 40050, Casuarina, NT 0811, Australia (URL: http://www.bom.gov.au/info/vaac/); MIROVA (Middle InfraRed Observation of Volcanic Activity), a collaborative project between the Universities of Turin and Florence (Italy) supported by the Centre for Volcanic Risk of the Italian Civil Protection Department (URL: http://www.mirovaweb.it/); Hawai'i Institute of Geophysics and Planetology (HIGP) - MODVOLC Thermal Alerts System, School of Ocean and Earth Science and Technology (SOEST), Univ. of Hawai'i, 2525 Correa Road, Honolulu, HI 96822, USA (URL: http://modis.higp.hawaii.edu/); NASA Global Sulfur Dioxide Monitoring Page, Atmospheric Chemistry and Dynamics Laboratory, NASA Goddard Space Flight Center (NASA/GSFC), 8800 Greenbelt Road, Goddard, Maryland, USA (URL: https://so2.gsfc.nasa.gov/); Copernicus Browser, Copernicus Data Space Ecosystem, European Space Agency (URL: https://dataspace.copernicus.eu/browser/).
Krakatau (Indonesia) — July 2023 Cite this Report
Krakatau
Indonesia
6.1009°S, 105.4233°E; summit elev. 285 m
All times are local (unless otherwise noted)
Strombolian activity and ash plumes during November 2022-April 2023
Krakatau is located in the Sunda Strait between Java and Sumatra, Indonesia. Caldera collapse during the catastrophic 1883 eruption destroyed Danan and Perbuwatan cones and left only a remnant of Rakata. The post-collapse cone of Anak Krakatau (Child of Krakatau) was constructed within the 1883 caldera at a point between the former Danan and Perbuwatan cones; it has been the site of frequent eruptions since 1927. The current eruption period began in May 2021 and has recently consisted of explosions, ash plumes, and thermal activity (BGVN 47:11). This report covers activity during November 2022 through April 2023 based on information provided by the Indonesian Center for Volcanology and Geological Hazard Mitigation, referred to as Pusat Vulkanologi dan Mitigasi Bencana Geologi (PVMBG), MAGMA Indonesia, the Darwin Volcanic Ash Advisory Center (VAAC), and several sources of satellite data.
Activity was relatively low during November and December 2022. Daily white gas-and-steam plumes rose 25-100 m above the summit and drifted in different directions. Gray ash plumes rose 200 m above the summit and drifted NE at 1047 and at 2343 on 11 November. On 14 November at 0933 ash plumes rose 300 m above the summit and drifted E. An ash plume was reported at 0935 on 15 December that rose 100 m above the summit and drifted NE. An eruptive event at 1031 later that day generated an ash plume that rose 700 m above the summit and drifted NE. A gray ash plume at 1910 rose 100 m above the summit and drifted E. Incandescent material was ejected above the vent based on an image taken at 1936.
During January 2023 daily white gas-and-steam plumes rose 25-300 m above the summit and drifted in multiple directions. Gray-to-brown ash plumes were reported at 1638 on 3 January, at 1410 and 1509 on 4 January, and at 0013 on 5 January that rose 100-750 m above the summit and drifted NE and E; the gray-to-black ash plume at 1509 on 4 January rose as high as 3 km above the summit and drifted E. Gray ash plumes were recorded at 1754, 2241, and 2325 on 11 January and at 0046 on 12 January and rose 200-300 m above the summit and drifted NE. Toward the end of January, PVMBG reported that activity had intensified; Strombolian activity was visible in webcam images taken at 0041, 0043, and 0450 on 23 January. Multiple gray ash plumes throughout the day rose 200-500 m above the summit and drifted E and SE (figure 135). Webcam images showed progressively intensifying Strombolian activity at 1919, 1958, and 2113 on 24 January; a gray ash plume at 1957 rose 300 m above the summit and drifted E (figure 135). Eruptive events at 0231 and 2256 on 25 January and at 0003 on 26 January ejected incandescent material from the vent, based on webcam images. Gray ash plumes observed during 26-27 January rose 300-500 m above the summit and drifted NE, E, and SE.
Low levels of activity were reported during February and March. Daily white gas-and-steam plumes rose 25-300 m above the summit and drifted in different directions. The Darwin VAAC reported that continuous ash emissions rose to 1.5-1.8 km altitude and drifted W and NW during 1240-1300 on 10 March, based on satellite images, weather models, and PVMBG webcams. White-and-gray ash plumes rose 500 m and 300 m above the summit and drifted SW at 1446 and 1846 on 18 March, respectively. An eruptive event was recorded at 2143, though it was not visible due to darkness. Multiple ash plumes were reported during 27-29 March that rose as high as 2.5 km above the summit and drifted NE, W, and SW (figure 136). Webcam images captured incandescent ejecta above the vent at 0415 and around the summit area at 2003 on 28 March and at 0047 above the vent on 29 March.
Daily white gas-and-steam plumes rose 25-300 m above the summit and drifted in multiple directions during April and May. White-and-gray and black plumes rose 50-300 m above the summit on 2 and 9 April. On 11 May at 1241 a gray ash plume rose 1-3 km above the summit and drifted SW. On 12 May at 0920 a gray ash plume rose 2.5 km above the summit and drifted SW and at 2320 an ash plume rose 1.5 km above the summit and drifted SW. An accompanying webcam image showed incandescent ejecta. On 13 May at 0710 a gray ash plume rose 2 km above the summit and drifted SW (figure 137).
The MIROVA (Middle InfraRed Observation of Volcanic Activity) graph of MODIS thermal anomaly data showed intermittent low-to-moderate power thermal anomalies during November 2022 through April 2023 (figure 138). Some of this thermal activity was also visible in infrared satellite imagery at the crater, accompanied by gas-and-steam and ash plumes that drifted in different directions (figure 139).
Geologic Background. The renowned Krakatau (frequently mis-named as Krakatoa) volcano lies in the Sunda Strait between Java and Sumatra. Collapse of an older edifice, perhaps in 416 or 535 CE, formed a 7-km-wide caldera. Remnants of that volcano are preserved in Verlaten and Lang Islands; subsequently the Rakata, Danan, and Perbuwatan cones were formed, coalescing to create the pre-1883 Krakatau Island. Caldera collapse during the catastrophic 1883 eruption destroyed Danan and Perbuwatan, and left only a remnant of Rakata. This eruption caused more than 36,000 fatalities, most as a result of tsunamis that swept the adjacent coastlines of Sumatra and Java. Pyroclastic surges traveled 40 km across the Sunda Strait and reached the Sumatra coast. After a quiescence of less than a half century, the post-collapse cone of Anak Krakatau (Child of Krakatau) was constructed within the 1883 caldera at a point between the former Danan and Perbuwatan cones. Anak Krakatau has been the site of frequent eruptions since 1927.
Information Contacts: Pusat Vulkanologi dan Mitigasi Bencana Geologi (PVMBG, also known as Indonesian Center for Volcanology and Geological Hazard Mitigation, CVGHM), Jalan Diponegoro 57, Bandung 40122, Indonesia (URL: http://www.vsi.esdm.go.id/); MAGMA Indonesia, Kementerian Energi dan Sumber Daya Mineral (URL: https://magma.esdm.go.id/v1); Darwin Volcanic Ash Advisory Centre (VAAC), Bureau of Meteorology, Northern Territory Regional Office, PO Box 40050, Casuarina, NT 0811, Australia (URL: http://www.bom.gov.au/info/vaac/); MIROVA (Middle InfraRed Observation of Volcanic Activity), a collaborative project between the Universities of Turin and Florence (Italy) supported by the Centre for Volcanic Risk of the Italian Civil Protection Department (URL: http://www.mirovaweb.it/); Copernicus Browser, Copernicus Data Space Ecosystem, European Space Agency (URL: https://dataspace.copernicus.eu/browser/).
Stromboli
Italy
38.789°N, 15.213°E; summit elev. 924 m
All times are local (unless otherwise noted)
Strombolian explosions and lava flows continue during January-April 2023
Stromboli, located in Italy, has exhibited nearly constant lava fountains for the past 2,000 years; recorded eruptions date back to 350 BCE. Eruptive activity occurs at the summit from multiple vents, which include a north crater area (N area) and a central-southern crater (CS area) on a terrace known as the ‘terrazza craterica’ at the head of the Sciara del Fuoco, a large scarp that runs from the summit down the NW side of the volcano-island. Activity typically consists of Strombolian explosions, incandescent ejecta, lava flows, and pyroclastic flows. Thermal and visual monitoring cameras are located on the nearby Pizzo Sopra La Fossa, above the terrazza craterica, and at multiple flank locations. The current eruption period has been ongoing since 1934 and recent activity has consisted of frequent Strombolian explosions and lava flows (BGVN 48:02). This report updates activity during January through April 2023 primarily characterized by Strombolian explosions and lava flows based on reports from Italy's Istituto Nazionale di Geofisica e Vulcanologia (INGV) and various satellite data.
Frequent explosive activity continued throughout the reporting period, generally in the low-to-medium range, based on the number of hourly explosions in the summit crater (figure 253, table 16). Intermittent thermal activity was recorded by the MIROVA (Middle InfraRed Observation of Volcanic Activity) analysis of MODIS satellite data (figure 254). According to data collected by the MODVOLC thermal algorithm, a total of 9 thermal alerts were detected: one on 2 January 2023, one on 1 February, five on 24 March, and two on 26 March. The stronger pulses of thermal activity likely reflected lava flow events. Infrared satellite imagery captured relatively strong thermal hotspots at the two active summit craters on clear weather days, showing an especially strong event on 8 March (figure 255).
Table 16. Summary of type, frequency, and intensity of explosive activity at Stromboli by month during January-April 2023; information from webcam observations. Courtesy of INGV weekly reports.
| Month |
Explosive Activity |
| Jan 2023 |
Typical Strombolian activity with spattering and lava overflows in the N crater area. Explosions were reported from 4 vents in the N area and 1-2 vents in the CS area. The average hourly frequency of explosions was low-to-medium (1-12 events/hour). The intensity of the explosions varied from low (less than 80 m high) to medium (less than 150 m high) in the N crater area and up to high (greater than 150 m high) in the CS crater area. |
| Feb 2023 |
Typical Strombolian activity with spattering in the N crater area. Explosions were reported from 2-3 vents in the N area and 1-4 vents in the CS area. The average hourly frequency of explosions was low-to-medium (1-14 events/hour). The intensity of the explosions varied from low (less than 80 m high) to medium (less than 150 m high) in the N crater area and up to high (greater than 150 m high) in the CS crater area. |
| Mar 2023 |
Typical Strombolian activity with spattering and lava overflows in the N crater area. Explosions were reported from 2-3 vents in the N area and 2-4 vents in the CS area. The average hourly frequency of explosions was low-to-medium (1-18 events/hour). The intensity of the explosions varied from low (less than 80 m high) to medium (less than 150 m high) in the N crater area and up to high (greater than 150 m high) in the CS crater area. |
| Apr 2023 |
Typical Strombolian activity. Explosions were reported from 2 vents in the N area and 2-3 vents in the CS area. The average hourly frequency of explosions was low-to-high (1-16 events/hour). The intensity of the explosions varied from low (less than 80 m high) to medium (less than 150 m high) in both the N and CS crater areas. |
Activity during January-February 2023. Strombolian explosions were reported in the N crater area, as well as lava effusion. Explosive activity in the N crater area ejected coarse material (bombs and lapilli). Intense spattering was observed in both the N1 and N2 craters. In the CS crater area, explosions generally ejected fine material (ash), sometimes to heights greater than 250 m. The intensity of the explosions was characterized as low-to-medium in the N crater and medium-to-high in the CS crater. After intense spattering activity from the N crater area, a lava overflow began at 2136 on 2 January that flowed part way down the Sciara del Fuoco, possibly moving down the drainage that formed in October, out of view from webcams. The flow remained active for a couple of hours before stopping and beginning to cool. A second lava flow was reported at 0224 on 4 January that similarly remained active for a few hours before stopping and cooling. Intense spattering was observed on 11 and 13 January from the N1 crater. After intense spattering activity at the N2 crater at 1052 on 17 January another lava flow started to flow into the upper part of the Sciara del Fuoco (figure 256), dividing into two: one that traveled in the direction of the drainage formed in October, and the other one moving parallel to the point of emission. By the afternoon, the rate of the flow began to decrease, and at 1900 it started to cool. A lava flow was reported at 1519 on 24 January following intense spattering in the N2 area, which began to flow into the upper part of the Sciara del Fuoco. By the morning of 25 January, the lava flow had begun to cool. During 27 January the frequency of eruption in the CS crater area increased to 6-7 events/hour compared to the typical 1-7 events/hour; the following two days showed a decrease in frequency to less than 1 event/hour. Starting at 1007 on 30 January a high-energy explosive sequence was produced by vents in the CS crater area. The sequence began with an initial energetic pulse that lasted 45 seconds, ejecting predominantly coarse products 300 m above the crater that fell in an ESE direction. Subsequent and less intense explosions ejected material 100 m above the crater. The total duration of this event lasted approximately two minutes. During 31 January through 6, 13, and 24 February spattering activity was particularly intense for short periods in the N2 crater.
An explosive sequence was reported on 16 February that was characterized by a major explosion in the CS crater area (figure 257). The sequence began at 1817 near the S2 crater that ejected material radially. A few seconds later, lava fountains were observed in the central part of the crater. Three explosions of medium intensity (material was ejected less than 150 m high) were recorded at the S2 crater. The first part of this sequence lasted approximately one minute, according to INGV, and material rose 300 m above the crater and then was deposited along the Sciara del Fuoco. The second phase began at 1818 at the S1 crater; it lasted seven seconds and material was ejected 150 m above the crater. Another event 20 seconds later lasted 12 seconds, also ejecting material 150 m above the crater. The sequence ended with at least three explosions of mostly fine material from the S1 crater. The total duration of this sequence was about two minutes.
Short, intense spattering activity was noted above the N1 crater on 27 and 28 February. A lava overflow was first reported at 0657 from the N2 crater on 27 February that flowed into the October 2022 drainage. By 1900 the flow had stopped. A second lava overflow also in the N crater area occurred at 2149, which overlapped the first flow and then stopped by 0150 on 28 February. Material detached from both the lava overflows rolled down the Sciara del Fuoco, some of which was visible in webcam images.
Activity during March-April 2023. Strombolian activity continued with spattering activity and lava overflows in the N crater area during March. Explosive activity at the N crater area varied from low (less than 80 m high) to medium (less than 150 m high) and ejected coarse material, such as bombs and lapilli. Spattering was observed above the N1 crater, while explosive activity at the CS crater area varied from medium to high (greater than 150 m high) and ejected coarse material. Intense spattering activity was observed for short periods on 6 March above the N1 crater. At approximately 0610 a lava overflow was reported around the N2 crater on 8 March, which then flowed into the October 2022 drainage. By 1700 the flow started to cool. A second overflow began at 1712 on 9 March and overlapped the previous flow. It had stopped by 2100. Material from both flows was deposited along the Sciara del Fuoco, though much of the activity was not visible in webcam images. On 11 March a lava overflow was observed at 0215 that overlapped the two previous flows in the October 2022 drainage. By late afternoon on 12 March, it had stopped.
During a field excursion on 16 March, scientists noted that a vent in the central crater area was degassing. Another vent showed occasional Strombolian activity that emitted ash and lapilli. During 1200-1430 low-to-medium intense activity was reported; the N1 crater emitted ash emissions and the N2 crater emitted both ash and coarse material. Some explosions also occurred in the CS crater area that ejected coarse material. The C crater in the CS crater area occasionally showed gas jetting and low intensity explosions on 17 and 22 March; no activity was observed at the S1 crater. Intense, longer periods of spattering were reported in the N1 crater on 19, 24, and 25 March. Around 2242 on 23 March a lava overflow began from the N1 crater that, after about an hour, began moving down the October 2022 drainage and flow along the Sciara del Fuoco (figure 258). Between 0200 and 0400 on 26 March the flow rate increased, which generated avalanches of material from collapses at the advancing flow front. By early afternoon, the flow began to cool. On 25 March at 1548 an explosive sequence began from one of the vents at S2 in the CS crater area (figure 258). Fine ash mixed with coarse material was ejected 300 m above the crater rim and drifted SSE. Some modest explosions around Vent C were detected at 1549 on 25 March, which included an explosion at 1551 that ejected coarse material. The entire explosive sequence lasted approximately three minutes.
During April explosions persisted in both the N and CS crater areas. Fine material was ejected less than 80 m above the N crater rim until 6 April, followed by ejection of coarser material. Fine material was also ejected less than 80 m above the CS crater rim. The C and S2 crater did not show significant eruptive activity. On 7 April an explosive sequence was detected in the CS crater area at 1203 (figure 259). The first explosion lasted approximately 18 seconds and ejected material 400 m above the crater rim, depositing pyroclastic material in the upper part of the Sciara del Fuoco. At 1204 a second, less intense explosion lasted approximately four seconds and deposited pyroclastic products outside the crater area and near Pizzo Sopra La Fossa. A third explosion at 1205 was mainly composed of ash that rose about 150 m above the crater and lasted roughly 20 seconds. A fourth explosion occurred at 1205 about 28 seconds after the third explosion and ejected a mixture of coarse and fine material about 200 m above the crater; the explosion lasted roughly seven seconds. Overall, the entire explosive sequence lasted about two minutes and 20 seconds. After the explosive sequence on 7 April, explosions in both the N and CS crater areas ejected material as high as 150 m above the crater.
On 21 April research scientists from INGV made field observations in the summit area of Stromboli, and some lapilli samples were collected. In the N crater area near the N1 crater, a small cone was observed with at least two active vents, one of which was characterized by Strombolian explosions. The other vent produced explosions that ejected ash and chunks of cooled lava. At the N2 crater at least one vent was active and frequently emitted ash. In the CS crater area, a small cone contained 2-3 degassing vents and a smaller, possible fissure area also showed signs of degassing close to the Pizzo Sopra La Fossa. In the S part of the crater, three vents were active: a small hornito was characterized by modest and rare explosions, a vent that intermittently produced weak Strombolian explosions, and a vent at the end of the terrace that produced frequent ash emissions. Near the S1 crater there was a hornito that generally emitted weak gas-and-steam emissions, sometimes associated with “gas rings”. On 22 April another field inspection was carried out that reported two large sliding surfaces on the Sciara del Fuoco that showed where blocks frequently descended toward the sea. A thermal anomaly was detected at 0150 on 29 April.
Geologic Background. Spectacular incandescent nighttime explosions at Stromboli have long attracted visitors to the "Lighthouse of the Mediterranean" in the NE Aeolian Islands. This volcano has lent its name to the frequent mild explosive activity that has characterized its eruptions throughout much of historical time. The small island is the emergent summit of a volcano that grew in two main eruptive cycles, the last of which formed the western portion of the island. The Neostromboli eruptive period took place between about 13,000 and 5,000 years ago. The active summit vents are located at the head of the Sciara del Fuoco, a prominent scarp that formed about 5,000 years ago due to a series of slope failures which extends to below sea level. The modern volcano has been constructed within this scarp, which funnels pyroclastic ejecta and lava flows to the NW. Essentially continuous mild Strombolian explosions, sometimes accompanied by lava flows, have been recorded for more than a millennium.
Information Contacts: Istituto Nazionale di Geofisica e Vulcanologia (INGV), Sezione di Catania, Piazza Roma 2, 95123 Catania, Italy, (URL: http://www.ct.ingv.it/en/); MIROVA (Middle InfraRed Observation of Volcanic Activity), a collaborative project between the Universities of Turin and Florence (Italy) supported by the Centre for Volcanic Risk of the Italian Civil Protection Department (URL: http://www.mirovaweb.it/); Hawai'i Institute of Geophysics and Planetology (HIGP) - MODVOLC Thermal Alerts System, School of Ocean and Earth Science and Technology (SOEST), Univ. of Hawai'i, 2525 Correa Road, Honolulu, HI 96822, USA (URL: http://modis.higp.hawaii.edu/); Copernicus Browser, Copernicus Data Space Ecosystem, European Space Agency (URL: https://dataspace.copernicus.eu/browser/).
Nishinoshima (Japan) — July 2023 Cite this Report
Nishinoshima
Japan
27.247°N, 140.874°E; summit elev. 100 m
All times are local (unless otherwise noted)
Small ash plumes and fumarolic activity during November 2022 through April 2023
Nishinoshima is a small island located about 1,000 km S of Tokyo in the Ogasawara Arc in Japan. The island is the summit of a massive submarine volcano that has prominent peaks to the S, W, and NE. Eruptions date back to 1973; the most recent eruption period began in October 2022 and was characterized by ash plumes and fumarolic activity (BGVN 47:12). This report describes ash plumes and fumarolic activity during November 2022 through April 2023 based on monthly reports from the Japan Meteorological Agency (JMA) monthly reports and satellite data.
The most recent eruptive activity prior to the reporting internal occurred on 12 October 2022, when an ash plume rose 3.5 km above the crater rim. An aerial observation conducted by the Japan Coast Guard (JCG) on 25 November reported that white fumaroles rose approximately 200 m above the central crater of a pyroclastic cone (figure 119), and multiple plumes were observed on the ESE flank of the cone. Discolored water ranging from reddish-brown to brown and yellowish-green were visible around the perimeter of the island (figure 119). No significant activity was reported in December.
During an overflight conducted by JCG on 25 January 2023 intermittent activity and small, blackish-gray plumes rose 900 m above the central part of the crater were observed (figure 120). The fumarolic zone of the E flank and base of the cone had expanded and emissions had intensified. Dark brown discolored water was visible around the perimeter of the island.
No significant activity was reported during February through March. Ash plumes at 1050 and 1420 on 11 April rose 1.9 km above the crater rim and drifted NW and N. These were the first ash plumes observed since 12 October 2022. On 14 April JCG carried out an overflight and reported that no further eruptive activity was visible, although white gas-and-steam plumes were visible from the central crater and rose 900 m high (figure 121). Brownish and yellow-green discolored water surrounded the island.
Intermittent low-to-moderate power thermal anomalies were recorded in the MIROVA graph (Middle InfraRed Observation of Volcanic Activity) during November 2022 through April 2023 (figure 123). A cluster of six to eight anomalies were detected during November while a smaller number were detected during the following months: two to three during December, one during mid-January 2023, one during February, five during March, and two during April. Thermal activity was also reflected in infrared satellite data at the summit crater, accompanied by occasional gas-and-steam plumes (figure 124).
Geologic Background. The small island of Nishinoshima was enlarged when several new islands coalesced during an eruption in 1973-74. Multiple eruptions that began in 2013 completely covered the previous exposed surface and continued to enlarge the island. The island is the summit of a massive submarine volcano that has prominent peaks to the S, W, and NE. The summit of the southern cone rises to within 214 m of the ocean surface 9 km SSE.
Information Contacts: Japan Meteorological Agency (JMA), 1-3-4 Otemachi, Chiyoda-ku, Tokyo 100-8122, Japan (URL: http://www.jma.go.jp/jma/indexe.html); MIROVA (Middle InfraRed Observation of Volcanic Activity), a collaborative project between the Universities of Turin and Florence (Italy) supported by the Centre for Volcanic Risk of the Italian Civil Protection Department (URL: http://www.mirovaweb.it/); Copernicus Browser, Copernicus Data Space Ecosystem, European Space Agency (URL: https://dataspace.copernicus.eu/browser/).
Karangetang (Indonesia) — July 2023 Cite this Report
Karangetang
Indonesia
2.781°N, 125.407°E; summit elev. 1797 m
All times are local (unless otherwise noted)
Lava flows, incandescent avalanches, and ash plumes during January-June 2023
Karangetang (also known as Api Siau), at the northern end of the island of Siau, Indonesia, contains five summit craters along a N-S line. More than 40 eruptions have been recorded since 1675; recent eruptions have included frequent explosive activity, sometimes accompanied by pyroclastic flows and lahars. Lava dome growth has occurred in the summit craters and collapses of lava flow fronts have produced pyroclastic flows. The two active summit craters are Kawah Dua (the N crater) and Kawah Utama (the S crater, also referred to as the “Main Crater”). The most recent eruption began in late November 2018 and has more recently consisted of weak thermal activity and gas-and-steam emissions (BGVN 48:01). This report updates activity characterized by lava flows, incandescent avalanches, and ash plumes during January through June 2023 using reports from Pusat Vulkanologi dan Mitigasi Bencana Geologi (PVMBG, also known as CVGHM, or the Center of Volcanology and Geological Hazard Mitigation), MAGMA Indonesia, the Darwin VAAC (Volcano Ash Advisory Center), and satellite data.
Activity during January was relatively low and mainly consisted of white gas-and-steam emissions that rose 25-150 m above Main Crater (S crater) and drifted in different directions. Incandescence was visible from the lava dome in Kawah Dua (the N crater). Weather conditions often prevented clear views of the summit. On 18 January the number of seismic signals that indicated avalanches of material began to increase. In addition, there were a total of 71 earthquakes detected during the month.
Activity continued to increase during the first week of February. Material from Main Crater traveled as far as 800 m down the Batuawang (S) and Batang (W) drainages and as far as 1 km W down the Beha (W) drainage on 4 February. On 6 February 43 earthquake events were recorded, and on 7 February, 62 events were recorded. White gas-and-steam emissions rose 25-250 m above both summit craters throughout the month. PVMBG reported an eruption began during the evening of 8 February around 1700. Photos showed incandescent material at Main Crater. Incandescent material had also descended the flank in at least two unconfirmed directions as far as 2 km from Main Crater, accompanied by ash plumes (figure 60). As a result, PVMBG increased the Volcano Alert Level (VAL) to 3 (the second highest level on a 1-4 scale).
Occasional nighttime webcam images showed three main incandescent lava flows of differing lengths traveling down the S, SW, and W flanks (figure 61). Incandescent rocks were visible on the upper flanks, possibly from ejected or collapsed material from the crater, and incandescence was the most intense at the summit. Based on analyses of satellite imagery and weather models, the Darwin VAAC reported that daily ash plumes during 16-20 February rose to 2.1-3 km altitude and drifted NNE, E, and SE. BNPB reported on 16 February that as many as 77 people were evacuated and relocated to the East Siau Museum. A webcam image taken at 2156 on 17 February possibly showed incandescent material descending the SE flank. Ash plumes rose to 2.1 km altitude and drifted SE during 22-23 February, according to the Darwin VAAC.
Incandescent avalanches of material and summit incandescence at Main Crater continued during March. White gas-and-steam emissions during March generally rose 25-150 m above the summit crater; on 31 March gas-and-steam emissions rose 200-400 m high. An ash plume rose to 2.4 km altitude and drifted S at 1710 on 9 March and a large thermal anomaly was visible in images taken at 0550 and 0930 on 10 March. Incandescent material was visible at the summit and on the flanks based on webcam images taken at 0007 and 2345 on 16 March, at 1828 on 17 March, at 1940 on 18 March, at 2311 on 19 March, and at 2351 on 20 March. Incandescence was most intense on 18 and 20 March and webcam images showed possible Strombolian explosions (figure 62). An ash plume rose to 2.4 km altitude and drifted SW on 18 March, accompanied by a thermal anomaly.
Summit crater incandescence at Main Crater and on the flanks persisted during April. Incandescent material at the S crater and on the flanks was reported at 0016 on 1 April. The lava flows had stopped by 1 April according to PVMBG, although incandescence was still visible up to 10 m high. Seismic signals indicating effusion decreased and by 6 April they were no longer detected. Incandescence was visible from both summit craters. On 26 April the VAL was lowered to 2 (the second lowest level on a 1-4 scale). White gas-and-steam emissions rose 25-200 m above the summit crater.
During May white gas-and-steam emissions generally rose 50-250 m above the summit, though it was often cloudy, which prevented clear views; on 21 May gas-and-steam emissions rose 50-400 m high. Nighttime N summit crater incandescence rose 10-25 m above the lava dome, and less intense incandescence was noted above Main Crater, which reached about 10 m above the dome. Sounds of falling rocks at Main Crater were heard on 15 May and the seismic network recorded 32 rockfall events in the crater on 17 May. Avalanches traveled as far as 1.5 km down the SW and S flanks, accompanied by rumbling sounds on 18 May. Incandescent material descending the flanks was captured in a webcam image at 2025 on 19 May (figure 63) and on 29 May; summit crater incandescence was observed in webcam images at 2332 on 26 May and at 2304 on 29 May. On 19 May the VAL was again raised to 3.
Occasional Main Crater incandescence was reported during June, as well as incandescent material on the flanks. White gas-and-steam emissions rose 10-200 m above the summit crater. Ash plumes rose to 2.1 km altitude and drifted SE and E during 2-4 June, according to the Darwin VAAC. Material on the flanks of Main Crater were observed at 2225 on 7 June, at 2051 on 9 June, at 0007 on 17 June, and at 0440 on 18 June. Webcam images taken on 21, 25, and 27 June showed incandescence at Main Crater and from material on the flanks.
MIROVA (Middle InfraRed Observation of Volcanic Activity) analysis of MODIS satellite data showed strong thermal activity during mid-February through March and mid-May through June, which represented incandescent avalanches and lava flows (figure 64). During April through mid-May the power of the anomalies decreased but frequent anomalies were still detected. Brief gaps in activity occurred during late March through early April and during mid-June. Infrared satellite images showed strong lava flows mainly affecting the SW and S flanks, accompanied by gas-and-steam emissions (figure 65). According to data recorded by the MODVOLC thermal algorithm, there were a total of 79 thermal hotspots detected: 28 during February, 24 during March, one during April, five during May, and 21 during June.
Geologic Background. Karangetang (Api Siau) volcano lies at the northern end of the island of Siau, about 125 km NNE of the NE-most point of Sulawesi. The stratovolcano contains five summit craters along a N-S line. It is one of Indonesia's most active volcanoes, with more than 40 eruptions recorded since 1675 and many additional small eruptions that were not documented (Neumann van Padang, 1951). Twentieth-century eruptions have included frequent explosive activity sometimes accompanied by pyroclastic flows and lahars. Lava dome growth has occurred in the summit craters; collapse of lava flow fronts have produced pyroclastic flows.
Information Contacts: Pusat Vulkanologi dan Mitigasi Bencana Geologi (PVMBG, also known as Indonesian Center for Volcanology and Geological Hazard Mitigation, CVGHM), Jalan Diponegoro 57, Bandung 40122, Indonesia (URL: http://www.vsi.esdm.go.id/); MAGMA Indonesia, Kementerian Energi dan Sumber Daya Mineral (URL: https://magma.esdm.go.id/v1); Badan Nasional Penanggulangan Bencana (BNPB), National Disaster Management Agency, Graha BNPB - Jl. Scout Kav.38, East Jakarta 13120, Indonesia (URL: http://www.bnpb.go.id/); Darwin Volcanic Ash Advisory Centre (VAAC), Bureau of Meteorology, Northern Territory Regional Office, PO Box 40050, Casuarina, NT 0811, Australia (URL: http://www.bom.gov.au/info/vaac/); MIROVA (Middle InfraRed Observation of Volcanic Activity), a collaborative project between the Universities of Turin and Florence (Italy) supported by the Centre for Volcanic Risk of the Italian Civil Protection Department (URL: http://www.mirovaweb.it/); Hawai'i Institute of Geophysics and Planetology (HIGP) - MODVOLC Thermal Alerts System, School of Ocean and Earth Science and Technology (SOEST), Univ. of Hawai'i, 2525 Correa Road, Honolulu, HI 96822, USA (URL: http://modis.higp.hawaii.edu/); Copernicus Browser, Copernicus Data Space Ecosystem, European Space Agency (URL: https://dataspace.copernicus.eu/browser/); IDN Times, Jl. Jend. Gatot Subroto Kav. 27 3rd Floor Kuningan, Jakarta, Indonesia 12950, Status of Karangetang Volcano in Sitaro Islands Increases (URL: https://sulsel.idntimes.com/news/indonesia/savi/status-gunung-api-karangetang-di-kepulauan-sitaro-meningkat?page=all).
Ahyi (United States) — July 2023 Cite this Report
Ahyi
United States
20.42°N, 145.03°E; summit elev. -75 m
All times are local (unless otherwise noted)
Intermittent hydroacoustic signals and discolored plumes during November 2022-June 2023
Ahyi seamount is a large, conical submarine volcano that rises to within 75 m of the ocean surface about 18 km SE of the island of Farallon de Pajaros in the Northern Marianas. The remote location of the seamount has made eruptions difficult to document, but seismic stations installed in the region confirmed an eruption in the vicinity in 2001. No new activity was detected until April-May 2014 when an eruption was detected by NOAA (National Oceanic and Atmospheric Administration) divers, hydroacoustic sensors, and seismic stations (BGVN 42:04). New activity was first detected on 15 November by hydroacoustic sensors that were consistent with submarine volcanic activity. This report covers activity during November 2022 through June 2023 based on daily and weekly reports from the US Geological Survey.
Starting in mid-October, hydroacoustic sensors at Wake Island (2.2 km E) recorded signals consistent with submarine volcanic activity, according to a report from the USGS issued on 15 November 2022. A combined analysis of the hydroacoustic signals and seismic stations located at Guam and Chichijima Island, Japan, suggested that the source of this activity was at or near the Ahyi seamount. After a re-analysis of a satellite image of the area that was captured on 6 November, USGS confirmed that there was no evidence of discoloration at the ocean surface. Few hydroacoustic and seismic signals continued through November, including on 18 November, which USGS suggested signified a decline or pause in unrest. A VONA (Volcano Observatory Notice for Aviation) reported that a discolored water plume was persistently visible in satellite data starting on 18 November (figure 6). Though clouds often obscured clear views of the volcano, another discolored water plume was captured in a satellite image on 26 November. The Aviation Color Code (ACC) was raised to Yellow (the second lowest level on a four-color scale) and the Volcano Alert Level (VAL) was raised to Advisory (the second lowest level on a four-level scale) on 29 November.
During December, occasional detections were recorded on the Wake Island hydrophone sensors and discolored water over the seamount remained visible. During 2-7, 10-12, and 16-31 December possible explosion signals were detected. A small area of discolored water was observed in high-resolution Sentinel-2 satellite images during 1-6 December (figure 7). High-resolution satellite images recorded discolored water plumes on 13 December that originated from the summit region; no observations indicated that activity breached the ocean surface. A possible underwater plume was visible in satellite images on 18 December, and during 19-20 December a definite but diffuse underwater plume located SSE from the main vent was reported. An underwater plume was visible in a satellite image taken on 26 December (figure 7).
Hydrophone sensors continued to detect signals consistent with possible explosions during 1-8 January 2023. USGS reported that the number of detections decreased during 4-5 January. The hydrophone sensors experienced a data outage that started at 0118 on 8 January and continued through 10 January, though according to USGS, possible explosions were recorded prior to the data outage and likely continued during the outage. A discolored water plume originating from the summit region was detected in a partly cloudy satellite image on 8 January. On 11-12 and 15-17 January possible explosion signals were recorded again. One small signal was detected during 22-23 January and several signals were recorded on 25 and 31 January. During 27-31 January a plume of discolored water was observed above the seamount in satellite imagery (figure 8).
Low levels of activity continued during February and March, based on data from pressure sensors on Wake Island. During 1 and 4-6 February activity was reported, and a submarine plume was observed on 4 February (figure 8). Possible explosion signals were detected during 7-8, 10, 13-14, and 24 February. During 1-2 and 3-5 March a plume of discolored water was observed in satellite imagery (figure 8). Almost continuous hydroacoustic signals were detected in remote pressure sensor data on Wake Island 2,270 km E from the volcano during 7-13 March. During 12-13 March water discoloration around the seamount was observed in satellite imagery, despite cloudy weather. By 14 March discolored water extended about 35 km, but no direction was noted. USGS reported that the continuous hydroacoustic signals detected during 13-14 March stopped abruptly on 14 March and no new detections were observed. Three 30 second hydroacoustic detections were reported during 17-19 March, but no activity was visible due to cloudy weather. A data outage was reported during 21-22 March, making pressure sensor data unavailable; a discolored water plume was, however, visible in satellite data. A possible underwater explosion signal was detected by pressure sensors at Wake Island on 26, 29, and 31 March, though the cause and origin of these events were unclear.
Similar low activity continued during April, May, and June. Several signals were detected during 1-3 April in pressure sensors at Wake Island. USGS suggested that these may be related to underwater explosions or earthquakes at the volcano, but no underwater plumes were visible in clear satellite images. The pressure sensors had data outages during 12-13 April and no data were recorded; no underwater plumes were visible in satellite images, although cloudy weather obscured most clear views. Eruptive activity was reported starting at 2210 on 21 May. On 22 May a discolored water plume that extended 4 km was visible in satellite images, though no direction was recorded. During 23-24 May some signals were detected by the underwater pressure sensors. Possible hydroacoustic signals were detected during 2-3 and 6-8 June. Multiple hydroacoustic signals were detected during 9-11 and 16-17 June, although no activity was visible in satellite images. One hydroacoustic signal was detected during 23-24 June, but there was some uncertainty about its association with volcanic activity. A single possible hydroacoustic signal was detected during 30 June to 1 July.
Geologic Background. Ahyi seamount is a large conical submarine volcano that rises to within 75 m of the ocean surface ~18 km SE of the island of Farallon de Pajaros in the northern Marianas. Water discoloration has been observed there, and in 1979 the crew of a fishing boat felt shocks over the summit area, followed by upwelling of sulfur-bearing water. On 24-25 April 2001 an explosive eruption was detected seismically by a station on Rangiroa Atoll, Tuamotu Archipelago. The event was well constrained (+/- 15 km) at a location near the southern base of Ahyi. An eruption in April-May 2014 was detected by NOAA divers, hydroacoustic sensors, and seismic stations.
Information Contacts: US Geological Survey, Volcano Hazards Program (USGS-VHP), 12201 Sunrise Valley Drive, Reston, VA, USA, https://volcanoes.usgs.gov/index.html; Copernicus Browser, Copernicus Data Space Ecosystem, European Space Agency (URL: https://dataspace.copernicus.eu/browser/).
Kadovar (Papua New Guinea) — June 2023 Cite this Report
Kadovar
Papua New Guinea
3.608°S, 144.588°E; summit elev. 365 m
All times are local (unless otherwise noted)
An ash plume and weak thermal anomaly during May 2023
Kadovar is a 2-km-wide island that is the emergent summit of a Bismarck Sea stratovolcano. It lies off the coast of New Guinea, about 25 km N of the mouth of the Sepik River. Prior to an eruption that began in 2018, a lava dome formed the high point of the volcano, filling an arcuate landslide scarp open to the S. Submarine debris-avalanche deposits occur to the S of the island. The current eruption began in January 2018 and has comprised lava effusion from vents at the summit and at the E coast; more recent activity has consisted of ash plumes, weak thermal activity, and gas-and-steam plumes (BGVN 48:02). This report covers activity during February through May 2023 using information from the Darwin Volcanic Ash Advisory Center (VAAC) and satellite data.
Activity during the reporting period was relatively low and mainly consisted of white gas-and-steam plumes that were visible in natural color satellite images on clear weather days (figure 67). According to a Darwin VAAC report, at 2040 on 6 May an ash plume rose to 4.6 km altitude and drifted W; by 2300 the plume had dissipated. MODIS satellite instruments using the MODVOLC thermal algorithm detected a single thermal hotspot on the SE side of the island on 7 May. Weak thermal activity was also detected in a satellite image on the E side of the island on 14 May, accompanied by a white gas-and-steam plume that drifted SE (figure 68).
Geologic Background. The 2-km-wide island of Kadovar is the emergent summit of a Bismarck Sea stratovolcano of Holocene age. It is part of the Schouten Islands, and lies off the coast of New Guinea, about 25 km N of the mouth of the Sepik River. Prior to an eruption that began in 2018, a lava dome formed the high point of the andesitic volcano, filling an arcuate landslide scarp open to the south; submarine debris-avalanche deposits occur in that direction. Thick lava flows with columnar jointing forms low cliffs along the coast. The youthful island lacks fringing or offshore reefs. A period of heightened thermal phenomena took place in 1976. An eruption began in January 2018 that included lava effusion from vents at the summit and at the E coast.
Information Contacts: Darwin Volcanic Ash Advisory Centre (VAAC), Bureau of Meteorology, Northern Territory Regional Office, PO Box 40050, Casuarina, NT 0811, Australia (URL: http://www.bom.gov.au/info/vaac/); Hawai'i Institute of Geophysics and Planetology (HIGP) - MODVOLC Thermal Alerts System, School of Ocean and Earth Science and Technology (SOEST), Univ. of Hawai'i, 2525 Correa Road, Honolulu, HI 96822, USA (URL: http://modis.higp.hawaii.edu/); Copernicus Browser, Copernicus Data Space Ecosystem, European Space Agency (URL: https://dataspace.copernicus.eu/browser/).
San Miguel (El Salvador) — June 2023 Cite this Report
San Miguel
El Salvador
13.434°N, 88.269°W; summit elev. 2130 m
All times are local (unless otherwise noted)
Small gas-and-ash explosions during March and May 2023
San Miguel in El Salvador is a broad, deep crater complex that has been frequently modified by eruptions recorded since the early 16th century and consists of the summit known locally as Chaparrastique. Flank eruptions have produced lava flows that extended to the N, NE, and SE during the 17-19th centuries. The most recent activity has consisted of minor ash eruptions from the summit crater. The current eruption period began in November 2022 and has been characterized by frequent phreatic explosions, gas-and-ash emissions, and sulfur dioxide plumes (BGVN 47:12). This report describes small gas-and-ash explosions during December 2022 through May 2023 based on special reports from the Ministero de Medio Ambiente y Recursos Naturales (MARN).
Activity has been relatively low since the last recorded explosions on 29 November 2022. Seismicity recorded by the San Miguel Volcano Station (VSM) located on the N flank at 1.7 km elevation had decreased by 7 December. Sulfur dioxide gas measurements taken with DOAS (Differential Optical Absorption Spectroscopy) mobile equipment were below typical previously recorded values: 300 tons per day (t/d). During December, small explosions were recorded by the seismic network and manifested as gas-and-steam emissions.
Gas-and-ash explosions in the crater occurred during January 2023, which were recorded by the seismic network. Sulfur dioxide values remained low, between 300-400 t/d through 10 March. At 0817 on 14 January a gas-and-ash emission was visible in webcam images, rising just above the crater rim. Some mornings during February, small gas-and-steam plumes were visible in the crater. On 7 March at 2252 MARN noted an increase in degassing from the central crater; gas emissions were constantly observed through the early morning hours on 8 March. During the early morning of 8 March through the afternoon on 9 March, 12 emissions were registered, some accompanied by ash. The last gas-and-ash emission was recorded at 1210 on 9 March; very fine ashfall was reported in El Tránsito (10 km S), La Morita (6 km W), and La Piedrita (3 km W). The smell of sulfur was reported in Piedra Azul (5 km SW). On 16 March MARN reported that gas-and-steam emissions decreased.
Low degassing and very low seismicity were reported during April; no explosions have been detected between 9 March and 27 May. The sulfur dioxide emissions remained between 350-400 t/d; during 13-20 April sulfur dioxide values fluctuated between 30-300 t/d. Activity remained low through most of May; on 23 May seismicity increased. An explosion was detected at 1647 on 27 May generated a gas-and-ash plume that rose 700 m high (figure 32); a decrease in seismicity and gas emissions followed. The DOAS station installed on the W flank recorded sulfur dioxide values that reached 400 t/d on 27 May; subsequent measurements showed a decrease to 268 t/d on 28 May and 100 t/d on 29 May.
Geologic Background. The symmetrical cone of San Miguel, one of the most active volcanoes in El Salvador, rises from near sea level to form one of the country's most prominent landmarks. A broad, deep, crater complex that has been frequently modified by eruptions recorded since the early 16th century caps the truncated unvegetated summit, also known locally as Chaparrastique. Flanks eruptions of the basaltic-andesitic volcano have produced many lava flows, including several during the 17th-19th centuries that extended to the N, NE, and SE. The SE-flank flows are the largest and form broad, sparsely vegetated lava fields crossed by highways and a railroad skirting the base of the volcano. Flank vent locations have migrated higher on the edifice during historical time, and the most recent activity has consisted of minor ash eruptions from the summit crater.
Information Contacts: Ministero de Medio Ambiente y Recursos Naturales (MARN), Km. 5½ Carretera a Nueva San Salvador, Avenida las Mercedes, San Salvador, El Salvador (URL: http://www.snet.gob.sv/ver/vulcanologia).
Semisopochnoi (United States) — June 2023 Cite this Report
Semisopochnoi
United States
51.93°N, 179.58°E; summit elev. 1221 m
All times are local (unless otherwise noted)
Occasional explosions, ash deposits, and gas-and-steam plumes during December 2022-May 2023
Semisopochnoi is located in the western Aleutians, is 20-km-wide at sea level, and contains an 8-km-wide caldera. The three-peaked Mount Young (formerly Cerberus) was constructed within the caldera during the Holocene. Each of these peaks contains a summit crater; the lava flows on the N flank appear younger than those on the S side. The current eruption period began in early February 2021 and has more recently consisted of intermittent explosions and ash emissions (BGVN 47:12). This report updates activity during December 2022 through May 2023 using daily, weekly, and special reports from the Alaska Volcano Observatory (AVO). AVO monitors the volcano using local seismic and infrasound sensors, satellite data, web cameras, and remote infrasound and lightning networks.
Activity during most of December 2022 was relatively quiet; according to AVO no eruptive or explosive activity was observed since 7 November 2022. Intermittent tremor and occasional small earthquakes were observed in geophysical data. Continuous gas-and-steam emissions were observed from the N crater of Mount Young in webcam images on clear weather days (figure 25). On 24 December, there was a slight increase in earthquake activity and several small possible explosion signals were detected in infrasound data. Eruptive activity resumed on 27 December at the N crater of Mount Young; AVO issued a Volcano Activity Notice (VAN) that reported minor ash deposits on the flanks of Mount Young that extended as far as 1 km from the vent, according to webcam images taken during 27-28 December (figure 26). No ash plumes were observed in webcam or satellite imagery, but a persistent gas-and-steam plume that might have contained some ash rose to 1.5 km altitude. As a result, AVO raised the Aviation Color Code (ACC) to Orange (the second highest level on a four-color scale) and the Volcano Alert Level (VAL) to Watch (the second highest level on a four-level scale). Possible explosions were detected during 21 December 2022 through 1 January 2023 and seismic tremor was recorded during 30-31 December.
During January 2023 eruptive activity continued at the active N crater of Mount Young. Minor ash deposits were observed on the flanks, extending about 2 km SSW, based on webcam images from 1 and 3 January. A possible explosion occurred during 1-2 January based on elevated seismicity recorded on local seismometers and an infrasound signal recorded minutes later by an array at Adak. Though no ash plumes were observed in webcam or satellite imagery, a persistent gas-and-steam plume rose to 1.5 km altitude that might have carried minor traces of ash. Ash deposits were accompanied by periods of elevated seismicity and infrasound signals from the local geophysical network, which AVO reported were likely due to weak explosive activity. Low-level explosive activity was also detected during 2-3 January, with minor gas-and-steam emissions and a new ash deposit that was visible in webcam images. Low-level explosive activity was detected in geophysical data during 4-5 January, with elevated seismicity and infrasound signals observed on local stations. Volcanic tremor was detected during 7-9 January and very weak explosive activity was detected in seismic and infrasound data on 9 January. Weak seismic and infrasound signals were recorded on 17 January, which indicated minor explosive activity, but no ash emissions were observed in clear webcam images; a gas-and-steam plume continued to rise to 1.5 km altitude. During 29-30 January, ash deposits near the summit were observed on fresh snow, according to webcam images.
The active N cone at Mount Young continued to produce a gas-and-steam plume during February, but no ash emissions or explosive events were detected. Seismicity remained elevated with faint tremor during early February. Gas-and-steam emissions from the N crater were observed in clear webcam images on 11-13 and 16 February; no explosive activity was detected in seismic, infrasound, or satellite data. Seismicity has also decreased, with no significant seismic tremor observed since 25 January. Therefore, the ACC was lowered to Yellow (the second lowest level on a four-color scale) and the VAL was lowered to Advisory (the second lowest level on a four-color scale) on 22 February.
Gas-and-steam emissions persisted during March from the N cone of Mount Young, based on clear webcam images. A few brief episodes of weak tremor were detected in seismic data, although seismicity decreased over the month. A gas-and-steam plume detected in satellite data extended 150 km on 18 March. Low-level ash emissions from the N cone at Mount Young were observed in several webcam images during 18-19 March, in addition to small explosions and volcanic tremor. The ACC was raised to Orange and the VAL increased to Watch on 19 March. A small explosion was detected in seismic and infrasound data on 21 March.
Low-level unrest continued during April, although cloudy weather often obscured views of the summit; periods of seismic tremor and local earthquakes were recorded. During 3-4 April a gas-and-steam plume was visible traveling more than 200 km overnight; no ash was evident in the plume, according to AVO. A gas-and-steam plume was observed during 4-6 April that extended 400 km but did not seem to contain ash. Small explosions were detected in seismic and infrasound data on 5 April. Occasional clear webcam images showed continuing gas-and-steam emissions rose from Mount Young, but no ash deposits were observed on the snow. On 19 April small explosions and tremor were detected in seismic and infrasound data. A period of seismic tremor was detected during 22-25 April, with possible weak explosions on 25 April. Ash deposits were visible near the crater rim, but it was unclear if these deposits were recent or due to older deposits.
Occasional small earthquakes were recorded during May, but there were no signs of explosive activity seen in geophysical data. Gas-and-steam emissions continued from the N crater of Mount Young, based on webcam images, and seismicity remained slightly elevated. A new, light ash deposit was visible during the morning of 5 May on fresh snow on the NW flank of Mount Young. During 10 May periods of volcanic tremor were observed. The ACC was lowered to Yellow and the VAL to Advisory on 17 May due to no additional evidence of activity.
Geologic Background. Semisopochnoi, the largest subaerial volcano of the western Aleutians, is 20 km wide at sea level and contains an 8-km-wide caldera. It formed as a result of collapse of a low-angle, dominantly basaltic volcano following the eruption of a large volume of dacitic pumice. The high point of the island is Anvil Peak, a double-peaked late-Pleistocene cone that forms much of the island's northern part. The three-peaked Mount Cerberus (renamed Mount Young in 2023) was constructed within the caldera during the Holocene. Each of the peaks contains a summit crater; lava flows on the N flank appear younger than those on the south side. Other post-caldera volcanoes include the symmetrical Sugarloaf Peak SSE of the caldera and Lakeshore Cone, a small cinder cone at the edge of Fenner Lake in the NE part of the caldera. Most documented eruptions have originated from Young, although Coats (1950) considered that both Sugarloaf and Lakeshore Cone could have been recently active.
Information Contacts: Alaska Volcano Observatory (AVO), a cooperative program of a) U.S. Geological Survey, 4200 University Drive, Anchorage, AK 99508-4667 USA (URL: https://avo.alaska.edu/), b) Geophysical Institute, University of Alaska, PO Box 757320, Fairbanks, AK 99775-7320, USA, and c) Alaska Division of Geological & Geophysical Surveys, 794 University Ave., Suite 200, Fairbanks, AK 99709, USA (URL: http://dggs.alaska.gov/).
Ebeko
Russia
50.686°N, 156.014°E; summit elev. 1103 m
All times are local (unless otherwise noted)
Continued explosions, ash plumes, and ashfall during October 2022-May 2023
Ebeko, located on the N end of Paramushir Island in the Kuril Islands, consists of three summit craters along a SSW-NNE line at the northern end of a complex of five volcanic cones. Eruptions date back to the late 18th century and have been characterized as small-to-moderate explosions from the summit crater, accompanied by intense fumarolic activity. The current eruption period began in June 2022 and has recently consisted of frequent explosions, ash plumes, and thermal activity (BGVN 47:10). This report covers similar activity during October 2022 through May 2023, based on information from the Kamchatka Volcanic Eruptions Response Team (KVERT) and satellite data.
Activity during October consisted of explosive activity, ash plumes, and occasional thermal anomalies. Visual data by volcanologists from Severo-Kurilsk showed explosions producing ash clouds up to 2.1-3 km altitude which drifted E, N, NE, and SE during 1-8, 10, 16, and 18 October. KVERT issued several Volcano Observatory Notices for Aviation (VONA) on 7, 13-15, and 27 October 2022, stating that explosions generated ash plumes that rose to 2.3-4 km altitude and drifted 5 km E, NE, and SE. Ashfall was reported in Severo-Kurilsk (Paramushir Island, about 7 km E) on 7 and 13 October. Satellite data showed a thermal anomaly over the volcano on 15-16 October. Visual data showed ash plumes rising to 2.5-3.6 km altitude on 22, 25-29, and 31 October and moving NE due to constant explosions.
Similar activity continued during November, with explosions, ash plumes, and ashfall occurring. KVERT issued VONAs on 1-2, 4, 6-7, 9, 13, and 16 November that reported explosions and resulting ash plumes that rose to 1.7-3.6 km altitude and drifted 3-5 km SE, ESE, E, and NE. On 1 November ash plumes extended as far as 110 km SE. On 5, 8, 12, and 24-25 November explosions and ash plumes rose to 2-3.1 km altitude and drifted N and E. Ashfall was observed in Severo-Kurilsk on 7 and 16 November. A thermal anomaly was visible during 1-4, 16, and 20 November. Explosions during 26 November rose as high as 2.7 km altitude and drifted NE (figure 45).
Explosions and ash plumes continued to occur in December. During 1-2 and 4 December volcanologists from Severo-Kurilsk observed explosions that sent ash to 1.9-2.5 km altitude and drifted NE and SE (figure 46). VONAs were issued on 5, 9, and 16 December reporting that explosions generated ash plumes rising to 1.9 km, 2.6 km, and 2.4 km altitude and drifted 5 km SE, E, and NE, respectively. A thermal anomaly was visible in satellite imagery on 16 December. On 18 and 27-28 December explosions produced ash plumes that rose to 2.5 km altitude and drifted NE and SE. On 31 December an ash plume rose to 2 km altitude and drifted NE.
Explosions continued during January 2023, based on visual observations by volcanologists from Severo-Kurilsk. During 1-7 January explosions generated ash plumes that rose to 4 km altitude and drifted NE, E, W, and SE. According to VONAs issued by KVERT on 2, 4, 10, and 23 January, explosions produced ash plumes that rose to 2-4 km altitude and drifted 5 km N, NE, E, and ENE; the ash plume that rose to 4 km altitude occurred on 10 January (figure 47). Satellite data showed a thermal anomaly during 3-4, 10, 13, 16, 21, 22, and 31 January. KVERT reported that an ash cloud on 4 January moved 12 km NE. On 6 and 9-11 January explosions sent ash plumes to 4.5 km altitude and drifted W and ESE. On 13 January an ash plume rose to 3 km altitude and drifted SE. During 20-24 January ash plumes from explosions rose to 3.7 km altitude and drifted SE, N, and NE. On 21 January the ash plume drifted as far as 40 km NE. During 28-29 and 31 January and 1 February ash plumes rose to 4 km altitude and drifted NE.
During February, explosions, ash plumes, and ashfall were reported. During 1, 4-5 and 7-8 February explosions generated ash plumes that rose to 4.5 km altitude and drifted E and NE; ashfall was observed on 5 and 8 February. On 6 February an explosion produced an ash plume that rose to 3 km altitude and drifted 7 km E, causing ashfall in Severo-Kurilsk. A thermal anomaly was visible in satellite data on 8, 9, 13, and 21 February. Explosions on 9 and 12-13 February produced ash plumes that rose to 4 km altitude and drifted E and NE; the ash cloud on 12 February extended as far as 45 km E. On 22 February explosions sent ash to 3 km altitude that drifted E. During 24 and 26-27 February ash plumes rose to 4 km altitude and drifted E. On 28 February an explosion sent ash to 2.5-3 km altitude and drifted 5 km E; ashfall was observed in Severo-Kurilsk.
Activity continued during March; visual observations showed that explosions generated ash plumes that rose to 3.6 km altitude on 3, 5-7, and 9-12 March and drifted E, NE, and NW. Thermal anomalies were visible on 10, 13, and 29-30 March in satellite imagery. On 18, 21-23, 26, and 29-30 March explosions produced ash plumes that rose to 2.8 km altitude and drifted NE and E; the ash plumes during 22-23 March extended up to 76 km E. A VONA issued on 21 March reported an explosion that produced an ash plume that rose to 2.8 km altitude and drifted 5 km E. Another VONA issued on 23 March reported that satellite data showed an ash plume rising to 3 km altitude and drifted 14 km E.
Explosions during April continued to generate ash plumes. On 1 and 4 April an ash plume rose to 2.8-3.5 km altitude and drifted SE and NE. A thermal anomaly was visible in satellite imagery during 1-6 April. Satellite data showed ash plumes and clouds rising to 2-3 km altitude and drifting up to 12 km SW and E on 3 and 6 April (figure 48). KVERT issued VONAs on 3, 5, 14, 16 April describing explosions that produced ash plumes rising to 3 km, 3.5 km, 3.5 km, and 3 km altitude and drifting 5 km S, 5 km NE and SE, 72 km NNE, and 5 km NE, respectively. According to satellite data, the resulting ash cloud from the explosion on 14 April was 25 x 7 km in size and drifted 72-104 km NNE during 14-15 April. According to visual data by volcanologists from Severo-Kurilsk explosions sent ash up to 3.5 km altitude that drifted NE and E during 15-16, 22, 25-26, and 29 April.
The explosive eruption continued during May. Explosions during 3-4, 6-7, and 9-10 May generated ash plumes that rose to 4 km altitude and drifted SW and E. Satellite data showed a thermal anomaly on 3, 9, 13-14, and 24 May. During 12-16, 23-25, and 27-28 May ash plumes rose to 3.5 km altitude and drifted in different directions due to explosions. Two VONA notices were issued on 16 and 25 May, describing explosions that generated ash plumes rising to 3 km and 3.5 km altitude, respectively and extending 5 km E. The ash cloud on 25 May drifted 75 km SE.
Thermal activity in the summit crater, occasionally accompanied by ash plumes and ash deposits on the SE and E flanks due to frequent explosions, were visible in infrared and true color satellite images (figure 49).
Geologic Background. The flat-topped summit of the central cone of Ebeko volcano, one of the most active in the Kuril Islands, occupies the northern end of Paramushir Island. Three summit craters located along a SSW-NNE line form Ebeko volcano proper, at the northern end of a complex of five volcanic cones. Blocky lava flows extend west from Ebeko and SE from the neighboring Nezametnyi cone. The eastern part of the southern crater contains strong solfataras and a large boiling spring. The central crater is filled by a lake about 20 m deep whose shores are lined with steaming solfataras; the northern crater lies across a narrow, low barrier from the central crater and contains a small, cold crescentic lake. Historical activity, recorded since the late-18th century, has been restricted to small-to-moderate explosive eruptions from the summit craters. Intense fumarolic activity occurs in the summit craters, on the outer flanks of the cone, and in lateral explosion craters.
Information Contacts: Kamchatka Volcanic Eruptions Response Team (KVERT), Far Eastern Branch, Russian Academy of Sciences, 9 Piip Blvd., Petropavlovsk-Kamchatsky, 683006, Russia (URL: http://www.kscnet.ru/ivs/kvert/); MIROVA (Middle InfraRed Observation of Volcanic Activity), a collaborative project between the Universities of Turin and Florence (Italy) supported by the Centre for Volcanic Risk of the Italian Civil Protection Department (URL: http://www.mirovaweb.it/); Copernicus Browser, Copernicus Data Space Ecosystem, European Space Agency (URL: https://dataspace.copernicus.eu/browser/).
Home Reef
Tonga
18.992°S, 174.775°W; summit elev. -10 m
All times are local (unless otherwise noted)
Discolored plumes continued during November 2022-April 2023
Home Reef is a submarine volcano located in the central Tonga islands between Lateiki (Metis Shoal) and Late Island. The first recorded eruption occurred in the mid-19th century, when an ephemeral island formed. An eruption in 1984 produced a 12-km-high eruption plume, a large volume of floating pumice, and an ephemeral island 500 x 1,500 m wide, with cliffs 30-50 m high that enclosed a water-filled crater. Another island-forming eruption in 2006 produced widespread pumice rafts that drifted as far as Australia; by 2008 the island had eroded below sea level. The previous eruption occurred during October 2022 and was characterized by a new island-forming eruption, lava effusion, ash plumes, discolored water, and gas-and-steam plumes (BGVN 47:11). This report covers discolored water plumes during November 2022 through April 2023 using satellite data.
Discolored plumes continued during the reporting period and were observed in true color satellite images on clear weather days. Satellite images show light green-yellow discolored water extending W on 8 and 28 November 2022 (figure 31), and SW on 18 November. Light green-yellow plumes extended W on 3 December, S on 13 December, SW on 18 December, and W and S on 23 December (figure 31). On 12 January 2023 discolored green-yellow plumes extended to the NE, E, SE, and N. The plume moved SE on 17 January and NW on 22 January. Faint discolored water in February was visible moving NE on 1 February. A discolored plume extended NW on 8 and 28 March and NW on 13 March (figure 31). During April, clear weather showed green-blue discolored plumes moving S on 2 April, W on 7 April, and NE and S on 12 April. A strong green-yellow discolored plume extended E and NE on 22 April for several kilometers (figure 31).
Geologic Background. Home Reef, a submarine volcano midway between Metis Shoal and Late Island in the central Tonga islands, was first reported active in the mid-19th century, when an ephemeral island formed. An eruption in 1984 produced a 12-km-high eruption plume, large amounts of floating pumice, and an ephemeral 500 x 1,500 m island, with cliffs 30-50 m high that enclosed a water-filled crater. In 2006 an island-forming eruption produced widespread dacitic pumice rafts that drifted as far as Australia. Another island was built during a September-October 2022 eruption.
Information Contacts: Copernicus Browser, Copernicus Data Space Ecosystem, European Space Agency (URL: https://dataspace.copernicus.eu/browser/).
Ambae
Vanuatu
15.389°S, 167.835°E; summit elev. 1496 m
All times are local (unless otherwise noted)
New lava flow, ash plumes, and sulfur dioxide plumes during February-May 2023
Ambae, also known as Aoba, is a large basaltic shield volcano in Vanuatu. A broad pyroclastic cone containing three crater lakes (Manaro Ngoru, Voui, and Manaro Lakua) is located at the summit within the youngest of at least two nested calderas. Periodic phreatic and pyroclastic explosions have been reported since the 16th century. A large eruption more than 400 years ago resulted in a volcanic cone within the summit crater that is now filled by Lake Voui; the similarly sized Lake Manaro fills the western third of the caldera. The previous eruption ended in August 2022 that was characterized by gas-and-steam and ash emissions and explosions of wet tephra (BGVN 47:10). This report covers a new eruption during February through May 2023 that consisted of a new lava flow, ash plumes, and sulfur dioxide emissions, using information from the Vanuatu Meteorology and Geo-Hazards Department (VMGD) and satellite data.
During the reporting period, the Alert Level remained at a 2 (on a scale of 0-5), which has been in place since December 2021. Activity during October 2022 through March 2023 remained relatively low and mostly consisted of gas-and-steam emissions in Lake Voui. VMGD reported that at 1300 on 15 November a satellite image captured a strong amount of sulfur dioxide rising above the volcano (figure 99), and that seismicity slightly increased. The southern and northern part of the island reported a strong sulfur dioxide smell and heard explosions. On 20 February 2023 a gas-and-ash plume rose 1.3 km above the summit and drifted SSW, according to a webcam image (figure 100). Gas-and-steam and possibly ash emissions continued on 23 February and volcanic earthquakes were recorded by the seismic network.
During April, volcanic earthquakes and gas-and-steam and ash emissions were reported from the cone in Lake Voui. VMGD reported that activity increased during 5-7 April; high gas-and-steam and ash plumes were visible, accompanied by nighttime incandescence. According to a Wellington VAAC report, a low-level ash plume rose as high as 2.5 km above the summit and drifted W and SW on 5 April, based on satellite imagery. Reports in Saratamata stated that a dark ash plume drifted to the WSW, but no loud explosion was heard. Webcam images from 2100 showed incandescence above the crater and reflected in the clouds. According to an aerial survey, field observations, and satellite data, water was no longer present in the lake. A lava flow was reported effusing from the vent and traveling N into the dry Lake Voui, which lasted three days. The next morning at 0745 on 6 April a gas-and-steam and ash plume rose 5.4 km above the summit and drifted ESE, based on information from VMGD (figure 101). The Wellington VAAC also reported that light ashfall was observed on the island. Intermittent gas-and-steam and ash emissions were visible on 7 April, some of which rose to an estimated 3 km above the summit and drifted E. Webcam images during 0107-0730 on 7 April showed continuing ash emissions. A gas-and-steam and ash plume rose 695 m above the summit crater at 0730 on 19 April and drifted ESE, based on a webcam image (figure 102).
According to visual and infrared satellite data, water was visible in Lake Voui as late as 24 March 2023 (figure 103). The vent in the caldera showed a gas-and-steam plume drifted SE. On 3 April thermal activity was first detected, accompanied by a gas-and-ash plume that drifted W (figure 103). The lava flow moved N within the dry lake and was shown cooling by 8 April. By 23 April much of the water in the lake had returned. Occasional sulfur dioxide plumes were detected by the TROPOMI instrument on the Sentinel-5P satellite that exceeded 2 Dobson Units (DU) and drifted in different directions (figure 104).
Geologic Background. The island of Ambae, also known as Aoba, is a massive 2,500 km3 basaltic shield that is the most voluminous volcano of the New Hebrides archipelago. A pronounced NE-SW-trending rift zone with numerous scoria cones gives the 16 x 38 km island an elongated form. A broad pyroclastic cone containing three crater lakes (Manaro Ngoru, Voui, and Manaro Lakua) is located at the summit within the youngest of at least two nested calderas, the largest of which is 6 km in diameter. That large central edifice is also called Manaro Voui or Lombenben volcano. Post-caldera explosive eruptions formed the summit craters about 360 years ago. A tuff cone was constructed within Lake Voui (or Vui) about 60 years later. The latest known flank eruption, about 300 years ago, destroyed the population of the Nduindui area near the western coast.
Information Contacts: Geo-Hazards Division, Vanuatu Meteorology and Geo-Hazards Department (VMGD), Ministry of Climate Change Adaptation, Meteorology, Geo-Hazards, Energy, Environment and Disaster Management, Private Mail Bag 9054, Lini Highway, Port Vila, Vanuatu (URL: http://www.vmgd.gov.vu/, https://www.facebook.com/VanuatuGeohazardsObservatory/); Wellington Volcanic Ash Advisory Centre (VAAC), Meteorological Service of New Zealand Ltd (MetService), PO Box 722, Wellington, New Zealand (URL: http://www.metservice.com/vaac/, http://www.ssd.noaa.gov/VAAC/OTH/NZ/messages.html); MIROVA (Middle InfraRed Observation of Volcanic Activity), a collaborative project between the Universities of Turin and Florence (Italy) supported by the Centre for Volcanic Risk of the Italian Civil Protection Department (URL: http://www.mirovaweb.it/); Global Sulfur Dioxide Monitoring Page, Atmospheric Chemistry and Dynamics Laboratory, NASA Goddard Space Flight Center (NASA/GSFC), 8800 Greenbelt Road, Goddard, Maryland, USA (URL: https://so2.gsfc.nasa.gov/); Copernicus Browser, Copernicus Data Space Ecosystem, European Space Agency (URL: https://dataspace.copernicus.eu/browser/).
Search Bulletin Archive by Publication Date
Select a month and year from the drop-downs and click "Show Issue" to have that issue displayed in this tab.
The default month and year is the latest issue available.
Bulletin of the Global Volcanism Network - Volume 25, Number 07 (July 2000)
Managing Editor: Richard Wunderman
Apoyo (Nicaragua)
Tectonic seismicity between Apoyo and Masaya in July 2000
Arenal (Costa Rica)
Larger-than-average pyroclastic flow engulfs three people on 23 August
Fournaise, Piton de la (France)
Eruptions in February, March, June, and July 2000
Langila (Papua New Guinea)
Forceful ash emissions on 5 and 9 April rise 1-2 km
Manam (Papua New Guinea)
An increase in activity at Southern Crater 3-4 June
Masaya (Nicaragua)
Summary of activity; nearby M 5.4 earthquake at 1 km focal depth on 6 July
Miyakejima (Japan)
Robust, multifaceted eruptions from new summit crater
Obituary Notices (Unknown)
Deaths of two volcanologists (Asep Mukti and Wildan) at Semeru
Popocatepetl (Mexico)
Ash plumes, minor ashfalls, and mudflows during 15 June-22 August
Rabaul (Papua New Guinea)
Two periods of increased summit explosive activity in June
Semeru (Indonesia)
Ongoing eruptive activity; 27 July explosion causes injuries and two fatalities
Tungurahua (Ecuador)
January-July volcanism possibly decreased; lava fountains and many lahars
Ulawun (Papua New Guinea)
Vapor emissions during May and June; moderate seismicity in June
Whakaari/White Island (New Zealand)
New crater formed on 27 July during the largest eruption in about 20 years
Apoyo
Nicaragua
11.92°N, 86.03°W; summit elev. 600 m
All times are local (unless otherwise noted)
Tectonic seismicity between Apoyo and Masaya in July 2000
[The following was originally included within the Masaya report, not as a stand-alone report about Apoyo.]
July 2000 seismicity near Masaya and Laguna de Apoyo. During July 2000 there were over 300 earthquakes near Laguna de Apoyo (Apoyo volcano) and Masaya. The earthquakes, determined to be of tectonic rather than volcanic origin, caused surficial damage at both volcanoes.
At 1329 on 6 July a small M 2 earthquake occurred near the N rim of Laguna de Apoyo that was followed at 1330 by a M 5.4 earthquake (figure 1). It was located ~32 km SE of Managua, at 11.96°N, 86.02°E, with a focal depth less than 1 km (figure 2). The earthquake was felt in most of Nicaragua and was most strongly felt in the cities of Managua (Modified Mercalli V-VI) and Masaya (VI), and in the region near Laguna de Apoyo (maximum intensity of VII or VIII). The earthquake caused numerous landslides down the volcano's crater walls and surface faulting was observed. In towns located in the epicentral zone, trees and electric lines fell and many houses were partially or totally destroyed. About 70 people were injured and four children were killed by collapsing walls or roofs of homes. At Masaya volcano, ~8 km from the epicenter, there were minor collapses of Santiago crater's walls. No change in degassing was observed at the volcano.
Immediately after the earthquake there were many smaller, shallow earthquakes in a zone that includes the area between Masaya, Laguna de Apoyo, and W of Granada (figure 2). In the epicentral zone property was destroyed, cracks opened in the ground, landslides occurred, and trees fell. Several landslides occurred at the edges and steep walls of Laguna de Apoyo. A large number of earthquakes continued until 10 July (figure 3 and table 1). The number of earthquakes then diminished until 1554 on 25 July when a M 4.8 earthquake took place, initiating a series of smaller earthquakes that lasted until about 27 July.
Table 1. A summary of earthquakes in vicinity of Masaya and Laguna de Apoyo in early July 2000. Courtesy of INETER.
| Date |
Time |
Number of daily earthquakes |
Maximum magnitude |
| 07 Jul 2000 |
1330 |
180 |
5.2 |
| 08 Jul 2000 |
1100 |
70 |
3.8 |
| 09 Jul 2000 |
1200 |
81 |
3.6 |
| 10 Jul 2000 |
1800 |
27 |
3.1 |
| 11 Jul 2000 |
1800 |
6 |
3.3 |
| 13 Jul 2000 |
1800 |
16 |
2.8 |
The July earthquakes were the most destructive seismic events since the 1972 Managua earthquake. The epicentral zone of the July 2000 earthquakes correlates with the same active zones of past earthquakes, which are caused by fault movement between the Cocos and Caribbean plates.
Geologic Background. The scenic 7-km-wide, lake-filled Apoyo caldera is a large silicic volcanic center immediately SE of Masaya caldera. The surface of Laguna de Apoyo lies only 78 m above sea level; the steep caldera walls rise about 100 m to the eastern rim and up to 500 m to the western rim. An early shield volcano constructed of basaltic-to-andesitic lava flows and small rhyodacitic lava domes collapsed following two major dacitic explosive eruptions. The caldera-forming eruptions have been radiocarbon dated between about 21,000-25,000 years before present. Post-caldera ring-fracture eruptions of uncertain age produced lava flows below the scalloped caldera rim. The slightly arcuate, N-S-trending La Joya fracture system that cuts the eastern flank of the caldera only 2 km east of the caldera rim is a younger regional fissure system structurally unrelated to Apoyo caldera.
Information Contacts: Wilfried Strauch and Virginia Tenorio, Dirección General de Geofísica, Instituto Nicaragüense de Estudios Territoriales (INETER), Apartado 1761, Managua, Nicaragua (URL: http://www.ineter.gob.ni/).
Arenal
Costa Rica
10.463°N, 84.703°W; summit elev. 1670 m
All times are local (unless otherwise noted)
Larger-than-average pyroclastic flow engulfs three people on 23 August
During January to July 2000 Arenal's outbursts generally remained low but included frequent pyroclastic explosions, gas emissions, and avalanches. In late August explosions spawned a pyroclastic flow that injured three people several kilometers from the crater; two later died. Three days later a small airplane crashed into the volcano.
In January through parts of June crater C continued its usual activities, consisting of a constant gas emission, sporadic Strombolian eruptions, and occasional incandescent avalanches. Crater D exhibited fumarolic activity. The lava continued to flow variously toward the NNE, E, SE flanks. The NE and SE flank were continually affected by acid rain and pyroclastic material that contributed to the destruction of the vegetation on these flanks, resulting in major erosion that created small avalanches on the rivers Calle de Arenas, Manolo, Guillermina, and Agua Caliente.
The EDM network (established along the subradial lines) continued to show an average annual contraction of 7-10 ppm. The dry inclinometers ("dry tilt") showed variations in the radial component, deflation at ~5 µrad per year.
During the last half of April and throughout May eruptive activity increased, but few ash columns rose to ~500 m over crater C. The columns of ash were carried by the predominating winds toward the NW and SE flank causing both acid rain and ash fall. In May a narrow channel of lava began to flow toward the NNE flank. It later widened into a fan burning vegetation on the N and NE flanks.
From April to May the seismometer detected an increase in both number of eruptions and the hours of tremor. On 16 May two MR 3 earthquakes were recorded and located on the flanks of the volcano at 2 and 5 km from the summit. These earthquakes were reported to be felt in La Fortuna, 6.5 km NE of the volcano.
Eruptive activity remained low in June; few eruption clouds rose more than 500 m over crater C. In July crater C continued with the emission of gases, lava flows, sporadic Strombolian eruptions, and occasional pyroclastic flows. The eruptive activity increased in July with respect to June, although the number of eruptions, their intensity, and the quantity of pyroclastic material ejected remained low.
In August Arenal became more active and underwent a series of explosions. One began at 0945 on 23 August; mutiple pyroclastic flows came down the volcano's NE side (figure 89) as a series of pulses. Pulses occurred at 0955, 0956, and 0958. The most important pulse occurred at 1001 and continued for six minutes. Two more pulses followed at 1008 and 1012. For the next two hours activity returned to normal, but at 1323 a new series of explosions began. At 1336 a pyroclastic flow began and lasted for ten minutes. Various pulses descended the NNE flank. Normal low-level activity resumed 19 hours after the afternoon explosions.
News reports. One of the pyroclastic flows on 23 August engulfed a Costa Rican tour guide and two tourists from the United States. OVSICORI-UNA stated that the victims were burnt by the front of the flow ~2.3 km from the crater. According to a local volcanologist, the flow was traveling at 80 km/hour at that point.
The three victims were sent to San José to be treated for their burns and injuries. On the night of 23 August the tour guide died in the hospital. An 8-year-old girl from Massachusetts died on 6 September as a result of her burns.
The National Emergency Commission (NEC) ordered evacuations of the tourist centers of Los Lagos, the Tabacón hot springs and resort, Hotel Montaña del Fuego, Arenal Lodge, and other areas. The NEC and Red Cross workers evacuated 600 tourists and residents and closed the route around the volcano to Tilarán. On 24 August the volcano returned to its normal behavior. The 23 August explosive eruptions were believed to be the strongest since the deadly 1968 eruption.
On 26 August a ten-passenger airplane crashed into the NE flank ~200 m below the summit. All of the occupants died. The cause of the crash is unknown at this point and no further details are available.
Geologic Background. Conical Volcán Arenal is the youngest stratovolcano in Costa Rica and one of its most active. The 1670-m-high andesitic volcano towers above the eastern shores of Lake Arenal, which has been enlarged by a hydroelectric project. Arenal lies along a volcanic chain that has migrated to the NW from the late-Pleistocene Los Perdidos lava domes through the Pleistocene-to-Holocene Chato volcano, which contains a 500-m-wide, lake-filled summit crater. The earliest known eruptions of Arenal took place about 7000 years ago, and it was active concurrently with Cerro Chato until the activity of Chato ended about 3500 years ago. Growth of Arenal has been characterized by periodic major explosive eruptions at several-hundred-year intervals and periods of lava effusion that armor the cone. An eruptive period that began with a major explosive eruption in 1968 ended in December 2010; continuous explosive activity accompanied by slow lava effusion and the occasional emission of pyroclastic flows characterized the eruption from vents at the summit and on the upper western flank.
Information Contacts: Observatorio Vulcanologico y Sismologico de Costa Rica, Universidad Nacional (OVSICORI-UNA), Apartado 86-3000, Heredia, Costa Rica; Oficina de Sismología y Vulcanología del Arenal y Miravalles (OSIVAM), Instituto Costarricense de Electricidad (ICE), Apartado 10032-1000, San José, Costa Rica; The Tico Times (URL: http://www.ticotimes.net/); La Nacion (URL: http://www.nacion.co.cr/).
Piton de la Fournaise (France) — July 2000 Cite this Report
Piton de la Fournaise
France
21.244°S, 55.708°E; summit elev. 2632 m
All times are local (unless otherwise noted)
Eruptions in February, March, June, and July 2000
During 14 February to 4 March 2000 an eruption occurred at Piton de la Fournaise that was briefly mentioned in a previous report (BGVN 25:01) and is discussed here in more detail. After 4 March through May, there was no volcanic activity and seismicity was low with 1-2 events per month. On 23 June volcanism recommenced with an eruption that lasted more than a month.
Eruption of 14 February 2000. Three and a half months after its previous eruption (BGVN 24:09), Piton de la Fournaise erupted on 14 February. Throughout January, seismicity was well above normal levels until the beginning of February when a relative lull in seismicity lasted for two weeks (figure 50). At 2314 on 13 February a seismic crisis began that lasted 64 minutes. A total of 261 earthquakes occurred with magnitudes up to 1.9. The deepest events were localized at sea level, just below Dolomieu summit crater (figure 51).
On 13 February, three minutes after the beginning of the seismic crisis, the first significant variations in deformation were recorded at 2317 and 2320, on radial and tangential components, respectively, by the "Dolomieu Sud" tiltmeter station. After initial deformation was observed, tiltmeter and extensometer stations at "Soufriere," "Bory," "Tunnel Catherine," and "Flanc Est" (figure 52) registered variations, with up to 270 µrad recorded for the "Soufriere tiltmeter" radial component. The intrusion of magma caused inflation under the summit crater. The inflation center started S of Dolomieu summit crater, migrated below Dolomieu, and then traveled to the N flank of the volcano where several vents opened (figure 53). At 0018 on 14 February, tremors registered at all of the seismic stations marking the beginning of the eruption.
Inclement weather produced by cylone Eline passing 200 km N of Reunion inhibited visual observations for several days. After that, scientists found that several en echelon fissures were localized on the N flank starting at 2,490 m elevation (white lines within black lava flows, figure 53). An aa flow inundated the "Puy Mi-Côte" crater, passed to the W and E of the crater, and continued in the direction of "Piton Partage." Both vents were inactive at the time of observation. Eruptive activity was concentrated on a vent 300 m E of Puy Mi-Côte, where stable 20- to 30-m-high fountains were observed from a new crater, whose rim grew to 20 m high at that time. A second, much smaller crater was active about 100 m above the main crater. A large aa lava flow and meter-sized blocks descended in the direction of "Piton Kapor" (site of the 1998 eruption), then joined the first lava flow and followed the "rempart Fouqué" to the E. This lava flow terminated about 4 km away at 1,950 m altitude near "Nez Coupé de Saint Rose." Beginning on 24 February a large number of small pahoehoe lava flows were observed. For several hours on 4 March a large number of gas-piston events were observed and then at 1800 tremor stopped, marking the end of the eruption.
Retrospective analysis revealed that the initial aa lava flow represented most of the erupted material. The lava was particularly irregular with scoria that ranged in size from tens of centimeters to meter-sized blocks. Pahoehoe flows from the 24 February phase of the eruption partly covered the aa lava that was emitted earlier. The entire lava flow covered an area of about 1.3 x 10⁶ m2 and comprised a total volume of about 4 x 10⁶ m3 of aphyric basalt. The main new crater was called "Piton Célimène" (figure 53).
Eruption of 23 June 2000. Beginning in June, long-term deformation was observed at several stations near the volcano. Since the beginning of the month up to 0.1 mm of inflation took place at the "Soufrière" extensometer (figure 52). Starting on 12 June clear inflation of up to 70 µrad was observed at the "Dolomieu Sud" tiltmeter. After 20 June inflation of up to 20 µrad was observed at the "Château Fort" tiltmeter. The Château Fort extensometer showed variations in opening, shear, and vertical movement components.
Seismicity increased during 9-14 June with twelve deep earthquakes ~6 km below the W flank. During 15-21 June seismicity drastically increased with 2, 2, 4, 10, 29, 69, and 101 earthquakes recorded on successive days (figure 54). All of these earthquakes occurred below Dolomieu summit crater, with focal depths between sea level and 1 km above sea level. They had magnitudes up to 1.8 that increased with the number of earthquakes recorded. During the same time period, five deep earthquakes also occurred.
During 0600-0640 on 22 June, following 50 seismic events, there was a small seismic crisis that consisted of 36 low-energy seismic events. For 36 hours after the seismic crisis only very low-energy earthquakes occurred. At 1650 on 23 June another seismic crisis took place (figure 54). It consisted of about 300 earthquakes, including some greater than M 2 and possibly as high as M 2.5. Some of the earthquakes were recorded at the seismic station in Cilaos, more than 30 km from the volcano.
During the seismic crisis one shallow earthquake was centered under the E flank of the volcano. Around this time the observatory's tiltmeter network showed uplift of the central part of the volcano to over 200 µrad. The inferred effect of an intrusion was first localized under the summit region, then shifted to the SE. At 1800 eruption tremor began, and tremor localization suggested the eruption site was on the SE flank between "Signal de l' Enclose" and "Château Fort" craters between 1.9 and 2.2 km elevation. Figure 55 shows these named locations and the actual fissure vent and extent of lava flows.
According to the observatory staff, the 23 June eruption began with the formation of a short-lived, 500-m-long, SE-trending fissure on the SE flank at an elevation of ~2,100 m (figure 55). A second, 200-m-long, ESE trending vent also formed on the SE flank at ~1,800 m. About eight lava fountains initially rose up to 50 m above the second vent. In addition, a 300-m-long aa lava flow traveled down the "Grandes Pentes" to an elevation of 580 m. About two days after the eruption began, the intensity of the lava fountains decreased, and the crater rim reached a height of 10-15 m.
Within 24 hours after the onset of the eruption, tremor rapidly decreased to less than 10% of the initial value. Unlike typical eruptions at Piton de la Fournaise, seismicity under the central crater continued for the first five days of the eruption. During 24-28 June there were 26, 22, 17, 17 and six seismic events, respectively, up to M 2.5. Similar seismic events occurred during eruptions in 1986, 1988, and 1998; in two cases they preceded the formation of new vents. However, no new vents formed during 24-28 June. After 29 June no seismic events were recorded, and starting on 27 June there was an increase in tremors that remained around initial levels and lasted three weeks. Throughout most of the eruption there was a lava lake in the eruption crater and several meter-sized lava flows emerged at its base reaching up to 300-400 m below the crater. Lava samples were collected during the eruption, and a lava temperature of 1,160°C was measured several times using a thermocouple.
On 30 July the eruption stopped after 37 days of activity. The initial flow was entirely aa lava, while the later outspreading lava flows were aa and pahoehoe lava. The entire lava flow covered an area of ~3 x 10² m2 and comprised a total volume of ~1 x 10⁷ m3. The final crater was 26 m high and was named "Piton Pârvédi."
Geologic Background. Piton de la Fournaise is a massive basaltic shield volcano on the French island of Réunion in the western Indian Ocean. Much of its more than 530,000-year history overlapped with eruptions of the deeply dissected Piton des Neiges shield volcano to the NW. Three scarps formed at about 250,000, 65,000, and less than 5,000 years ago by progressive eastward slumping, leaving caldera-sized embayments open to the E and SE. Numerous pyroclastic cones are present on the floor of the scarps and their outer flanks. Most recorded eruptions have originated from the summit and flanks of Dolomieu, a 400-m-high lava shield that has grown within the youngest scarp, which is about 9 km wide and about 13 km from the western wall to the ocean on the E side. More than 150 eruptions, most of which have produced fluid basaltic lava flows, have occurred since the 17th century. Only six eruptions, in 1708, 1774, 1776, 1800, 1977, and 1986, have originated from fissures outside the scarps.
Information Contacts: Thomas Staudacher, Nicolas Villeneuve, Jean Louis Cheminée, Kei Aki, Jean Battaglia, Philippe Catherine, Valérie Ferrazzini, and Philippe Kowalski, Observatoire Volcanologique du Piton de la Fournaise, Institut de Physique du Globe de Paris, Institut National des Sciences de l'Univers, 14 RN3 - Km 27, 97418 La Plaine des Cafres, Réunion, France (URL: http://www.ipgp.fr/fr/ovpf/observatoire-volcanologique-piton-de-fournaise).
Langila (Papua New Guinea) — July 2000 Cite this Report
Langila
Papua New Guinea
5.525°S, 148.42°E; summit elev. 1330 m
All times are local (unless otherwise noted)
Forceful ash emissions on 5 and 9 April rise 1-2 km
This report covers April through June 2000. Activity remained at a low level in April. From visual observation reports received only up to 9 April, Crater 2 periodically gently released moderate to thick ash clouds. However, on 5 and 9 April, the ash clouds were released more forcefully and with rumbling sounds. These ash clouds rose 1-2 km above the summit before being blown SE. Crater 3 released light white vapor throughout the month.
Visual observations were next reported after 16 June. Crater 2 produced thick, white ash clouds in moderate volume. On 23 and 24 June, these clouds were accompanied by blue vapor. On 16 and 18 June, rumbling noises were heard. Crater 3 was inactive in June with the exception of a weak trail of thin white vapor escaping on 16 June.
The seismograph remained non-operational throughout the entire reporting period.
Geologic Background. Langila, one of the most active volcanoes of New Britain, consists of a group of four small overlapping composite basaltic-andesitic cones on the lower E flank of the extinct Talawe volcano in the Cape Gloucester area of NW New Britain. A rectangular, 2.5-km-long crater is breached widely to the SE; Langila was constructed NE of the breached crater of Talawe. An extensive lava field reaches the coast on the N and NE sides of Langila. Frequent mild-to-moderate explosive eruptions, sometimes accompanied by lava flows, have been recorded since the 19th century from three active craters at the summit. The youngest and smallest crater (no. 3 crater) was formed in 1960 and has a diameter of 150 m.
Information Contacts: I. Itikarai, D. Lolok, K. Mulina, and F. Taranu, Rabaul Volcano Observatory (RVO), P.O. Box 386, Rabaul, Papua New Guinea.
Manam (Papua New Guinea) — July 2000 Cite this Report
Manam
Papua New Guinea
4.08°S, 145.037°E; summit elev. 1807 m
All times are local (unless otherwise noted)
An increase in activity at Southern Crater 3-4 June
This report covers April-June 2000. Inflation that began in January 2000 (BGVN 25:03) peaked in early April. By mid-April the water-tube tiltmeter 4 km SW of the summit detected a 2.5 µrad decrease in tilt. By the end of April the tilt had recovered 1.5 µrad. Emissions from both the summit craters, Main and Southern, consisted of gentle releases of light to moderate volumes of white vapor. Seismicity remained low with the number of events ranging from 500 to 1,200 events a day. Seismic amplitude measurements were steady at background levels.
During May, Manam continued to produce varying amounts of white vapor from both craters. Rabaul Volcanic Observatory (RVO) characterized the seismicity as normal. Tiltmeter readings showed no particular trend.
Throughout June, Main Crater released light to moderate volumes of white vapor. However, during 3-4 June, Southern crater increased in activity.
At 1235 on 3 June, an explosive eruption produced thick, dark ash clouds and produced fine-ash and scoria deposits at Yassa village, W of the summit. The ash clouds reached an altitude of 1-1.2 km. The initial explosion was followed by light to moderate release of ash. At 0004 on 4 June, booming sounds lasting 1-2 minutes were accompanied by the ejection of glowing lava fragments. These fragments fell in the SW valley and had free fall times (FFT) of 5-10 s. Some weak to low fluctuating night time glows were visible during the intervals between lava fragment ejections. Prior to and after the events of 3-4 June, Southern crater produced light amounts of white vapor.
Although there were no water-tiltmeter readings after 19 June, the values taken 4 km S of the crater showed an inflation of 10 µrad from 1-19 June. Since December 1999, there has been an overall inflation of 16 µrad. There were no seismic readings during 1-10 June. Low-level seismicity the remainder of the month had counts ranging from 600-1,360 a day. Seismic amplitude measurements were relatively steady at normal background levels.
Geologic Background. The 10-km-wide island of Manam, lying 13 km off the northern coast of mainland Papua New Guinea, is one of the country's most active volcanoes. Four large radial valleys extend from the unvegetated summit of the conical basaltic-andesitic stratovolcano to its lower flanks. These valleys channel lava flows and pyroclastic avalanches that have sometimes reached the coast. Five small satellitic centers are located near the island's shoreline on the northern, southern, and western sides. Two summit craters are present; both are active, although most observed eruptions have originated from the southern crater, concentrating eruptive products during much of the past century into the SE valley. Frequent eruptions, typically of mild-to-moderate scale, have been recorded since 1616. Occasional larger eruptions have produced pyroclastic flows and lava flows that reached flat-lying coastal areas and entered the sea, sometimes impacting populated areas.
Information Contacts: I. Itikarai, D. Lolok, K. Mulina, and F. Taranu, Rabaul Volcano Observatory (RVO), P.O. Box 386, Rabaul, Papua New Guinea.
Masaya
Nicaragua
11.9844°N, 86.1688°W; summit elev. 594 m
All times are local (unless otherwise noted)
Summary of activity; nearby M 5.4 earthquake at 1 km focal depth on 6 July
Since the last report on Masaya, of continued degassing and marked gravity decreases (BGVN 24:04), there have been sporadic reports about its activity, which are summarized below prior to discussion of a nearby M 5.4 earthquake on 6 July 2000.
Reports of ash-and-steam emissions. Between November 1999 and January 2000 there were several reports from the Washington VAAC of ash-and-steam emissions from Masaya. On 22 November 1999 the VAAC reported that GOES-8 imagery suggested that Masaya may have awakened. Satellite imagery showed activity at or very near Masaya, including a plume of ash or "smoke" moving to the WSW, and a hotspot that was visible for over two hours. At about 1600 the imagery suggested that an explosion may have occurred and by 1615 the resultant plume was at ~800 m (near Masaya's summit), and had been blown WSW.
On 22 December 1999 the Washington VAAC issued an ash advisory stating that a continuous low-level plume was being emitted from Masaya. Volcanic activity was confirmed by INETER who noted that seismic activity was consistent with ash emissions. The cloud was ~2 km in altitude and was blown to the WSW.
On 18 January 2000 the VAAC reported that GOES-8 imagery through 0845 detected a low-level thin ash plume from Masaya's summit. The plume reached an altitude of ~900 m, was blown to the SW, and rapidly dissipated.
Seismic activity during April 1999-March 2000. Seismic activity at the volcano remained low with eight microearthquakes registered for the month. The RSAM (seismic tremor) stayed at ~30 units. During the first two weeks of April the RSAM signal was not obtained due to technical problems in the seismic power station. On 23 April two explosions were detected by RSAM, which were confirmed by observers at the Masaya Volcano National Park. In that case, RSAM began to show a small increase until 0800, and an hour later the two explosions occurred.
May 1999: The number of microearthquakes was 21 for the month. The RSAM stayed at ~24 units. June: The number of microearthquakes was 18 for the month. The RSAM stayed at ~24 units. August: The number of microearthquakes was 47 for the month. The RSAM remained at ~40 units. Constant gas emissions occurred. September: The number of microearthquakes was 87 for the month. The RSAM stayed constant at ~40 units. Constant gas emissions occurred. October: The number of microearthquakes was 22 for the month. The RSAM stayed constant at ~20 units. Constant gas emissions occurred. November: There were 49 microearthquakes for the month. The RSAM stayed constant. Constant gas emissions occurred. December: Twenty one earthquakes were registered for the month. The RSAM stayed constant.
January 2000: Eleven earthquakes were registered for the month. The RSAM stayed constant. At 1145 on 6 January an explosion occurred in Santiago crater. February: Six microearthquakes and the RSAM remained constant. March: There were three microearthquakes for the month. The RSAM was at a similar level as the previous month.
July 2000 seismicity near Masaya and Laguna de Apoyo. During July 2000 there were over 300 earthquakes near Laguna de Apoyo (Apoyo volcano) and Masaya. The earthquakes, determined to be of tectonic rather than volcanic origin, caused surficial damage at both volcanoes.
At 1329 on 6 July a small M 2 earthquake occurred near the N rim of Laguna de Apoyo that was followed at 1330 by a M 5.4 earthquake (figure 10). It was located ~32 km SE of Managua, at 11.96°N, 86.02°E, with a focal depth less than 1 km (figure 11). The earthquake was felt in most of Nicaragua and was most strongly felt in the cities of Managua (Modified Mercalli V-VI) and Masaya (VI), and in the region near Laguna de Apoyo (maximum intensity of VII or VIII). The earthquake caused numerous landslides down the volcano's crater walls and surface faulting was observed. In towns located in the epicentral zone, trees and electric lines fell and many houses were partially or totally destroyed. About 70 people were injured and four children were killed by collapsing walls or roofs of homes. At Masaya volcano, ~8 km from the epicenter, there were minor collapses of Santiago crater's walls. No change in degassing was observed at the volcano.
Immediately after the earthquake there were many smaller, shallow earthquakes in a zone that includes the area between Masaya, Laguna de Apoyo, and W of Granada (figure 11). In the epicentral zone property was destroyed, cracks opened in the ground, landslides occurred, and trees fell. Several landslides occurred at the edges and steep walls of Laguna de Apoyo. A large number of earthquakes continued until 10 July (figure 12 and table 2). The number of earthquakes then diminished until 1554 on 25 July when a M 4.8 earthquake took place, initiating a series of smaller earthquakes that lasted until about 27 July.
Table 2. A summary of earthquakes in vicinity of Masaya and Laguna de Apoyo in early July 2000. Courtesy of INETER.
| Date |
Time |
Number of daily earthquakes |
Maximum magnitude |
| 07 Jul 2000 |
1330 |
180 |
5.2 |
| 08 Jul 2000 |
1100 |
70 |
3.8 |
| 09 Jul 2000 |
1200 |
81 |
3.6 |
| 10 Jul 2000 |
1800 |
27 |
3.1 |
| 11 Jul 2000 |
1800 |
6 |
3.3 |
| 13 Jul 2000 |
1800 |
16 |
2.8 |
The July earthquakes were the most destructive seismic events since the 1972 Managua earthquake. The epicentral zone of the July 2000 earthquakes correlates with the same active zones of past earthquakes, which are caused by fault movement between the Cocos and Caribbean plates.
Geologic Background. Masaya volcano in Nicaragua has erupted frequently since the time of the Spanish Conquistadors, when an active lava lake prompted attempts to extract the volcano's molten "gold" until it was found to be basalt rock upon cooling. It lies within the massive Pleistocene Las Sierras caldera and is itself a broad, 6 x 11 km basaltic caldera with steep-sided walls up to 300 m high. The caldera is filled on its NW end by more than a dozen vents that erupted along a circular, 4-km-diameter fracture system. The Nindirí and Masaya cones, the source of observed eruptions, were constructed at the southern end of the fracture system and contain multiple summit craters, including the currently active Santiago crater. A major basaltic Plinian tephra erupted from Masaya about 6,500 years ago. Recent lava flows cover much of the caldera floor and there is a lake at the far eastern end. A lava flow from the 1670 eruption overtopped the north caldera rim. Periods of long-term vigorous gas emission at roughly quarter-century intervals have caused health hazards and crop damage.
Information Contacts: Wilfried Strauch and Virginia Tenorio, Dirección General de Geofísica, Instituto Nicaragüense de Estudios Territoriales (INETER), Apartado 1761, Managua, Nicaragua (URL: http://www.ineter.gob.ni/); Washington VAAC, Satellite Analysis Branch (SAB), NOAA/NESDIS E/SP23, NOAA Science Center Room 401, 5200 Auth Road, Camp Springs, MD 20746, USA (URL: http://www.ssd.noaa.gov/).
Miyakejima
Japan
34.094°N, 139.526°E; summit elev. 775 m
All times are local (unless otherwise noted)
Robust, multifaceted eruptions from new summit crater
This report covers the period 8 July-31 August 2000, an interval marked by strong outbursts, spectacular plumes, pyroclastic flows, ashfalls, and a remarkable series of concentric crater collapses that followed the initial crater collapse on 8 July 2000 (figures 6 and 7). Striking ash-column photos, some marked with azimuthal angles and calculated plume heights, appear on Japanese-language websites (see below).
Continuous deflation at the summit had been recorded since the end of June. However, on 8 July the deflation accelerated. Following 4 days of earthquake swarms under the summit, at 1841 on 8 July, a small, phreatic explosion sent a cloud to 800 m above the summit (BGVN 25:07). This explosion lasted several minutes. At the same time, a large pit crater formed with a diameter of ~800-1,000 m and a depth of 100-200 m. A small amount of ash was ejected but was not comparable to the volume of the depression. Red ash and cinder deposits from this eruption were estimated to amount to less than 1 x 10⁶ m3. The volume of collapse was estimated at 50 x 106 m3. No scoriae or any other juvenile material was found. The rapid deflation is thought to have formed as the result of "drain-back" of magma that had intruded near the surface. This appears to have been the catalyst for the explosion.
After the 8 July explosion, tiltmeters recorded periods of sudden inflation. Inflations were preceded and accompanied by long-period earthquakes located less than 2 km below the surface. The intervals of inflation and earthquakes were followed by continued steady deflation. This cycle repeated itself approximately every 12 hours from the 8 July eruption to 23 July.
Following a series of foreshocks, at 1601 on 1 July a Mb 6.1 earthquake struck near Kozu-shima Island, NW of Miyake-jima. This was followed on 14 July by a M 5.3 earthquake off the coast of Miyake-jima. At about 0400, shortly after the earthquake, a phreatic eruption occurred. Thick layers of ash were deposited on the N and E parts of the islands. This eruption continued until about 1300 on 15 July. Photographs taken by Asahi News Network (ANN) on the afternoon of 14 July showed that the 8 July crater had expanded to a diameter of 1,000 m and a depth of 400 m. Observers looking at the bottom of the 8 July crater saw small phreatic explosions yielding plumes with convoluted and scrolled shapes (reminiscent of cock's tails); these originated from a new pit crater that was ~100 m in diameter. The volume of ash from this eruption was estimated to be less than 10 x 106 m3. The volume of collapse was estimated at 200 x 106 m3.
Measurements in early August showed that the collapsed crater had enlarged to a diameter of 1.4 km and a depth of 450 m. According to The Japan Times, an eruption on 10 August produced a plume that rose 3 km above the summit and deposited ash over the NE section of the island. Yukio Hayakawa reported that small pyroclastic flows accompanied this event. After 10 August, phreatic explosions occurred intermittently. Figure 7 shows the progressive expansion of the crater associated with the deflation. GPS measurements made at four stations around the summit indicated continued summit deflation, including during the explosion on 18 August.
At 1700 on 18 August, a large phreatic eruption occurred. This was the largest eruption since activity began on 26 June 2000. Yukio Hayakawa reported small pyroclastic flows. According to articles by the Associated Press and Reuters, white clouds rising to 8 km above the summit were encountered by a commercial airline pilot who was in route from Guam to Narita airport in Tokyo. The plane, which was flying over the island of Miyake shortly after the eruption, later landed safely at Narita. Aviation contacts later revealed that while in flight a commercial airliner encountered airborne ash and underwent a dual-engine flame-out, but managed to land safely. The airliner sustained ~$4 million (US dollars) in damage.
Ash fall was reported to be heaviest on the western part of the island, but ash in the NW sector accumulated up to 15 cm thick as far as 3 km from the crater (figure 8). Ballistics, which included basaltic bombs, were ejected at the end of the eruption and were deposited in a uniform, radial pattern around the crater (figure 9). On the W slope of the volcano, 2-m-diameter ballistics destroyed roofs of cowsheds and formed craters in the meadows. To the SE, there were reports of broken car windows and cinders 5 cm in diameter at the airport. It is uncertain whether these ballistics were juvenile material.
Although several lower plume-height observations and estimates were made, for example by aviators, one based on a photograph of the actively rising ash column indicated that the 18 August plume rose to at least 15 km. Laser radar (lidar) provided additional constraints on the height of airborne volcanic aerosols at distance from the volcano, detecting them on 23 August at 16 and 17.5 km altitude. More details follow.
For the 18 August eruption, lidar data collected by Takashi Shibata established these values at Nagoya, Japan (35°N, 137°E, on S Honshu Island, 290 km SE of the volcano) around 2100 on 23 August: backscatter ratio at 532 nm, 1.1; depolarization ratio at 532 nm, 5%; plume height, 16 km; and plume width, 100 km.
On 23 August the lidar instrument run by Motowo Fujiwara and Kouichi Shiraishi in Fukuoka (33.5°N, 130.4°E, on NW Kyushu Island, 850 km W of the volcano) detected a thin aerosol layer. Their measurement took place over an interval that began at 0013 and extended over the next hour and a half. They detected relatively strong scattering in the lower stratosphere and found these values: peak backscatter ratio at 532 nm, 1.20-1.25; depolarization ratio at 532 nm, 8-15%; layer height, 17.5 km; and layer width, 1 km. The cited height corresponds to the peak (strongest effect) of the layer; this altitude was ~1.7 km above the tropopause observed by Fukuoka Meteorological Observatory at 2100 on 22 August. Fujiwara and Shiraishi suggested aerosols might have come from Miyake-jima, specifically its eruption at 1702 on 18 August. The Meteorological Observatory reported that during the period from 18-21 August the wind direction around the layer height (17-18 km) changed from ENE to SSE (i.e., basically easterly) and its speed changed from 3 to 7 m/s. These easterly winds further suggested that the lidar-detected aerosol layer originated from a Miyake-jima eruption.
Observations made on 20 August by Osamu Oshima of the University of Tokyo revealed 3 small cones with open pits inside the summit crater, multiple mudflows from the crater pits onto the crater floor, and step faults that crossed new ash layers. He interpreted the step faults to indicate continued subsistence of the crater floor.
The Tokyo VAAC reported three small eruptions at Miyake-jima on 28 August. The eruption clouds reached respective heights of about 5.8, 3.8, and 5 km. On 29 August at 0430, Miyake-jima erupted vigorously again; according to the Eruption Committee this was the second-largest outburst of the recent eruptive episode (the most vigorous being the 18 August eruption). There were two pyroclastic flows, one to the NE that extended 5 km to the sea, and one to the SW that extended for 3 km. The pyroclastic flows contained large amounts of HCl, unlike those of 18 August. The eruption was theorized to be the result of either the collapse of an unstable hydrothermal system or contact between magma and meteoric water inside the volcano. Photos of the pyroclastic flows appeared on the internet (see references).
According to an article by the Associated Press and the Japanese news agency Asahi Shimbun, on 29 August all students, teachers, and school officials on Miyake-jima were evacuated to Tokyo, and all remaining residents of the island were ordered to evacuate. Residents who had not yet left the island as of 31 August were being housed in shelters due to the threat of mudslides produced by thick ash and rain.
Geologic Background. The circular, 8-km-wide island of Miyakejima forms a low-angle stratovolcano that rises about 1,100 m from the sea floor in the northern Izu Islands about 200 km SSW of Tokyo. The basaltic volcano is truncated by small summit calderas, one of which, 3.5 km wide, was formed during a major eruption about 2,500 years ago. Numerous craters and vents, including maars near the coast and radially oriented fissure vents, are present on the flanks. Frequent eruptions have been recorded since 1085 CE at vents ranging from the summit to below sea level, causing much damage on this small populated island. After a three-century-long hiatus ending in 1469 CE, activity has been dominated by flank fissure eruptions sometimes accompanied by minor summit eruptions. A 1.6-km-wide summit crater was slowly formed by subsidence during an eruption in 2000.
Information Contacts: Miyake-jima Meterological Observatory and Volcanological Division; Japan Meteorological Agency (JMA), 1-3-4 Ote-machi, Chiyoda-ku, Tokyo 100, Japan (URL: http://www.jma.go.jp/); Akihiko Tomiya, Geological Survey of Japan, 1-1-3 Higashi, Ibaraki, Tsukuba 305, Japan (URL: https://www.gsj.jp/); Setsuya Nakada, Volcano Research Center, Earthquake Research Institute, University of Tokyo, Yayoi 1-1-1, Bunkyo-ku, Tokyo 113-0032, Japan (URL: http://www.eri.u-tokyo.ac.jp/VRC/index_E.html); Takashi Shibata, STEL, Nagoya University, Furo-cho, Chikusa-ku, Nagoya 464-8601, Japan; Yukio Hayakawa, Faculty of Education, Gunma University, Aramaki, Maebashi 371, Japan (URL: http://www.hayakawayukio.jp/); Motowo Fujiwara and Kouichi Shiraishi, Department of Earth System Science, Fukuoka University, 8-19-1 Nanakuma, Jonann-ku, Fukuoka 814-0180, Japan; U.S. Geological Survey, Reston, VA, USA (URL: http://www.usgs.gov); The Japan Times, 5-4, Shibaura 4-chome, Minato-ku, Tokyo 108-0023 (URL: http://www.japantimes.co.jp/); Asahi Shimbun (URL: http://www.asahi.com/english/english.html); Associated Press; Reuters.
Obituary Notices (Unknown) — July 2000 Cite this Report
Obituary Notices
Unknown
Unknown, Unknown; summit elev. m
All times are local (unless otherwise noted)
Deaths of two volcanologists (Asep Mukti and Wildan) at Semeru
An explosion at Semeru on 27 July 2000 took the lives of two dedicated Volcanological Survey of Indonesia (VSI) staff members, Wildan and Mukti. Asep Wildan was born in Bandung and a graduate of the physics department at the Institute of Technology Bandung. He worked with VSI since 1993, most recently as a geophysicist in VSI's Eastern Java section where he investigated volcano seismology at Semeru and other volcanoes in East Java and Bali. He is survived by his wife and young daughter.
Mukti was born in the city of Banyuwangi on the eastern tip of Java. A high-school graduate, he served with VSI since 1990 in the capacity of volcano observer and was posted at Semeru. He is survived by his mother. Efforts are underway to work with VSI to provide economic assistance for the families of Wildan and Mukti.
Asep Wildan and Mukti made important contributions to VSI's volcano research and monitoring programs, and both had, in the past, generously provided vital assistance to international researchers working at Semeru. They will be greatly missed by their many Indonesian and international friends and colleagues.
Geologic Background. Obituary notices for volcanologists are sometimes written when scientists are killed during an eruption or have had a special relationship with the Global Volcanism Program.
Information Contacts:
Popocatepetl (Mexico) — July 2000 Cite this Report
Popocatepetl
Mexico
19.023°N, 98.622°W; summit elev. 5393 m
All times are local (unless otherwise noted)
Ash plumes, minor ashfalls, and mudflows during 15 June-22 August
This report covers the period form 15 June to 22 August 2000. The highest ash column in this period rose to over 5 km above the summit.
Throughout most of the reporting period, activity remained stable with periodic exhalations of small amplitude and duration. However, two small mudflows were reported: one on 23 June and the other on 24 June. According to CENAPRED, the mudflow on 24 June did not reach any human settlements. No information was available concerning the 23 June mudflow.
On 3 July, two small exhalations generated ash clouds that reached 1 and 2.5 km above the summit and ash fell over the volcano's SW sector. On 4 July, ash from a small exhalation fell in Tetela, a town ~15 km SW of the crater. On 14 July, the volcano erupted and produced an ash cloud that reached 1.6 km in height. According to the Associated Press (AP), the ash from this eruption was blown N and did not significantly impact any populated regions surrounding the volcano.
On 4 August, two closely spaced explosive eruptions occurred. The first at 1251, a moderately large exhalation, lasted 2 minutes. The second one occurred at 1255 and lasted 1.5 minutes. The resulting ash cloud rose to greater than 5 km above the volcano. Ash reportedly fell in nearby communities (Atlautla, San Juan Tehuixtitlan, San Pedro Nexapa, Amecameca, and Tenango).
At 0910 on 10 August, Popocatépetl erupted again. Ash reached to 3.5 km above the volcano. The ash clouds traveled to the W. A second eruption was visible in GOES 8 imagery. It was expected that nearby Mexican states would be coated with a thin layer of ash. At 19:15 on 23 August, a moderate exhalation produced ashfall in the nearby communities of San Pedro Nexapa and Amecameca (~12 km NW and ~16 km NW of the summit, respectively). Throughout the rest of the reporting period there were exhalations of low intensity and short duration that mainly involved gas with small amounts of ash.
Several volcano-tectonic earthquakes, ranging in magnitude from 1.7 to 2.3, occurred during the month of July. The first of these was on 2 July. It was followed by earthquakes on 6, 8, 9, 11, 15, and 23 of July. Three volcano-tectonic earthquakes occurred on 20 July, all under M 2.5. On 1 August, three more tectonic earthquakes were recorded, M 1.9 - 2.7. Other earthquakes occurred on 5 and 10 August; both were less than M 2.
Popocatépetl's volcanic hazard level remained at yellow. CENAPRED recommended that all visitors remain 7 km or more from the crater.
Geologic Background. Volcán Popocatépetl, whose name is the Aztec word for smoking mountain, rises 70 km SE of Mexico City to form North America's 2nd-highest volcano. The glacier-clad stratovolcano contains a steep-walled, 400 x 600 m wide crater. The generally symmetrical volcano is modified by the sharp-peaked Ventorrillo on the NW, a remnant of an earlier volcano. At least three previous major cones were destroyed by gravitational failure during the Pleistocene, producing massive debris-avalanche deposits covering broad areas to the south. The modern volcano was constructed south of the late-Pleistocene to Holocene El Fraile cone. Three major Plinian eruptions, the most recent of which took place about 800 CE, have occurred since the mid-Holocene, accompanied by pyroclastic flows and voluminous lahars that swept basins below the volcano. Frequent historical eruptions, first recorded in Aztec codices, have occurred since Pre-Columbian time.
Information Contacts: The National Center of the Prevention of Disasters (CENAPRED) (URL: https://www.gob.mx/cenapred/); Discovery.com (URL: http://www.discovery.com); Washington VAAC (URL: http://www.ospo.noaa.gov/Products/atmosphere/vaac/); Volcano World (URL: http://volcano.oregonstate.edu).
Rabaul (Papua New Guinea) — July 2000 Cite this Report
Rabaul
Papua New Guinea
4.2459°S, 152.1937°E; summit elev. 688 m
All times are local (unless otherwise noted)
Two periods of increased summit explosive activity in June
This report covers the period April-June 2000. During mid-April, the inflationary trend that began in February 2000 tapered off (BGVN 25:03). However, the realtime GPS system, along with electronic and water tilt data, continued to indicate a long-term inflation trend.
Emissions from the 1941 vent were characterized by thin, white vapor throughout the months of April and May. The 1995 vent was free of vapor emissions except for gentle puffs of grey ash-clouds on 5, 14-16, and 28-30 April, and 5 and 30 May. During April, these ash clouds rose several hundred meters above the summit before being blown to the W, NW, and SW. Towards the end of May, the general haze produced began to contain a weak ash component and there was a strong smell of SO2.
In April, a single high-frequency earthquake was recorded and located NE of the caldera wall. Low-frequency earthquakes continued to occur throughout April and were related to the eruptive activity associated with Tavurvur (figure 35). The number of these earthquakes fluctuated within background levels. There was a significant decrease in the number of trigger counts from 78 in February and 90 in March to 28 in April. The number rose again in May to 64. However, it should be noted that these trigger counts include only events that trigger two or more stations. The count that includes non-triggered events (seismic events that do not trigger more than one station) is much higher. On 15 and 30 April, bands of sub-continuous, 2-3 hour long, non-harmonic tremor were recorded.
For most of May, seismic activity was low. The exception was a ~M 4.8 earthquake that occurred at 1649 on 10 May and was centered 30 km NE of Rabaul. This produced several aftershocks; a total of 95 high-frequency triggered events were recorded on this date. Because of the proximity of these events to the established 'NE earthquake zone,' which is associated with ongoing eruptive activity, there was an expectation that higher levels of summit activity would occur at Tavurvur.
In June, 13 high-frequency events were recorded. Most originated NE of the Rabaul caldera. The S-P interval for these events was 1-4 seconds. Earthquakes occurring in this region have apparently been associated with the ongoing eruptive activity that began on 28 November 1995. A total of 185 low-frequency triggered events were recorded in June. Most of these events were related to explosions during two episodes of ashfall, one on 5 June and the other on 28 June. In addition, quasi-monochromatic volcanic tremor with durations ranging from a few minutes to a few hours were recorded during these periods. An increase in low- frequency non-triggered events was noted before each of the two episodes.
The 5 and 28 June episodes were characterized by moderate ashfall that emanated from Tavurvur. The first episode began on 5 June with a Vulcanian eruption that deposited lithic blocks beyond the crater rim. Through 8 June there was moderate-to-heavy ashfall. On 6 June at 1150 a loud explosion occurred at the 1941 vent. This was followed by increased explosive activity until the afternoon of 7 June when explosions occurred at 30-minute intervals. The explosion clouds contained moderate amounts of ash and rose to about 1.0-1.5 km above the summit. These ash clouds were blown such that they deposited ash towards the N, NE, and NW where Rabaul Town is located. By 8 June, the explosions had subsided to occasional emissions of light-to-moderate white vapor. For the following two weeks, the areas to the N, NE, and NW were continuosly blanketed in a thin fog of white vapor from Tavurvur.
At 0527(?) on 28 June, another explosion from the 1941 vent triggered the second period of light-to-moderate ashfall. The explosion was followed immediately by a dark grey ash cloud that rose to 1.5 km above the summit before being blown to the N and NW. Over the next two days, further ash clouds were produced that attained heights of several hundred meters. Discrete explosions, occurring at long intervals, marked the end of this period of activity. The last explosion occurred on 30 June.
Beginning in early May, electronic and wet-tilt measurements showed a downward tilt with a total deflation of ~9.0 µrad throughout May and June. However, an inflation of 4.0 µrad was recorded before the activity of 5-8 June and 5.5 µrad was recorded before the 27-30 June activity.
The low-lying Rabaul caldera forms a sheltered harbor once utilized by New Britain's largest city Rabaul prior to the 1994 eruption, which forced the abandonment of the city. Tavurvur and Vulcan are two eruption centers within the Rabaul caldera complex. These volcanoes have had virtually simultaneous eruptions in 1878, 1937, and 1994.
Geologic Background. The low-lying Rabaul caldera on the tip of the Gazelle Peninsula at the NE end of New Britain forms a broad sheltered harbor utilized by what was the island's largest city prior to a major eruption in 1994. The outer flanks of the asymmetrical shield volcano are formed by thick pyroclastic-flow deposits. The 8 x 14 km caldera is widely breached on the east, where its floor is flooded by Blanche Bay and was formed about 1,400 years ago. An earlier caldera-forming eruption about 7,100 years ago is thought to have originated from Tavui caldera, offshore to the north. Three small stratovolcanoes lie outside the N and NE caldera rims. Post-caldera eruptions built basaltic-to-dacitic pyroclastic cones on the caldera floor near the NE and W caldera walls. Several of these, including Vulcan cone, which was formed during a large eruption in 1878, have produced major explosive activity during historical time. A powerful explosive eruption in 1994 occurred simultaneously from Vulcan and Tavurvur volcanoes and forced the temporary abandonment of Rabaul city.
Information Contacts: Ima Itikarai, David Lolok, Herman Patia, and Steve Saunders, Rabaul Volcano Observatory (RVO), P.O. Box 386, Rabaul, Papua New Guinea.
Semeru
Indonesia
8.108°S, 112.922°E; summit elev. 3657 m
All times are local (unless otherwise noted)
Ongoing eruptive activity; 27 July explosion causes injuries and two fatalities
Semeru has been undergoing nearly constant eruptive activity since 1967. Volcanological Survey of Indonesia (VSI) reports through mid-September 1999 (BGVN 24:09) and earlier described seismicity (including seismically detected pyroclastic flows) and ongoing eruptive outbursts. Accessible Darwin VAAC reports since 3 June 1998 help to characterize the long-term eruptive patterns (table 3). VSI reports are not available for September 1999 through January 2000.
Table 3. A summary of aviation reports (Volcanic Ash Advisories) describing Semeru's plumes during 3 June 1998-21 August 2000. The first two columns describe the time and date when a report was issued. Time entries with commas signify that multiple reports were generated with similar comments. Where available, the time of the observations appear with the comment. Dash marks indicate lack of mention in report. Note that for plume heights, Semeru's summit lies at 3,676 m above sea level. Information sources include air reports (for example, routed via airlines, AIREPS), pilot reports (PIREPS), Notice to Airmen (NOTAM), satellite data, and reports from ground observations. Source data was provided by the Darwin VAAC.
| Date |
Time (GMT) |
Information Sources |
Plume altitude (km) |
Satellite confirmed ash (Y/N) |
Clouds (Y/N) |
Comment |
| 03 Jun 1998 |
0525 |
AIREP |
-- |
N |
-- |
Volcanic activity observed S of Surabaya, cloud moving S. |
| 11 Jul 1998 |
0635 |
AIREP |
6.1 |
-- |
-- |
Small volcanic plume. |
| 31 Aug 1998 |
0635 |
AIREP |
6.1 |
-- |
-- |
Small ash plume. |
| 01 Sep 1998 |
1500 |
AIREP |
7.6 |
N |
-- |
Volcanic activity observed at 1037. |
| 02 Sep 1998 |
0800 |
AIREP |
5.2 |
N |
-- |
Volcanic activity observed at 0551. |
| 19 Apr 1999 |
1228 |
AIREP |
7.6 |
N |
-- |
Eruption observed at 1003. |
| 13 Jun 1999 |
1003 |
AIREP |
6.1 |
N |
-- |
Plume tops seen. |
| 09 Jul 1999 |
0942 |
NOTAM |
6.1 |
N |
-- |
Report of ash cloud. |
| 16 Jul 1999 |
1226 |
AIREP |
4.6 |
Y |
-- |
Eruption reported at 0905. Weak ash plume apparent on satellite imagery extending 16.7 km WSW at 0936; no ash apparent on subsequent lower resolution imagery at 1030 and 1130. |
| 16 Jul 1999 |
1817 |
AIREP |
-- |
N |
-- |
Satellite imagery shows no further evidence of ash cloud at 1732. |
| 05 Aug 1999 |
0451 |
AIREP |
6.1 |
N |
-- |
Reported plume at 0350; satellite imagery at 0232 showed no evidence of ash cloud. |
| 05 Aug 1999 |
0538 |
AIREP |
6.1 |
N |
Y |
Follow-up to plume (reported above). |
| 23 Aug 1999 |
0304 |
NOTAM |
4.6 (top) |
N |
N |
Volcanic ash drifting SW; satellite image at 0132 and last 3 hourly images (no plume visible). |
| 13 Jun 2000 |
1144 |
AIREP |
7.6 |
N |
-- |
Ash plume. |
| 13 Jun 2000 |
1211 |
AIREP |
7.6 |
N |
-- |
Ash plume. |
| 23 Jun 2000 |
1228 |
AIREP |
4.6 |
N |
-- |
Ash plume at 0445. |
| 16 Jul 2000 |
1128 |
AIREP |
7.6 |
N |
-- |
Ash cloud at 0335. |
| 18 Jul 2000 |
0946 |
AIREP |
9.2 |
N |
-- |
Ash cloud 0600. |
| 18 Jul 2000 |
1536, 2129 |
AIREP |
-- |
N |
-- |
Ash cloud follow-up but cloud appears to have dissipated. |
| 19 Jul 2000 |
0044 |
NOAA |
9.2 |
Y |
-- |
Satellite imagery at 2115 and 2330; ash extending 56 km WSW bearing 257° from Mt. Semeru, plume width not more than 11 km; winds in area suggest height of ash above 5.5 km. |
| 19 Jul 2000 |
0652, 1245, 1837 |
GMS-5 satellite and Meteorological & Geophysical Agency of Indonesia |
4.6-9.2 |
-- |
-- |
Apparently undergoing a phase of enhanced activity; ground based reports over last month have given plume heights of 4.6 km; no ash clouds observed by satellite since 0030. |
| 20 Jul 2000 |
0019 |
GMS-5 satellite and Meteorological & Geophysical Agency of Indonesia |
-- |
N |
-- |
Latest imagery at 2333 on 19 July. |
| 19 Aug 2000 |
0653, 0812 |
PIREP |
10.7 |
N |
Y |
Possible smoke plume at 0438; scattered cloud in area. |
| 20 Aug 2000 |
0944 |
AIREP |
7.3 |
Y |
N |
Smoke plume at 0427; satellite imagery mostly clear of cloud shows a weak plume extending SSE 56-74 km. |
| 21 Aug 2000 |
0938 |
-- |
-- |
N |
-- |
Satellite imagery lacks clear plume at 0830. |
Activity during February-July 2000. Explosive activity during February 2000 included ash emissions, numerous rockfalls, and a few deep A-type earthquakes (table 4). Plumes of thick white ash were seen to rise up to 400 m above the summit on many occasions. Persistent haze or cloudy weather prevented direct observation throughout most of the month. At night during the week of 8-14 February observers noted a 60-m-high flame. Generally, explosions and rockfalls dominated recorded seismicity.
Table 4. Summary of seismicity at Semeru, 31 January-29 August 2000. * Six days of data, through 15 July. Courtesy of VSI.
| Dates |
Deep (A-type) |
Shallow (B-type) |
Tectonic |
Explosion |
Avalanche |
Tremor |
Pyroclastic Flows |
| 31 Jan-07 Feb 2000 |
2 |
3 |
6 |
142 |
49 |
4 |
-- |
| 08 Feb-14 Feb 2000 |
2 |
-- |
9 |
390 |
5 |
31 |
-- |
| 15 Feb-21 Feb 2000 |
8 |
-- |
3 |
327 |
9 |
0 |
-- |
| 22 Feb-27 Feb 2000 |
1 |
-- |
4 |
548 |
11 |
-- |
-- |
| 29 Feb-07 Mar 2000 |
"Seismic activity was relatively similar to last week... dominated by explosion and avalanche earthquakes." |
| 07 Mar-13 Mar 2000 |
19 |
5 |
5 |
628 |
38 |
-- |
1 |
| 14 Mar-20 Mar 2000 |
3 |
-- |
15 |
530 |
18 |
-- |
-- |
| 21 Mar-27 Mar 2000 |
5 |
4 |
8 |
733 |
26 |
-- |
-- |
| 28 Mar-03 Apr 2000 |
5 |
4 |
8 |
733 |
26 |
16 |
-- |
| 04 Apr-10 Apr 2000 |
8 |
-- |
7 |
737 |
45 |
56 |
1 |
| 11 Apr-17 Apr 2000 |
1 |
-- |
3 |
805 |
50 |
18 |
-- |
| 18 Apr-24 Apr 2000 |
-- |
1 |
4 |
678 |
45 |
48 |
-- |
| 25 Apr-01 May 2000 |
2 |
-- |
4 |
703 |
31 |
17 |
3 |
| 02 May-08 May 2000 |
-- |
13 |
3 |
770 |
46 |
-- |
5 |
| 09 May-16 May 2000 |
-- |
-- |
2 |
535 |
15 |
-- |
4 |
| 17 May-23 May 2000 |
7 |
3 |
1 |
705 |
95 |
-- |
3 |
| 24 May-30 May 2000 |
No data available. |
| 31 May-05 Jun 2000 |
No data available. |
| 06 Jun-12 Jun 2000 |
No data available. |
| 13 Jun-19 Jun 2000 |
-- |
-- |
7 |
557 |
25 |
7 |
2 |
| 20 Jun-26 Jun 2000 |
1 |
1 |
4 |
709 |
56 |
4 |
-- |
| 27 Jun-02 Jul 2000 |
-- |
1 |
6 |
600 |
86 |
15 |
6 |
| 03 Jul-09 Jul 2000 |
1 |
-- |
6 |
717 |
36 |
9 |
8 |
| 10 Jul-15 Jul 2000* |
-- |
1 |
6 |
557 |
27 |
6 |
8 |
| 17 Jul-23 Jul 2000 |
No data available. |
| 24 Jul-30 Jul 2000 |
14 |
4 |
18 |
542 |
60 |
-- |
7 |
| 31 Jul-07 Aug 2000 |
-- |
-- |
-- |
657 |
64 |
-- |
5 |
| 08 Aug-14 Aug 2000 |
-- |
-- |
-- |
584 |
43 |
-- |
2 |
| 15 Aug-21 Aug 2000 |
-- |
-- |
-- |
420 |
17 |
-- |
0 |
| 22 Aug-29 Aug 2000 |
23 |
1 |
21 |
542 |
27 |
-- |
3 |
Explosions and lava avalanches continued in March. Clouds and haze often obscured the volcano, but sometimes thick white emissions appeared above the summit to a maximum height of 500 m. Visual activity and seismicity appeared to increase in late March-early April.
During 4-10 April explosions and lava avalanches were still continuing and became stronger. Seismicity also increased significantly; tremor earthquakes took place 56 times, with maximum amplitudes of 3-15 mm. One pyroclastic flow traveled 1,500 m down the Besuk Kembar river. Many observations in clear conditions showed that the ash cloud was thick and white, rising 400-600 m above the summit. Emissions continued the following week, and explosions increased. "Red flames" sometimes appeared at the summit during night observations. Similar activity continued throughout April. The number of pyroclastic flows increased in late April, and continued at a typical rate of 2-7 per week for the next few months (table 4). On 30 April at 0743, from a location 15 km NNW of Semeru, a pyroclastic flow was observed travelling 800 m down the SSW flank.
Ashfall occurred at the Semeru Volcano Observatory during the week of 2-8 May, when five pyroclastic flows were recorded. Seismicity decreased again, but "red flame" was still seen at night and plumes rose as high as 600 m through 23 May.
Explosive activity was continuing in the second half of June; observers noted white-gray plumes ~600 m above the summit. Pyroclastic flows that reached maximum distances of ~2.5-3 km were reported on 1-2, 4, 10, and 15 July.
Observations on 2 May 2000. John Seach and Geoff Mackley made observations during a 3-hour summit stay on 2 May 2000. During the climb from Ranu Pani village in the N, ash deposits were observed to cover vegetation at a distance of 10 km from the volcano. The bottom third of the cone was vegetated, and zones of mass-wasting had sliced away 20- m-wide sections of forest. The top two-thirds of the cone consisted of ash, cinders, and blocks up to 1.5 m in diameter. There were areas of deep erosion and the risk of rockfalls posed a hazard to climbers.
The summit area (Mahameru) lay covered by ash and baseball-sized blocks with a density of 50/m2. A 20-m-wide, 60-m-deep, W-sloping valley separated Mahameru from the active Jonggring Seloko crater, but they are joined by a ridge. The highest N rim of the crater was approximately 30 m below the summit peak. A 2-m-diameter block was located 15 m below the summit on the wall of the valley.
Between 0725 and 1010, 13 eruptive events were observed. During this interval the N rim of Jonggring could not be approached because of the intermittent rain of blocks falling outside the crater and into the valley 50 m from the crater. Two vents produced short-lived Vulcanian eruptions with variable timing and size. Eruptions commenced with degassing, explosions, or the sound of breaking rock, followed by falling bombs and brown ash emission. The explosions were relatively quiet and not accompanied by groundshaking. Brown ash clouds rose to 600 m above the vent and drifted SE. The plume detached from the summit before the next eruption began. Steam emission occurred between eruptions.
Observations on 14 July 2000. Volcanologists on an International Association of Volcanology and Chemistry of the Earth's Interior (IAVCEI) field trip in east Java observed eruptions of Semeru from an observation point on the N rim of the Sand Sea caldera at Bromo (figure 10). Eruption plumes became visible just before sunrise. Gray ash-and-steam plumes rose a few hundred meters and drifted out over the ocean. Multiple plumes from earlier eruptions were visible downwind. Eruptions lasted up to 2 minutes, and occurred at intervals of between 5 and 30 minutes during the approximately 2 hours of observations. One explosion event was quickly followed by another explosion, apparently from a second location within the crater. Plumes were frequently seen during the next two days from other points around the volcano.
Explosion on 27 July 2000. At approximately 0706 on the morning of 27 July an explosion resulted in two deaths and injuries to five other volcanologists near the NE rim of the active summit crater Jonggring Seloko (see map in BGVN 17:10). The group consisted of a five-member Semeru evaluation team of the Volcanological Survey of Indonesia (VSI), four local porters, and foreign scientists who had attended the IAVCEI conference in Bali the previous week. The fatalities and injuries were caused by impacts and burns from ballistic clasts. These originated from the second of two closely spaced explosions from separate vents that ejected material out to a few hundred meters. Both fatalities were VSI staff members: Asep Wildan was the team leader, and Mukti was a volcano observer from the Semeru Volcano Observatory. Those injured included Suparno, a VSI volcano observer from the Semeru Volcano Observatory, Amit Mushkin from the Hebrew University in Israel, Mike Ramsey from the University of Pittsburgh, and Lee Siebert and Paul Kimberly from the Smithsonian Institution. Kimberly sustained the most serious injuries among the five survivors, including a broken hand, broken arm, and 3rd-degree burns. Following surgeries in Singapore and burn treatments in the United States, Kimberly was released from the hospital in early September.
Continuing activity through August. Visual observations were hindered by bad weather the first week of August. Activity generally decreased through 22 August. White to light-brown ash clouds rising to about 600 m in height were frequently seen during this period. Seismicity increased again in late August, and on 25 and 27 August three pyroclastic flows were recorded. Thin white-gray ash plumes rose ~600 m.
Geologic Background. Semeru, the highest volcano on Java, and one of its most active, lies at the southern end of a volcanic massif extending north to the Tengger caldera. The steep-sided volcano, also referred to as Mahameru (Great Mountain), rises above coastal plains to the south. Gunung Semeru was constructed south of the overlapping Ajek-ajek and Jambangan calderas. A line of lake-filled maars was constructed along a N-S trend cutting through the summit, and cinder cones and lava domes occupy the eastern and NE flanks. Summit topography is complicated by the shifting of craters from NW to SE. Frequent 19th and 20th century eruptions were dominated by small-to-moderate explosions from the summit crater, with occasional lava flows and larger explosive eruptions accompanied by pyroclastic flows that have reached the lower flanks of the volcano.
Information Contacts: Volcanological Survey of Indonesia (VSI), Jalan Diponegoro No. 57, Bandung 40122, Indonesia (URL: http://www.vsi.esdm.go.id/); Darwin Volcanic Ash Advisory Centre (VAAC), Bureau of Meteorology, Northern Territory Regional Office, PO Box 40050, Casuarina, NT 0811, Australia (URL: http://www.bom.gov.au/info/vaac/); John Seach, P.O. Box 16, Chatsworth Island, NSW 2469, Australia; Ed Venzke, Global Volcanism Program, Smithsonian Institution, Washington DC 20560-0119, USA.
Tungurahua (Ecuador) — July 2000 Cite this Report
Tungurahua
Ecuador
1.467°S, 78.442°W; summit elev. 5023 m
All times are local (unless otherwise noted)
January-July volcanism possibly decreased; lava fountains and many lahars
During January-July 2000 Tungurahua volcano experienced continuous but relatively mild activity with occasional lava fountaining. There were periods (hours to days) of relative calm during June and July.
The volcano continues to generate a variety of seismic events, most events being the long-period (LP) type. Two episodes of volcano-tectonic (VT) events were observed; one between late January and early March, and one less intense event between early May and mid-June. Epicenters for these events were across the top of the volcano's cone with focal depths at 3-13 km. Hybrid events, whose waveforms consist of a short, higher-frequency onset followed by lower-frequency, larger-amplitude signals, were most abundant in January and February (~50 events/week), partially coinciding with the greater VT activity. Subsequently these events diminished to 1-2 events/week, except for a brief swarm in early April.
Events of classical LP waveform were frequent, varying from ~400 events/week in January, ~600 in February, ~400 in March, ~600 in April, ~500 in May, and ~400 in June. A sharp increase to ~950 events/week was observed in July. Some of the LP events (3.7-4.0 Hz) were located tentatively at depths of 7-10 km below the crater. However, the great majority of LP events (1.5-3.3 Hz) were 3-7 km deep. They were often associated with explosion clouds or forceful emissions of ash-and-steam within 1-3 seconds of the seismic onset, suggesting a high-level origin.
Explosions, recognized principally by their impulsive onset, were more frequent during January and February (~80-90 events/week), but in subsequent months dropped to ~20-30 events/week, with many accompanied by a sonic boom. Reduced displacement values for the explosions typically were 5-10 cm2, and occasionally 12-18 cm2.
Low-frequency tremor with spectral frequencies between 0.5-1.6 Hz, but monochromatic at times, were observed in April and May, but only sporadically in June and July. During the period from the 2nd week of April through the 2nd week of May, the low-frequency episode coincided with lava fountaining in the summit crater. The fountains, comprised of the continuous ejection of incandescent material 100-500 m into the air, lasted hours; sustained roaring and surf-like noises heard 12 km away.
The constant glow of incandescent material in the crater, which was observed frequently in late 1999, was seen only occasionally during August, possibly due to unfavorable weather conditions. Better viewing conditions in late June and July confirmed that incandescent lava still remained in the crater or immediately below it.
The emissions have consisted of a permanent, grayish-white to light-gray column of steam with varying amounts of fine-grained ash that commonly rise less than 1 km above the crater. Explosions or strong emissions have consisted of blocks being thrown hundreds of meters into the air and by the formation of Vulcanian-like eruption clouds that are medium-to-dark gray in color and sometimes with a mushroom shape. The clouds have reached as high as 5 km above the summit. Primarily, easterly winds have carried the very fine ash to the W and WSW, but occasionally anywhere in the azimuthal arc between NW and SW. Both national and international flights reported the ash plume. The ash deposits were several centimeters thick on the lower W flank of the cone, but only several millimeters in the agriculturally important lands farther W.
Ballistic blocks were vesicular, black, glassy andesite containing phenocrysts of olivine, plagioclase, augite, and hypersthene, in a glassy matrix with 10-20% microlites. More recent samples had fewer olivines and larger augites. Chemical analyses of these blocks as well as collected ash gave the following typical values: SiO2 ~58.5%, K2O ~1.72%, MgO ~3.9%, Ni ~33 ppm, and Cr ~65 ppm.
COSPEC monitoring since November was hindered by heavy cloud cover. Following the consistently high SO2 flux values of 6,000-8,000 metric tons/day (t/d) during September-October 1999, values decreased to an average of 3,000-4,000 t/d in November-December 1999. Values then rose to ~8,000 t/d in January and subsequently dropped to an average of ~1,000-2,000 t/d in June and July 2000. An exception to this trend was an increase to ~4,000 t/d observed in April-May, 2000, which coincided with the lava fountaining episode. In general, higher SO2 values seem to be associated with greater tremor activity.
Monthly water analyses of hot springs at both the N and S bases of the edifice have not shown any variation in temperature, pH, conductivity, nor in the concentrations of SO4, Cl-, Na+, CO3--, Ca++, Mg++, and K+, since chemical monitoring began in 1992 and since the activity on Tungurahua began in July 1999.
Lahars coincided with the rainy season and became frequent in October and November 1999; they rapidly cut the main highway at every stream crossing along the western half of the cone (the area of greatest ash fall). Occasional rains from December to June generated flows of debris. The main highway to Baños and to the Amazon Basin was frequently blocked for hours due to lahar deposits.
In general, the activity appeared to be subsiding. However, during the 1916-18 eruptive period the volcano experienced 1.5 years of little activity between major eruptions. An orange alert is still in effect. In the past, Tungurahua typically generated both Merapi- and St. Vincent-like nuées ardentes. The W sector of Baños (17,000 inhabitants) lies at the mouth of a canyon that starts near the summit of the volcano, 9 km away and 3,000 m above the town.
Following the evacuation of Baños on 17 October 1999, the town remained abandoned until late December (BGVN 25:01). As of August 2000, about 80% of the population had returned and tourism has re-established itself.
Geologic Background. Tungurahua, a steep-sided andesitic-dacitic stratovolcano that towers more than 3 km above its northern base, is one of Ecuador's most active volcanoes. Three major edifices have been sequentially constructed since the mid-Pleistocene over a basement of metamorphic rocks. Tungurahua II was built within the past 14,000 years following the collapse of the initial edifice. Tungurahua II collapsed about 3,000 years ago and produced a large debris-avalanche deposit to the west. The modern glacier-capped stratovolcano (Tungurahua III) was constructed within the landslide scarp. Historical eruptions have all originated from the summit crater, accompanied by strong explosions and sometimes by pyroclastic flows and lava flows that reached populated areas at the volcano's base. Prior to a long-term eruption beginning in 1999 that caused the temporary evacuation of the city of Baños at the foot of the volcano, the last major eruption had occurred from 1916 to 1918, although minor activity continued until 1925.
Information Contacts: Geophysical Institute (Instituto Geofísico), Escuela Politécnica Nacional, Apartado 17-01-2759, Quito, Ecuador.
Ulawun (Papua New Guinea) — July 2000 Cite this Report
Ulawun
Papua New Guinea
5.05°S, 151.33°E; summit elev. 2334 m
All times are local (unless otherwise noted)
Vapor emissions during May and June; moderate seismicity in June
This report covers the period from April to June 2000. There were no unusual reports from Ulawun in April. Throughout May, moderate to thick white vapor was emitted. Emissions in June consisted of thin white vapor. However, on 5 and 7 June, the emissions were thick white vapor. Seismic activity for June was at a moderate level.
Geologic Background. The symmetrical basaltic-to-andesitic Ulawun stratovolcano is the highest volcano of the Bismarck arc, and one of Papua New Guinea's most frequently active. The volcano, also known as the Father, rises above the N coast of the island of New Britain across a low saddle NE of Bamus volcano, the South Son. The upper 1,000 m is unvegetated. A prominent E-W escarpment on the south may be the result of large-scale slumping. Satellitic cones occupy the NW and E flanks. A steep-walled valley cuts the NW side, and a flank lava-flow complex lies to the south of this valley. Historical eruptions date back to the beginning of the 18th century. Twentieth-century eruptions were mildly explosive until 1967, but after 1970 several larger eruptions produced lava flows and basaltic pyroclastic flows, greatly modifying the summit crater.
Information Contacts: I. Itikarai, D. Lolok, K. Mulina, and F. Taranu, Rabaul Volcano Observatory (RVO), P.O. Box 386, Rabaul, Papua New Guinea.
Whakaari/White Island (New Zealand) — July 2000 Cite this Report
Whakaari/White Island
New Zealand
37.52°S, 177.18°E; summit elev. 294 m
All times are local (unless otherwise noted)
New crater formed on 27 July during the largest eruption in about 20 years
This report covers June and July 2000. On 18 April 2000, the Institute of Geological and Nuclear Sciences (IGNS) increased the alert level from 1 to 2 (level 5 being the most severe) following minor eruptive activity that began on 7 March 2000 and included elevated seismicity and higher than normal SO2 gas flux (BGVN 25:03).
The IGNS reported that for the week ending 16 June 2000, the active MH vent continued to emit an ash plume. This plume sometimes extended as far as 60 km downwind and deposited ash as far as 15 km away. Up to several centimeters of ash were deposited on White Island. Until 16 June, seismic activity was significantly less than in May.
Field observations on 12 July indicated little change in activity since April. Furthermore, no direct relationship between seismic activity during this time and the eruptive activity could be determined. The ash continued to be vented to an altitude of 800-1,000 m. By 19 July, strong NE winds had periodically blown the ash plume towards the mainland, resulting in minor ash deposition there. Ashfall at Turango airport led to landing and departure restrictions. Air traffic was also disrupted around the Bay of Plenty.
On 22 July IGNS staff noticed an increase in activity compared to previous observations. A yellowish-brown gas and an ash plume extending to a height of 1500 m were blown to the E and SE. This continued to disrupt air traffic and deposit ash on the mainland. In fact, the IGNS staff were unable to land due to ash accumulation at the landing site. However, they noted that yellowish-brown ash now covered the island with thicknesses ranging from several mm to several cm. They saw no evidence of ballistic bombs or evidence that the eruptive style had changed from the previous months. However, they did note that the height of the MH vent had decreased from its previous location above the acid lake to a height level with the lake.
On Thursday 27 July between 1700 and 2200, a period of strong seismic activity was recorded. Visual and satellite observations were not possible due to poor weather conditions. A tour operator arriving at the island the morning of 28 July, confirmed that there had been an eruption. IGNS staff arrived 29 July and discovered that a large explosive eruption formed a new crater 120 x 150 m wide in the site formerly occupied by a warm acidic lake in the 1978-90 Crater Complex. The eruption deposited as much as 30 cm of ash and pyroclastic material, including juvenile pumice blocks, over the eastern part of the island. This was the largest eruption at White Island in about 20 years; deposits from this eruption were found in areas frequently visited by tourists. The IGNS advised all visitors that similar eruptions pose serious risks to anyone on the island.
Observations on 31 July found the MH vent, which had enlarged to ~50 m, spewing a dark ash cloud while a reddish-brown ash cloud rose from the new 27 July vent. The plumes combined and rose as high as 1-1.2 km above the vents. After this event, activity returned to the level typical since April: minor eruptions that produced plumes of gas, steam, and volcanic ash.
Geologic Background. The uninhabited Whakaari/White Island is the 2 x 2.4 km emergent summit of a 16 x 18 km submarine volcano in the Bay of Plenty about 50 km offshore of North Island. The island consists of two overlapping andesitic-to-dacitic stratovolcanoes. The SE side of the crater is open at sea level, with the recent activity centered about 1 km from the shore close to the rear crater wall. Volckner Rocks, sea stacks that are remnants of a lava dome, lie 5 km NW. Descriptions of volcanism since 1826 have included intermittent moderate phreatic, phreatomagmatic, and Strombolian eruptions; activity there also forms a prominent part of Maori legends. The formation of many new vents during the 19th and 20th centuries caused rapid changes in crater floor topography. Collapse of the crater wall in 1914 produced a debris avalanche that buried buildings and workers at a sulfur-mining project. Explosive activity in December 2019 took place while tourists were present, resulting in many fatalities. The official government name Whakaari/White Island is a combination of the full Maori name of Te Puia o Whakaari ("The Dramatic Volcano") and White Island (referencing the constant steam plume) given by Captain James Cook in 1769.
Information Contacts: Brent Alloway, Brad Scott, and Steven Sherburn, Wairakei Research Center, Institute of Geological and Nuclear Sciences (IGNS), Private Bag 2000, Wairakei, New Zealand (URL: http://www.gns.cri.nz/).