Recently Published Bulletin Reports
Erebus (Antarctica) Lava lake remains active; most thermal alerts recorded since 2019
Rincon de la Vieja (Costa Rica) Frequent phreatic explosions during July-December 2023
Bezymianny (Russia) Explosion on 18 October 2023 sends ash plume 8 km high; lava flows and incandescent avalanches
Kilauea (United States) Low-level lava effusions in the lava lake at Halema’uma’u during July-December 2022
Nyamulagira (DR Congo) Lava flows and thermal activity during May-October 2023
Bagana (Papua New Guinea) Explosions, ash plumes, ashfall, and lava flows during April-September 2023
Mayon (Philippines) Lava flows, pyroclastic flows, ash emissions, and seismicity during April-September 2023
Nishinoshima (Japan) Eruption plumes and gas-and-steam plumes during May-August 2023
Krakatau (Indonesia) White gas-and-steam plumes and occasional ash plumes during May-August 2023
Villarrica (Chile) Strombolian activity, gas-and-ash emissions, and crater incandescence during April-September 2023
Merapi (Indonesia) Frequent incandescent avalanches during April-September 2023
Ebeko (Russia) Moderate explosive activity with ash plumes continued during June-November 2023
Erebus (Antarctica) — January 2024  Cite this Report
Erebus
Antarctica
77.53°S, 167.17°E; summit elev. 3794 m
All times are local (unless otherwise noted)
Lava lake remains active; most thermal alerts recorded since 2019
The lava lake in the summit crater of Erebus has been active since at least 1972. Located in Antarctica overlooking the McMurdo Station on Ross Island, it is the southernmost active volcano on the planet. Because of the remote location, activity is primarily monitored by satellites. This report covers activity during 2023.
The number of thermal alerts recorded by the Hawai'i Institute of Geophysics and Planetology’s MODVOLC Thermal Alerts System increased considerably in 2023 compared to the years 2020-2022 (table 9). In contrast to previous years, the MODIS instruments aboard the Aqua and Terra satellites captured data from Erebus every month during 2023. Consistent with previous years, the lowest number of anomalous pixels were recorded in January, November, and December.
Table 9. Number of monthly MODIS-MODVOLC thermal alert pixels recorded at Erebus during 2017-2023. See BGVN 42:06 for data from 2000 through 2016. The table was compiled using data provided by the HIGP – MODVOLC Thermal Alerts System.
| Year |
Jan |
Feb |
Mar |
Apr |
May |
Jun |
Jul |
Aug |
Sep |
Oct |
Nov |
Dec |
SUM |
| 2017 |
0 |
21 |
9 |
0 |
0 |
1 |
11 |
61 |
76 |
52 |
0 |
3 |
234 |
| 2018 |
0 |
21 |
58 |
182 |
55 |
17 |
137 |
172 |
103 |
29 |
0 |
0 |
774 |
| 2019 |
2 |
21 |
162 |
151 |
55 |
56 |
75 |
53 |
29 |
19 |
1 |
0 |
624 |
| 2020 |
0 |
2 |
16 |
18 |
4 |
4 |
1 |
3 |
18 |
3 |
1 |
6 |
76 |
| 2021 |
0 |
9 |
1 |
0 |
2 |
56 |
46 |
47 |
35 |
52 |
5 |
3 |
256 |
| 2022 |
1 |
13 |
55 |
22 |
15 |
32 |
39 |
19 |
31 |
11 |
0 |
0 |
238 |
| 2023 |
2 |
33 |
49 |
82 |
41 |
32 |
70 |
64 |
42 |
17 |
5 |
11 |
448 |
Sentinel-2 infrared images showed one or two prominent heat sources within the summit crater, accompanied by adjacent smaller sources, similar to recent years (see BGVN 46:01, 47:02, and 48:01). A unique image was obtained on 25 November 2023 by the OLI-2 (Operational Land Imager-2) on Landsat 9, showing the upper part of the volcano surrounded by clouds (figure 32).
Geologic Background. Mount Erebus, the world's southernmost historically active volcano, overlooks the McMurdo research station on Ross Island. It is the largest of three major volcanoes forming the crudely triangular Ross Island. The summit of the dominantly phonolitic volcano has been modified by one or two generations of caldera formation. A summit plateau at about 3,200 m elevation marks the rim of the youngest caldera, which formed during the late-Pleistocene and within which the modern cone was constructed. An elliptical 500 x 600 m wide, 110-m-deep crater truncates the summit and contains an active lava lake within a 250-m-wide, 100-m-deep inner crater; other lava lakes are sometimes present. The glacier-covered volcano was erupting when first sighted by Captain James Ross in 1841. Continuous lava-lake activity with minor explosions, punctuated by occasional larger Strombolian explosions that eject bombs onto the crater rim, has been documented since 1972, but has probably been occurring for much of the volcano's recent history.
Information Contacts: Hawai'i Institute of Geophysics and Planetology (HIGP) - MODVOLC Thermal Alerts System, School of Ocean and Earth Science and Technology (SOEST), Univ. of Hawai'i, 2525 Correa Road, Honolulu, HI 96822, USA (URL: http://modis.higp.hawaii.edu/); Copernicus Browser, Copernicus Data Space Ecosystem, European Space Agency (URL: https://dataspace.copernicus.eu/browser/); NASA Earth Observatory, EOS Project Science Office, NASA Goddard Space Flight Center, Goddard, Maryland, USA (URL: https://earthobservatory.nasa.gov/images/152134/erebus-breaks-through).
Rincon de la Vieja (Costa Rica) — January 2024 Cite this Report
Rincon de la Vieja
Costa Rica
10.83°N, 85.324°W; summit elev. 1916 m
All times are local (unless otherwise noted)
Frequent phreatic explosions during July-December 2023
Rincón de la Vieja is a volcanic complex in Costa Rica with a hot convecting acid lake that exhibits frequent weak phreatic explosions, gas-and-steam emissions, and occasional elevated sulfur dioxide levels (BGVN 45:10, 46:03, 46:11). The current eruption period began June 2021. This report covers activity during July-December 2023 and is based on weekly bulletins and occasional daily reports from the Observatorio Vulcanologico Sismologica de Costa Rica-Universidad Nacional (OVSICORI-UNA).
Numerous weak phreatic explosions continued during July-December 2023, along with gas-and-steam emissions and plumes that rose as high as 3 km above the crater rim. Many weekly OVSICORI-UNA bulletins included the previous week's number of explosions and emissions (table 9). For many explosions, the time of explosion was given (table 10). Frequent seismic activity (long-period earthquakes, volcano-tectonic earthquakes, and tremor) accompanied the phreatic activity.
Table 9. Number of reported weekly phreatic explosions and gas-and-steam emissions at Rincón de la Vieja, July-December 2023. Counts are reported for the week before the Weekly Bulletin date; not all reports included these data. Courtesy of OVSICORI-UNA.
| OVSICORI Weekly Bulletin |
Number of explosions |
Number of emissions |
| 28 Jul 2023 |
6 |
14 |
| 4 Aug 2023 |
10 |
12 |
| 1 Sep 2023 |
13 |
11 |
| 22 Sep 2023 |
12 |
13 |
| 29 Sep 2023 |
6 |
11 |
| 6 Oct 2023 |
12 |
5 |
| 13 Oct 2023 |
7 |
9 |
| 20 Oct 2023 |
1 |
15 |
| 27 Oct 2023 |
3 |
23 |
| 3 Nov 2023 |
3 |
10 |
| 17 Nov 2023 |
0 |
Some |
| 24 Nov 2023 |
0 |
14 |
| 8 Dec 2023 |
4 |
16 |
| 22 Dec 2023 |
8 |
18 |
Table 10. Summary of activity at Rincón de la Vieja during July-December 2023. Weak phreatic explosions and gas emissions are noted where the time of explosion was indicated in the weekly or daily bulletins. Height of plumes or emissions are distance above the crater rim. Courtesy of OVSICORI-UNA.
| Date |
Time |
Description of Activity |
| 1 Jul 2023 |
0156 |
Explosion. |
| 2 Jul 2023 |
0305 |
Explosion. |
| 4 Jul 2023 |
0229, 0635 |
Event at 0635 produced a gas-and-steam plume that rose 700 m and drifted W; seen by residents in Liberia (21 km SW). |
| 9 Jul 2023 |
1843 |
Explosion. |
| 21 Jul 2023 |
0705 |
Explosion. |
| 26 Jul 2023 |
1807 |
Explosion. |
| 28 Jul 2023 |
0802 |
Explosion generated a gas-and-steam plume that rose 500 m. |
| 30 Jul 2023 |
1250 |
Explosion. |
| 31 Jul 2023 |
2136 |
Explosion. |
| 11 Aug 2023 |
0828 |
Explosion. |
| 18 Aug 2023 |
1304 |
Explosion. |
| 21 Aug 2023 |
1224 |
Explosion generated gas-and-steam plumes rose 500-600 m. |
| 22 Aug 2023 |
0749 |
Explosion generated gas-and-steam plumes rose 500-600 m. |
| 24 Aug 2023 |
1900 |
Explosion. |
| 25 Aug 2023 |
0828 |
Event produced a steam-and-gas plume that rose 3 km and drifted NW. |
| 27-28 Aug 2023 |
0813 |
Four small events; the event at 0813 on 28 August lasted two minutes and generated a steam-and-gas plume that rose 2.5 km. |
| 1 Sep 2023 |
1526 |
Explosion generated plume that rose 2 km and ejected material onto the flanks. |
| 2-3 Sep 2023 |
- |
Small explosions detected in infrasound data. |
| 4 Sep 2023 |
1251 |
Gas-and-steam plume rose 1 km and drifted W. |
| 7 Nov 2023 |
1113 |
Explosion. |
| 8 Nov 2023 |
0722 |
Explosion. |
| 12 Nov 2023 |
0136 |
Small gas emissions. |
| 14 Nov 2023 |
0415 |
Small gas emissions. |
According to OVSICORI-UNA, during July-October the average weekly sulfur dioxide (SO2) flux ranged from 68 to 240 tonnes/day. However, in mid-November the flux increased to as high as 334 tonnes/day, the highest value measured in recent years. The high SO2 flux in mid-November was also detected by the TROPOMI instrument on the Sentinel-5P satellite (figure 43).
Geologic Background. Rincón de la Vieja, the largest volcano in NW Costa Rica, is a remote volcanic complex in the Guanacaste Range. The volcano consists of an elongated, arcuate NW-SE-trending ridge constructed within the 15-km-wide early Pleistocene Guachipelín caldera, whose rim is exposed on the south side. Sometimes known as the "Colossus of Guanacaste," it has an estimated volume of 130 km3 and contains at least nine major eruptive centers. Activity has migrated to the SE, where the youngest-looking craters are located. The twin cone of Santa María volcano, the highest peak of the complex, is located at the eastern end of a smaller, 5-km-wide caldera and has a 500-m-wide crater. A Plinian eruption producing the 0.25 km3 Río Blanca tephra about 3,500 years ago was the last major magmatic eruption. All subsequent eruptions, including numerous historical eruptions possibly dating back to the 16th century, have been from the prominent active crater containing a 500-m-wide acid lake located ENE of Von Seebach crater.
Information Contacts: Observatorio Vulcanológico Sismológica de Costa Rica-Universidad Nacional (OVSICORI-UNA), Apartado 86-3000, Heredia, Costa Rica (URL: http://www.ovsicori.una.ac.cr/); NASA Global Sulfur Dioxide Monitoring Page, Atmospheric Chemistry and Dynamics Laboratory, NASA Goddard Space Flight Center (NASA/GSFC), 8800 Greenbelt Road, Goddard MD 20771, USA (URL: https://so2.gsfc.nasa.gov/).
Bezymianny (Russia) — November 2023 Cite this Report
Bezymianny
Russia
55.972°N, 160.595°E; summit elev. 2882 m
All times are local (unless otherwise noted)
Explosion on 18 October 2023 sends ash plume 8 km high; lava flows and incandescent avalanches
Bezymianny, located on Russia’s Kamchatka Peninsula, has had eruptions since 1955 characterized by dome growth, explosions, pyroclastic flows, ash plumes, and ashfall. Activity during November 2022-April 2023 included gas-and-steam emissions, lava dome collapses generating avalanches, and persistent thermal activity. Similar eruptive activity continued from May through October 2023, described here based on information from weekly and daily reports of the Kamchatka Volcano Eruptions Response Team (KVERT), notices from Tokyo VAAC (Volcanic Ash Advisory Center), and from satellite data.
Overall activity decreased after the strong period of activity in late March through April 2023, which included ash explosions during 29 March and 7-8 April 2023 that sent plumes as high as 10-12 km altitude, along with dome growth and lava flows (BGVN 48:05). This reduced activity can be seen in the MIROVA thermal detection system graph (figure 56), which was consistent with data from the MODVOLC thermal detection system and with Sentinel-2 satellite images that showed persistent hotspots in the summit crater when conditions allowed observations. A renewed period of strong activity began in mid-October 2023.
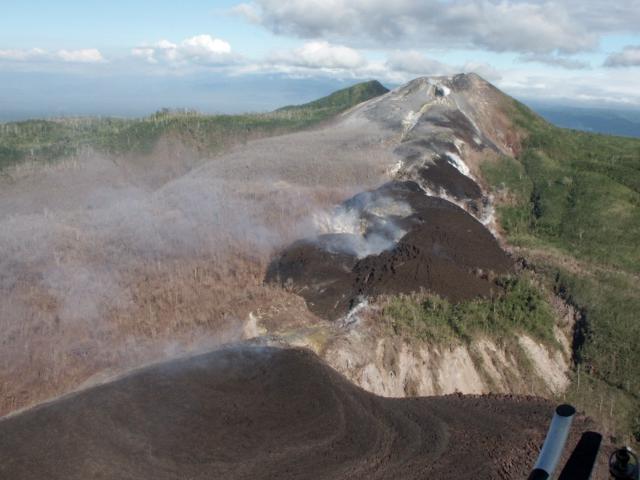
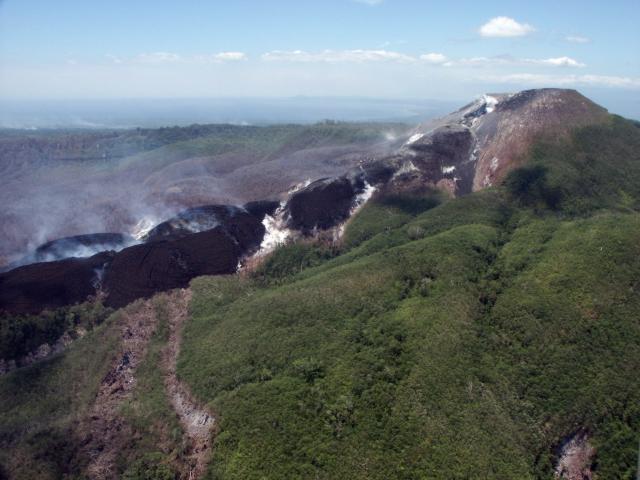
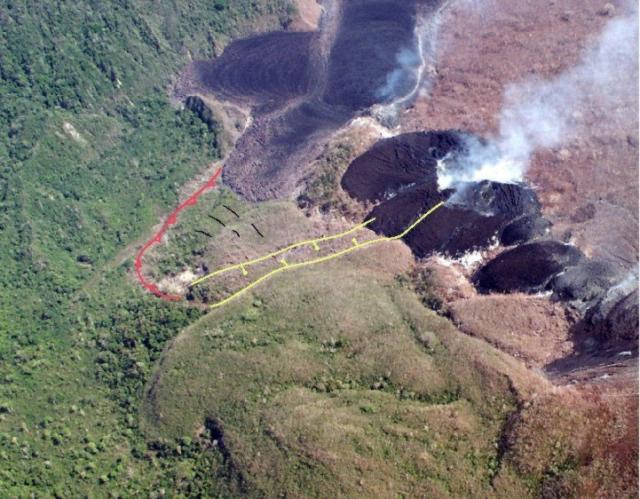
Activity increased significantly on 17 October 2023 when large collapses began during 0700-0830 on the E flanks of the lava dome and continued to after 0930 the next day (figure 57). Ash plumes rose to an altitude of 4.5-5 km, extending 220 km NNE by 18 October. A large explosion at 1630 on 18 October produced an ash plume that rose to an altitude of 11 km (8 km above the summit) and drifted NNE and then NW, extending 900 km NW within two days at an altitude of 8 km. Minor ashfall was noted in Kozyrevsk (45 km WNW). At 0820 on 20 October an ash plume was identified in satellite images drifting 100 km ENE at altitudes of 4-4.5 km.
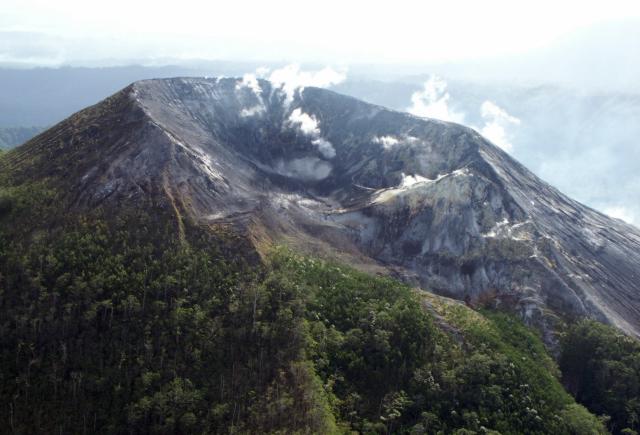
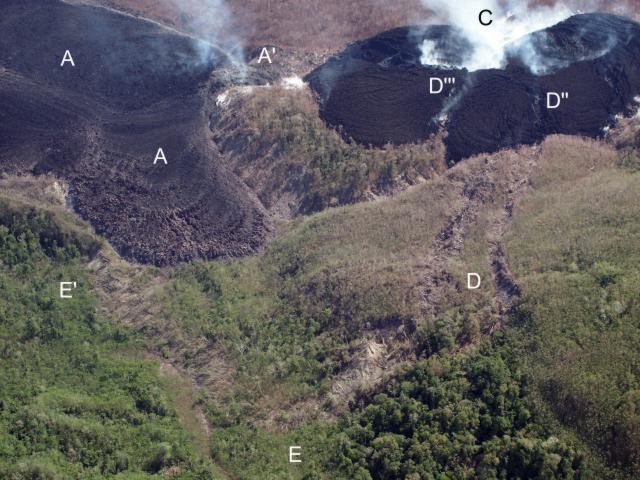
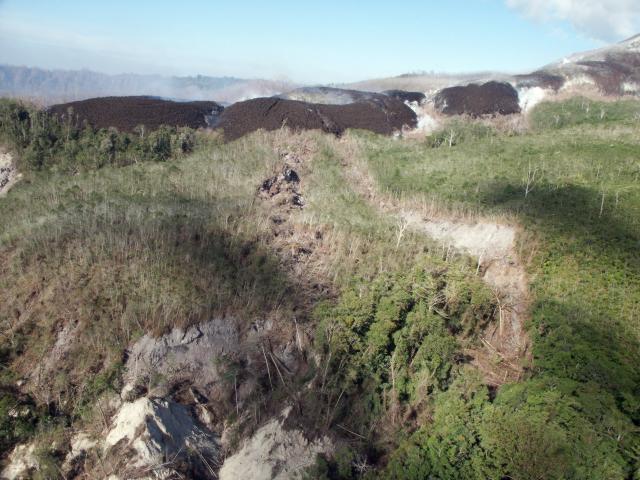
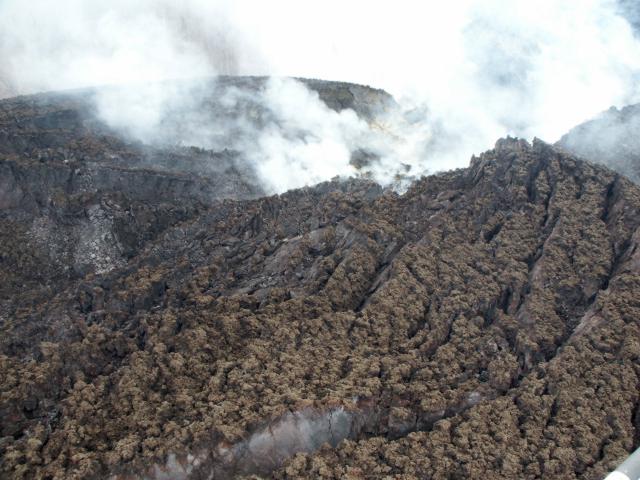
Lava flows and hot avalanches from the dome down the SE flank continued over the next few days, including 23 October when clear conditions allowed good observations (figures 58 and 59). A large thermal anomaly was observed over the volcano through 24 October, and in the summit crater on 30 October (figure 60). Strong fumarolic activity continued, with numerous avalanches and occasional incandescence. By the last week of October, volcanic activity had decreased to a level consistent with that earlier in the reporting period.
Aviation warnings were frequently updated during 17-20 October. KVERT issued a Volcano Observatory Notice for Aviation (VONA) on 17 October at 1419 and 1727 (0219 and 0527 UTC) raising the Aviation Color Code (ACC) from Yellow to Orange (second highest level). The next day, KVERT issued a VONA at 1705 (0505 UTC) raising the ACC to Red (highest level) but lowered it back to Orange at 2117 (0917 UTC). After another decrease to Yellow and back to Orange, the ACC was reduced to Yellow on 20 October at 1204 (0004 UTC). In addition, the Tokyo VAAC issued a series of Volcanic Ash Advisories beginning on 16 October and continuing through 30 October.
Geologic Background. The modern Bezymianny, much smaller than its massive neighbors Kamen and Kliuchevskoi on the Kamchatka Peninsula, was formed about 4,700 years ago over a late-Pleistocene lava-dome complex and an edifice built about 11,000-7,000 years ago. Three periods of intensified activity have occurred during the past 3,000 years. The latest period, which was preceded by a 1,000-year quiescence, began with the dramatic 1955-56 eruption. This eruption, similar to that of St. Helens in 1980, produced a large open crater that was formed by collapse of the summit and an associated lateral blast. Subsequent episodic but ongoing lava-dome growth, accompanied by intermittent explosive activity and pyroclastic flows, has largely filled the 1956 crater.
Information Contacts: Kamchatka Volcanic Eruptions Response Team (KVERT), Far Eastern Branch, Russian Academy of Sciences, 9 Piip Blvd., Petropavlovsk-Kamchatsky, 683006, Russia (URL: http://www.kscnet.ru/ivs/kvert/); Kamchatka Volcanological Station, Kamchatka Branch of Geophysical Survey, (KB GS RAS), Klyuchi, Kamchatka Krai, Russia (URL: http://volkstat.ru/); Tokyo Volcanic Ash Advisory Center (VAAC), 1-3-4 Otemachi, Chiyoda-ku, Tokyo 100-8122, Japan (URL: http://ds.data.jma.go.jp/svd/vaac/data/); Hawai'i Institute of Geophysics and Planetology (HIGP) - MODVOLC Thermal Alerts System, School of Ocean and Earth Science and Technology (SOEST), Univ. of Hawai'i, 2525 Correa Road, Honolulu, HI 96822, USA (URL: http://modis.higp.hawaii.edu/); MIROVA (Middle InfraRed Observation of Volcanic Activity), a collaborative project between the Universities of Turin and Florence (Italy) supported by the Centre for Volcanic Risk of the Italian Civil Protection Department (URL: http://www.mirovaweb.it/); Copernicus Browser, Copernicus Data Space Ecosystem, European Space Agency (URL: https://dataspace.copernicus.eu/browser/).chr
Kilauea (United States) — January 2023 Cite this Report
Kilauea
United States
19.421°N, 155.287°W; summit elev. 1222 m
All times are local (unless otherwise noted)
Low-level lava effusions in the lava lake at Halema’uma’u during July-December 2022
Kīlauea is the southeastern-most volcano in Hawaii and overlaps the E flank of the Mauna Loa volcano. Its East Rift Zone (ERZ) has been intermittently active for at least 2,000 years. An extended eruption period began in January 1983 and was characterized by open lava lakes and lava flows from the summit caldera and the East Rift Zone. During May 2018 magma migrated into the Lower East Rift Zone (LERZ) and opened 24 fissures along a 6-km-long NE-trending fracture zone that produced lava flows traveling in multiple directions. As lava emerged from the fissures, the lava lake at Halema'uma'u drained and explosions sent ash plumes to several kilometers altitude (BGVN 43:10).
The current eruption period started during September 2021 and has recently been characterized by lava effusions, spatter, and sulfur dioxide emissions in the active Halema’uma’u lava lake (BGVN 47:08). Lava effusions, some spatter, and sulfur dioxide emissions have continued during this reporting period of July through December 2022 using daily reports, volcanic activity notices, and abundant photo, map, and video data from the US Geological Survey's (USGS) Hawaiian Volcano Observatory (HVO).
Summary of activity during July-December 2022. Low-level effusions have continued at the western vent of the Halema’uma’u crater during July through early December 2022. Occasional weak ooze-outs (also called lava break outs) would occur along the margins of the crater floor. The overall level of the active lava lake throughout the reporting period gradually increased due to infilling, however it stagnated in mid-September (table 13). During September through November, activity began to decline, though lava effusions persisted at the western vent. By 9 December, the active part of the lava lake had completely crusted over, and incandescence was no longer visible.
Table 13. Summary of measurements taken during overflights at Kīlauea that show a gradual increase in the active lava lake level and the volume of lava effused since 29 September 2021. Lower activity was reported during September-October. Data collected during July-December 2022. Courtesy of HVO.
| Date: |
Level of the active lava lake (m): |
Cumulative volume of lava effused (million cubic meters): |
| 7 Jul 2022 |
130 |
95 |
| 19 Jul 2022 |
133 |
98 |
| 4 Aug 2022 |
136 |
102 |
| 16 Aug 2022 |
137 |
104 |
| 12 Sep 2022 |
143 |
111 |
| 5 Oct 2022 |
143 |
111 |
| 28 Oct 2022 |
143 |
111 |
Activity during July 2022. Lava effusions were reported from the western vent in the Halema’uma’u crater, along with occasional weak ooze-outs along the margins of the crater floor. The height of the lava lake was variable due to deflation-inflation tilt events; for example, the lake level dropped approximately 3-4 m during a summit deflation-inflation event reported on 1 July. Webcam images taken during the night of 6-12 July showed intermittent low-level spattering at the western vent that rose less than 10 m above the vent (figure 519). Measurements made during an overflight on 7 July indicated that the crater floor was infilled about 130 m and that 95 million cubic meters of lava had been effused since 29 September 2021. A single, relatively small lava ooze-out was active to the S of the lava lake. Around midnight on 8 July there were two brief periods of lava overflow onto the lake margins. On 9 July lava ooze-outs were reported near the SE and NE edges of the crater floor and during 10-11 July they occurred near the E, NE, and NW edges. On 16 July crater incandescence was reported, though the ooze-outs and spattering were not visible. On 18 July overnight webcam images showed incandescence in the western vent complex and two ooze-outs were reported around 0000 and 0200 on 19 July. By 0900 there were active ooze-outs along the SW edge of the crater floor. Measurements made from an overflight on 19 July indicated that the crater floor was infilled about 133 m and 98 million cubic meters of lava had erupted since 29 September 2021 (figure 520). On 20 July around 1600 active ooze-outs were visible along the N edge of the crater, which continued through the next day. Extensive ooze-outs occurred along the W margin during 24 July until 1900; on 26 July minor ooze-outs were noted along the N margin. Minor spattering was visible on 29 July along the E margin of the lake. The sulfur dioxide emission rates ranged 650-2,800 tons per day (t/d), the higher of which was measured on 8 July (figure 519).
Activity during August 2022. The eruption continued in the Halema’uma’u crater at the western vent. According to HVO the lava in the active lake remained at the level of the bounding levees. Occasional minor ooze-outs were observed along the margins of the crater floor. Strong nighttime crater incandescence was visible after midnight on 6 August over the western vent cone. During 6-7 August scattered small lava lobes were active along the crater floor and incandescence persisted above the western vent through 9 August. During 7-9 August HVO reported a single lava effusion source was active along the NW margin of the crater floor. Measurements from an overflight on 4 August indicated that the crater floor was infilled about 136 m total and that 102 million cubic meters of lava had been erupted since the start of the eruption. Lava breakouts were reported along the N, NE, E, S, and W margins of the crater during 10-16 August. Another overflight survey conducted on 16 August indicated that the crater floor infilled about 137 m and 104 million cubic meters of lava had been erupted since September 2021. Measured sulfur dioxide emissions rates ranged 1,150-2,450 t/d, the higher of which occurred on 8 August.
Activity during September 2022. During September, lava effusion continued from the western vent into the active lava lake and onto the crater floor. Intermittent minor ooze-outs were reported through the month. A small ooze-out was visible on the W crater floor margin at 0220 on 2 September, which showed decreasing surface activity throughout the day, but remained active through 3 September. On 3 September around 1900 a lava outbreak occurred along the NW margin of the crater floor but had stopped by the evening of 4 September. Field crews monitoring the summit lava lake on 9 September observed spattering on the NE margin of the lake that rose no higher than 10 m, before falling back onto the lava lake crust (figure 521). Overflight measurements on 12 September indicated that the crater floor was infilled a total of 143 m and 111 million cubic meters of lava had been erupted since September 2021. Extensive breakouts in the W and N part of the crater floor were reported at 1600 on 20 September and continued into 26 September. The active part of the lava lake dropped by 10 m while other parts of the crater floor dropped by several meters. Summit tiltmeters recorded a summit seismic swarm of more than 80 earthquakes during 1500-1800 on 21 September, which occurred about 1.5 km below Halema’uma’u; a majority of these were less than Mw 2. By 22 September the active part of the lava lake was infilled about 2 m. On 23 September the western vent areas exhibited several small spatter cones with incandescent openings, along with weak, sporadic spattering (figure 522). The sulfur dioxide emission rate ranged from 930 t/d to 2,000 t/d, the higher of which was measured on 6 September.
Activity during October 2022. Activity during October declined slightly compared to previous months, though lava effusions persisted from the western vent into the active lava lake and onto the crater floor during October (figure 523). Slight variations in the lava lake were noted throughout the month. HVO reported that around 0600 on 3 October the level of the lava lake has lowered slightly. Overflight measurements taken on 5 October indicated that the crater floor was infilled a total of about 143 m and that 111 million cubic meters of lava had been effused since September 2021. During 6-7 October the lake gradually rose 0.5 m. Sulfur dioxide measurements made on 22 October had an emission rate of 700 t/d. Another overflight taken on 28 October showed that there was little to no change in the elevation of the crater floor: the crater floor was infilled a total of 143 m and 111 million cubic meters of lava had erupted since the start of the eruption.
Activity during November 2022. Activity remained low during November, though HVO reported that lava from the western vent continued to effuse into the active lava lake and onto the crater floor throughout the month. The rate of sulfur dioxide emissions during November ranged from 300-600 t/d, the higher amount of which occurred on 9 November.
Activity during December 2022. Similar low activity was reported during December, with lava effusing from the western vent into the active lava lake and onto the crater floor. During 4-5 December the active part of the lava lake was slightly variable in elevation and fluctuated within 1 m. On 9 December HVO reported that lava was no longer erupting from the western vent in the Halema’uma’u crater and that sulfur dioxide emissions had returned to near pre-eruption background levels; during 10-11 December, the lava lake had completely crusted over, and no incandescence was visible (figure 524). Time lapse camera images covering the 4-10 December showed that the crater floor showed weak deflation and no inflation. Some passive events of crustal overturning were reported during 14-15 December, which brought fresh incandescent lava to the lake surface. The sulfur dioxide emission rate was approximately 200 t/d on 14 December. A smaller overturn event on 17 December and another that occurred around 0000 and into the morning of 20 December were also detected. A small seismic swarm was later detected on 30 December.
Geologic Background. Kilauea overlaps the E flank of the massive Mauna Loa shield volcano in the island of Hawaii. Eruptions are prominent in Polynesian legends; written documentation since 1820 records frequent summit and flank lava flow eruptions interspersed with periods of long-term lava lake activity at Halemaumau crater in the summit caldera until 1924. The 3 x 5 km caldera was formed in several stages about 1,500 years ago and during the 18th century; eruptions have also originated from the lengthy East and Southwest rift zones, which extend to the ocean in both directions. About 90% of the surface of the basaltic shield volcano is formed of lava flows less than about 1,100 years old; 70% of the surface is younger than 600 years. The long-term eruption from the East rift zone between 1983 and 2018 produced lava flows covering more than 100 km2, destroyed hundreds of houses, and added new coastline.
Information Contacts: Hawaiian Volcano Observatory (HVO), U.S. Geological Survey, PO Box 51, Hawai'i National Park, HI 96718, USA (URL: http://hvo.wr.usgs.gov/).
Nyamulagira (DR Congo) — November 2023 Cite this Report
Nyamulagira
DR Congo
1.408°S, 29.2°E; summit elev. 3058 m
All times are local (unless otherwise noted)
Lava flows and thermal activity during May-October 2023
Nyamulagira (also known as Nyamuragira) is a shield volcano in the Democratic Republic of Congo with the summit truncated by a small 2 x 2.3 km caldera with walls up to about 100 m high. Documented eruptions have occurred within the summit caldera, as well as from numerous flank fissures and cinder cones. The current eruption period began in April 2018 and has more recently been characterized by summit crater lava flows and thermal activity (BGVN 48:05). This report describes lava flows and variable thermal activity during May through October 2023, based on information from the Observatoire Volcanologique de Goma (OVG) and various satellite data.
Lava lake activity continued during May. The MIROVA (Middle InfraRed Observation of Volcanic Activity) system recorded moderate-to-strong thermal activity throughout the reporting period; activity was more intense during May and October and relatively weaker from June through September (figure 95). The MODVOLC thermal algorithm, detected a total of 209 thermal alerts. There were 143 hotspots detected during May, eight during June, nine during September, and 49 during October. This activity was also reflected in infrared satellite images, where a lava flow was visible in the NW part of the crater on 7 May and strong activity was seen in the center of the crater on 4 October (figure 96). Another infrared satellite image taken on 12 May showed still active lava flows along the NW margin of the crater. According to OVG lava effusions were active during 7-29 May and moved to the N and NW parts of the crater beginning on 9 May. Strong summit crater incandescence was visible from Goma (27 km S) during the nights of 17, 19, and 20 May (figure 97). On 17 May there was an increase in eruptive activity, which peaked at 0100 on 20 May. Notable sulfur dioxide plumes drifted NW and W during 19-20 May (figure 98). Drone footage acquired in partnership with the USGS (United States Geological Survey) on 20 May captured images of narrow lava flows that traveled about 100 m down the W flank (figure 99). Data from the Rumangabo seismic station indicated a decreasing trend in activity during 17-21 May. Although weather clouds prevented clear views of the summit, a strong thermal signature on the NW flank was visible in an infrared satellite image on 22 May, based on an infrared satellite image. On 28 May the lava flows on the upper W flank began to cool and solidify. By 29 May seismicity returned to levels similar to those recorded before the 17 May increase. Lava effusion continued but was confined to the summit crater; periodic crater incandescence was observed.
Low-level activity was noted during June through October. On 1 June OVG reported that seismicity remained at lower levels and that crater incandescence had been absent for three days, though infrared satellite imagery showed continued lava effusion in the summit crater. The lava flows on the flanks covered an estimated 0.6 km2. Satellite imagery continued to show thermal activity confined to the lava lake through October (figure 96), although no lava flows or significant sulfur dioxide emissions were reported.
Geologic Background. Africa's most active volcano, Nyamulagira (also known as Nyamuragira), is a massive high-potassium basaltic shield about 25 km N of Lake Kivu and 13 km NNW of the steep-sided Nyiragongo volcano. The summit is truncated by a small 2 x 2.3 km caldera that has walls up to about 100 m high. Documented eruptions have occurred within the summit caldera, as well as from the numerous flank fissures and cinder cones. A lava lake in the summit crater, active since at least 1921, drained in 1938, at the time of a major flank eruption. Recent lava flows extend down the flanks more than 30 km from the summit as far as Lake Kivu; extensive lava flows from this volcano have covered 1,500 km2 of the western branch of the East African Rift.
Information Contacts: Observatoire Volcanologique de Goma (OVG), Departement de Geophysique, Centre de Recherche en Sciences Naturelles, Lwiro, D.S. Bukavu, DR Congo; Hawai'i Institute of Geophysics and Planetology (HIGP) - MODVOLC Thermal Alerts System, School of Ocean and Earth Science and Technology (SOEST), Univ. of Hawai'i, 2525 Correa Road, Honolulu, HI 96822, USA (URL: http://modis.higp.hawaii.edu/); MIROVA (Middle InfraRed Observation of Volcanic Activity), a collaborative project between the Universities of Turin and Florence (Italy) supported by the Centre for Volcanic Risk of the Italian Civil Protection Department (URL: http://www.mirovaweb.it/); NASA Global Sulfur Dioxide Monitoring Page, Atmospheric Chemistry and Dynamics Laboratory, NASA Goddard Space Flight Center (NASA/GSFC), 8800 Greenbelt Road, Goddard, Maryland, USA (URL: https://so2.gsfc.nasa.gov/); Copernicus Browser, Copernicus Data Space Ecosystem, European Space Agency (URL: https://dataspace.copernicus.eu/browser/); Charles Balagizi, Goma Volcano Observatory, Departement de Geophysique, Centre de Recherche en Sciences Naturelles, Lwiro, D.S. Bukavu, DR Congo.
Bagana (Papua New Guinea) — October 2023 Cite this Report
Bagana
Papua New Guinea
6.137°S, 155.196°E; summit elev. 1855 m
All times are local (unless otherwise noted)
Explosions, ash plumes, ashfall, and lava flows during April-September 2023
The remote volcano of Bagana is located in central Bougainville Island, Papua New Guinea. Recorded eruptions date back to 1842 and activity has consisted of effusive activity that has built a small lava dome in the summit crater and occasional explosions that produced pyroclastic flows. The most recent eruption has been ongoing since February 2000 and has produced occasional explosions, ash plumes, and lava flows. More recently, activity has been characterized by ongoing effusive activity and ash emissions (BGVN 48:04). This report updates activity from April through September 2023 that has consisted of explosions, ash plumes, ashfall, and lava flows, using information from the Darwin Volcanic Ash Advisory Center (VAAC) and satellite data.
An explosive eruption was reported on 7 July that generated a large gas-and-ash plume to high altitudes and caused significant ashfall in local communities; the eruption plume had reached upper tropospheric (16-18 km altitude) altitudes by 2200, according to satellite images. Sulfur dioxide plumes were detected in satellite images on 8 July and indicated that the plume was likely a mixture of gas, ice, and ash. A report issued by the Autonomous Bougainville Government (ABG) (Torokina District, Education Section) on 10 July noted that significant ash began falling during 2000-2100 on 7 July and covered most areas in the Vuakovi, Gotana (9 km SW), Koromaketo, Laruma (25 km W) and Atsilima (27 km NW) villages. Pyroclastic flows also occurred, according to ground-based reports; small deposits confined to one drainage were inspected by RVO during an overflight on 17 July and were confirmed to be from the 7 July event. Ashfall continued until 10 July and covered vegetation, which destroyed bushes and gardens and contaminated rivers and streams.
RVO reported another eruption on 14 July. The Darwin VAAC stated that an explosive event started around 0830 on 15 July and produced an ash plume that rose to 16.5 km altitude by 1000 and drifted N, according to satellite images. The plume continued to drift N and remained visible through 1900, and by 2150 it had dissipated.
Ashfall likely from both the 7 and 15 July events impacted about 8,111 people in Torokina (20 km SW), including Tsito/Vuakovi, Gotana, Koromaketo, Kenaia, Longkogari, Kenbaki, Piva (13 km SW), and Atsinima, and in the Tsitovi district, according to ABG. Significant ashfall was also reported in Ruruvu (22 km N) in the Wakunai District of Central Bougainville, though the thickness of these deposits could not be confirmed. An evacuation was called for the villages in Wakunai, where heavy ashfall had contaminated water sources; the communities of Ruruvu, Togarau, Kakarapaia, Karauturi, Atao, and Kuritaturi were asked to evacuate to a disaster center at the Wakunai District Station, and communities in Torokina were asked to evacuate to the Piva District station. According to a news article, more than 7,000 people needed temporary accommodations, with about 1,000 people in evacuation shelters. Ashfall had deposited over a broad area, contaminating water supplies, affecting crops, and collapsing some roofs and houses in rural areas. Schools were temporarily shut down. Intermittent ash emissions continued through the end of July and drifted NNW, NW, and SW. Fine ashfall was reported on the coast of Torokina, and ash plumes also drifted toward Laruma and Atsilima.
A small explosive eruption occurred at 2130 on 28 July that ejected material from the crater vents, according to reports from Torokina, in addition to a lava flow that contained two lobes. A second explosion was detected at 2157. Incandescence from the lava flow was visible from Piva as it descended the W flank around 2000 on 29 July (figure 47). The Darwin VAAC reported that a strong thermal anomaly was visible in satellite images during 30-31 July and that ash emissions rose to 2.4 km altitude and drifted WSW on 30 July. A ground report from RVO described localized emissions at 0900 on 31 July.
The Darwin VAAC reported that ash plumes were identified in satellite imagery at 0800 and 1220 on 12 August and rose to 2.1 km and 3 km altitude and drifted NW and W, respectively. A news report stated that aid was sent to more than 6,300 people that were adversely affected by the eruption. Photos taken during 17-19 August showed ash emissions rising no higher than 1 km above the summit and drifting SE. A small explosion generated an ash plume during the morning of 19 August. Deposits from small pyroclastic flows were also captured in the photos. Satellite images captured lava flows and pyroclastic flow deposits. Two temporary seismic stations were installed near Bagana on 17 August at distances of 7 km WSW (Vakovi station) and 11 km SW (Kepox station). The Kepox station immediately started to record continuous, low-frequency background seismicity.
Satellite data. Little to no thermal activity was detected during April through mid-July 2023; only one anomaly was recorded during early April and one during early June, according to MIROVA (Middle InfraRed Observation of Volcanic Activity) data (figure 48). Thermal activity increased in both power and frequency during mid-July through September, although there were still some short gaps in detected activity. MODVOLC also detected increased thermal activity during August; thermal hotspots were detected a total of five times on 19, 20, and 27 August. Weak thermal anomalies were also captured in infrared satellite images on clear weather days throughout the reporting period on 7, 12, and 17 April, 27 May, 1, 6, 16, and 31 July, and 19 September (figure 48); a strong thermal anomaly was visible on 31 July. Distinct sulfur dioxide plumes that drifted generally NW were intermittently captured by the TROPOMI instrument on the Sentinel-5P satellite and sometimes exceeded two Dobson Units (DUs) (figure 49).
Geologic Background. Bagana volcano, in a remote portion of central Bougainville Island, is frequently active. This massive symmetrical cone was largely constructed by an accumulation of viscous andesitic lava flows. The entire edifice could have been constructed in about 300 years at its present rate of lava production. Eruptive activity is characterized by non-explosive effusion of viscous lava that maintains a small lava dome in the summit crater, although occasional explosive activity produces pyroclastic flows. Lava flows with tongue-shaped lobes up to 50 m thick and prominent levees descend the flanks on all sides.
Information Contacts: Rabaul Volcano Observatory (RVO), Geohazards Management Division, Department of Mineral Policy and Geohazards Management (DMPGM), PO Box 3386, Kokopo, East New Britain Province, Papua New Guinea; Darwin Volcanic Ash Advisory Centre (VAAC), Bureau of Meteorology, Northern Territory Regional Office, PO Box 40050, Casuarina, NT 0811, Australia (URL: http://www.bom.gov.au/info/vaac/); MIROVA (Middle InfraRed Observation of Volcanic Activity), a collaborative project between the Universities of Turin and Florence (Italy) supported by the Centre for Volcanic Risk of the Italian Civil Protection Department (URL: http://www.mirovaweb.it/); Hawai'i Institute of Geophysics and Planetology (HIGP) - MODVOLC Thermal Alerts System, School of Ocean and Earth Science and Technology (SOEST), Univ. of Hawai'i, 2525 Correa Road, Honolulu, HI 96822, USA (URL: http://modis.higp.hawaii.edu/); NASA Global Sulfur Dioxide Monitoring Page, Atmospheric Chemistry and Dynamics Laboratory, NASA Goddard Space Flight Center (NASA/GSFC), 8800 Greenbelt Road, Goddard, Maryland, USA (URL: https://so2.gsfc.nasa.gov/); Copernicus Browser, Copernicus Data Space Ecosystem, European Space Agency (URL: https://dataspace.copernicus.eu/browser/); Autonomous Bougainville Government, P.O Box 322, Buka, AROB, PNG (URL: https://abg.gov.pg/); Andrew Tupper (Twitter: @andrewcraigtupp); Simon Carn, Geological and Mining Engineering and Sciences, Michigan Technological University, 1400 Townsend Drive, Houghton, MI 49931, USA (URL: http://www.volcarno.com/, Twitter: @simoncarn); Radio NZ (URL: https://www.rnz.co.nz/news/pacific/494464/more-than-7-000-people-in-bougainville-need-temporary-accommodation-after-eruption); USAID, 1300 Pennsylvania Ave, NW, Washington DC 20004, USA (URL: https://www.usaid.gov/pacific-islands/press-releases/aug-08-2023-united-states-provides-immediate-emergency-assistance-support-communities-affected-mount-bagana-volcanic-eruptions).
Mayon (Philippines) — October 2023 Cite this Report
Mayon
Philippines
13.257°N, 123.685°E; summit elev. 2462 m
All times are local (unless otherwise noted)
Lava flows, pyroclastic flows, ash emissions, and seismicity during April-September 2023
Mayon is located in the Philippines and has steep upper slopes capped by a small summit crater. Historical eruptions date back to 1616 CE that have been characterized by Strombolian eruptions, lava flows, pyroclastic flows, and mudflows. Eruptions mostly originated from a central conduit. Pyroclastic flows and mudflows have commonly descended many of the approximately 40 drainages that surround the volcano. The most recent eruption occurred during June through October 2022 and consisted of lava dome growth and gas-and-steam emissions (BGVN 47:12). A new eruption was reported during late April 2023 and has included lava flows, pyroclastic density currents, ash emissions, and seismicity. This report covers activity during April through September 2023 based on daily bulletins from the Philippine Institute of Volcanology and Seismology (PHIVOLCS).
During April through September 2023, PHIVOLCS reported near-daily rockfall events, frequent volcanic earthquakes, and sulfur dioxide measurements. Gas-and-steam emissions rose 100-900 m above the crater and drifted in different directions. Nighttime crater incandescence was often visible during clear weather and was accompanied by incandescent avalanches of material. Activity notably increased during June when lava flows were reported on the S, SE, and E flanks (figure 52). The MIROVA graph (Middle InfraRed Observation of Volcanic Activity) showed strong thermal activity coincident with these lava flows, which remained active through September (figure 53). According to the MODVOLC thermal algorithm, a total of 110 thermal alerts were detected during the reporting period: 17 during June, 40 during July, 27 during August, and 26 during September. During early June, pyroclastic density currents (PDCs) started to occur more frequently.
Low activity was reported during much of April and May; gas-and-steam emissions rose 100-900 m above the crater and generally drifted in different directions. A total of 52 rockfall events and 18 volcanic earthquakes were detected during April and 147 rockfall events and 13 volcanic events during May. Sulfur dioxide flux measurements ranged between 400-576 tons per day (t/d) during April, the latter of which was measured on 29 April and between 162-343 t/d during May, the latter of which was measured on 13 May.
Activity during June increased, characterized by lava flows, pyroclastic density currents (PDCs), crater incandescence and incandescent rockfall events, gas-and-steam emissions, and continued seismicity. Weather clouds often prevented clear views of the summit, but during clear days, moderate gas-and-steam emissions rose 100-2,500 m above the crater and drifted in multiple directions. A total of 6,237 rockfall events and 288 volcanic earthquakes were detected. The rockfall events often deposited material on the S and SE flanks within 700-1,500 m of the summit crater and ash from the events drifted SW, S, SE, NE, and E. Sulfur dioxide emissions ranged between 149-1,205 t/d, the latter of which was measured on 10 June. Short-term observations from EDM and electronic tiltmeter monitoring indicated that the upper slopes were inflating since February 2023. Longer-term ground deformation parameters based on EDM, precise leveling, continuous GPS, and electronic tilt monitoring indicated that the volcano remained inflated, especially on the NW and SE flanks. At 1000 on 5 June the Volcano Alert Level (VAL) was raised to 2 (on a 0-5 scale). PHIVOLCS noted that although low-level volcanic earthquakes, ground deformation, and volcanic gas emissions indicated unrest, the steep increase in rockfall frequency may indicate increased dome activity.
A total of 151 dome-collapse PDCs occurred during 8-9 and 11-30 June, traveled 500-2,000 m, and deposited material on the S flank within 2 km of the summit crater. During 8-9 June the VAL was raised to 3. At approximately 1947 on 11 June lava flow activity was reported; two lobes traveled within 500 m from the crater and deposited material on the S (Mi-isi), SE (Bonga), and E (Basud) flanks. Weak seismicity accompanied the lava flow and slight inflation on the upper flanks. This lava flow remained active through 30 June, moving down the S and SE flank as far as 2.5 km and 1.8 km, respectively and depositing material up to 3.3 km from the crater. During 15-16 June traces of ashfall from the PDCs were reported in Sitio Buga, Nabonton, City of Ligao and Purok, and San Francisco, Municipality of Guinobatan. During 28-29 June there were two PDCs generated by the collapse of the lava flow front, which generated a light-brown ash plume 1 km high. Satellite monitors detected significant concentrations of sulfur dioxide beginning on 29 June. On 30 June PDCs primarily affected the Basud Gully on the E flank, the largest of which occurred at 1301 and lasted eight minutes, based on the seismic record. Four PDCs generated between 1800 and 2000 that lasted approximately four minutes each traveled 3-4 km on the E flank and generated an ash plume that rose 1 km above the crater and drifted N and NW. Ashfall was recorded in Tabaco City.
Similar strong activity continued during July; slow lava effusion remained active on the S and SE flanks and traveled as far as 2.8 km and 2.8 km, respectively and material was deposited as far as 4 km from the crater. There was a total of 6,983 rockfall events and 189 PDCs that affected the S, SE, and E flanks. The volcano network detected a total of 2,124 volcanic earthquakes. Continuous gas-and-steam emissions rose 200-2,000 m above the crater and drifted in multiple directions. Sulfur dioxide emissions averaged 792-4,113 t/d, the latter of which was measured on 28 July. During 2-4 July three PDCs were generated from the collapse of the lava flow and resulting light brown plumes rose 200-300 m above the crater. Continuous tremor pulses were reported beginning at 1547 on 3 July through 7 July at 1200, at 2300 on 8 July and going through 0300 on 10 July, and at 2300 on 16 July, as recorded by the seismic network. During 6-9 July there were 10 lava flow-collapse-related PDCs that generated light brown plumes 300-500 m above the crater. During 10-11 July light ashfall was reported in some areas of Mabinit, Legazpi City, Budiao and Salvacion, Daraga, and Camalig, Albay. By 18 July the lava flow advanced 600 m on the E flank as well.
During 1733 on 18 July and 0434 on 19 July PHIVOLCS reported 30 “ashing” events, which are degassing events accompanied by audible thunder-like sounds and entrained ash at the crater, which produced short, dark plumes that drifted SW. These events each lasted 20-40 seconds, and plume heights ranged from 150-300 m above the crater, as recorded by seismic, infrasound, visual, and thermal monitors. Three more ashing events occurred during 19-20 July. Short-term observations from electronic tilt and GPS monitoring indicate deflation on the E lower flanks in early July and inflation on the NW middle flanks during the third week of July. Longer-term ground deformation parameters from EDM, precise leveling, continuous GPS, and electronic tilt monitoring indicated that the volcano was still generally inflated relative to baseline levels. A short-lived lava pulse lasted 28 seconds at 1956 on 21 July, which was accompanied by seismic and infrasound signals. By 22 July, the only lava flow that remained active was on the SE flank, and continued to extend 3.4 km, while those on the S and E flanks weakened markedly. One ashing event was detected during 30-31 July, whereas there were 57 detected during 31 July-1 August; according to PHIVOLCS beginning at approximately 1800 on 31 July eruptive activity was dominated by phases of intermittent ashing, as well as increased in the apparent rates of lava effusion from the summit crater. The ashing phases consisted of discrete events recorded as low-frequency volcanic earthquakes (LFVQ) typically 30 seconds in duration, based on seismic and infrasound signals. Gray ash plume rose 100 m above the crater and generally drifted NE. Shortly after these ashing events began, new lava began to effuse rapidly from the crater, feeding the established flowed on the SE, E, and E flanks and generating frequent rockfall events.
Intensified unrest persisted during August. There was a total of 4,141 rockfall events, 2,881 volcanic earthquakes, which included volcanic tremor events, 32 ashing events, and 101 PDCs detected throughout the month. On clear weather days, gas-and-steam emissions rose 300-1,500 m above the crater and drifted in different directions (figure 54). Sulfur dioxide emissions averaged 735-4,756 t/d, the higher value of which was measured on 16 August. During 1-2 August the rate of lava effusion decreased, but continued to feed the flows on the SE, S, and E flanks, maintaining their advances to 3.4 km, 2.8 km, and 1.1 km from the crater, respectively (figure 55). Rockfall and PDCs generated by collapses at the lava flow margins and from the summit dome deposited material within 4 km of the crater. During 3-4 August there were 10 tremor events detected that lasted 1-4 minutes. Short-lived lava pulse lasted 35 seconds and was accompanied by seismic and infrasound signals at 0442 on 6 August. Seven collapses were recorded at the front of the lava flow during 12-14 August.
During September, similar activity of slow lava effusion, PDCs, gas-and-steam emissions, and seismicity continued. There was a total of 4,452 rockfall events, 329 volcanic earthquakes, which included volcanic tremor events, two ashing events, and 85 PDCs recorded throughout the month. On clear weather days, gas-and-steam emissions rose 100-1,500 m above the crater and drifted in multiple directions. Sulfur dioxide emissions averaged 609-2,252 t/d, the higher average of which was measured on 6 September. Slow lava effusion continued advancing on the SE, S, and E flanks, maintaining lengths of 3.4 km, 2.8 km, and 1.1 km, respectively. Rockfall and PDC events generated by collapses along the lava flow margins and at the summit dome deposited material within 4 km of the crater.
Geologic Background. Symmetrical Mayon, which rises above the Albay Gulf NW of Legazpi City, is the most active volcano of the Philippines. The steep upper slopes are capped by a small summit crater. Recorded eruptions since 1616 CE range from Strombolian to basaltic Plinian, with cyclical activity beginning with basaltic eruptions, followed by longer periods of andesitic lava flows. Eruptions occur predominately from the central conduit and have also produced lava flows that travel far down the flanks. Pyroclastic density currents and mudflows have commonly swept down many of the approximately 40 ravines that radiate from the summit and have often damaged populated lowland areas. A violent eruption in 1814 killed more than 1,200 people and devastated several towns.
Information Contacts: Philippine Institute of Volcanology and Seismology (PHIVOLCS), Department of Science and Technology, University of the Philippines Campus, Diliman, Quezon City, Philippines (URL: http://www.phivolcs.dost.gov.ph/); MIROVA (Middle InfraRed Observation of Volcanic Activity), a collaborative project between the Universities of Turin and Florence (Italy) supported by the Centre for Volcanic Risk of the Italian Civil Protection Department (URL: http://www.mirovaweb.it/); Hawai'i Institute of Geophysics and Planetology (HIGP) - MODVOLC Thermal Alerts System, School of Ocean and Earth Science and Technology (SOEST), Univ. of Hawai'i, 2525 Correa Road, Honolulu, HI 96822, USA (URL: http://modis.higp.hawaii.edu/); Copernicus Browser, Copernicus Data Space Ecosystem, European Space Agency (URL: https://dataspace.copernicus.eu/browser/); William Rogers, Legazpi City, Albay Province, Philippines.
Nishinoshima (Japan) — October 2023 Cite this Report
Nishinoshima
Japan
27.247°N, 140.874°E; summit elev. 100 m
All times are local (unless otherwise noted)
Eruption plumes and gas-and-steam plumes during May-August 2023
Nishinoshima, located about 1,000 km S of Tokyo, is a small island in the Ogasawara Arc in Japan. The island is the summit of a massive submarine volcano that has prominent submarine peaks to the S, W, and NE. Eruptions date back to 1973 and the current eruption period began in October 2022. Recent activity has consisted of small ash plumes and fumarolic activity (BGVN 48:07). This report covers activity during May through August 2023, using information from monthly reports of the Japan Meteorological Agency (JMA) monthly reports and satellite data.
Activity during May through June was relatively low. The Japan Coast Guard (JCG) did overflights on 14 and 22 June and reported white gas-and-steam emissions rising 600 m and 1,200 m from the central crater of the pyroclastic cone, respectively (figure 125). In addition, multiple white gas-and-steam emissions rose from the inner rim of the W side of the crater and from the SE flank of the pyroclastic cone. Discolored brown-to-green water was observed around almost the entire perimeter of the island; on 22 June light green discolored water was observed off the S coast of the island.
Observations from the Himawari meteorological satellite confirmed an eruption on 9 and 10 July. An eruption plume rose 1.6 km above the crater and drifted N around 1300 on 9 July. Satellite images acquired at 1420 and 2020 on 9 July and at 0220 on 10 July showed continuing emissions that rose 1.3-1.6 km above the crater and drifted NE and N. The Tokyo VAAC reported that an ash plume seen by a pilot and identified in a satellite image at 0630 on 21 July rose to 3 km altitude and drifted S.
Aerial observations conducted by JCG on 8 August showed a white-and-gray plume rising from the central crater of the pyroclastic cone, and multiple white gas-and-steam emissions were rising from the inner edge of the western crater and along the NW-SE flanks of the island (figure 126). Brown-to-green discolored water was also noted around the perimeter of the island.
Intermittent low-to-moderate power thermal anomalies were recorded in the MIROVA graph (Middle InfraRed Observation of Volcanic Activity), showing an increase in both frequency and power beginning in July (figure 127). This increase in activity coincides with eruptive activity on 9 and 10 July, characterized by eruption plumes. According to the MODVOLC thermal alert algorithm, one thermal hotspot was recorded on 20 July. Weak thermal anomalies were also detected in infrared satellite imagery, accompanied by strong gas-and-steam plumes (figure 128).
Geologic Background. The small island of Nishinoshima was enlarged when several new islands coalesced during an eruption in 1973-74. Multiple eruptions that began in 2013 completely covered the previous exposed surface and continued to enlarge the island. The island is the summit of a massive submarine volcano that has prominent peaks to the S, W, and NE. The summit of the southern cone rises to within 214 m of the ocean surface 9 km SSE.
Information Contacts: Japan Meteorological Agency (JMA), 1-3-4 Otemachi, Chiyoda-ku, Tokyo 100-8122, Japan (URL: http://www.jma.go.jp/jma/indexe.html); Tokyo Volcanic Ash Advisory Center (VAAC), 1-3-4 Otemachi, Chiyoda-ku, Tokyo 100-8122, Japan (URL: http://ds.data.jma.go.jp/svd/vaac/data/); MIROVA (Middle InfraRed Observation of Volcanic Activity), a collaborative project between the Universities of Turin and Florence (Italy) supported by the Centre for Volcanic Risk of the Italian Civil Protection Department (URL: http://www.mirovaweb.it/); Copernicus Browser, Copernicus Data Space Ecosystem, European Space Agency (URL: https://dataspace.copernicus.eu/browser/).
Krakatau (Indonesia) — October 2023 Cite this Report
Krakatau
Indonesia
6.1009°S, 105.4233°E; summit elev. 285 m
All times are local (unless otherwise noted)
White gas-and-steam plumes and occasional ash plumes during May-August 2023
Krakatau is located in the Sunda Strait between Java and Sumatra, Indonesia. Caldera collapse during the catastrophic 1883 eruption destroyed Danan and Perbuwatan cones and left only a remnant of Rakata. The post-collapse cone of Anak Krakatau (Child of Krakatau) was constructed within the 1883 caldera at a point between the former Danan and Perbuwatan cones; it has been the site of frequent eruptions since 1927. The current eruption period began in May 2021 and has recently consisted of Strombolian eruptions and ash plumes (BGVN 48:07). This report describes lower levels of activity consisting of ash and white gas-and-steam plumes during May through August 2023, based on information provided by the Indonesian Center for Volcanology and Geological Hazard Mitigation, referred to as Pusat Vulkanologi dan Mitigasi Bencana Geologi (PVMBG), MAGMA Indonesia, and satellite data.
Activity was relatively low during May and June. Daily white gas-and-steam emissions rose 25-200 m above the crater and drifted in different directions. Five ash plumes were detected at 0519 on 10 May, 1241 on 11 May, 0920 on 12 May, 2320 on 12 May, and at 0710 on 13 May, and rose 1-2.5 km above the crater and drifted SW. A webcam image taken on 12 May showed ejection of incandescent material above the vent. A total of nine ash plumes were detected during 6-11 June: at 1434 and 00220 on 6 and 7 June the ash plumes rose 500 m above the crater and drifted NW, at 1537 on 8 June the ash plume rose 1 km above the crater and drifted SW, at 0746 and at 0846 on 9 June the ash plumes rose 800 m and 3 km above the crater and drifted SW, respectively, at 0423, 1431, and 1750 on 10 June the ash plumes rose 2 km, 1.5 km, and 3.5 km above the crater and drifted NW, respectively, and at 0030 on 11 June an ash plume rose 2 km above the crater and drifted NW. Webcam images taken on 10 and 11 June at 0455 and 0102, respectively, showed incandescent material ejected above the vent. On 19 June an ash plume at 0822 rose 1.5 km above the crater and drifted SE.
Similar low activity of white gas-and-steam emissions and few ash plumes were reported during July and August. Daily white gas-and-steam emissions rose 25-300 m above the crater and drifted in multiple directions. Three ash plumes were reported at 0843, 0851, and 0852 on 20 July that rose 500-2,000 m above the crater and drifted NW.
The MIROVA (Middle InfraRed Observation of Volcanic Activity) graph of MODIS thermal anomaly data showed intermittent low-to-moderate power thermal anomalies during May through August 2023 (figure 140). Although activity was often obscured by weather clouds, a thermal anomaly was visible in an infrared satellite image of the crater on 12 May, accompanied by an eruption plume that drifted SW (figure 141).
Geologic Background. The renowned Krakatau (frequently mis-named as Krakatoa) volcano lies in the Sunda Strait between Java and Sumatra. Collapse of an older edifice, perhaps in 416 or 535 CE, formed a 7-km-wide caldera. Remnants of that volcano are preserved in Verlaten and Lang Islands; subsequently the Rakata, Danan, and Perbuwatan cones were formed, coalescing to create the pre-1883 Krakatau Island. Caldera collapse during the catastrophic 1883 eruption destroyed Danan and Perbuwatan, and left only a remnant of Rakata. This eruption caused more than 36,000 fatalities, most as a result of tsunamis that swept the adjacent coastlines of Sumatra and Java. Pyroclastic surges traveled 40 km across the Sunda Strait and reached the Sumatra coast. After a quiescence of less than a half century, the post-collapse cone of Anak Krakatau (Child of Krakatau) was constructed within the 1883 caldera at a point between the former Danan and Perbuwatan cones. Anak Krakatau has been the site of frequent eruptions since 1927.
Information Contacts: Pusat Vulkanologi dan Mitigasi Bencana Geologi (PVMBG, also known as Indonesian Center for Volcanology and Geological Hazard Mitigation, CVGHM), Jalan Diponegoro 57, Bandung 40122, Indonesia (URL: http://www.vsi.esdm.go.id/); MAGMA Indonesia, Kementerian Energi dan Sumber Daya Mineral (URL: https://magma.esdm.go.id/v1); MIROVA (Middle InfraRed Observation of Volcanic Activity), a collaborative project between the Universities of Turin and Florence (Italy) supported by the Centre for Volcanic Risk of the Italian Civil Protection Department (URL: http://www.mirovaweb.it/); Copernicus Browser, Copernicus Data Space Ecosystem, European Space Agency (URL: https://dataspace.copernicus.eu/browser/).
Villarrica (Chile) — October 2023 Cite this Report
Villarrica
Chile
39.42°S, 71.93°W; summit elev. 2847 m
All times are local (unless otherwise noted)
Strombolian activity, gas-and-ash emissions, and crater incandescence during April-September 2023
Villarrica, in central Chile, consists of a 2-km-wide caldera that formed about 3,500 years ago and is located at the base of the presently active cone at the NW margin of a 6-km-wide caldera. Historical eruptions eruptions date back to 1558 and have been characterized by mild-to-moderate explosive activity with occasional lava effusions. The current eruption period began in December 2014 and has recently consisted of nighttime crater incandescence, ash emissions, and seismicity (BGVN 48:04). This report covers activity during April through September 2023 and describes occasional Strombolian activity, gas-and-ash emissions, and nighttime crater incandescence. Information for this report primarily comes from the Southern Andes Volcano Observatory (Observatorio Volcanológico de Los Andes del Sur, OVDAS), part of Chile's National Service of Geology and Mining (Servicio Nacional de Geología y Minería, SERNAGEOMIN) and satellite data.
Seismicity during April consisted of long period (LP) events and tremor (TRE); a total of 9,413 LP-type events and 759 TR-type events were detected throughout the month. Nighttime crater incandescence persisted and was visible in the degassing column. Sulfur dioxide data was obtained using Differential Absorption Optical Spectroscopy Equipment (DOAS) that showed an average value of 1,450 ± 198 tons per day (t/d) during 1-15 April and 1,129 ± 201 t/d during 16-30 April, with a maximum daily value of 2,784 t/d on 9 April. Gas-and-steam emissions of variable intensities rose above the active crater as high as 1.3 km above the crater on 13 April. Strombolian explosions were not observed and there was a slight decrease in the lava lake level.
There were 14,123 LP-type events and 727 TR-type events detected during May. According to sulfur dioxide measurements taken with DOAS equipment, the active crater emitted an average value of 1,826 ± 482 t/d during 1-15 May and 912 ± 41 t/d during 16-30 May, with a daily maximum value of 5,155 t/d on 13 May. Surveillance cameras showed continuous white gas-and-steam emissions that rose as high as 430 m above the crater on 27 May. Nighttime incandescence illuminated the gas column less than 300 m above the crater rim was and no pyroclastic emissions were reported. A landslide was identified on 13 May on the E flank of the volcano 50 m from the crater rim and extending 300 m away; SERNAGEOMIN noted that this event may have occurred on 12 May. During the morning of 27 and 28 May minor Strombolian explosions characterized by incandescent ejecta were recorded at the crater rim; the last reported Strombolian explosions had occurred at the end of March.
Seismic activity during June consisted of five volcano-tectonic (VT)-type events, 21,606 LP-type events, and 2,085 TR-type events. The average value of sulfur dioxide flux obtained by DOAS equipment was 1,420 ± 217 t/d during 1-15 June and 2,562 ± 804 t/d, with a maximum daily value of 4,810 t/d on 17 June. White gas-and-steam emissions rose less than 480 m above the crater; frequent nighttime crater incandescence was reflected in the degassing plume. On 12 June an emission rose 100 m above the crater and drifted NNW. On 15 June one or several emissions resulted in ashfall to the NE as far as 5.5 km from the crater, based on a Skysat satellite image. Several Strombolian explosions occurred within the crater; activity on 15 June was higher energy and ejected blocks 200-300 m on the NE slope. Surveillance cameras showed white gas-and-steam emissions rising 480 m above the crater on 16 June. On 19 and 24 June low-intensity Strombolian activity was observed, ejecting material as far as 200 m from the center of the crater to the E.
During July, seismicity included 29,319 LP-type events, 3,736 TR-type events, and two VT-type events. DOAS equipment recorded two days of sulfur dioxide emissions of 4,220 t/d and 1,009 t/d on 1 and 13 July, respectively. Constant nighttime incandescence was also recorded and was particularly noticeable when accompanied by eruptive columns on 12 and 16 July. Minor explosive events were detected in the crater. According to Skysat satellite images taken on 12, 13, and 16 July, ashfall deposits were identified 155 m S of the crater. According to POVI, incandescence was visible from two vents on the crater floor around 0336 on 12 July. Gas-and-ash emissions rose as high as 1.2 km above the crater on 13 July and drifted E and NW. A series of gas-and-steam pulses containing some ash deposited material on the upper E flank around 1551 on 13 July. During 16-31 July, average sulfur dioxide emissions of 1,679 ± 406 t/d were recorded, with a maximum daily value of 2,343 t/d on 28 July. Fine ash emissions were also reported on 16, 17, and 23 July.
Seismicity persisted during August, characterized by 27,011 LP-type events, 3,323 TR-type events, and three VT-type events. The average value of sulfur dioxide measurements taken during 1-15 August was 1,642 ± 270 t/d and 2,207 ± 4,549 t/d during 16-31 August, with a maximum daily value of 3,294 t/d on 27 August. Nighttime crater incandescence remained visible in degassing columns. White gas-and-steam emissions rose 480 m above the crater on 6 August. According to a Skysat satellite image from 6 August, ash accumulation was observed proximal to the crater and was mainly distributed toward the E slope. White gas-and-steam emissions rose 320 m above the crater on 26 August. Nighttime incandescence and Strombolian activity that generated ash emissions were reported on 27 August.
Seismicity during September was characterized by five VT-type events, 12,057 LP-type events, and 2,058 TR-type events. Nighttime incandescence persisted. On 2 September an ash emission rose 180 m above the crater and drifted SE at 1643 (figure 125) and a white gas-and-steam plume rose 320 m above the crater. According to the Buenos Aires VAAC, periods of continuous gas-and-ash emissions were visible in webcam images from 1830 on 2 September to 0110 on 3 September. Strombolian activity was observed on 2 September and during the early morning of 3 September, the latter event of which generated an ash emission that rose 60 m above the crater and drifted 100 m from the center of the crater to the NE and SW. Ashfall was reported to the SE and S as far as 750 m from the crater. The lava lake was active during 3-4 September and lava fountaining was visible for the first time since 26 March 2023, according to POVI. Fountains captured in webcam images at 2133 on 3 September and at 0054 on 4 September rose as high as 60 m above the crater rim and ejected material onto the upper W flank. Sulfur dioxide flux of 1,730 t/d and 1,281 t/d was measured on 3 and 4 September, respectively, according to data obtained by DOAS equipment.
Strong Strombolian activity and larger gas-and-ash plumes were reported during 18-20 September. On 18 September activity was also associated with energetic LP-type events and notable sulfur dioxide fluxes (as high as 4,277 t/d). On 19 September Strombolian activity and incandescence were observed. On 20 September at 0914 ash emissions rose 50 m above the crater and drifted SSE, accompanied by Strombolian activity that ejected material less than 100 m SSE, causing fall deposits on that respective flank. SERNAGEOMIN reported that a Planet Scope satellite image taken on 20 September showed the lava lake in the crater, measuring 32 m x 35 m and an area of 0.001 km2. Several ash emissions were recorded at 0841, 0910, 1251, 1306, 1312, 1315, and 1324 on 23 September and rose less than 150 m above the crater. The sulfur dioxide flux value was 698 t/d on 23 September and 1,097 t/d on 24 September. On 24 September the Volcanic Alert Level (VAL) was raised to Orange (the third level on a four-color scale). SENAPRED maintained the Alert Level at Yellow (the middle level on a three-color scale) for the communities of Villarrica, Pucón (16 km N), Curarrehue, and Panguipulli.
During 24-25 September there was an increase in seismic energy (observed at TR-events) and acoustic signals, characterized by 1 VT-type event, 213 LP-type events, and 124 TR-type events. Mainly white gas-and-steam emissions, in addition to occasional fine ash emissions were recorded. During the early morning of 25 September Strombolian explosions were reported and ejected material 250 m in all directions, though dominantly toward the NW. On 25 September the average value of sulfur dioxide flux was 760 t/d. Seismicity during 25-30 September consisted of five VT-type events, 1,937 LP-type events, and 456 TR-type events.
During 25-29 September moderate Strombolian activity was observed and ejected material as far as the crater rim. In addition, ash pulses lasting roughly 50 minutes were observed around 0700 and dispersed ENE. During 26-27 September a TR episode lasted 6.5 hours and was accompanied by discrete acoustic signals. Satellite images from 26 September showed a spatter cone on the crater floor with one vent that measured 10 x 14 m and a smaller vent about 35 m NE of the cone. SERNAGEOMIN reported an abundant number of bomb-sized blocks up to 150 m from the crater, as well as impact marks on the snow, which indicated explosive activity. A low-altitude ash emission was observed drifting NW around 1140 on 28 September, based on webcam images. Between 0620 and 0850 on 29 September an ash emission rose 60 m above the crater and drifted NW. During an overflight taken around 1000 on 29 September scientists observed molten material in the vent, a large accumulation of pyroclasts inside the crater, and energetic degassing, some of which contained a small amount of ash. Block-sized pyroclasts were deposited on the internal walls and near the crater, and a distal ash deposit was also visible. The average sulfur dioxide flux measured on 28 September was 344 t/d. Satellite images taken on 29 September ashfall was deposited roughly 3 km WNW from the crater and nighttime crater incandescence remained visible. The average sulfur dioxide flux value from 29 September was 199 t/d. On 30 September at 0740 a pulsating ash emission rose 1.1 km above the crater and drifted NNW (figure 126). Deposits on the S flank extended as far as 4.5 km from the crater rim, based on satellite images from 30 September.
Infrared MODIS satellite data processed by MIROVA (Middle InfraRed Observation of Volcanic Activity) showed intermittent thermal activity during April through September, with slightly stronger activity detected during late September (figure 127). Small clusters of thermal activity were detected during mid-June, early July, early August, and late September. According to the MODVOLC thermal alert system, a total of four thermal hotspots were detected on 7 July and 3 and 23 September. This activity was also intermittently captured in infrared satellite imagery on clear weather days (figure 128).
Geologic Background. The glacier-covered Villarrica stratovolcano, in the northern Lakes District of central Chile, is ~15 km south of the city of Pucon. A 2-km-wide caldera that formed about 3,500 years ago is located at the base of the presently active, dominantly basaltic to basaltic andesite cone at the NW margin of a 6-km-wide Pleistocene caldera. More than 30 scoria cones and fissure vents are present on the flanks. Plinian eruptions and pyroclastic flows that have extended up to 20 km from the volcano were produced during the Holocene. Lava flows up to 18 km long have issued from summit and flank vents. Eruptions documented since 1558 CE have consisted largely of mild-to-moderate explosive activity with occasional lava effusion. Glaciers cover 40 km2 of the volcano, and lahars have damaged towns on its flanks.
Information Contacts: Servicio Nacional de Geología y Minería (SERNAGEOMIN), Observatorio Volcanológico de Los Andes del Sur (OVDAS), Avda Sta María No. 0104, Santiago, Chile (URL: http://www.sernageomin.cl/); Proyecto Observación Villarrica Internet (POVI) (URL: http://www.povi.cl/); Sistema y Servicio Nacional de Prevención y Repuesta Ante Desastres (SENAPRED), Av. Beauchef 1671, Santiago, Chile (URL: https://web.senapred.cl/); Buenos Aires Volcanic Ash Advisory Center (VAAC), Servicio Meteorológico Nacional-Fuerza Aérea Argentina, 25 de mayo 658, Buenos Aires, Argentina (URL: http://www.smn.gov.ar/vaac/buenosaires/inicio.php); MIROVA (Middle InfraRed Observation of Volcanic Activity), a collaborative project between the Universities of Turin and Florence (Italy) supported by the Centre for Volcanic Risk of the Italian Civil Protection Department (URL: http://www.mirovaweb.it/); Hawai'i Institute of Geophysics and Planetology (HIGP) - MODVOLC Thermal Alerts System, School of Ocean and Earth Science and Technology (SOEST), Univ. of Hawai'i, 2525 Correa Road, Honolulu, HI 96822, USA (URL: http://modis.higp.hawaii.edu/); Copernicus Browser, Copernicus Data Space Ecosystem, European Space Agency (URL: https://dataspace.copernicus.eu/browser/).
Merapi (Indonesia) — October 2023 Cite this Report
Merapi
Indonesia
7.54°S, 110.446°E; summit elev. 2910 m
All times are local (unless otherwise noted)
Frequent incandescent avalanches during April-September 2023
Merapi, located just north of the major city of Yogyakarta in central Java, Indonesia, has had activity within the last 20 years characterized by pyroclastic flows and lahars accompanying growth and collapse of the steep-sided active summit lava dome. The current eruption period began in late December 2020 and has more recently consisted of ash plumes, intermittent incandescent avalanches of material, and pyroclastic flows (BGVN 48:04). This report covers activity during April through September 2023, based on information from Balai Penyelidikan dan Pengembangan Teknologi Kebencanaan Geologi (BPPTKG), the Center for Research and Development of Geological Disaster Technology, a branch of PVMBG which specifically monitors Merapi. Additional information comes from the Pusat Vulkanologi dan Mitigasi Bencana Geologi (PVMBG, also known as Indonesian Center for Volcanology and Geological Hazard Mitigation, CVGHM), MAGMA Indonesia, the Darwin Volcanic Ash Advisory Centre (VAAC), and various satellite data.
Activity during April through September 2023 primarily consisted of incandescent avalanches of material that mainly affected the SW and W flanks and traveled as far as 2.3 km from the summit (table 25) and white gas-and-steam emissions that rose 10-1,000 m above the crater.
Table 25. Monthly summary of avalanches and avalanche distances recorded at Merapi during April through September 2023. The number of reported avalanches does not include instances where possible avalanches were heard but could not be visually confirmed as a result of inclement weather. Data courtesy of BPPTKG (April-September 2023 daily reports).
| Month |
Average number of avalanches per day |
Distance avalanches traveled (m) |
| Apr 2023 |
19 |
1,200-2,000 |
| May 2023 |
22 |
500-2,000 |
| Jun 2023 |
18 |
1,200-2,000 |
| Jul 2023 |
30 |
300-2,000 |
| Aug 2023 |
25 |
400-2,300 |
| Sep 2023 |
23 |
600-2,000 |
BPPTKG reported that during April and May white gas-and-steam emissions rose 10-750 m above the crater, incandescent avalanches descended 500-2,000 m on the SW and W flanks (figure 135). Cloudy weather often prevented clear views of the summit, and sometimes avalanches could not be confirmed. According to a webcam image, a pyroclastic flow was visible on 17 April at 0531. During the week of 28 April and 4 May a pyroclastic flow was reported on the SW flank, traveling up to 2.5 km. According to a drone overflight taken on 17 May the SW lava dome volume was an estimated 2,372,800 cubic meters and the dome in the main crater was an estimated 2,337,300 cubic meters.
During June and July similar activity persisted with white gas-and-steam emissions rising 10-350 m above the crater and frequent incandescent avalanches that traveled 300-2,000 m down the SW, W, and S flanks (figure 136). Based on an analysis of aerial photos taken on 24 June the volume of the SW lava dome was approximately 2.5 million cubic meters. A pyroclastic flow was observed on 5 July that traveled 2.7 km on the SW flank. According to the Darwin VAAC multiple minor ash plumes were identified in satellite images on 19 July that rose to 3.7 km altitude and drifted S and SW. During 22, 25, and 26 July a total of 17 avalanches descended as far as 1.8 km on the S flank.
Frequent white gas-and-steam emissions continued during August and September, rising 10-450 m above the crater. Incandescent avalanches mainly affected the SW and W flanks and traveled 400-2,300 m from the vent (figure 137). An aerial survey conducted on 10 August was analyzed and reported that estimates of the SW dome volume was 2,764,300 cubic meters and the dome in the main crater was 2,369,800 cubic meters.
Frequent and moderate-power thermal activity continued throughout the reporting period, according to a MIROVA (Middle InfraRed Observation of Volcanic Activity) analysis of MODIS satellite data (figure 138). There was an increase in the number of detected anomalies during mid-May. The MODVOLC thermal algorithm recorded a total of 47 thermal hotspots: six during April, nine during May, eight during June, 15 during July, four during August, and five during September. Some of this activity was captured in infrared satellite imagery on clear weather days, sometimes accompanied by incandescent material on the SW flank (figure 139).
Geologic Background. Merapi, one of Indonesia's most active volcanoes, lies in one of the world's most densely populated areas and dominates the landscape immediately north of the major city of Yogyakarta. It is the youngest and southernmost of a volcanic chain extending NNW to Ungaran volcano. Growth of Old Merapi during the Pleistocene ended with major edifice collapse perhaps about 2,000 years ago, leaving a large arcuate scarp cutting the eroded older Batulawang volcano. Subsequent growth of the steep-sided Young Merapi edifice, its upper part unvegetated due to frequent activity, began SW of the earlier collapse scarp. Pyroclastic flows and lahars accompanying growth and collapse of the steep-sided active summit lava dome have devastated cultivated lands on the western-to-southern flanks and caused many fatalities.
Information Contacts: Balai Penyelidikan dan Pengembangan Teknologi Kebencanaan Geologi (BPPTKG), Center for Research and Development of Geological Disaster Technology (URL: http://merapi.bgl.esdm.go.id/, Twitter: @BPPTKG); MAGMA Indonesia, Kementerian Energi dan Sumber Daya Mineral (URL: https://magma.esdm.go.id/v1); Pusat Vulkanologi dan Mitigasi Bencana Geologi (PVMBG, also known as Indonesian Center for Volcanology and Geological Hazard Mitigation, CVGHM), Jalan Diponegoro 57, Bandung 40122, Indonesia (URL: http://www.vsi.esdm.go.id/); Darwin Volcanic Ash Advisory Centre (VAAC), Bureau of Meteorology, Northern Territory Regional Office, PO Box 40050, Casuarina, NT 0811, Australia (URL: http://www.bom.gov.au/info/vaac/); MIROVA (Middle InfraRed Observation of Volcanic Activity), a collaborative project between the Universities of Turin and Florence (Italy) supported by the Centre for Volcanic Risk of the Italian Civil Protection Department (URL: http://www.mirovaweb.it/); Hawai'i Institute of Geophysics and Planetology (HIGP) - MODVOLC Thermal Alerts System, School of Ocean and Earth Science and Technology (SOEST), Univ. of Hawai'i, 2525 Correa Road, Honolulu, HI 96822, USA (URL: http://modis.higp.hawaii.edu/); Copernicus Browser, Copernicus Data Space Ecosystem, European Space Agency (URL: https://dataspace.copernicus.eu/browser/); Øystein Lund Andersen (URL: https://www.oysteinlundandersen.com/, https://twitter.com/oysteinvolcano).
Ebeko
Russia
50.686°N, 156.014°E; summit elev. 1103 m
All times are local (unless otherwise noted)
Moderate explosive activity with ash plumes continued during June-November 2023
Ebeko, located on the N end of Paramushir Island in Russia’s Kuril Islands just S of the Kamchatka Peninsula, consists of three summit craters along a SSW-NNE line at the northern end of a complex of five volcanic cones. Observed eruptions date back to the late 18th century and have been characterized as small-to-moderate explosions from the summit crater, accompanied by intense fumarolic activity. The current eruptive period began in June 2022, consisting of frequent explosions, ash plumes, and thermal activity (BGVN 47:10, 48:06). This report covers similar activity during June-November 2023, based on information from the Kamchatka Volcanic Eruptions Response Team (KVERT) and satellite data.
Moderate explosive activity continued during June-November 2023 (figures 50 and 51). According to visual data from Severo-Kurilsk, explosions sent ash 2-3.5 km above the summit (3-4.5 km altitude) during most days during June through mid-September. Activity after mid-September was slightly weaker, with ash usually reaching less than 2 km above the summit. According to KVERT the volcano in October and November was, with a few exceptions, either quiet or obscured by clouds that prevented satellite observations. KVERT issued Volcano Observatory Notices for Aviation (VONA) on 8 and 12 June, 13 and 22 July, 3 and 21 August, and 31 October warning of potential aviation hazards from ash plumes drifting 3-15 km from the volcano. Based on satellite data, KVERT reported a persistent thermal anomaly whenever weather clouds permitted viewing.
Geologic Background. The flat-topped summit of the central cone of Ebeko volcano, one of the most active in the Kuril Islands, occupies the northern end of Paramushir Island. Three summit craters located along a SSW-NNE line form Ebeko volcano proper, at the northern end of a complex of five volcanic cones. Blocky lava flows extend west from Ebeko and SE from the neighboring Nezametnyi cone. The eastern part of the southern crater contains strong solfataras and a large boiling spring. The central crater is filled by a lake about 20 m deep whose shores are lined with steaming solfataras; the northern crater lies across a narrow, low barrier from the central crater and contains a small, cold crescentic lake. Historical activity, recorded since the late-18th century, has been restricted to small-to-moderate explosive eruptions from the summit craters. Intense fumarolic activity occurs in the summit craters, on the outer flanks of the cone, and in lateral explosion craters.
Information Contacts: Kamchatka Volcanic Eruptions Response Team (KVERT), Far Eastern Branch, Russian Academy of Sciences, 9 Piip Blvd., Petropavlovsk-Kamchatsky, 683006, Russia (URL: http://www.kscnet.ru/ivs/kvert/).
Search Bulletin Archive by Publication Date
Select a month and year from the drop-downs and click "Show Issue" to have that issue displayed in this tab.
The default month and year is the latest issue available.
Bulletin of the Global Volcanism Network - Volume 27, Number 12 (December 2002)
Managing Editor: Richard Wunderman
Ambrym (Vanuatu)
Lava lakes remain active in Mbwelesu and Benbow craters through December 2002
Cotopaxi (Ecuador)
First anomalous seismicity since 1975 begins in October 2001
Etna (Italy)
Late October 2002 earthquake swarm signals start of new flank eruption
Karangetang (Indonesia)
500-m plumes and ~ 1.5-km glowing lava avalanche; Alert Level increased
Kerinci (Indonesia)
Continuous emissions through December 2002
Krakatau (Indonesia)
Seismicity dominated by volcanic earthquakes through at least December 2002
Lokon-Empung (Indonesia)
Higher-than-normal activity continues through at least December 2002
Lopevi (Vanuatu)
Anomalous SO2 emissions detected by satellite in December 2002 and January 2003
McDonald Islands (Australia)
Significant morphological changes due to eruptive activity
Pinatubo (Philippines)
Likely 2001 overflow controled by cross-rim trenching
Semeru (Indonesia)
Elevated explosive activity continues; evacuation on 30 December 2002
Stromboli (Italy)
Landslides on 30 December cause two tsunamis; damage in nearby villages
Tungurahua (Ecuador)
Summary of 2002 activity includes several episodes of intense seismicity
Witori (Papua New Guinea)
Dacite lava flows, flattened forest, deformation, and faulting
Ambrym (Vanuatu) — December 2002 Cite this Report
Ambrym
Vanuatu
16.25°S, 168.12°E; summit elev. 1334 m
All times are local (unless otherwise noted)
Lava lakes remain active in Mbwelesu and Benbow craters through December 2002
Observations of Ambrym were made by John Seach during a climb to the caldera during 11-15 December 2002. Lava lakes were visible in both Mbwelesu and Benbow craters that had been absent during a visit in February 2000 (BGVN 25:02) . Reports from local guides indicated that two lava lakes appeared in Mbwelesu crater during February 2001 and joined to form a single lava lake in August 2001. A lava lake reappeared in Benbow crater during June 2002. During November 2002 acid rain, for the third consecutive year, destroyed the mango crops between Sanesup and Lalinda on the W coast of Ambrym.
Activity at Mbwelesu Crater, 12 December 2002. Perfect visibility into the crater enabled detailed observations of the lava lake over 5 hours from the S side of the crater at an elevation of 950 m and over 300 m above the lava lake. The lava lake, located at the bottom of Mbwelesu Crater inside a circular pit (figures 6 and 7), had a diameter of 40-50 m, was in constant motion, and made continuous loud crashing sounds like waves at the beach. The lava lake was much more active than during previous visits in 1998 and 1999. Pele's hair littered the observation area, and white lithic blocks up to 30 cm in diameter were scattered on the rim.
The surface of the lava lake was continuously disrupted by degassing. Bubbles caused the lake surface to blister and finally burst, splashing lava into the air. Up to eight large bubbles formed at any one time and covered over 80% of the lake surface. The cycle of bubble formation and rupture took about 3 seconds. Waves up to 10 m high formed due to the degassing and crashed onto the side of the pit. After lava waves hit the side of the pit there was a drain-back of lava into the main lake much like ocean waves receding off a beach. Jets of lava were regularly expelled from the lake surface and directed both vertically and at an angle towards the pit side. Fountains reached up to 40 m high. Blobs of molten lava spattered onto the side of the pit up to 20 m from the lava lake edge. This spatter was more erratic than lava fountains and sprayed over a greater area. When large amounts of lava were thrown onto the pit wall, some would cascade back into the lake via a lava stream, lava fall, or a wide curtain of orange flowing lava.
Crusting of the surface was observed when parts of the lake had a lower level of activity, most often in the NE part of the pit opposite the area of most vigorous degassing. Sometimes a lava fountain would burst through the crust, throwing darker pieces of lava high into the air. At times the orange lava lake surface was covered with black pieces of broken crust. Crusting lasted for only a few minutes at a time before it was disrupted by fountains or waves. Lava disappeared into the lava lake surface by subducting under layers of other lava. Some lava disappeared into overhangs on the side of the pit. Lava lake activity continued out of view for an unknown distance past these overhangs.
The lava lake level rose and fell over a period of less than an hour in response to changes in the surface degassing rate. When the rate of degassing was high the lake level was raised by 10 m. The changes appeared to be caused by inflation of the lake due to gas rather than any change in lava eruption rate. During a period of low lava lake activity, the whole lake surface tilted 5 m towards the N and then back to the S over a two-second period. Violent intra-crater winds were observed around the lava lake as reflected in their effects on gas emissions. These were also felt beside the lava lake in Benbow crater. Vapors emitted from the lake surface were white tinged with blue.
Two 15-m-diameter vents 100 m N of the lava lake and 60 m higher were separated by a thin wall. The W vent did not show any activity. The E vent made almost continuous loud degassing noises, and larger explosions ejected black ash 50 m into the air. Mbwelesu was approached again on 15 December, but rain the previous day and low clouds had filled the crater with white vapor, allowing only brief views of the still constantly active lava lake.
Activity at Mbogon Niri Mbwelesu, 12 December 2002. This small collapse pit has been re-named (formerly Niri Mbwelesu Taten) after a request by local residents. The new name comes from the local Port Vato language of W Ambrym, as did the previous name, but is more culturally appropriate. The translation of the new name is " mouth of the wild young pig" (Mbogon = mouth, Niri = son, Mbwelesu = wild pig).
On 12 December excellent visibility enabled detailed observations into Mbogon Niri Mbwelesu. Observations were made from the N side of the pit. Loud crashing, degassing sounds were heard inside the pit, and a 10-m-diameter vent was observed on the floor about 180 m below. The pit glowed bright orange, but lava was not directly observed. This was the first time in 2002 that guides had observed the presence of lava in this pit. Loud degassing occurred every few seconds, and the larger explosions were accompanied by light brown emissions and ground shaking. Pungent sulfurous fumes were emitted from the pit, forcing the observer to use a respirator at times. Strong degassing of brown vapors was coming from the E side of the pit, 50 m below the rim. The W inside wall of the pit was coated with red and yellow deposits.
Activity at Niri Mbwelesu Crater, 12 December 2002. On 12 December excellent views were obtained into Niri Mbwelesu. A recent large landslide on the W wall of the crater had covered the previously lava-filled vent. Rockfalls were heard regularly inside the crater and degassing occurred about every 30 seconds. About every 20 minutes larger explosions were heard at the crater; some were audible over 3 km away.
Activity at Benbow Crater, 13 December 2002. Benbow was climbed from the S on 13 December. The observer free-climbed 165 m down to the floor of the first level, and then another 45 m further down to the edge of the lava lake pit in the N of the crater. Inside Benbow there were two active pits. The larger pit, in the middle of the crater, contained a crusted lava lake and two active vents. The SW vent was 25 m in diameter and was full of vapor but emitted no sounds. The NW vent was 10 m in diameter, glowed red, and loudly degassed. The N crater in Benbow contained an active lava lake. The observer climbed to the rim and was able to view the lake surface, ~50 m below, for a few seconds before retreating. The lava lake was in constant motion and lava was ejected in to the air. Violent winds (over 80 km/hour) were generated inside the pit and made observations on the edge dangerous. At times the pit was filled with white and blue-tinged vapors which made breathing difficult. The lava lake made continuous rumbling and sloshing noises. On a wall next to the lava lake pit there was dripping water with a pH of 3.5 and 700 ppm total dissolved solids.
Visit to Ambrym, 15-20 August 2001. Jeff and Raine Williams, sailing aboard the S/Y Gryphon, visited Ambrym Island during 15-20 August 2001. One day was spent hiking to the Mbwelesu crater with a guide from the village of Ranvetlam. Their report has been reduced here to basic observations; a more poetic and complete description of their hike can be found on their website. After leaving Ranvetlam, they began a steep climb through jungle and gardens, continuing through coconut groves and thick woods of breadfruit trees and wild nut trees. After an hour they were still passing through the garden plots of villagers. At higher altitudes the vegetation changed to bananas, kava, and lap-lap plants; wild tree ferns and palm trees were abundant.
After about 90 minutes they emerged from the jungle onto a lava flow at the lower limit of the high central 'ash plain' plateau. They climbed along this "50-yard wide, black gravel road," also described as a "wild orchid-lined highway," through the jungle to the ash plain itself, where the tops of Marum and Benbow could be seen shrouded in clouds and mist. The hike continued across ~1.5 km of the ash plain before passing along a lava gully onto the final ridge, a 1-m-wide path of loose cinders and stone. They climbed to the rim and looked down the sheer, nearly vertical cliffs into the crater, where they heard rumbling and splashing sounds of the active lava lake. Although the weather was cold and windy, the fog cleared enough for the visitors to briefly observe bright red lava in the crater three times within 30 minutes. The 11-km-long hike to the crater took four hours, and another 3 hours to return.
Geologic Background. Ambrym, a large basaltic volcano with a 12-km-wide caldera, is one of the most active volcanoes of the New Hebrides Arc. A thick, almost exclusively pyroclastic sequence, initially dacitic then basaltic, overlies lava flows of a pre-caldera shield volcano. The caldera was formed during a major Plinian eruption with dacitic pyroclastic flows about 1,900 years ago. Post-caldera eruptions, primarily from Marum and Benbow cones, have partially filled the caldera floor and produced lava flows that ponded on the floor or overflowed through gaps in the caldera rim. Post-caldera eruptions have also formed a series of scoria cones and maars along a fissure system oriented ENE-WSW. Eruptions have apparently occurred almost yearly during historical time from cones within the caldera or from flank vents. However, from 1850 to 1950, reporting was mostly limited to extra-caldera eruptions that would have affected local populations.
Information Contacts: John Seach, PO Box 16, Chatsworth Island, NSW, 2469, Australia (URL: http://www.volcanolive.com/); Jeff and Raine Williams, P.O. Box 729, Funkstown, MD 21734, USA.
Cotopaxi (Ecuador) — December 2002 Cite this Report
Cotopaxi
Ecuador
0.677°S, 78.436°W; summit elev. 5911 m
All times are local (unless otherwise noted)
First anomalous seismicity since 1975 begins in October 2001
The last Cotopaxi report (SEAN 01:03) described a decline in activity during December 1975. Beginning in October 2001, anomalous seismic activity was registered. Seismicity increased further during November 2001-January 2002, and at times was up to seven times the normal level (tables 1 and 2). During this period, other seismic signals were registered that were distinct from those during the 13 previous years of monitoring, including: tornillos, explosion events, bands of harmonic tremor sometimes lasting a few minutes, and deep, high-energy long-period (LP) events registered away from the volcano (at the Antisana and Guagua Pichincha stations). Seismic observations and statistics were compiled using station "VCl," located ~4 km NE of the volcano. Earthquake locations were determined using records from the seven seismic stations on different flanks of Cotopaxi, and for higher-energy events with stations of the National network.
Table 1. Monthly seismicity at Cotopaxi during 2001-2002. Data includes Total and Daily averages for long-period (LP) events, hybrid events, volcano-tectonic (VT) events, tornillo events, and all earthquakes. Courtesy IG.
| Date |
LP Total |
LP Daily Avg |
Hybrid Total |
Hybrid Daily Avg |
VT Total |
VT Daily Avg |
Tornillo Total |
Tornillo Daily Avg |
All Earthquakes Total |
All Earthquakes Daily Avg |
| Jan 2001 |
336 |
10.8 |
0 |
0.0 |
18 |
0.6 |
0 |
0.0 |
354 |
11.4 |
| Feb 2001 |
185 |
6.6 |
0 |
0.0 |
4 |
0.1 |
0 |
0.0 |
189 |
6.8 |
| Mar 2001 |
319 |
10.3 |
1 |
0.0 |
10 |
0.3 |
0 |
0.0 |
320 |
10.3 |
| Apr 2001 |
280 |
9.3 |
0 |
0.0 |
26 |
0.9 |
0 |
0.0 |
306 |
10.2 |
| May 2001 |
241 |
7.8 |
7 |
0.2 |
10 |
0.3 |
0 |
0.0 |
248 |
8.0 |
| Jun 2001 |
243 |
8.1 |
11 |
0.4 |
53 |
1.8 |
0 |
0.0 |
307 |
10.2 |
| Jul 2001 |
262 |
8.5 |
2 |
0.1 |
9 |
0.3 |
0 |
0.0 |
273 |
8.8 |
| Aug 2001 |
241 |
7.8 |
0 |
0.0 |
9 |
0.3 |
0 |
0.0 |
250 |
8.1 |
| Sep 2001 |
394 |
13.1 |
9 |
0.3 |
9 |
0.3 |
0 |
0.0 |
412 |
13.7 |
| Oct 2001 |
555 |
17.9 |
0 |
0.0 |
7 |
0.2 |
0 |
0.0 |
562 |
18.1 |
| Nov 2001 |
432 |
14.4 |
57 |
1.9 |
400 |
13.3 |
4 |
0.1 |
893 |
29.8 |
| Dec 2001 |
516 |
16.6 |
169 |
5.5 |
729 |
23.5 |
0 |
0.0 |
1423 |
45.9 |
| Jan 2002 |
595 |
19.2 |
5 |
0.2 |
363 |
11.7 |
3 |
0.1 |
966 |
31.2 |
| Feb 2002 |
532 |
19.0 |
4 |
0.1 |
157 |
5.6 |
0 |
0.0 |
693 |
24.8 |
| Mar 2002 |
504 |
16.3 |
1 |
0.0 |
191 |
6.2 |
0 |
0.0 |
696 |
22.5 |
| Apr 2002 |
310 |
10.3 |
7 |
0.2 |
63 |
2.1 |
0 |
0.0 |
380 |
12.7 |
| May 2002 |
431 |
13.9 |
8 |
0.3 |
53 |
1.7 |
0 |
0.0 |
453 |
14.6 |
| Jun 2002 |
429 |
14.3 |
41 |
1.4 |
45 |
1.5 |
3 |
0.1 |
474 |
15.8 |
| Jul 2002 |
445 |
14.4 |
181 |
5.8 |
92 |
3.0 |
2 |
0.1 |
720 |
23.2 |
| Aug 2002 |
455 |
14.7 |
91 |
2.9 |
32 |
1.0 |
12 |
0.4 |
590 |
19.0 |
| Sep 2002 |
509 |
17.0 |
184 |
6.1 |
140 |
4.7 |
19 |
0.6 |
852 |
28.4 |
| Oct 2002 |
322 |
10.4 |
219 |
7.1 |
62 |
2.0 |
13 |
0.4 |
616 |
19.9 |
| Nov 2002 |
295 |
9.8 |
142 |
4.7 |
64 |
2.1 |
2 |
0.1 |
503 |
16.8 |
| Dec 2002 |
233 |
9.0 |
120 |
4.6 |
48 |
1.5 |
1 |
0.0 |
402 |
16.1 |
Table 2. Comparison of average seismicity at Cotopaxi during 2001 and 2002. Courtesy IG.
| Year |
Daily average |
Monthly average |
Total |
| 2001 |
15.4 |
461.4 |
5537 |
| 2002 |
20.4 |
612.1 |
7345 |
On 5 and 29 January 2002, two seismic clusters lasted an average of 2 hours and were composed mainly of LP and VT earthquakes. Most of the earthquakes were located at depths of 1-10 km beneath the summit. On 5 and 13 January small fumaroles were reported in the crater, and visible defrosting occurred on the upper E flank. A visit to the summit on 13 January revealed increased fumarolic activity compared to previous months. On 19 and 20 January observers reported gray plumes rising as high as 1,000 m.
During February and March activity diminished, and no seismic clusters were registered. Most of the earthquakes were located 1-10 km beneath the volcano. On 5 February roaring noises were heard from Mulaló and the refuges located on the flanks of the volcano. Strong fumarolic activity was also reported. On 6 February steam plumes rose ~300 m above the summit. On 27 February a small steam plume was reported exiting from the NW side of the crater. On 7 and 10 March small steam plumes originated from the W side of the crater. On 28 March harmonic tremor lasted for ~10 minutes.
Activity remained low during April-June. On 17 April a band of harmonic tremor lasted ~6 minutes with a maximum frequency of 4.3 Hz. During the first days of April small steam plumes were reported. During May LP earthquakes lasted up to a minute and saturated the seismometer for several seconds. On 20 May a seismic cluster of LP earthquakes lasted ~2 hours. On 8 and 14 May a white steam plume from the NE side of the volcano reached up to 200 m high. During June VT events mostly occurred ~10 km N of the crater. On 30 June a band of harmonic tremor lasted ~7 minutes with a maximum frequency of 1.7-5.2 Hz. Visits to the summit on 1 and 2 June revealed that fumarolic activity had diminished ~40% since January.
During July seismicity was at a moderate level with respect to the rest of 2002. During the first days of the month a series of LP events were registered that were large enough to be detected at distant stations, such as Antisana and Guagua Pichincha. The earthquakes had maximum frequencies of ~2.1 Hz and were generally 1-2 km beneath the summit. However, some events were located at depths of ~10 km. On 18 July at 2000 a band of low-frequency tremor lasted ~4 minutes. About 5 hours later a seismic cluster began that lasted for ~8 hours. The cluster consisted of ~110 total events, mostly hybrid (HB) and volcano-tectonic (VT). The earthquakes were located 1-4 km beneath the summit, and 2 LP events were located ~10 km deep.
Visitors to the summit on 6 July reported fumarolic activity in the zone of Yanasacha, a slight sulfur smell on the NE side, and noise generated by an avalanche on the E side. At the end of July reports indicated defrosting in the W zone. During August moderate seismicity was dominated by LP events at a depth of ~10 km.
Seismicity was again high in September 2002. A small cluster of VT earthquakes on 15 September lasted ~7 hours. During the first days of the month a visit to the crater revealed new fumaroles in the E and S zones. Defrosting continued in the W zone and left 40% of the W wall open.
During October seismic activity was low but the number of hybrid events increased compared to the previous months. Tectonic events were registered in the S and N zones up to ~7 km from the summit. Deep LP events decreased by ~50% compared to previous months.
Seismicity remained low during November and December. Less than 10% of VT events were registered in the N sector. No fumarolic or other surface activity was observed. During December seismic events were located 1-7 km beneath the summit. On 7 December people in Yanahurco reported dark brown plumes rising from the crater.
Seismicity since 1989 clearly shows an increase in recent months (figure 1). The 2001 seismic events were registered at 1-10 km beneath the volcano, but ~90% occurred at 2-4 km and showed little migration. The 2002 activity was variable, from a high of 966 events in January to a low of 420 events in April. Mostly LP events occurred with some VT events during the first half of the year, and later mostly LP events with hybrids during the second half of the year. On the basis of 2002 seismic activity, a new injection of magma did not occur, and the anomalies in July and September were the result of the movement of gas from magma intrusion that occurred during the last months of 2001.
Geologic Background. The symmetrical, glacier-covered, Cotopaxi stratovolcano is Ecuador's most well-known volcano and one of its most active. The steep-sided cone is capped by nested summit craters, the largest of which is about 550 x 800 m in diameter. Deep valleys scoured by lahars radiate from the summit of the andesitic volcano, and large andesitic lava flows extend to its base. The modern edifice has been constructed since a major collapse sometime prior to about 5,000 years ago. Pyroclastic flows (often confused in historical accounts with lava flows) have accompanied many explosive eruptions, and lahars have frequently devastated adjacent valleys. Strong eruptions took place in 1744, 1768, and 1877. Pyroclastic flows descended all sides of the volcano in 1877, and lahars traveled more than 100 km into the Pacific Ocean and western Amazon basin. Smaller eruptions have been frequent since that time.
Information Contacts: Geophysical Institute (IG), Escuela Politécnica Nacional, Apartado 17-01-2759, Quito, Ecuador.
Etna
Italy
37.748°N, 14.999°E; summit elev. 3357 m
All times are local (unless otherwise noted)
Late October 2002 earthquake swarm signals start of new flank eruption
On 26 October 2002 at 2225 a swarm of earthquakes was recorded by the seismic network of the Catania Section of the National Institute of Geophysics and Volcanology (INGV-CT). This signaled the start of a new flank eruption that has formed fissures on the N and S sides of the volcano.
The lava supply from the main vents were cut off by 3 November. At that time both the N and S fissues stopped producing lava flows, although the S fissure continued to discharge fire fountains. After that, 20 m of downslope movement was observed at the most advanced flow front near Piano Provenzana on 5 November. This late movement was caused by channel emptying, and occurred when lava emerging at the main vent, ~5 km upstream, was completely crusted over. No further advancement of the lava flows was observed on the S or N flanks of the volcano after this date. However, while explosive and effusive activity stopped at the N fissure by 5 November, as of 11 November fire fountaining continued at the S vent located at 2,750 m elevation, near Torre del Filosofo. All data (gas emission, volcanic tremor, composition of the ash) suggested a steady state at this vent. Ash fallout caused intermittent disruption at the Catania airport and damage to buildings.
The eruption continued into December 2002. Lava flows and Strombolian activity continued on the S flank from vents at 2,750 m elevation. Ash emission from the 2,750 m cinder cone significantly declined on 17 December, allowing the local airport of Catania to reopen.
The two vents, which opened at the SE base of the 2,750 m cinder cone on 9-10 December, fed four major lava flows spreading S and SW. A lava flow spreading S on 13 December approached the Rifugio Sapienza and eventually crossed a road on 17 December. An overflow from the main lava channel covered a building and caused a strong explosion in the Rifugio Sapienza area during the night of 17 December, injuring 32 people. The explosion was not directly caused by the eruption, but by vaporization of oil or water inside the building while it was covered by the expanding lava flow. The effusion rate from the two vents gradually decreased, eventually causing the closure of the western vent and then the lack of supply to the lava flows spreading SW towards Monte Nero.
A new vent opened on 17 December at the S base of the 2,750 m cinder cone, a few meters W of the previous vents. A lava flow soon started from this vent, spreading SW towards Monte Nero. The new vent cut supply to the flows expanding S towards Rifugio Sapienza and formed a fan of thin lava flows spreading S, SSW and SW. The lower lava output produced shorter flows, which spread up to 2.5 km from the vent, without threatening the tourist facilities at Rifugio Sapienza. Lava flows spreading from the 17 December vent slowed down and crusted over on 22 December, when a new vent opened at the SW base of the 2,750 m cinder cone. A flow, again directed SW towards Monte Nero, originated from this vent and was expanding in this direction on 23 December.
SO2 emission measured daily during the eruption had significantly decreased as of 1 December, when the previous values of about 20,000 tons per day decreased to about 7,000 tons per day (figure 101). The lower gas output, the decrease in effusion rate, and the lower emission of ash from the summit, suggested a declining stage of the eruption.
Updated maps of the lava flows, and reports of the eruptive activity, gas emission and ash composition (in Italian), can be found on the INGV-CT website.
Geologic Background. Mount Etna, towering above Catania on the island of Sicily, has one of the world's longest documented records of volcanism, dating back to 1500 BCE. Historical lava flows of basaltic composition cover much of the surface of this massive volcano, whose edifice is the highest and most voluminous in Italy. The Mongibello stratovolcano, truncated by several small calderas, was constructed during the late Pleistocene and Holocene over an older shield volcano. The most prominent morphological feature of Etna is the Valle del Bove, a 5 x 10 km caldera open to the east. Two styles of eruptive activity typically occur, sometimes simultaneously. Persistent explosive eruptions, sometimes with minor lava emissions, take place from one or more summit craters. Flank vents, typically with higher effusion rates, are less frequently active and originate from fissures that open progressively downward from near the summit (usually accompanied by Strombolian eruptions at the upper end). Cinder cones are commonly constructed over the vents of lower-flank lava flows. Lava flows extend to the foot of the volcano on all sides and have reached the sea over a broad area on the SE flank.
Information Contacts: Sonia Calvari, Istituto Nazionale di Geofisica e Vulcanologia (INGV), Sezione di Catania, Piazza Roma 2, 95123 Catania (URL: http://www.ct.ingv.it/).
Karangetang (Indonesia) — December 2002 Cite this Report
Karangetang
Indonesia
2.781°N, 125.407°E; summit elev. 1797 m
All times are local (unless otherwise noted)
500-m plumes and ~ 1.5-km glowing lava avalanche; Alert Level increased
During September-29 December 2002, seismicity at Karangetang was dominated by emission, multiphase and tectonic earthquakes (table 6). The S crater nearly always issued "white, thin ash plumes" that reached up to 500 m above the rim. At night, a light plume was visible rising 25-100 m. Loud noises were heard frequently, and the N crater emitted a "thin white ash plume" to 50 m. No ashfall was reported.
Table 6. Earthquakes recorded at Karangetang during 9 September-29 December 2002. No reports were issued for Karangetang during 25 November-22 December. Courtesy VSI.
| Date |
Deep volcanic (A-type) |
Shallow volcanic (B-type) |
Explosion |
Multiphase |
Emission |
Tectonic |
Avalanche |
| 09 Sep-15 Sep 2002 |
14 |
24 |
0 |
94 |
299 |
46 |
-- |
| 16 Sep-22 Sep 2002 |
28 |
27 |
0 |
82 |
246 |
39 |
-- |
| 23 Sep-29 Sep 2002 |
22 |
26 |
1 |
20 |
116 |
75 |
-- |
| 30 Sep-06 Oct 2002 |
14 |
4 |
0 |
38 |
88 |
54 |
98 |
| 07 Oct-13 Oct 2002 |
19 |
13 |
-- |
30 |
67 |
89 |
43 |
| 14 Oct-20 Oct 2002 |
7 |
22 |
1 |
30 |
146 |
34 |
10 |
| 21 Oct-27 Oct 2002 |
12 |
34 |
-- |
23 |
114 |
65 |
-- |
| 28 Oct-03 Nov 2002 |
18 |
154 |
-- |
147 |
49 |
24 |
-- |
| 04 Nov-10 Nov 2002 |
15 |
29 |
-- |
90 |
21 |
69 |
-- |
| 11 Nov-18 Nov 2002 |
12 |
40 |
1 |
75 |
28 |
70 |
-- |
| 19 Nov-24 Nov 2002 |
15 |
116 |
-- |
94 |
1 |
46 |
-- |
| 23 Dec-29 Dec 2002 |
10 |
26 |
1 |
168 |
17 |
25 |
-- |
During 9 September-13 October glowing avalanches flowed 25-250 m toward Nanitu river (West Siau), and toward Beha river as far as 400 m from the crater rim. By the week of 14-20 October, the lava avalanches extended ~1.5 km toward the Nanitu river, 1.0 km toward the Beha river (West Siau), and 750 m toward the Kahetang river.
On 12 September loud noises were accompanied by a 50-m-high gray ash plume. During 5-6 October, there were 2 volcanic tremor events. On 19 October at 1759 an explosion ejected glowing material to a height of 500 m; it landed inside the crater. A gray-black ash plume reached up to 750 m, drifted to the N, and fell on the sea.
Activity decreased during November, and loud sounds were rarely heard. On 15 November at 0248 an ash explosion produced glowing material up to ~200 m that fell around the crater. Some of the material entered the Batang, Beha, and Keting rivers, located 300-350 m away. Ash fell around Salili, Beong, Hiu, Ondong, Pehe, and Paniki villages to the SW. The Alert Level remained at level 3 through at least 29 December (on a scale of 1 to 4).
Geologic Background. Karangetang (Api Siau) volcano lies at the northern end of the island of Siau, about 125 km NNE of the NE-most point of Sulawesi. The stratovolcano contains five summit craters along a N-S line. It is one of Indonesia's most active volcanoes, with more than 40 eruptions recorded since 1675 and many additional small eruptions that were not documented (Neumann van Padang, 1951). Twentieth-century eruptions have included frequent explosive activity sometimes accompanied by pyroclastic flows and lahars. Lava dome growth has occurred in the summit craters; collapse of lava flow fronts have produced pyroclastic flows.
Information Contacts: Volcanological Survey of Indonesia (VSI), Jalan Diponegoro No. 57, Bandung 40122, Indonesia (URL: http://www.vsi.esdm.go.id/).
Kerinci (Indonesia) — December 2002 Cite this Report
Kerinci
Indonesia
1.697°S, 101.264°E; summit elev. 3800 m
All times are local (unless otherwise noted)
Continuous emissions through December 2002
Emissions were continuous through at least late October 2002 (table 4). During most of the period 9 September-27 October a "white-thin ash plume" rose 50-400 m and drifted toward the W or SW. No ashfall was reported. Kerinci remained at Alert Level 2 (on a scale of 1-4). No further reports were issued during 2002.
Table 4. Earthquakes registered at Kerinci during 9 September-27 October 2002. Courtesy VSI.
| Date |
B-type volcanic |
Emission |
Tectonic |
| 09 Sep-15 Sep 2002 |
3 |
Continuous |
7 |
| 16 Sep-22 Sep 2002 |
4 |
Continuous |
8 |
| 23 Sep-29 Sep 2002 |
1 |
Continuous |
5 |
| 30 Sep-06 Oct 2002 |
1 |
Continuous |
4 |
| 07 Oct-13 Oct 2002 |
2 |
Continuous |
16 |
| 14 Oct-20 Oct 2002 |
-- |
Continuous |
2 |
| 21 Oct-27 Oct 2002 |
-- |
Continuous |
-- |
Geologic Background. Gunung Kerinci in central Sumatra forms Indonesia's highest volcano and is one of the most active in Sumatra. It is capped by an unvegetated young summit cone that was constructed NE of an older crater remnant. There is a deep 600-m-wide summit crater often partially filled by a small crater lake that lies on the NE crater floor, opposite the SW-rim summit. The massive 13 x 25 km wide volcano towers 2400-3300 m above surrounding plains and is elongated in a N-S direction. Frequently active, Kerinci has been the source of numerous moderate explosive eruptions since its first recorded eruption in 1838.
Information Contacts: Volcanological Survey of Indonesia (VSI), Jalan Diponegoro No. 57, Bandung 40122, Indonesia (URL: http://www.vsi.esdm.go.id/).
Krakatau (Indonesia) — December 2002 Cite this Report
Krakatau
Indonesia
6.1009°S, 105.4233°E; summit elev. 285 m
All times are local (unless otherwise noted)
Seismicity dominated by volcanic earthquakes through at least December 2002
During 9 September through at least late December 2002, seismicity at Krakatau was dominated by A-and B-type volcanic earthquakes (table 2). Throughout the report period, clouds obscured the view of the summit. Krakatau remained at Alert Level 2.
Table 2. Earthquakes registered at Krakatau during 9 September-29 December 2002. No data were available during 16-29 September. Courtesy VSI.
| Date |
A-type volcanic |
B-type volcanic |
Tectonic |
| 09 Sep-15 Sep 2002 |
2 |
6 |
3 |
| 30 Sep-06 Oct 2002 |
8 |
31 |
6 |
| 07 Oct-13 Oct 2002 |
30 |
109 |
6 |
| 14 Oct-20 Oct 2002 |
18 |
64 |
3 |
| 21 Oct-27 Oct 2002 |
7 |
55 |
5 |
| 28 Oct-03 Nov 2002 |
8 |
54 |
11 |
| 04 Nov-10 Nov 2002 |
28 |
56 |
5 |
| 11 Nov-18 Nov 2002 |
2 |
31 |
5 |
| 02 Dec-08 Dec 2002 |
16 |
50 |
5 |
| 09 Dec-15 Dec 2002 |
13 |
53 |
13 |
| 16 Dec-22 Dec 2002 |
6 |
32 |
1 |
| 23 Dec-29 Dec 2002 |
11 |
59 |
2 |
Geologic Background. The renowned Krakatau (frequently mis-named as Krakatoa) volcano lies in the Sunda Strait between Java and Sumatra. Collapse of an older edifice, perhaps in 416 or 535 CE, formed a 7-km-wide caldera. Remnants of that volcano are preserved in Verlaten and Lang Islands; subsequently the Rakata, Danan, and Perbuwatan cones were formed, coalescing to create the pre-1883 Krakatau Island. Caldera collapse during the catastrophic 1883 eruption destroyed Danan and Perbuwatan, and left only a remnant of Rakata. This eruption caused more than 36,000 fatalities, most as a result of tsunamis that swept the adjacent coastlines of Sumatra and Java. Pyroclastic surges traveled 40 km across the Sunda Strait and reached the Sumatra coast. After a quiescence of less than a half century, the post-collapse cone of Anak Krakatau (Child of Krakatau) was constructed within the 1883 caldera at a point between the former Danan and Perbuwatan cones. Anak Krakatau has been the site of frequent eruptions since 1927.
Information Contacts: Volcanological Survey of Indonesia (VSI), Jalan Diponegoro No. 57, Bandung 40122, Indonesia (URL: http://www.vsi.esdm.go.id/).
Lokon-Empung (Indonesia) — December 2002 Cite this Report
Lokon-Empung
Indonesia
1.3644°N, 124.7992°E; summit elev. 1580 m
All times are local (unless otherwise noted)
Higher-than-normal activity continues through at least December 2002
Higher-than-normal activity continued at Lokon-Empung during August-December 2002. Throughout the report period a "white-thin ash plume" rose 25-75 m above the crater rim. No ashfall was reported. Seismicity was dominated by shallow volcanic and tectonic earthquakes (table 4).
Table 4. Earthquakes recorded at Lokon during 5 August-29 December 2002. No reports were issued during 11 November-22 December. Courtesy VSI.
| Date |
Deep volcanic (A-type) |
Shallow volcanic (B-type) |
Tectonic |
| 05 Aug-11 Aug 2002 |
19 |
42 |
32 |
| 12 Aug-18 Aug 2002 |
9 |
11 |
35 |
| 19 Aug-25 Aug 2002 |
14 |
51 |
42 |
| 26 Aug-01 Sep 2002 |
19 |
53 |
28 |
| 02 Sep-08 Sep 2002 |
14 |
39 |
32 |
| 09 Sep-15 Sep 2002 |
18 |
50 |
33 |
| 16 Sep-22 Sep 2002 |
16 |
37 |
39 |
| 23 Sep-29 Sep 2002 |
2 |
18 |
46 |
| 30 Sep-06 Oct 2002 |
9 |
17 |
39 |
| 07 Oct-13 Oct 2002 |
5 |
7 |
35 |
| 14 Oct-20 Oct 2002 |
5 |
4 |
29 |
| 21 Oct-27 Oct 2002 |
6 |
25 |
44 |
| 28 Oct-03 Nov 2002 |
0 |
1 |
35 |
| 04 Nov-10 Nov 2002 |
1 |
4 |
26 |
| 23 Dec-29 Dec 2002 |
29 |
74 |
31 |
During the week of 4-10 November, the hazard status was reduced from Alert Level 2 to 1 (on a scale of 1-4). On 23 December a "white-thick ash plume" rose 100-250 m over Tompaluan crater. No ashfall was reported. [A later report did note ashfall.] The same day, volcanic tremor with an amplitude of 0.5-2 mm occurred. A total of 42 emissions were reported during 23-29 December. The Alert Level returned to 2 by the end of the report period.
Geologic Background. The Lokong-Empung volcanic complex, rising above the plain of Tondano in North Sulawesi, includes four peaks and an active crater. Lokon, the highest peak, has a flat craterless top. The morphologically younger Empung cone 2 km NE has a 400-m-wide, 150-m-deep crater that erupted last in the 18th century. A ridge extending 3 km WNW from Lokon includes the Tatawiran and Tetempangan peaks. All eruptions since 1829 have originated from Tompaluan, a 150 x 250 m crater in the saddle between Lokon and Empung. These eruptions have primarily produced small-to-moderate ash plumes that sometimes damaged croplands and houses, but lava-dome growth and pyroclastic flows have also occurred.
Information Contacts: Volcanological Survey of Indonesia (VSI), Jalan Diponegoro No. 57, Bandung 40122, Indonesia (URL: http://www.vsi.esdm.go.id/).
Lopevi (Vanuatu) — December 2002 Cite this Report
Lopevi
Vanuatu
16.507°S, 168.346°E; summit elev. 1413 m
All times are local (unless otherwise noted)
Anomalous SO2 emissions detected by satellite in December 2002 and January 2003
Satellite data interpreted by Simon Carn indicate that anomalous degassing may have begun from a volcano in Vanuatu in mid-December 2002. SO2 signals were noted in data from both the Global Ozone Monitoring Experiment (GOME) on the ERS-2 satellite and the Earth Probe Total Ozone Mapping Spectrometer (TOMS). Although GOME is more sensitive to SO2 than TOMS, its spatial resolution is very poor, so distinguishing the source of emissions between Ambrym and Lopevi is impossible using the available imagery.
However, on 14 December John Seach noted a strong sulfurous smell on the W side of Ambrym caldera. The wind was blowing from the direction of Lopevi at the time, and white emissions were noticed on Lopevi's active crater on the NW flank of the volcano. Seach did not note unusual emissions from Ambrym during his 11-15 December 2002 visit, so the editors are attributing this activity to Lopevi unless other data are found that identify Ambrym as the source.
GOME data indicate SO2 emissions over Vanuatu on 13, 19, 22, and 25 December 2002, then again during 4, 7, 11, 14, 17, and 20 January 2003. Data are only collected every third day, so degassing could be continuous, with a possible lull in late December. After 11 January GOME signals became very weak. TOMS data also indicated SO2 originating from the region on 19, 21, and 25 December, and again during 4, 5, 6, 8, 9, 10, 11, and 12 January, with nothing really evident since then. On a couple of days, particularly 4 January, the anomaly seen in TOMS imagery seemed to be originating from Ambrym.
The SO2 mass detected by TOMS immediately E of Lopevi and Ambrym on 8 January was estimated at less than 5,000 tons, a low value. Combining the two datasets indicates that the most significant SO2 emissions occurred around 25 December 2002 and 4-11 January 2003. After mid-January the activity seemed to be tapering off.
Geologic Background. The small 7-km-wide conical island of Lopevi, known locally as Vanei Vollohulu, is one of Vanuatu's most active volcanoes. A small summit crater containing a cinder cone is breached to the NW and tops an older cone that is rimmed by the remnant of a larger crater. The basaltic-to-andesitic volcano has been active during historical time at both summit and flank vents, primarily along a NW-SE-trending fissure that cuts across the island, producing moderate explosive eruptions and lava flows that reached the coast. Historical eruptions at the 1413-m-high volcano date back to the mid-19th century. The island was evacuated following major eruptions in 1939 and 1960. The latter eruption, from a NW-flank fissure vent, produced a pyroclastic flow that swept to the sea and a lava flow that formed a new peninsula on the western coast.
Information Contacts: Simon A. Carn, TOMS Volcanic Emissions Group, Joint Center for Earth Systems Technology (NASA/UMBC), University of Maryland Baltimore County, 1000 Hilltop Circle, Baltimore, MD 21250, USA (URL: https://jcet.umbc.edu/); John Seach, PO Box 16, Chatsworth Island, NSW 2469, Australia (URL: http://www.volcanolive.com/).
McDonald Islands (Australia) — December 2002 Cite this Report
McDonald Islands
Australia
53.03°S, 72.6°E; summit elev. 230 m
All times are local (unless otherwise noted)
Significant morphological changes due to eruptive activity
Accounts from ship-based observers and satellite imagery have revealed significant morphological changes to McDonald Island due to volcanic activity prior to 6 November 2001. A comparison of November 2001 satellite imagery with 1980 aerial photographs was described in AUSGEO News 68 (December 2002). Tourist reports were published in the Australian Antarctic Division's Antarctic Non-government Activity News (ANAN), no. 89 (January 2003). Geoscience Australia's National Mapping reports the elevation of McDonald Island as 230 m, but the activity described below has most likely increased this value.
A photograph taken on 9 November 2000 (BGVN 26:02) was similar to previous photos and descriptions. In addition, thermal alerts for nearby Heard Island occurred frequently in November and December 2000, an indication not only of eruptive activity there, but clear weather during which any significant activity at McDonald would likely have been detected in infrared satellite imagery. Combined, these observations place the eruptive activity after 9 November 2000, and probably after 30 December 2000.
Analysis of 6 November 2001 satellite imagery. A routine check of Australia's maritime boundaries in the Southern Ocean by Geoscience Australia showed that the McDonald Islands had doubled in size, and it appears that the separate islands of McDonald Island and Flat Island are now one. Geoscience Australia's Bill Hirst was comparing an aerial photograph of the McDonald Islands taken on 11 March 1980, with satellite imagery from Landsat 7 EGM data acquired on 6 November 2001, when he noticed that the islands had changed shape (figure 6). The islands earlier combined area of 1.13 km2 is now thought to have changed to 2.45 km2. Some features have disappeared.
The senior surveyor onshore during a 6-day visit in 1980 was Geoscience Australia's John Manning, who named many features of the McDonald Islands. He noted that "Thelander Point doesn't appear to be an appropriate name now, Williams Bay seems to be filled in, and The Needle may be gone . . . Windward Point is no longer a point because there are about 400 m of new land in front of it. The tumultuous bay I called Cauldron is now full of rock, and Flat Island is probably joined to McDonald Island by a shingle comprising gravel and pumice." Other new features appear to be a volcanic hill and a spit to the E of the island similar to one on Heard Island. Macaroni Hill was once the highest point.
Observations in late November 2002. Experienced observers noted changes to the McDonald Island group in late November 2002 from on board the Akademic Shokalskiy, which was visiting the Heard Island region on a voyage organized by the New Zealand-based tour company Heritage Expeditions. A comparison of old and new photographs of the area shows that the N part of the island is much higher than before, and 75% of the land area that is now there may be completely new. During the last five years Australian national program vessels that have observed the McDonald group have reported seeing steam issuing from vents at various locations.
Three of the passengers on the Akademic Shokalskiy had worked on Heard Island in the 1950's and 1960's, and one of them, Graham Budd, was one of the first two people to set foot on McDonald Island, in 1971. When the ship was travelling towards Heard Island en route from Crozet early on the morning of 26 November, Budd noticed the changed profile of the McDonald islands and expedition leader Rodney Russ decided to take a closer look after the end of the visit to Heard Island. It was not possible to sail too close to the islands because the water around them is uncharted. Under Australian management plans for McDonald Island, landings cannot be made there without a permit and only then for "compelling scientific reasons."
On the second sail past the island, passengers observed steaming slopes and "two types of lava dome." The highest part of the islands was now at the N end, not in the S at Maxwell Hill as it had been previously. Analysis of enlarged digital photographs taken by passengers indicates that considerable sedimentation has occurred along the coastline, such that the formerly separate Flat Island is now joined to the main island. It also appears that several meters of ash have blanketed the N half of McDonald Island, and Macaroni Hill at its N end has disappeared. A low-lying spit and reef now extend over 1 km E of McDonald Island.
Although it is not certain when the activity occurred, wildlife did not appear to have been affected. Penguins were still nesting up to the top of Maxwell Hill and on ash-covered remnants of the old land inshore of the new spit. The birds appear to have deserted Flat Island. There were a large number of penguins and seals on the beaches, and several dozen fur seals swimming offshore.
The two geologists on the voyage, Australian Jon Stephenson and New Zealander Margaret Bradshaw, believe that a scientific visit should be made so that the sequence of the new volcanic events and the composition of the lavas can be determined. The Australian national program currently plans to conduct a scientific program on Heard Island during the 2003-04 austral summer, but currently has no plans to do land-based research on McDonald Island.
MODVOLC Thermal Alerts. Following the distribution of the above reports via the Volcano Listserv, David Rothery and Diego Coppola (The Open University) searched for "thermal alerts" at McDonald Island using the MODIS Thermal Alerts website (http://modis.higp.hawaii.edu/). This system is the first truly global high-temperature thermal monitoring system. It is capable of detecting and documenting changes in active lava flows, lav domes, lava lakes, strongly incandescent vents, and hot pyroclastic flows. No alert is likely to be triggered by an ash cloud.
As described by Flynn et al. (2001) and Wright et al. (2002), the MODIS Thermal Alerts website provides a series of maps updated every 24 hours to show "thermal alerts" based on night-time (approximately 2230 local time) infrared data from a 1-km-resolution instrument called MODIS that is carried by NASA's Terra and Aqua satellites. Thermal alerts are based on an "alert ratio" (3.9 µm radiance - 12 µm radiance) / (3.9 µm radiance + 12 µm radiance), and an alert is triggered whenever this ratio has a value more positive than -0.8. This threshold value was chosen empirically by inspection of images containing known volcanic sites at high temperature, and is the most negative value that avoids numerous false alarms. There are also some daytime (approximately 1030 local time) alerts that are based on the same algorithm but incorporating a correction for estimated solar reflection and a more stringent threshold whereby the alert ratio is required to be more positive than -0.6 in order to trigger an alert.
Thermal alert data are available for the region including McDonald Island from 13 May 2000 onwards (with a gap 26 May-2 June 2000). No thermal alert occurred at McDonald Island from 13 May 2000 through 30 January 2003. This null result does not prove that the activity must have occurred before 13 May 2000, because MODIS cannot see through cloud, which is common in that region. However, there were multiple thermal alerts for nearby Heard Island during the same period (24 May; 3, 5, and 6 June; 25 September; 29 October; 5, 15, 19, and 24 November; 16, 17, 26, and 30 December 2000; 2 February 2001). Had McDonald been active on the same dates, it is highly likely that this activity would have been detected at least once.
Climate and Biology. The following is taken from the AUSGEO News report. The McDonald Islands are remote, and people have landed on the islands only twice since a British sealer sighted them in November 1833. The islands have cliff-lined coasts and are surrounded by rocky shoals and reefs that are treacherous for boats and landing parties. They lie in stormy seas where temperate water from the Indian Ocean meets icy Antarctic water. Most days are cloudy, making it very difficult to obtain satellite imagery and photographs of the islands. Maximum temperatures average 3°C, and wind gusts can reach 210 km/hour. Two Australian scientists looking for fur seals made the first landing in 1970, a 20-minute visit, by helicopter from the French Antarctic ship Gallieni. The second landing, in March 1980, was from the Cape Pillar, chartered by National Mapping to survey the Heard Island-Kerguelen region. The small shore party, which included a botanist, biologist, geologist, and surveyor, landed by helicopter and amphibious vehicle. They stayed ashore for six days while the ship sailed its survey lines.
The McDonald Islands were designated a World Heritage site in December 1997 because of their pristine sub-Antarctic ecosystems and geological activity. Local waters are teaming with Patagonian toothfish, Mackerel icefish, Grey rockcod, and Unicorn icefish. Colonies of Macaroni and Gentoo penguins breed and feed from these islands.
References. Flynn, L.P., Wright R., Garbeil, H., Harris, A.J.L., and Pilger, E., 2001, A global thermal alert system using MODIS: initial results from 2000-2001: Advances in Environmental Monitoring and Modelling, no. 3, Monitoring volcanic hotspots using thermal remote sensing, edited by Harris, A.J.L., Wooster, M.J. and Rothery, D. A. (Http://www.kcl.ac.uk/ kis/schools/hums/geog/advemm/vol1no3.html).
Wright, R., Flynn, L., Garbeil, H., Harris, A., and Pilger, E., 2002, Automated volcanic eruption detection using MODIS: Remote Sensing of Environment, v. 82, p. 135-155.
Geologic Background. Historical eruptions have greatly modified the morphology of the McDonald Islands, located on the Kerguelen Plateau about 75 km W of Heard Island. The largest island, McDonald, is composed of a layered phonolitic tuff plateau cut by phonolitic dikes and lava domes. A possible nearby active submarine center was inferred from phonolitic pumice that washed up on Heard Island in 1992. Volcanic plumes were observed in December 1996 and January 1997 from McDonald Island. During March 1997 the crew of a vessel that sailed near the island noted vigorous steaming from a vent on the N side of the island along with possible pyroclastic deposits and lava flows. A satellite image taken in November 2001 showed the island to have more than doubled in area since previous reported observations in November 2000. The high point of the island group had shifted to the McDonald's N end, which had merged with Flat Island.
Information Contacts: Bruce Hull, Senior Environment Officer, Environmental Management & Audit Unit, Australian Antarctic Division, Environment Australia, Channel Highway, Kingston, Tasmania 7050, Australia (URL: http://www.antarctica.gov.au/environment); AUSGEO News and National Mapping, Geoscience Australia, GPO Box 378, Canberra, ACT 2601, Australia (URL: http://www.ga.gov.au/); David A. Rothery and Diego Coppola, Department of Earth Sciences, The Open University, Milton Keynes MK 6AA, United Kingdom.
Pinatubo (Philippines) — December 2002 Cite this Report
Pinatubo
Philippines
15.13°N, 120.35°E; summit elev. 1486 m
All times are local (unless otherwise noted)
Likely 2001 overflow controled by cross-rim trenching
Pinatubo's catastrophic 1991 eruption left the volcano with a 2.5-km-wide summit caldera that eventually came to contain a lake (table 8). During 2001 a crisis occurred as the lake's surface neared the low point on the caldera's rim. PHIVOLCS provided a detailed report on trenching and release of lake water to avoid catastrophic breakout of the crater lake. The report that is summarized here was authored and contributed by Ma. Antonia V. Bornas and the Quick Response Team. The brief version given here omits the lengthy list of Team members as well as several figures and the references.
Table 8. Pinatubo crater-lake-water surface level through time and computed monthly and average lake-rise increments. See the original report for data sources. Courtesy PHIVOLCS.
| Date |
Elevation |
Maraunot freeboard |
Monthly average |
Cumulative monthly average |
Annual average |
| June 1991 |
780.0 |
180.00 |
-- |
-- |
-- |
| June 1995 |
830.0 |
130.00 |
1.042 |
-- |
12.50 |
| June 1997 |
855.0 |
105.00 |
1.042 |
2.083 |
12.50 |
| 07 May 1998 |
915.0 |
45.00 |
5.455 |
7.538 |
65.45 |
| 27 Apr 1999 |
933.0 |
27.00 |
1.589 |
9.127 |
19.06 |
| 10 May 2000 |
942.0 |
18.00 |
0.726 |
9.853 |
8.72 |
| 28 Jun 2000 |
944.0 |
16.00 |
1.250 |
11.103 |
-- |
| 05 Aug 2000 |
945.7 |
14.30 |
1.339 |
12.442 |
-- |
| 16 Aug 2000 |
945.9 |
14.10 |
0.541 |
12.982 |
-- |
| 16 Sep 2000 |
948.4 |
11.60 |
2.500 |
15.482 |
-- |
| 13 Oct 2000 |
948.7 |
11.35 |
0.278 |
15.760 |
-- |
| 23 Nov 2000 |
949.2 |
10.78 |
0.432 |
16.192 |
-- |
| 27 Dec 2000 |
949.7 |
10.33 |
0.500 |
16.692 |
-- |
| 27 Jun 2001 |
953.5 |
6.50 |
0.638 |
17.330 |
-- |
| 11 Jul 2001 |
955.0 |
5.00 |
1.327 |
18.657 |
15.17 |
| Average |
-- |
-- |
1.166 |
-- |
13.23 |
Mount Pinatubo's summit caldera lake surface rose 40 m between May 1998 and July 2001. By July 2001 lake water approached the caldera rim's lowest point, the Maraunot Notch (~960 m elevation). Its surface then stood at 955 m elevation, 5 m below the notch.
The record of the crater lake's rise implied overtopping of Maraunot Notch in the last quarter of 2001. A breach at Maraunot could lead to rapid escape of lake water into an area of abundant unconsolidated pyroclastic deposits (figure 35). Such an event would threaten upriver towns as well as the larger Botolan, Zambales (population ~40,000).
The beheaded upper Maraunot river sits on the NW flank (figure 36) and flows 15 km NW into the Balin-Baquero river. Lahars have long threatened to inundate Botolan town proper. As with the 1991 pyroclastic flows, lahars obliterated villages in the Balin-Baquero and Bucao valleys (e.g. Villar, Burgos, and Poonbato).
Notch and dam characteristics. The valley of the Maraunot Notch contains 150-m-high walls composed of dome rocks and lithified block-and-ash deposits, cut by steep NW- and E-trending faults. Dome rocks also crop out within the first kilometer-long reach of the Maraunot channel and are inferred to form its bedrock. Less competent deposits fill the valley floor and edge off abruptly at the crater, damming the crater lake. This dam is approximately 85 m wide at the edge or crest but narrows as it slopes 8° down-valley to its toe at a prominence of dome rock 70 m away and 10 m below the crest (the nose).
Comprising the dam are a lower pre-1991 terrace of three boulder-rich breccia units and an upper sequence of 1991 deposits. Pre-1991 breccia units are poorly indurated and contain dense dacite-andesite clasts (median diameter, 10-15 cm) in coarse (B1) or fine (B2) ash or coarse sand (B3) matrix. Exposures of the dam in 1998 indicated that pre-1991 breccia may be as much as 14 m thick at the crest. The units also occur as in-channel terraces along the first 700-m reach of the Maraunot River. An overlying 1991 eruption sequence also occurs. It is unconsolidated and up to several meters thick, but has been gullied down to a meter thick along the channel thalweg, creating a 5 m-wide natural spillway at the dam's axis. Thus, unconsolidated 1991 eruption deposits at the dam's upper part left it vulnerable to rapid erosion and possible catastrophic breach.
A potential breach was expected on the occasion of intense rainfall. Dam failure was thought to be potentially initiated by erosion or headcutting of 1991 deposits where the valley narrows or "noses" and the channel drops. The removal of material would lead to increasing flow perimeter and head, which would increase discharge and weaken the dam. Discharge would escalate into a tremendous rush of water, accelerating erosion headward in a runaway process that culminated in dam failure. This same process has been documented in numerous cases of overtopped natural and man-made dams that have breached.
In the worst case, a 10- to 20-m-depth of the channel dam corresponding to the vertical gap between the crest and shallow channel bedrock could have been breached, releasing lake volumes of 28 x 106 to 55 x 106 m3. For a 10- to 20-m-deep breach, estimated peak discharges at the breach in such a circumstance are 3,000 and 11,000 m3/s. The breakout flow would be expected to erode and incorporate pyroclastic-flow and lahar sediments at the mid- to lower reaches of the Maraunot River, causing it to bulk up 3-6 times. Resulting large lahars could reach 3- to 7-fold larger distances than in previous typhoons (e.g. 1993). Faced with this hazard, PHIVOLCS proposed in early August 2001 to trench across the channel dam. This formed the core element of a rapid mitigation plan that included information drives, evacuation of risk areas, and lahar watches.
Trenching took place during 23 August-5 September 2001. The bulk of the trench was manually dug by an 80-man crew using pick axes and shovels and, later, by sluicing with a portable 50 m-long pressure hose. Excavation followed the channel thalweg or the natural spillway from crest to toe of the dam. The fully-excavated trench was 70 m long, 4 m wide, and nearly 3.5 m deep. It contained a 1-m-wide and 1.5-m-deep inner terrace that resulted from belated prioritization of depth over width (figures 37 and 38). Its bottom was originally graded ~2%. At the mouth it sloped steeply into 5 m-long plug that confined the lake until its release. In the end, about 700 m3 of material was excavated. On 4 September, observers were stationed at four sites. Evacuation of Botolan began the following day in anticipation of potential lahars.
On 6 September, with a 10-cm-head of water, the plug was removed by sluicing. At 0653, after less than 1.25 hours of sluicing, lake water spill into the trench commenced, but discharge remained sluggish in the first four hours (~0.03 m3/s). Political developments led to the trench being left in a state that thwarted rapid, planned breaching.
Monitoring the newly opened trench. From 6 September to 5 November, local rainfall and outflow conditions and changes in configuration of the Maraunot trench were monitored. An estimated 4.4 x 10⁶ m3 (~86,000 m3/day) of rainwater entered the crater between 6 September and 5 November. In response, discharge across the trench fluctuated but rarely exceeded 1 m3/s under a lake head generally under 1 m. The total water output at the trench was roughly 3 x 10⁶ m3 (~59,000 m3/day) for the same period.
Time-series profiles of the trench floor revealed a total 1.5 m of downcutting in the period 8 September-21 October, an average of ~3.5 cm/day. As the terminus lowered close to bedrock and precipitation waned, however, the floor more or less stabilized, as did the trench's mouth-to-terminus elevation drop of 2.2 m. No substantial lateral erosion occurred at the 5-15 reach or in the first 30 m reach between 6 September and 5 November. Nevertheless, there was significant lateral erosion of as much as 2 m at the 55-65 m reaches and beyond. Erosion was attributed largely to the steeper channel and more turbulent flow at the trench's terminal reaches.
The pre-1991 breccia matrix eroded with vertical scour experienced uniformly across the entire floor and lateral scour (sidecutting) confined to the terminal reaches. Matrix erosion resulted in armoring of the trench floor with dense boulders. This partly accounted for restrained vertical scouring.
Trenching impacts to the lake breakout problem. Although the trench did not trigger a rapid breach as PHIVOLCS originally intended, the monitoring determined that the armoring provided by coarse pre-1991 breccia limited vertical scouring of the dam. Lateral matrix erosion and bank collapse were considered to deliver even further armor to the trench bed, as well as some sideways expansion of the channel.
Trenching by itself had significantly reduced the breakout hazard. The lake was averted from growing an extra 11 x 106 m3 and relieved of another 3 x 10⁶ m3 with a trench now draining it. This minimized the magnitude of lake breakout. Had natural overtopping been allowed to occur under sustained intense rainfall, initial outflow could have easily scoured a wider channel across the loose 1991 deposits, attaining discharge rates possibly too high for pre-1991 breccia to counteract with armoring.
Geologic Background. Prior to 1991 Pinatubo volcano was a relatively unknown, heavily forested lava dome complex located 100 km NW of Manila with no records of historical eruptions. The 1991 eruption, one of the world's largest of the 20th century, ejected massive amounts of tephra and produced voluminous pyroclastic flows, forming a small, 2.5-km-wide summit caldera whose floor is now covered by a lake. Caldera formation lowered the height of the summit by more than 300 m. Although the eruption caused hundreds of fatalities and major damage with severe social and economic impact, successful monitoring efforts greatly reduced the number of fatalities. Widespread lahars that redistributed products of the 1991 eruption have continued to cause severe disruption. Previous major eruptive periods, interrupted by lengthy quiescent periods, have produced pyroclastic flows and lahars that were even more extensive than in 1991.
Information Contacts: Ma. Antonia V. Bornas and theQuick Response Team, Geology and Geophysics Research and Development Division, Philippine Institute of Volcanology and Seismology, C.P. Garcia Ave., University of the Philippines Campus, Diliman 1101, Quezon City, Philippines.
Semeru (Indonesia) — December 2002 Cite this Report
Semeru
Indonesia
8.108°S, 112.922°E; summit elev. 3657 m
All times are local (unless otherwise noted)
Elevated explosive activity continues; evacuation on 30 December 2002
Higher-than-normal seismic and explosive activity occurred at Semeru during June-September 2002 (BGVN 27:09). During 9 September-29 December, activity continued to be higher than normal. Seismicity was dominated by explosions and avalanche earthquakes (table 10). Throughout the report period, a white-gray ash plume rose 400-500 m high above the Jonggring Seloko crater rim. There were eight explosions on 23 December, one explosion on 25 December, seven explosions on 26 December, eight explosions on 27 December, and another seven explosions on 29 December.
Table 10. Earthquakes recorded at Semeru during 9 September 2002-1 January 2003. "*" indicates that the report was part of a special report issued by VSI and may break the sequence of weekly reports. Courtesy VSI.
| Date |
Volcanic A-type |
Volcanic B-type |
Explosion |
Avalanche |
Tremor |
Tectonic |
Pyroclastic Flow |
Flood/lahar |
| 09 Sep-15 Sep 2002 |
1 |
-- |
640 |
57 |
0 |
2 |
-- |
-- |
| 16 Sep-22 Sep 2002 |
1 |
-- |
527 |
32 |
4 |
6 |
-- |
-- |
| 23 Sep-29 Sep 2002 |
0 |
-- |
483 |
24 |
13 |
2 |
-- |
-- |
| 30 Sep-06 Oct 2002 |
0 |
-- |
602 |
13 |
1 |
7 |
-- |
-- |
| 07 Oct-13 Oct 2002 |
-- |
-- |
548 |
27 |
1 |
4 |
-- |
-- |
| 14 Oct-20 Oct 2002 |
1 |
-- |
493 |
20 |
2 |
4 |
-- |
-- |
| 21 Oct-27 Oct 2002 |
-- |
1 |
561 |
27 |
-- |
6 |
-- |
-- |
| 28 Oct-03 Nov 2002 |
-- |
-- |
430 |
3 |
-- |
-- |
-- |
-- |
| 04 Nov-10 Nov 2002 |
-- |
-- |
528 |
34 |
2 |
2 |
-- |
-- |
| 11 Nov-18 Nov 2002 |
-- |
-- |
273 |
27 |
-- |
1 |
-- |
-- |
| 02 Dec-08 Dec 2002 |
-- |
-- |
474 |
13 |
7 |
3 |
3 |
-- |
| 09 Dec-15 Dec 2002 |
-- |
-- |
513 |
6 |
1 |
1 |
1 |
-- |
| 16 Dec-22 Dec 2002 |
-- |
-- |
606 |
6 |
1 |
-- |
1 |
-- |
| 03 Dec-16 Dec 2002* |
0 |
0 |
967 |
19 |
8 |
3 |
4 |
0 |
| 17 Dec-30 Dec 2002* |
0 |
1 |
1085 |
49 |
2 |
6 |
6 |
3 |
| 23 Dec-29 Dec 2002 |
-- |
1 |
479 |
43 |
2 |
6 |
3 |
4 |
| 31 Dec 2002* |
-- |
-- |
83 (47 mm max. amp.) |
30 (2 mm max. amp.) |
1 (3 mm amp., 80-sec. duration) |
-- |
-- |
1 |
| 01 Jan 2003* |
-- |
3 (2-6 mm amp., 11-12 sec. duration) |
88 (36 mm max. amp.) |
18 (4 mm max. amp.) |
1 (1 mm max. Amp., 60 sec. duration) |
-- |
-- |
-- |
On 25 December, a pyroclastic flow traveled 2.5 km and entered the Besuk Kembar river. On 27 December lava avalanches traveled 250 m toward Besuk Kembar. On 29 December a 5 km pyroclastic flow occurred. The same day during 1700-2015 a lahar flowed along Besuk Kembar closer to Supit village. Early on the morning of 30 December residents of Supit village were evacuated. The same day at 0720 a pyroclastic flow traveled 2.0 km toward Besuk Kembar and at 1000 a pyroclastic flow traveled 4.0 km, approaching Supit village. Semeru remained at Alert Level 2 (on a scale of 1-4).
Geologic Background. Semeru, the highest volcano on Java, and one of its most active, lies at the southern end of a volcanic massif extending north to the Tengger caldera. The steep-sided volcano, also referred to as Mahameru (Great Mountain), rises above coastal plains to the south. Gunung Semeru was constructed south of the overlapping Ajek-ajek and Jambangan calderas. A line of lake-filled maars was constructed along a N-S trend cutting through the summit, and cinder cones and lava domes occupy the eastern and NE flanks. Summit topography is complicated by the shifting of craters from NW to SE. Frequent 19th and 20th century eruptions were dominated by small-to-moderate explosions from the summit crater, with occasional lava flows and larger explosive eruptions accompanied by pyroclastic flows that have reached the lower flanks of the volcano.
Information Contacts: Volcanological Survey of Indonesia (VSI), Jalan Diponegoro No. 57, Bandung 40122, Indonesia (URL: http://www.vsi.esdm.go.id/).
Stromboli (Italy) — December 2002 Cite this Report
Stromboli
Italy
38.789°N, 15.213°E; summit elev. 924 m
All times are local (unless otherwise noted)
Landslides on 30 December cause two tsunamis; damage in nearby villages
Following heightened seismicity during June-July 2002 that culminated in an explosion on 24 July (BGVN 27:07), major activity lessened until late December.
On 28 December, an effusive eruption started at the base of Crater 1 of the NE Crater in the summit area. This eruption ended on 29 December and a helicopter-borne thermal camera survey that day revealed three lava flows that had spread in the eastern Sciara del Fuoco and had reached the sea. Along the coast, the joined flows were ~300 m wide, but were no longer being fed.
Visibility improved on 30 December, when a new survey found an eruptive fissure running NE. The fissure started from the base of Crater 1 at ~700 m elevation and spread down to ~600 m elevation, along a length of ~200 m. On 30 December observers saw a ~200-m-long lava flow emitted from the base of the fissure, spreading in the upper Sciara del Fuoco into a small depression.
Landslides and tsunami. On 30 December at 1315 and 1322 two landslides formed along the Sciara del Fuoco. They reached the sea accompanied by fine (0.1 mm grain-size) wet dust falling on the SE flank of the island (from rock collisions during the landslides). The volume of the first landslide was estimated at ~6 x 10⁶ m3 of rock while the second was smaller at ~5 x 10⁶ m3 of rock. These landslides detached the lava from the 28 December eruption along the slope together with a large portion of the ground below.
The large volume of rock crashing into the sea caused two tsunamis, each with waves several meters high. The waves spread onto the villages of Stromboli and Ginostra damaging buildings and boats and injuring several people (according to news reports, six people were evacuated by helicopter and taken to two hospitals on Sicily). Large waves were reported on the northern coast of Sicily, 60 km S of Stromboli. The two separate landslides were formed from two distinct bodies of rock, and left a ridge on the Sciara del Fuoco wall between them. This ridge may collapse in the future; its volume is estimated to be similar to that of the first landslide.
As of 6 January 2003, the effusive eruption and thin lava flows continued along the Sciara del Fuoco. Two vents located at ~500 m and ~300 m elevation in the middle of the Sciara del Fuoco were feeding two narrow flows that merged and reached the sea. Occasional small landslides from the unstable walls of the Sciara covered the lava flows with a thin talus. Concern over another major landslide had diminished due to several small-volume rockfalls from the walls of the depression. The summit craters had not shown any explosive activity since the start of the eruption on 28 December, and no earthquakes were recorded by the indigenous seismic network. Two shocks recorded by INGV seismic stations were directly related to the spreading of the two landslides on the Sciara del Fuoco.
Previous tsunamis at Stromboli occurred in 1930, 1944, and 1954. These were related either to paroxysmal eruptive activity, to landslides along the Sciara del Fuoco, or to pyroclastic flows, but not associated with lava flow venting.
Geologic Background. Spectacular incandescent nighttime explosions at Stromboli have long attracted visitors to the "Lighthouse of the Mediterranean" in the NE Aeolian Islands. This volcano has lent its name to the frequent mild explosive activity that has characterized its eruptions throughout much of historical time. The small island is the emergent summit of a volcano that grew in two main eruptive cycles, the last of which formed the western portion of the island. The Neostromboli eruptive period took place between about 13,000 and 5,000 years ago. The active summit vents are located at the head of the Sciara del Fuoco, a prominent scarp that formed about 5,000 years ago due to a series of slope failures which extends to below sea level. The modern volcano has been constructed within this scarp, which funnels pyroclastic ejecta and lava flows to the NW. Essentially continuous mild Strombolian explosions, sometimes accompanied by lava flows, have been recorded for more than a millennium.
Information Contacts: Sonia Calvari, Instituto Nazionale di Geofisica e Vulcanologia (INGV); Sezione di Catania (URL: http://www.ct.ingv.it/); Stromboli On-Line (URL: http://www.stromboli.net/).
Tungurahua (Ecuador) — December 2002 Cite this Report
Tungurahua
Ecuador
1.467°S, 78.442°W; summit elev. 5023 m
All times are local (unless otherwise noted)
Summary of 2002 activity includes several episodes of intense seismicity
This report presents a summary of activity throughout 2002. During 2002 several episodes of intense seismic activity occurred that shared certain characteristics: clusters of long-period (LP) earthquakes, tremor related to ash emissions, and an increase in VT events on some occasions. Magmatic intrusions during January-March 2002, were generally preceded by LP clusters with dominate frequencies of 3.8 Hz with some oscillating around 1.5-1.6 Hz. Following these clusters, increased tremor occurred, some related to the emission of gas and ash. Eruptive activity included explosions and Strombolian blasts.
In April, activity changed, LP clusters ceased including events with a dominant frequency of 3.8 Hz and began to contain frequencies of ~6 Hz. Since June, VT events seemed to precede LP events or tremor episodes. Precursors of magmatic activity changed slightly. In almost every case, fewer precursory events were registered. Instituto Geofisica (IG) stated that the present eruptive process could be more uncertain than before. In September, the acceleration of processes seemed to indicate variations in internal conditions, such as changes in magma within the conduit, increased temperatures, diminishing percentages of crystals, lower SiO2, and addition of new gases.
During October-November there was none of the intense tremor activity that usually accompanies new magma injections. Energy remained at very low levels. IG stated that a large number of VT events and their decreased influence on volcanic activity could indicate a low contribution of magmatic gases that could be mobilized and released outside the volcano by means of explosions, continuous ash emissions, or Strombolian activity as previously observed. Further details of 2002 activity follow.
Detailed activity. During the first 2 weeks of January 2002 a high number of low-energy LP earthquakes took place. Some of the LP's were associated with emissions of mainly steam with a moderate magmatic gas concentration. During the last 2 weeks of the month the number of LP's increased remarkably. The LP's occurred in clusters, most of which were preceded by VT events at depths of 4-11 km beneath the summit. Beginning on 15 January it was possible to see a glow coming from the crater, accompanied by the emission of gases. While the emissions diminished during the last week of January, explosions increased in number and magnitude. By the end of January sporadic episodes of tremor and light ashfall occurred in Ambato and Baños. These seismic characteristics, along with frequent roaring noises that occurred with the explosions, indicated possible degassing of a small volume of magma that entered the conduit beginning on 15 January.
During February magma injection apparently disturbed the system, and new gases ascended. Steam and ash emissions occurred, as well as the possible formation of a lava lake. Strombolian activity during 4-18 February was so strong that pyroclastic flows (PF's) descended the WNW flank along the Juive and Cusua valleys. Seismicity was characterized by LP's, tremor related to emissions, a few volcano-tectonic events (VT's), and small explosions.
During the first 3 weeks of March there was Strombolian activity with emissions of lava, gas, and ash, and almost-continuous roaring noises. During the third week of March, activity diminished in intensity until it disappeared almost completely by the last week of the month. Although incandescence was observed at night, it was not as intense as that observed in previous months. Ashfall occurred in Ambato, Quero, Latacunga, Cusua, Chacauco, Penipe, Peula, Patate, Pelileo, Cotaló, and Pillate.
Most of the LP's registered during April were small and rather sporadic, but frequency content changed on 17 April from 4-4.8 Hz to 6-8 Hz. On 22 and 23 April, VT events at 6-8 km depths were followed by strong gas-and-ash emissions. These became quite intense during 24-30 April.
Activity was quite intense during 12-13 and 28-30 May. On 13 May a total of 8 explosions took place, preceded by an increase in the number of LP events. The same day ashfall occurred in Ambato and Baños. On 24 May VT activity took place just before an increase in explosive activity. During 17-26 May explosions were preceded by VT events, and by 30 and 31 May were preceded by LP events. As of the second week of May Strombolian activity, roaring noises, and incandescence in the crater was intense and almost constant. Lava was present in the crater, accompanied by tremor and ongoing emissions. During the last week of the month a continuous gas-ash column drifted mainly W.
During the last week of June intense tremor registered. The tremor occurred for 3 days and contained dominant frequencies of 2.2-2.7 and 1.5 Hz. Tremor lasted up to an hour with an amplitude that saturated seismographs. Many LP's and explosions accompanied the tremor. During June VT events (4-7 km deep) occurred just before tremor and LP events. Several LP's and tremor episodes preceded explosive events. On average the LP's and tremor occurred 2-4 hours before an explosion.
Explosions occurred during the first week of July. During the first 2 weeks, deep VT earthquakes (5-10 km deep) occurred at a rate of ~1 per day and there was an increase in the number of LP's and hybrid earthquakes. VT and LP events preceded new cycles of explosions, not immediately as had previously been noticed, but in this case by about 15 days. After the new cycle of explosive activity began, most of the LP events had frequencies of 1.5-2.5 Hz. Some VT's preceded the LP's and had frequencies of 3.8 and 1.5 Hz. During the second week intense roars were heard, and increasing ash emissions mainly drifted W. There was strong persistent incandescence, and frequent explosions produced loud noises and ash columns 2-4 km above the crater.
During the first 2 weeks of July, several episodes of Strombolian activity were observed, along with continuous but light ash emissions that were accompanied by roaring noises. Ash was deposited in a thin N-S strip between Hualcango and San Pedro de Sabañag (S of Quero), extending toward the W and Igualata. Ash accumulated up to 2.5 mm thick in "El Mirador" at Cerro Arrayán. Activity decreased toward the end of the month, when small plumes were emitted.
During 5-13 September, 8-10 VT earthquakes registered. These preceded the harmonic tremor seen during 13-21 September. Strong explosions and ash emissions also occurred. Ashfalls were noted in distant cities such as Píllaro and Riobamba, located ~30 km NW and SW, respectively.
During the first week of October explosions with reduced displacements greater than 10 cm2 took place and ashfall occurred in Pillate, Ambato, Cusua, Penipe, Altar, Bayusig, Matus Alto, and Matus Bajo. During the second and last week of the month VT events preceded explosions. During the last week of the month incandescence and roaring noises were heard. Three ashfalls were noted, two in Guadalupe and one (on 29 October) in Baños (up to 1 mm), Runtún, Pondoa, and Pintitin.
On 10 and 26 November, two peaks of LP activity occurred that were very close to the peaks of VT activity. The first LP peak preceded the first VT peak by two days. This was unusual because the VT peak normally preceded the LP peak. The second LP peak took place around the same time as the VT peak, indicating that the circulation of fluids was almost simultaneous. Incandescence was observed before the VT activity on 26 November. An increase of LP activity seemed to be correlated with the increase of sounds emitted by the volcano. Frequent incandescence in the crater preceded a VT peak.
Magmatic intrusions during 2002. Five magmatic intrusions (figure 18) apparently occurred during (1) 15-29 January, (2) 15-30 April, 12-13, 24-30 May, (3) 28-30 June, (4) 3-13 July, and (5) 5-13 September. Two periods of intense activity also occurred during 8-13 and 21-27 October, and on 10 and 26 November. During April-June magmatic intrusions did not occur along with a peak of seismic activity, but VT's, hybrids, and emissions all occurred, though in smaller numbers than registered in previous years.
Tremor activity was an essential indicator of these magmatic intrusions (figure 19). Later peaks of tremor activity were always during periods of seismicity related to magmatic intrusions, although it was not clear whether the June peak was related to a possible intrusion. Tremor energy was quite variable.
Deformation measurements. During 2002 EDM measurements on the N flank showed a slight tendency of inflation. This inflation was first noticed during the first half of 2000. During 2002 a shortening of the distance occurred between prisms and reference bases, between -2 and -6 cm with respect to values observed before the reactivation of the volcano. Although there were variations in measurements taken during the year, the overall tendency has been inflation of 4 to 6 cm with respect to that during 1998-2000.
Data from inclinometers RETU and JUIV show a positive drift of the radial axis of station RETU (elevation 4,000 m). The drift would mean a deflation in the NW sector. During September 2002, when numerous explosions occurred, inclinometer movements changed.
During 2002 measurements of the inclinometer at station JUIV5 were stable until October 2002, when there were disturbances in the radial axis and to a greater degree in the tangential axis. Since 10 November both axes showed significant changes of up to 200 µrad. The negative tendency indicated a progressive inflation. This change agreed exactly with the first LP peak on 10 November. The change lasted until 20 November and included the greater peak of VT activity during 2002. After 20 November, both axes became stabilized. The oscillations seen in this slope between September and October occurred simultaneously with other activity, possibly representing slow but continuous magma movement in the lower parts of the volcano.
Geochemistry. SO2 flux measurements determined by COSPEC during 1999-2002 were generally less than 2,000 tons/day (figure 20). The peaks took place during March and October, with values reaching 3,000-5,000 tons/day. These high values seemed to correspond with the magma injections of December 2001and January and September 2002. Other episodes of seismic activity related to magmatic injection seemed to precede the peaks in SO2 emission. The high point in August ("3 y 4" on figure 14), followed increased seismicity during June and July.
Thermal waters generally increased in temperature ~0.5°C. A small reduction in pH occurred, with a tendency toward alkaline values. During 1998-99, when the seismicity increased, pH also increased, probably because of the magmatic unrest at the time. Conductivity did not change, and neither did geochemical characteristics such as abundances of sulfates, chlorides, and bicarbonates. IG stated that it could not yet be explained how an increase in seismicity seemed to shift the pH of thermal waters (figure 21).
Future scenarios. Since 1999 Tungurahua has shown frequent, moderate volcanism with occasional lava emissions. This period can be divided into 13 magmatic intrusions of similar characteristics, although the last three injections displayed slight differences. Starting in 1916 Tungurahua displayed intermittent activity until 1918, with periods of tranquility and greater activity than at present.
The present process has been characterized by LP clusters just before and during eruptions. During October and November 2002, VT events usually preceded cycles of increased activity. Strong incandescence on 2 December was not accompanied by strong explosions, Strombolian activity, or lava emissions.
Geologic Background. Tungurahua, a steep-sided andesitic-dacitic stratovolcano that towers more than 3 km above its northern base, is one of Ecuador's most active volcanoes. Three major edifices have been sequentially constructed since the mid-Pleistocene over a basement of metamorphic rocks. Tungurahua II was built within the past 14,000 years following the collapse of the initial edifice. Tungurahua II collapsed about 3,000 years ago and produced a large debris-avalanche deposit to the west. The modern glacier-capped stratovolcano (Tungurahua III) was constructed within the landslide scarp. Historical eruptions have all originated from the summit crater, accompanied by strong explosions and sometimes by pyroclastic flows and lava flows that reached populated areas at the volcano's base. Prior to a long-term eruption beginning in 1999 that caused the temporary evacuation of the city of Baños at the foot of the volcano, the last major eruption had occurred from 1916 to 1918, although minor activity continued until 1925.
Information Contacts: Patty Mothes and Indira Molina, Geophysical Institute (Instituto Geofísico, IG), Escuela Politécnica Nacional, Apartado 17-01-2759, Quito, Ecuador.
Witori (Papua New Guinea) — December 2002 Cite this Report
Witori
Papua New Guinea
5.5745°S, 150.5161°E; summit elev. 724 m
All times are local (unless otherwise noted)
Dacite lava flows, flattened forest, deformation, and faulting
Additional information about Mt. Pago's recent eruption (BGVN 27:07-27:09) has been provided by members of the U.S. Geological Survey's Volcano Disaster Assistance Program (VDAP). The team donated to the GVP archives an extensive suite of digital photographs (still and video) taken during August-October 2002. The photographers included the helicopter pilot Alan Cameron (Heli Niugini), and VDAP members Andy Lockhart, Jeff Marso, and Elliot Endo.
In terms of the basic distribution of eruptive products, the August-October 2002 photos (figures 7-16) appeared similar to those shown in earlier reports (BGVN 27:07-27:09). All photos were taken from a helicopter, often during routine observation flights provided by the West New Britain Provincial Government. For scale on some of the photos, Cameron estimated that tree heights ranged from 5-30 m, with the taller trees in the low-lying areas and most of the ones in the photos at the shorter end of that range.
During all or part of this August-October 2002 interval, lavas erupted at high rates: 10-20 m3/s. The crystal-poor dacitic lavas were roughly the same as those produced during the ancestral caldera-forming eruption. The same composition had also been consistent for the intervening lavas. By or before the end of October the current eruption had emitted ~60 x 106 m3 to ~100 x 106 m3 of magma. There was some evidence of magma mixing. Available evidence suggested that the magma rose in a dike from source depths of 6-8 km. A vital question was whether a gas-rich eruptive phase might start.
Highlighted in the August-October photos were recent faults and associated surface deformation. These had been documented by Chris McKee (Geophysical Observatory, PNG) who found that these features covered an area on Pago's mid-to-lower NW flanks. In many cases the faults left conspicuous trails marked by swaths of fallen trees across the rainforest (figures 5 and 8). Despite their clear expressions and documentation, a thermal-imaging device found that the faults and adjacent areas generally lacked anomalous high-temperature signals (Steve Saunders, RVO). The obvious exceptions to this occurred where faults cut across either vent areas and their cones or across massive lava flows in the caldera (figure 7). The inferred cause of the faulting and associated deformation was a shallow magmatic intrusion.
The USGS contributors expressed gratitude to their colleagues affiliated with Rabaul Volcano Observatory in Papua New Guinea and the West New Britain Provincial Government who had helped them with field and logistical support.
At the close of 2002 Alan Cameron (Heli Niugini) wrote Endo the following brief note. "Since you left, interest in Mt. Pago seems to have diminished; I have not flown over it for some time. Yesterday I flew a [medical evacution] past it, and smoke, etc. was still rising but the weather was bad and I did not get closer than about a half mile [(~1 km)], so I don't know what it is doing. Hoskins [airport] is still closed to aircraft, and the Talasea [air]strip is often closed due to water over it and the soft surface, so air travel is somewhat unreliable from here."
In the first week of February, Cameron sent another message. "The last time I had a close look at Pago was about a month ago. It still looked to be fairly active in most respects, however there is not much emission of ash now and the lava seems to have slowed, but I think this is on account of the flow being restricted in its exit to the [S]. To my eye it seems that the lava deposit may be increasing in height due to that restriction . . . . I do recall that there is still a great deal of heat from the lava ( I could feel its effect on the helicopter), which supports my feeling that it is building vertically and the lava is still flowing."
Reference. Cooke, R.J.S., 1981, Eruptions at Pago volcano, 1911-1933 (Compiled by R.W. Johnson), in Cooke-Ravian Volume of Volcanological Papers (editor, R.W. Johnson) Geological Survey of Papua New Guinea Memoir 10, 135-46; Printed in Hong Kong by Libra Press Ltd.
Geologic Background. The active Pago cone has grown within the Witori caldera (5.5 x 7.5 km) on the northern coast of central New Britain contains the active Pago cone. The gently sloping outer caldera flanks consist primarily of dacitic pyroclastic-flow and airfall deposits produced during a series of five major explosive eruptions from about 5,600 to 1,200 years ago, many of which may have been associated with caldera formation. Pago cone may have formed less than 350 years ago; it has grown to a height above the caldera rim, and a series of ten dacitic lava flows from it covers much of the caldera floor. The youngest of these was erupted during 2002-2003 from vents extending from the summit nearly to the NW caldera wall. The Buru caldera cuts the SW flank.
Information Contacts: Elliot Endo, John Ewert, C. Dan Miller, Andy Lockhart, Jeff Marso, and Chris Newhall, U.S. Geological Survey, David A. Johnston Cascades Volcano Observatory, Volcano Disaster Assistance Program (VDAP), 1300 SE Cardinal Ct, Building 10, Suite 100, Vancouver, WA 98683, USA; Alan Cameron, Chief Pilot, Heli Niugini Kimbe, Box 404, Kimbe WNB, Papua New Guinea; Ima Itikarai and Steve Saunders, Rabaul Volcano Observatory (RVO), Papua New Guinea; Chris Mckee, Port Moresby Geophysical Observatory, PO Box 323, Port Moresby NCD, Papua New Guinea; Hugh Davies, Earth Sciences, University of Papua New Guinea, PO Box 414, University Post Office NCD, Papua New Guinea.