Recently Published Bulletin Reports
Erebus (Antarctica) Lava lake remains active; most thermal alerts recorded since 2019
Rincon de la Vieja (Costa Rica) Frequent phreatic explosions during July-December 2023
Bezymianny (Russia) Explosion on 18 October 2023 sends ash plume 8 km high; lava flows and incandescent avalanches
Kilauea (United States) Low-level lava effusions in the lava lake at Halema’uma’u during July-December 2022
Nyamulagira (DR Congo) Lava flows and thermal activity during May-October 2023
Bagana (Papua New Guinea) Explosions, ash plumes, ashfall, and lava flows during April-September 2023
Mayon (Philippines) Lava flows, pyroclastic flows, ash emissions, and seismicity during April-September 2023
Nishinoshima (Japan) Eruption plumes and gas-and-steam plumes during May-August 2023
Krakatau (Indonesia) White gas-and-steam plumes and occasional ash plumes during May-August 2023
Villarrica (Chile) Strombolian activity, gas-and-ash emissions, and crater incandescence during April-September 2023
Merapi (Indonesia) Frequent incandescent avalanches during April-September 2023
Ebeko (Russia) Moderate explosive activity with ash plumes continued during June-November 2023
Erebus (Antarctica) — January 2024  Cite this Report
Erebus
Antarctica
77.53°S, 167.17°E; summit elev. 3794 m
All times are local (unless otherwise noted)
Lava lake remains active; most thermal alerts recorded since 2019
The lava lake in the summit crater of Erebus has been active since at least 1972. Located in Antarctica overlooking the McMurdo Station on Ross Island, it is the southernmost active volcano on the planet. Because of the remote location, activity is primarily monitored by satellites. This report covers activity during 2023.
The number of thermal alerts recorded by the Hawai'i Institute of Geophysics and Planetology’s MODVOLC Thermal Alerts System increased considerably in 2023 compared to the years 2020-2022 (table 9). In contrast to previous years, the MODIS instruments aboard the Aqua and Terra satellites captured data from Erebus every month during 2023. Consistent with previous years, the lowest number of anomalous pixels were recorded in January, November, and December.
Table 9. Number of monthly MODIS-MODVOLC thermal alert pixels recorded at Erebus during 2017-2023. See BGVN 42:06 for data from 2000 through 2016. The table was compiled using data provided by the HIGP – MODVOLC Thermal Alerts System.
| Year |
Jan |
Feb |
Mar |
Apr |
May |
Jun |
Jul |
Aug |
Sep |
Oct |
Nov |
Dec |
SUM |
| 2017 |
0 |
21 |
9 |
0 |
0 |
1 |
11 |
61 |
76 |
52 |
0 |
3 |
234 |
| 2018 |
0 |
21 |
58 |
182 |
55 |
17 |
137 |
172 |
103 |
29 |
0 |
0 |
774 |
| 2019 |
2 |
21 |
162 |
151 |
55 |
56 |
75 |
53 |
29 |
19 |
1 |
0 |
624 |
| 2020 |
0 |
2 |
16 |
18 |
4 |
4 |
1 |
3 |
18 |
3 |
1 |
6 |
76 |
| 2021 |
0 |
9 |
1 |
0 |
2 |
56 |
46 |
47 |
35 |
52 |
5 |
3 |
256 |
| 2022 |
1 |
13 |
55 |
22 |
15 |
32 |
39 |
19 |
31 |
11 |
0 |
0 |
238 |
| 2023 |
2 |
33 |
49 |
82 |
41 |
32 |
70 |
64 |
42 |
17 |
5 |
11 |
448 |
Sentinel-2 infrared images showed one or two prominent heat sources within the summit crater, accompanied by adjacent smaller sources, similar to recent years (see BGVN 46:01, 47:02, and 48:01). A unique image was obtained on 25 November 2023 by the OLI-2 (Operational Land Imager-2) on Landsat 9, showing the upper part of the volcano surrounded by clouds (figure 32).
Geologic Background. Mount Erebus, the world's southernmost historically active volcano, overlooks the McMurdo research station on Ross Island. It is the largest of three major volcanoes forming the crudely triangular Ross Island. The summit of the dominantly phonolitic volcano has been modified by one or two generations of caldera formation. A summit plateau at about 3,200 m elevation marks the rim of the youngest caldera, which formed during the late-Pleistocene and within which the modern cone was constructed. An elliptical 500 x 600 m wide, 110-m-deep crater truncates the summit and contains an active lava lake within a 250-m-wide, 100-m-deep inner crater; other lava lakes are sometimes present. The glacier-covered volcano was erupting when first sighted by Captain James Ross in 1841. Continuous lava-lake activity with minor explosions, punctuated by occasional larger Strombolian explosions that eject bombs onto the crater rim, has been documented since 1972, but has probably been occurring for much of the volcano's recent history.
Information Contacts: Hawai'i Institute of Geophysics and Planetology (HIGP) - MODVOLC Thermal Alerts System, School of Ocean and Earth Science and Technology (SOEST), Univ. of Hawai'i, 2525 Correa Road, Honolulu, HI 96822, USA (URL: http://modis.higp.hawaii.edu/); Copernicus Browser, Copernicus Data Space Ecosystem, European Space Agency (URL: https://dataspace.copernicus.eu/browser/); NASA Earth Observatory, EOS Project Science Office, NASA Goddard Space Flight Center, Goddard, Maryland, USA (URL: https://earthobservatory.nasa.gov/images/152134/erebus-breaks-through).
Rincon de la Vieja (Costa Rica) — January 2024 Cite this Report
Rincon de la Vieja
Costa Rica
10.83°N, 85.324°W; summit elev. 1916 m
All times are local (unless otherwise noted)
Frequent phreatic explosions during July-December 2023
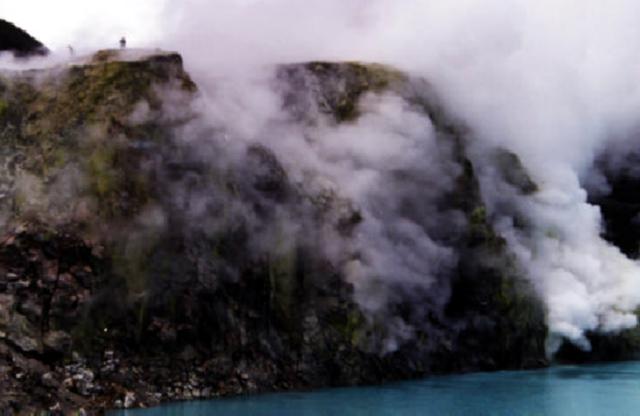
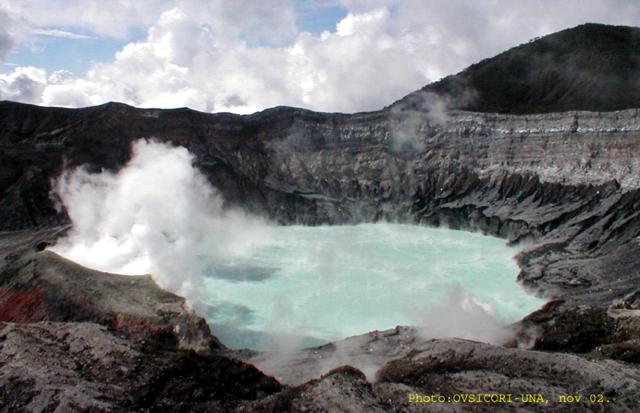
Rincón de la Vieja is a volcanic complex in Costa Rica with a hot convecting acid lake that exhibits frequent weak phreatic explosions, gas-and-steam emissions, and occasional elevated sulfur dioxide levels (BGVN 45:10, 46:03, 46:11). The current eruption period began June 2021. This report covers activity during July-December 2023 and is based on weekly bulletins and occasional daily reports from the Observatorio Vulcanologico Sismologica de Costa Rica-Universidad Nacional (OVSICORI-UNA).
Numerous weak phreatic explosions continued during July-December 2023, along with gas-and-steam emissions and plumes that rose as high as 3 km above the crater rim. Many weekly OVSICORI-UNA bulletins included the previous week's number of explosions and emissions (table 9). For many explosions, the time of explosion was given (table 10). Frequent seismic activity (long-period earthquakes, volcano-tectonic earthquakes, and tremor) accompanied the phreatic activity.
Table 9. Number of reported weekly phreatic explosions and gas-and-steam emissions at Rincón de la Vieja, July-December 2023. Counts are reported for the week before the Weekly Bulletin date; not all reports included these data. Courtesy of OVSICORI-UNA.
| OVSICORI Weekly Bulletin |
Number of explosions |
Number of emissions |
| 28 Jul 2023 |
6 |
14 |
| 4 Aug 2023 |
10 |
12 |
| 1 Sep 2023 |
13 |
11 |
| 22 Sep 2023 |
12 |
13 |
| 29 Sep 2023 |
6 |
11 |
| 6 Oct 2023 |
12 |
5 |
| 13 Oct 2023 |
7 |
9 |
| 20 Oct 2023 |
1 |
15 |
| 27 Oct 2023 |
3 |
23 |
| 3 Nov 2023 |
3 |
10 |
| 17 Nov 2023 |
0 |
Some |
| 24 Nov 2023 |
0 |
14 |
| 8 Dec 2023 |
4 |
16 |
| 22 Dec 2023 |
8 |
18 |
Table 10. Summary of activity at Rincón de la Vieja during July-December 2023. Weak phreatic explosions and gas emissions are noted where the time of explosion was indicated in the weekly or daily bulletins. Height of plumes or emissions are distance above the crater rim. Courtesy of OVSICORI-UNA.
| Date |
Time |
Description of Activity |
| 1 Jul 2023 |
0156 |
Explosion. |
| 2 Jul 2023 |
0305 |
Explosion. |
| 4 Jul 2023 |
0229, 0635 |
Event at 0635 produced a gas-and-steam plume that rose 700 m and drifted W; seen by residents in Liberia (21 km SW). |
| 9 Jul 2023 |
1843 |
Explosion. |
| 21 Jul 2023 |
0705 |
Explosion. |
| 26 Jul 2023 |
1807 |
Explosion. |
| 28 Jul 2023 |
0802 |
Explosion generated a gas-and-steam plume that rose 500 m. |
| 30 Jul 2023 |
1250 |
Explosion. |
| 31 Jul 2023 |
2136 |
Explosion. |
| 11 Aug 2023 |
0828 |
Explosion. |
| 18 Aug 2023 |
1304 |
Explosion. |
| 21 Aug 2023 |
1224 |
Explosion generated gas-and-steam plumes rose 500-600 m. |
| 22 Aug 2023 |
0749 |
Explosion generated gas-and-steam plumes rose 500-600 m. |
| 24 Aug 2023 |
1900 |
Explosion. |
| 25 Aug 2023 |
0828 |
Event produced a steam-and-gas plume that rose 3 km and drifted NW. |
| 27-28 Aug 2023 |
0813 |
Four small events; the event at 0813 on 28 August lasted two minutes and generated a steam-and-gas plume that rose 2.5 km. |
| 1 Sep 2023 |
1526 |
Explosion generated plume that rose 2 km and ejected material onto the flanks. |
| 2-3 Sep 2023 |
- |
Small explosions detected in infrasound data. |
| 4 Sep 2023 |
1251 |
Gas-and-steam plume rose 1 km and drifted W. |
| 7 Nov 2023 |
1113 |
Explosion. |
| 8 Nov 2023 |
0722 |
Explosion. |
| 12 Nov 2023 |
0136 |
Small gas emissions. |
| 14 Nov 2023 |
0415 |
Small gas emissions. |
According to OVSICORI-UNA, during July-October the average weekly sulfur dioxide (SO2) flux ranged from 68 to 240 tonnes/day. However, in mid-November the flux increased to as high as 334 tonnes/day, the highest value measured in recent years. The high SO2 flux in mid-November was also detected by the TROPOMI instrument on the Sentinel-5P satellite (figure 43).
Geologic Background. Rincón de la Vieja, the largest volcano in NW Costa Rica, is a remote volcanic complex in the Guanacaste Range. The volcano consists of an elongated, arcuate NW-SE-trending ridge constructed within the 15-km-wide early Pleistocene Guachipelín caldera, whose rim is exposed on the south side. Sometimes known as the "Colossus of Guanacaste," it has an estimated volume of 130 km3 and contains at least nine major eruptive centers. Activity has migrated to the SE, where the youngest-looking craters are located. The twin cone of Santa María volcano, the highest peak of the complex, is located at the eastern end of a smaller, 5-km-wide caldera and has a 500-m-wide crater. A Plinian eruption producing the 0.25 km3 Río Blanca tephra about 3,500 years ago was the last major magmatic eruption. All subsequent eruptions, including numerous historical eruptions possibly dating back to the 16th century, have been from the prominent active crater containing a 500-m-wide acid lake located ENE of Von Seebach crater.
Information Contacts: Observatorio Vulcanológico Sismológica de Costa Rica-Universidad Nacional (OVSICORI-UNA), Apartado 86-3000, Heredia, Costa Rica (URL: http://www.ovsicori.una.ac.cr/); NASA Global Sulfur Dioxide Monitoring Page, Atmospheric Chemistry and Dynamics Laboratory, NASA Goddard Space Flight Center (NASA/GSFC), 8800 Greenbelt Road, Goddard MD 20771, USA (URL: https://so2.gsfc.nasa.gov/).
Bezymianny (Russia) — November 2023 Cite this Report
Bezymianny
Russia
55.972°N, 160.595°E; summit elev. 2882 m
All times are local (unless otherwise noted)
Explosion on 18 October 2023 sends ash plume 8 km high; lava flows and incandescent avalanches
Bezymianny, located on Russia’s Kamchatka Peninsula, has had eruptions since 1955 characterized by dome growth, explosions, pyroclastic flows, ash plumes, and ashfall. Activity during November 2022-April 2023 included gas-and-steam emissions, lava dome collapses generating avalanches, and persistent thermal activity. Similar eruptive activity continued from May through October 2023, described here based on information from weekly and daily reports of the Kamchatka Volcano Eruptions Response Team (KVERT), notices from Tokyo VAAC (Volcanic Ash Advisory Center), and from satellite data.
Overall activity decreased after the strong period of activity in late March through April 2023, which included ash explosions during 29 March and 7-8 April 2023 that sent plumes as high as 10-12 km altitude, along with dome growth and lava flows (BGVN 48:05). This reduced activity can be seen in the MIROVA thermal detection system graph (figure 56), which was consistent with data from the MODVOLC thermal detection system and with Sentinel-2 satellite images that showed persistent hotspots in the summit crater when conditions allowed observations. A renewed period of strong activity began in mid-October 2023.
Activity increased significantly on 17 October 2023 when large collapses began during 0700-0830 on the E flanks of the lava dome and continued to after 0930 the next day (figure 57). Ash plumes rose to an altitude of 4.5-5 km, extending 220 km NNE by 18 October. A large explosion at 1630 on 18 October produced an ash plume that rose to an altitude of 11 km (8 km above the summit) and drifted NNE and then NW, extending 900 km NW within two days at an altitude of 8 km. Minor ashfall was noted in Kozyrevsk (45 km WNW). At 0820 on 20 October an ash plume was identified in satellite images drifting 100 km ENE at altitudes of 4-4.5 km.
Lava flows and hot avalanches from the dome down the SE flank continued over the next few days, including 23 October when clear conditions allowed good observations (figures 58 and 59). A large thermal anomaly was observed over the volcano through 24 October, and in the summit crater on 30 October (figure 60). Strong fumarolic activity continued, with numerous avalanches and occasional incandescence. By the last week of October, volcanic activity had decreased to a level consistent with that earlier in the reporting period.
Aviation warnings were frequently updated during 17-20 October. KVERT issued a Volcano Observatory Notice for Aviation (VONA) on 17 October at 1419 and 1727 (0219 and 0527 UTC) raising the Aviation Color Code (ACC) from Yellow to Orange (second highest level). The next day, KVERT issued a VONA at 1705 (0505 UTC) raising the ACC to Red (highest level) but lowered it back to Orange at 2117 (0917 UTC). After another decrease to Yellow and back to Orange, the ACC was reduced to Yellow on 20 October at 1204 (0004 UTC). In addition, the Tokyo VAAC issued a series of Volcanic Ash Advisories beginning on 16 October and continuing through 30 October.
Geologic Background. The modern Bezymianny, much smaller than its massive neighbors Kamen and Kliuchevskoi on the Kamchatka Peninsula, was formed about 4,700 years ago over a late-Pleistocene lava-dome complex and an edifice built about 11,000-7,000 years ago. Three periods of intensified activity have occurred during the past 3,000 years. The latest period, which was preceded by a 1,000-year quiescence, began with the dramatic 1955-56 eruption. This eruption, similar to that of St. Helens in 1980, produced a large open crater that was formed by collapse of the summit and an associated lateral blast. Subsequent episodic but ongoing lava-dome growth, accompanied by intermittent explosive activity and pyroclastic flows, has largely filled the 1956 crater.
Information Contacts: Kamchatka Volcanic Eruptions Response Team (KVERT), Far Eastern Branch, Russian Academy of Sciences, 9 Piip Blvd., Petropavlovsk-Kamchatsky, 683006, Russia (URL: http://www.kscnet.ru/ivs/kvert/); Kamchatka Volcanological Station, Kamchatka Branch of Geophysical Survey, (KB GS RAS), Klyuchi, Kamchatka Krai, Russia (URL: http://volkstat.ru/); Tokyo Volcanic Ash Advisory Center (VAAC), 1-3-4 Otemachi, Chiyoda-ku, Tokyo 100-8122, Japan (URL: http://ds.data.jma.go.jp/svd/vaac/data/); Hawai'i Institute of Geophysics and Planetology (HIGP) - MODVOLC Thermal Alerts System, School of Ocean and Earth Science and Technology (SOEST), Univ. of Hawai'i, 2525 Correa Road, Honolulu, HI 96822, USA (URL: http://modis.higp.hawaii.edu/); MIROVA (Middle InfraRed Observation of Volcanic Activity), a collaborative project between the Universities of Turin and Florence (Italy) supported by the Centre for Volcanic Risk of the Italian Civil Protection Department (URL: http://www.mirovaweb.it/); Copernicus Browser, Copernicus Data Space Ecosystem, European Space Agency (URL: https://dataspace.copernicus.eu/browser/).chr
Kilauea (United States) — January 2023 Cite this Report
Kilauea
United States
19.421°N, 155.287°W; summit elev. 1222 m
All times are local (unless otherwise noted)
Low-level lava effusions in the lava lake at Halema’uma’u during July-December 2022
Kīlauea is the southeastern-most volcano in Hawaii and overlaps the E flank of the Mauna Loa volcano. Its East Rift Zone (ERZ) has been intermittently active for at least 2,000 years. An extended eruption period began in January 1983 and was characterized by open lava lakes and lava flows from the summit caldera and the East Rift Zone. During May 2018 magma migrated into the Lower East Rift Zone (LERZ) and opened 24 fissures along a 6-km-long NE-trending fracture zone that produced lava flows traveling in multiple directions. As lava emerged from the fissures, the lava lake at Halema'uma'u drained and explosions sent ash plumes to several kilometers altitude (BGVN 43:10).
The current eruption period started during September 2021 and has recently been characterized by lava effusions, spatter, and sulfur dioxide emissions in the active Halema’uma’u lava lake (BGVN 47:08). Lava effusions, some spatter, and sulfur dioxide emissions have continued during this reporting period of July through December 2022 using daily reports, volcanic activity notices, and abundant photo, map, and video data from the US Geological Survey's (USGS) Hawaiian Volcano Observatory (HVO).
Summary of activity during July-December 2022. Low-level effusions have continued at the western vent of the Halema’uma’u crater during July through early December 2022. Occasional weak ooze-outs (also called lava break outs) would occur along the margins of the crater floor. The overall level of the active lava lake throughout the reporting period gradually increased due to infilling, however it stagnated in mid-September (table 13). During September through November, activity began to decline, though lava effusions persisted at the western vent. By 9 December, the active part of the lava lake had completely crusted over, and incandescence was no longer visible.
Table 13. Summary of measurements taken during overflights at Kīlauea that show a gradual increase in the active lava lake level and the volume of lava effused since 29 September 2021. Lower activity was reported during September-October. Data collected during July-December 2022. Courtesy of HVO.
| Date: |
Level of the active lava lake (m): |
Cumulative volume of lava effused (million cubic meters): |
| 7 Jul 2022 |
130 |
95 |
| 19 Jul 2022 |
133 |
98 |
| 4 Aug 2022 |
136 |
102 |
| 16 Aug 2022 |
137 |
104 |
| 12 Sep 2022 |
143 |
111 |
| 5 Oct 2022 |
143 |
111 |
| 28 Oct 2022 |
143 |
111 |
Activity during July 2022. Lava effusions were reported from the western vent in the Halema’uma’u crater, along with occasional weak ooze-outs along the margins of the crater floor. The height of the lava lake was variable due to deflation-inflation tilt events; for example, the lake level dropped approximately 3-4 m during a summit deflation-inflation event reported on 1 July. Webcam images taken during the night of 6-12 July showed intermittent low-level spattering at the western vent that rose less than 10 m above the vent (figure 519). Measurements made during an overflight on 7 July indicated that the crater floor was infilled about 130 m and that 95 million cubic meters of lava had been effused since 29 September 2021. A single, relatively small lava ooze-out was active to the S of the lava lake. Around midnight on 8 July there were two brief periods of lava overflow onto the lake margins. On 9 July lava ooze-outs were reported near the SE and NE edges of the crater floor and during 10-11 July they occurred near the E, NE, and NW edges. On 16 July crater incandescence was reported, though the ooze-outs and spattering were not visible. On 18 July overnight webcam images showed incandescence in the western vent complex and two ooze-outs were reported around 0000 and 0200 on 19 July. By 0900 there were active ooze-outs along the SW edge of the crater floor. Measurements made from an overflight on 19 July indicated that the crater floor was infilled about 133 m and 98 million cubic meters of lava had erupted since 29 September 2021 (figure 520). On 20 July around 1600 active ooze-outs were visible along the N edge of the crater, which continued through the next day. Extensive ooze-outs occurred along the W margin during 24 July until 1900; on 26 July minor ooze-outs were noted along the N margin. Minor spattering was visible on 29 July along the E margin of the lake. The sulfur dioxide emission rates ranged 650-2,800 tons per day (t/d), the higher of which was measured on 8 July (figure 519).
Activity during August 2022. The eruption continued in the Halema’uma’u crater at the western vent. According to HVO the lava in the active lake remained at the level of the bounding levees. Occasional minor ooze-outs were observed along the margins of the crater floor. Strong nighttime crater incandescence was visible after midnight on 6 August over the western vent cone. During 6-7 August scattered small lava lobes were active along the crater floor and incandescence persisted above the western vent through 9 August. During 7-9 August HVO reported a single lava effusion source was active along the NW margin of the crater floor. Measurements from an overflight on 4 August indicated that the crater floor was infilled about 136 m total and that 102 million cubic meters of lava had been erupted since the start of the eruption. Lava breakouts were reported along the N, NE, E, S, and W margins of the crater during 10-16 August. Another overflight survey conducted on 16 August indicated that the crater floor infilled about 137 m and 104 million cubic meters of lava had been erupted since September 2021. Measured sulfur dioxide emissions rates ranged 1,150-2,450 t/d, the higher of which occurred on 8 August.
Activity during September 2022. During September, lava effusion continued from the western vent into the active lava lake and onto the crater floor. Intermittent minor ooze-outs were reported through the month. A small ooze-out was visible on the W crater floor margin at 0220 on 2 September, which showed decreasing surface activity throughout the day, but remained active through 3 September. On 3 September around 1900 a lava outbreak occurred along the NW margin of the crater floor but had stopped by the evening of 4 September. Field crews monitoring the summit lava lake on 9 September observed spattering on the NE margin of the lake that rose no higher than 10 m, before falling back onto the lava lake crust (figure 521). Overflight measurements on 12 September indicated that the crater floor was infilled a total of 143 m and 111 million cubic meters of lava had been erupted since September 2021. Extensive breakouts in the W and N part of the crater floor were reported at 1600 on 20 September and continued into 26 September. The active part of the lava lake dropped by 10 m while other parts of the crater floor dropped by several meters. Summit tiltmeters recorded a summit seismic swarm of more than 80 earthquakes during 1500-1800 on 21 September, which occurred about 1.5 km below Halema’uma’u; a majority of these were less than Mw 2. By 22 September the active part of the lava lake was infilled about 2 m. On 23 September the western vent areas exhibited several small spatter cones with incandescent openings, along with weak, sporadic spattering (figure 522). The sulfur dioxide emission rate ranged from 930 t/d to 2,000 t/d, the higher of which was measured on 6 September.
Activity during October 2022. Activity during October declined slightly compared to previous months, though lava effusions persisted from the western vent into the active lava lake and onto the crater floor during October (figure 523). Slight variations in the lava lake were noted throughout the month. HVO reported that around 0600 on 3 October the level of the lava lake has lowered slightly. Overflight measurements taken on 5 October indicated that the crater floor was infilled a total of about 143 m and that 111 million cubic meters of lava had been effused since September 2021. During 6-7 October the lake gradually rose 0.5 m. Sulfur dioxide measurements made on 22 October had an emission rate of 700 t/d. Another overflight taken on 28 October showed that there was little to no change in the elevation of the crater floor: the crater floor was infilled a total of 143 m and 111 million cubic meters of lava had erupted since the start of the eruption.
Activity during November 2022. Activity remained low during November, though HVO reported that lava from the western vent continued to effuse into the active lava lake and onto the crater floor throughout the month. The rate of sulfur dioxide emissions during November ranged from 300-600 t/d, the higher amount of which occurred on 9 November.
Activity during December 2022. Similar low activity was reported during December, with lava effusing from the western vent into the active lava lake and onto the crater floor. During 4-5 December the active part of the lava lake was slightly variable in elevation and fluctuated within 1 m. On 9 December HVO reported that lava was no longer erupting from the western vent in the Halema’uma’u crater and that sulfur dioxide emissions had returned to near pre-eruption background levels; during 10-11 December, the lava lake had completely crusted over, and no incandescence was visible (figure 524). Time lapse camera images covering the 4-10 December showed that the crater floor showed weak deflation and no inflation. Some passive events of crustal overturning were reported during 14-15 December, which brought fresh incandescent lava to the lake surface. The sulfur dioxide emission rate was approximately 200 t/d on 14 December. A smaller overturn event on 17 December and another that occurred around 0000 and into the morning of 20 December were also detected. A small seismic swarm was later detected on 30 December.
Geologic Background. Kilauea overlaps the E flank of the massive Mauna Loa shield volcano in the island of Hawaii. Eruptions are prominent in Polynesian legends; written documentation since 1820 records frequent summit and flank lava flow eruptions interspersed with periods of long-term lava lake activity at Halemaumau crater in the summit caldera until 1924. The 3 x 5 km caldera was formed in several stages about 1,500 years ago and during the 18th century; eruptions have also originated from the lengthy East and Southwest rift zones, which extend to the ocean in both directions. About 90% of the surface of the basaltic shield volcano is formed of lava flows less than about 1,100 years old; 70% of the surface is younger than 600 years. The long-term eruption from the East rift zone between 1983 and 2018 produced lava flows covering more than 100 km2, destroyed hundreds of houses, and added new coastline.
Information Contacts: Hawaiian Volcano Observatory (HVO), U.S. Geological Survey, PO Box 51, Hawai'i National Park, HI 96718, USA (URL: http://hvo.wr.usgs.gov/).
Nyamulagira (DR Congo) — November 2023 Cite this Report
Nyamulagira
DR Congo
1.408°S, 29.2°E; summit elev. 3058 m
All times are local (unless otherwise noted)
Lava flows and thermal activity during May-October 2023
Nyamulagira (also known as Nyamuragira) is a shield volcano in the Democratic Republic of Congo with the summit truncated by a small 2 x 2.3 km caldera with walls up to about 100 m high. Documented eruptions have occurred within the summit caldera, as well as from numerous flank fissures and cinder cones. The current eruption period began in April 2018 and has more recently been characterized by summit crater lava flows and thermal activity (BGVN 48:05). This report describes lava flows and variable thermal activity during May through October 2023, based on information from the Observatoire Volcanologique de Goma (OVG) and various satellite data.
Lava lake activity continued during May. The MIROVA (Middle InfraRed Observation of Volcanic Activity) system recorded moderate-to-strong thermal activity throughout the reporting period; activity was more intense during May and October and relatively weaker from June through September (figure 95). The MODVOLC thermal algorithm, detected a total of 209 thermal alerts. There were 143 hotspots detected during May, eight during June, nine during September, and 49 during October. This activity was also reflected in infrared satellite images, where a lava flow was visible in the NW part of the crater on 7 May and strong activity was seen in the center of the crater on 4 October (figure 96). Another infrared satellite image taken on 12 May showed still active lava flows along the NW margin of the crater. According to OVG lava effusions were active during 7-29 May and moved to the N and NW parts of the crater beginning on 9 May. Strong summit crater incandescence was visible from Goma (27 km S) during the nights of 17, 19, and 20 May (figure 97). On 17 May there was an increase in eruptive activity, which peaked at 0100 on 20 May. Notable sulfur dioxide plumes drifted NW and W during 19-20 May (figure 98). Drone footage acquired in partnership with the USGS (United States Geological Survey) on 20 May captured images of narrow lava flows that traveled about 100 m down the W flank (figure 99). Data from the Rumangabo seismic station indicated a decreasing trend in activity during 17-21 May. Although weather clouds prevented clear views of the summit, a strong thermal signature on the NW flank was visible in an infrared satellite image on 22 May, based on an infrared satellite image. On 28 May the lava flows on the upper W flank began to cool and solidify. By 29 May seismicity returned to levels similar to those recorded before the 17 May increase. Lava effusion continued but was confined to the summit crater; periodic crater incandescence was observed.
Low-level activity was noted during June through October. On 1 June OVG reported that seismicity remained at lower levels and that crater incandescence had been absent for three days, though infrared satellite imagery showed continued lava effusion in the summit crater. The lava flows on the flanks covered an estimated 0.6 km2. Satellite imagery continued to show thermal activity confined to the lava lake through October (figure 96), although no lava flows or significant sulfur dioxide emissions were reported.
Geologic Background. Africa's most active volcano, Nyamulagira (also known as Nyamuragira), is a massive high-potassium basaltic shield about 25 km N of Lake Kivu and 13 km NNW of the steep-sided Nyiragongo volcano. The summit is truncated by a small 2 x 2.3 km caldera that has walls up to about 100 m high. Documented eruptions have occurred within the summit caldera, as well as from the numerous flank fissures and cinder cones. A lava lake in the summit crater, active since at least 1921, drained in 1938, at the time of a major flank eruption. Recent lava flows extend down the flanks more than 30 km from the summit as far as Lake Kivu; extensive lava flows from this volcano have covered 1,500 km2 of the western branch of the East African Rift.
Information Contacts: Observatoire Volcanologique de Goma (OVG), Departement de Geophysique, Centre de Recherche en Sciences Naturelles, Lwiro, D.S. Bukavu, DR Congo; Hawai'i Institute of Geophysics and Planetology (HIGP) - MODVOLC Thermal Alerts System, School of Ocean and Earth Science and Technology (SOEST), Univ. of Hawai'i, 2525 Correa Road, Honolulu, HI 96822, USA (URL: http://modis.higp.hawaii.edu/); MIROVA (Middle InfraRed Observation of Volcanic Activity), a collaborative project between the Universities of Turin and Florence (Italy) supported by the Centre for Volcanic Risk of the Italian Civil Protection Department (URL: http://www.mirovaweb.it/); NASA Global Sulfur Dioxide Monitoring Page, Atmospheric Chemistry and Dynamics Laboratory, NASA Goddard Space Flight Center (NASA/GSFC), 8800 Greenbelt Road, Goddard, Maryland, USA (URL: https://so2.gsfc.nasa.gov/); Copernicus Browser, Copernicus Data Space Ecosystem, European Space Agency (URL: https://dataspace.copernicus.eu/browser/); Charles Balagizi, Goma Volcano Observatory, Departement de Geophysique, Centre de Recherche en Sciences Naturelles, Lwiro, D.S. Bukavu, DR Congo.
Bagana (Papua New Guinea) — October 2023 Cite this Report
Bagana
Papua New Guinea
6.137°S, 155.196°E; summit elev. 1855 m
All times are local (unless otherwise noted)
Explosions, ash plumes, ashfall, and lava flows during April-September 2023
The remote volcano of Bagana is located in central Bougainville Island, Papua New Guinea. Recorded eruptions date back to 1842 and activity has consisted of effusive activity that has built a small lava dome in the summit crater and occasional explosions that produced pyroclastic flows. The most recent eruption has been ongoing since February 2000 and has produced occasional explosions, ash plumes, and lava flows. More recently, activity has been characterized by ongoing effusive activity and ash emissions (BGVN 48:04). This report updates activity from April through September 2023 that has consisted of explosions, ash plumes, ashfall, and lava flows, using information from the Darwin Volcanic Ash Advisory Center (VAAC) and satellite data.
An explosive eruption was reported on 7 July that generated a large gas-and-ash plume to high altitudes and caused significant ashfall in local communities; the eruption plume had reached upper tropospheric (16-18 km altitude) altitudes by 2200, according to satellite images. Sulfur dioxide plumes were detected in satellite images on 8 July and indicated that the plume was likely a mixture of gas, ice, and ash. A report issued by the Autonomous Bougainville Government (ABG) (Torokina District, Education Section) on 10 July noted that significant ash began falling during 2000-2100 on 7 July and covered most areas in the Vuakovi, Gotana (9 km SW), Koromaketo, Laruma (25 km W) and Atsilima (27 km NW) villages. Pyroclastic flows also occurred, according to ground-based reports; small deposits confined to one drainage were inspected by RVO during an overflight on 17 July and were confirmed to be from the 7 July event. Ashfall continued until 10 July and covered vegetation, which destroyed bushes and gardens and contaminated rivers and streams.
RVO reported another eruption on 14 July. The Darwin VAAC stated that an explosive event started around 0830 on 15 July and produced an ash plume that rose to 16.5 km altitude by 1000 and drifted N, according to satellite images. The plume continued to drift N and remained visible through 1900, and by 2150 it had dissipated.
Ashfall likely from both the 7 and 15 July events impacted about 8,111 people in Torokina (20 km SW), including Tsito/Vuakovi, Gotana, Koromaketo, Kenaia, Longkogari, Kenbaki, Piva (13 km SW), and Atsinima, and in the Tsitovi district, according to ABG. Significant ashfall was also reported in Ruruvu (22 km N) in the Wakunai District of Central Bougainville, though the thickness of these deposits could not be confirmed. An evacuation was called for the villages in Wakunai, where heavy ashfall had contaminated water sources; the communities of Ruruvu, Togarau, Kakarapaia, Karauturi, Atao, and Kuritaturi were asked to evacuate to a disaster center at the Wakunai District Station, and communities in Torokina were asked to evacuate to the Piva District station. According to a news article, more than 7,000 people needed temporary accommodations, with about 1,000 people in evacuation shelters. Ashfall had deposited over a broad area, contaminating water supplies, affecting crops, and collapsing some roofs and houses in rural areas. Schools were temporarily shut down. Intermittent ash emissions continued through the end of July and drifted NNW, NW, and SW. Fine ashfall was reported on the coast of Torokina, and ash plumes also drifted toward Laruma and Atsilima.
A small explosive eruption occurred at 2130 on 28 July that ejected material from the crater vents, according to reports from Torokina, in addition to a lava flow that contained two lobes. A second explosion was detected at 2157. Incandescence from the lava flow was visible from Piva as it descended the W flank around 2000 on 29 July (figure 47). The Darwin VAAC reported that a strong thermal anomaly was visible in satellite images during 30-31 July and that ash emissions rose to 2.4 km altitude and drifted WSW on 30 July. A ground report from RVO described localized emissions at 0900 on 31 July.
The Darwin VAAC reported that ash plumes were identified in satellite imagery at 0800 and 1220 on 12 August and rose to 2.1 km and 3 km altitude and drifted NW and W, respectively. A news report stated that aid was sent to more than 6,300 people that were adversely affected by the eruption. Photos taken during 17-19 August showed ash emissions rising no higher than 1 km above the summit and drifting SE. A small explosion generated an ash plume during the morning of 19 August. Deposits from small pyroclastic flows were also captured in the photos. Satellite images captured lava flows and pyroclastic flow deposits. Two temporary seismic stations were installed near Bagana on 17 August at distances of 7 km WSW (Vakovi station) and 11 km SW (Kepox station). The Kepox station immediately started to record continuous, low-frequency background seismicity.
Satellite data. Little to no thermal activity was detected during April through mid-July 2023; only one anomaly was recorded during early April and one during early June, according to MIROVA (Middle InfraRed Observation of Volcanic Activity) data (figure 48). Thermal activity increased in both power and frequency during mid-July through September, although there were still some short gaps in detected activity. MODVOLC also detected increased thermal activity during August; thermal hotspots were detected a total of five times on 19, 20, and 27 August. Weak thermal anomalies were also captured in infrared satellite images on clear weather days throughout the reporting period on 7, 12, and 17 April, 27 May, 1, 6, 16, and 31 July, and 19 September (figure 48); a strong thermal anomaly was visible on 31 July. Distinct sulfur dioxide plumes that drifted generally NW were intermittently captured by the TROPOMI instrument on the Sentinel-5P satellite and sometimes exceeded two Dobson Units (DUs) (figure 49).
Geologic Background. Bagana volcano, in a remote portion of central Bougainville Island, is frequently active. This massive symmetrical cone was largely constructed by an accumulation of viscous andesitic lava flows. The entire edifice could have been constructed in about 300 years at its present rate of lava production. Eruptive activity is characterized by non-explosive effusion of viscous lava that maintains a small lava dome in the summit crater, although occasional explosive activity produces pyroclastic flows. Lava flows with tongue-shaped lobes up to 50 m thick and prominent levees descend the flanks on all sides.
Information Contacts: Rabaul Volcano Observatory (RVO), Geohazards Management Division, Department of Mineral Policy and Geohazards Management (DMPGM), PO Box 3386, Kokopo, East New Britain Province, Papua New Guinea; Darwin Volcanic Ash Advisory Centre (VAAC), Bureau of Meteorology, Northern Territory Regional Office, PO Box 40050, Casuarina, NT 0811, Australia (URL: http://www.bom.gov.au/info/vaac/); MIROVA (Middle InfraRed Observation of Volcanic Activity), a collaborative project between the Universities of Turin and Florence (Italy) supported by the Centre for Volcanic Risk of the Italian Civil Protection Department (URL: http://www.mirovaweb.it/); Hawai'i Institute of Geophysics and Planetology (HIGP) - MODVOLC Thermal Alerts System, School of Ocean and Earth Science and Technology (SOEST), Univ. of Hawai'i, 2525 Correa Road, Honolulu, HI 96822, USA (URL: http://modis.higp.hawaii.edu/); NASA Global Sulfur Dioxide Monitoring Page, Atmospheric Chemistry and Dynamics Laboratory, NASA Goddard Space Flight Center (NASA/GSFC), 8800 Greenbelt Road, Goddard, Maryland, USA (URL: https://so2.gsfc.nasa.gov/); Copernicus Browser, Copernicus Data Space Ecosystem, European Space Agency (URL: https://dataspace.copernicus.eu/browser/); Autonomous Bougainville Government, P.O Box 322, Buka, AROB, PNG (URL: https://abg.gov.pg/); Andrew Tupper (Twitter: @andrewcraigtupp); Simon Carn, Geological and Mining Engineering and Sciences, Michigan Technological University, 1400 Townsend Drive, Houghton, MI 49931, USA (URL: http://www.volcarno.com/, Twitter: @simoncarn); Radio NZ (URL: https://www.rnz.co.nz/news/pacific/494464/more-than-7-000-people-in-bougainville-need-temporary-accommodation-after-eruption); USAID, 1300 Pennsylvania Ave, NW, Washington DC 20004, USA (URL: https://www.usaid.gov/pacific-islands/press-releases/aug-08-2023-united-states-provides-immediate-emergency-assistance-support-communities-affected-mount-bagana-volcanic-eruptions).
Mayon (Philippines) — October 2023 Cite this Report
Mayon
Philippines
13.257°N, 123.685°E; summit elev. 2462 m
All times are local (unless otherwise noted)
Lava flows, pyroclastic flows, ash emissions, and seismicity during April-September 2023
Mayon is located in the Philippines and has steep upper slopes capped by a small summit crater. Historical eruptions date back to 1616 CE that have been characterized by Strombolian eruptions, lava flows, pyroclastic flows, and mudflows. Eruptions mostly originated from a central conduit. Pyroclastic flows and mudflows have commonly descended many of the approximately 40 drainages that surround the volcano. The most recent eruption occurred during June through October 2022 and consisted of lava dome growth and gas-and-steam emissions (BGVN 47:12). A new eruption was reported during late April 2023 and has included lava flows, pyroclastic density currents, ash emissions, and seismicity. This report covers activity during April through September 2023 based on daily bulletins from the Philippine Institute of Volcanology and Seismology (PHIVOLCS).
During April through September 2023, PHIVOLCS reported near-daily rockfall events, frequent volcanic earthquakes, and sulfur dioxide measurements. Gas-and-steam emissions rose 100-900 m above the crater and drifted in different directions. Nighttime crater incandescence was often visible during clear weather and was accompanied by incandescent avalanches of material. Activity notably increased during June when lava flows were reported on the S, SE, and E flanks (figure 52). The MIROVA graph (Middle InfraRed Observation of Volcanic Activity) showed strong thermal activity coincident with these lava flows, which remained active through September (figure 53). According to the MODVOLC thermal algorithm, a total of 110 thermal alerts were detected during the reporting period: 17 during June, 40 during July, 27 during August, and 26 during September. During early June, pyroclastic density currents (PDCs) started to occur more frequently.
Low activity was reported during much of April and May; gas-and-steam emissions rose 100-900 m above the crater and generally drifted in different directions. A total of 52 rockfall events and 18 volcanic earthquakes were detected during April and 147 rockfall events and 13 volcanic events during May. Sulfur dioxide flux measurements ranged between 400-576 tons per day (t/d) during April, the latter of which was measured on 29 April and between 162-343 t/d during May, the latter of which was measured on 13 May.
Activity during June increased, characterized by lava flows, pyroclastic density currents (PDCs), crater incandescence and incandescent rockfall events, gas-and-steam emissions, and continued seismicity. Weather clouds often prevented clear views of the summit, but during clear days, moderate gas-and-steam emissions rose 100-2,500 m above the crater and drifted in multiple directions. A total of 6,237 rockfall events and 288 volcanic earthquakes were detected. The rockfall events often deposited material on the S and SE flanks within 700-1,500 m of the summit crater and ash from the events drifted SW, S, SE, NE, and E. Sulfur dioxide emissions ranged between 149-1,205 t/d, the latter of which was measured on 10 June. Short-term observations from EDM and electronic tiltmeter monitoring indicated that the upper slopes were inflating since February 2023. Longer-term ground deformation parameters based on EDM, precise leveling, continuous GPS, and electronic tilt monitoring indicated that the volcano remained inflated, especially on the NW and SE flanks. At 1000 on 5 June the Volcano Alert Level (VAL) was raised to 2 (on a 0-5 scale). PHIVOLCS noted that although low-level volcanic earthquakes, ground deformation, and volcanic gas emissions indicated unrest, the steep increase in rockfall frequency may indicate increased dome activity.
A total of 151 dome-collapse PDCs occurred during 8-9 and 11-30 June, traveled 500-2,000 m, and deposited material on the S flank within 2 km of the summit crater. During 8-9 June the VAL was raised to 3. At approximately 1947 on 11 June lava flow activity was reported; two lobes traveled within 500 m from the crater and deposited material on the S (Mi-isi), SE (Bonga), and E (Basud) flanks. Weak seismicity accompanied the lava flow and slight inflation on the upper flanks. This lava flow remained active through 30 June, moving down the S and SE flank as far as 2.5 km and 1.8 km, respectively and depositing material up to 3.3 km from the crater. During 15-16 June traces of ashfall from the PDCs were reported in Sitio Buga, Nabonton, City of Ligao and Purok, and San Francisco, Municipality of Guinobatan. During 28-29 June there were two PDCs generated by the collapse of the lava flow front, which generated a light-brown ash plume 1 km high. Satellite monitors detected significant concentrations of sulfur dioxide beginning on 29 June. On 30 June PDCs primarily affected the Basud Gully on the E flank, the largest of which occurred at 1301 and lasted eight minutes, based on the seismic record. Four PDCs generated between 1800 and 2000 that lasted approximately four minutes each traveled 3-4 km on the E flank and generated an ash plume that rose 1 km above the crater and drifted N and NW. Ashfall was recorded in Tabaco City.
Similar strong activity continued during July; slow lava effusion remained active on the S and SE flanks and traveled as far as 2.8 km and 2.8 km, respectively and material was deposited as far as 4 km from the crater. There was a total of 6,983 rockfall events and 189 PDCs that affected the S, SE, and E flanks. The volcano network detected a total of 2,124 volcanic earthquakes. Continuous gas-and-steam emissions rose 200-2,000 m above the crater and drifted in multiple directions. Sulfur dioxide emissions averaged 792-4,113 t/d, the latter of which was measured on 28 July. During 2-4 July three PDCs were generated from the collapse of the lava flow and resulting light brown plumes rose 200-300 m above the crater. Continuous tremor pulses were reported beginning at 1547 on 3 July through 7 July at 1200, at 2300 on 8 July and going through 0300 on 10 July, and at 2300 on 16 July, as recorded by the seismic network. During 6-9 July there were 10 lava flow-collapse-related PDCs that generated light brown plumes 300-500 m above the crater. During 10-11 July light ashfall was reported in some areas of Mabinit, Legazpi City, Budiao and Salvacion, Daraga, and Camalig, Albay. By 18 July the lava flow advanced 600 m on the E flank as well.
During 1733 on 18 July and 0434 on 19 July PHIVOLCS reported 30 “ashing” events, which are degassing events accompanied by audible thunder-like sounds and entrained ash at the crater, which produced short, dark plumes that drifted SW. These events each lasted 20-40 seconds, and plume heights ranged from 150-300 m above the crater, as recorded by seismic, infrasound, visual, and thermal monitors. Three more ashing events occurred during 19-20 July. Short-term observations from electronic tilt and GPS monitoring indicate deflation on the E lower flanks in early July and inflation on the NW middle flanks during the third week of July. Longer-term ground deformation parameters from EDM, precise leveling, continuous GPS, and electronic tilt monitoring indicated that the volcano was still generally inflated relative to baseline levels. A short-lived lava pulse lasted 28 seconds at 1956 on 21 July, which was accompanied by seismic and infrasound signals. By 22 July, the only lava flow that remained active was on the SE flank, and continued to extend 3.4 km, while those on the S and E flanks weakened markedly. One ashing event was detected during 30-31 July, whereas there were 57 detected during 31 July-1 August; according to PHIVOLCS beginning at approximately 1800 on 31 July eruptive activity was dominated by phases of intermittent ashing, as well as increased in the apparent rates of lava effusion from the summit crater. The ashing phases consisted of discrete events recorded as low-frequency volcanic earthquakes (LFVQ) typically 30 seconds in duration, based on seismic and infrasound signals. Gray ash plume rose 100 m above the crater and generally drifted NE. Shortly after these ashing events began, new lava began to effuse rapidly from the crater, feeding the established flowed on the SE, E, and E flanks and generating frequent rockfall events.
Intensified unrest persisted during August. There was a total of 4,141 rockfall events, 2,881 volcanic earthquakes, which included volcanic tremor events, 32 ashing events, and 101 PDCs detected throughout the month. On clear weather days, gas-and-steam emissions rose 300-1,500 m above the crater and drifted in different directions (figure 54). Sulfur dioxide emissions averaged 735-4,756 t/d, the higher value of which was measured on 16 August. During 1-2 August the rate of lava effusion decreased, but continued to feed the flows on the SE, S, and E flanks, maintaining their advances to 3.4 km, 2.8 km, and 1.1 km from the crater, respectively (figure 55). Rockfall and PDCs generated by collapses at the lava flow margins and from the summit dome deposited material within 4 km of the crater. During 3-4 August there were 10 tremor events detected that lasted 1-4 minutes. Short-lived lava pulse lasted 35 seconds and was accompanied by seismic and infrasound signals at 0442 on 6 August. Seven collapses were recorded at the front of the lava flow during 12-14 August.
During September, similar activity of slow lava effusion, PDCs, gas-and-steam emissions, and seismicity continued. There was a total of 4,452 rockfall events, 329 volcanic earthquakes, which included volcanic tremor events, two ashing events, and 85 PDCs recorded throughout the month. On clear weather days, gas-and-steam emissions rose 100-1,500 m above the crater and drifted in multiple directions. Sulfur dioxide emissions averaged 609-2,252 t/d, the higher average of which was measured on 6 September. Slow lava effusion continued advancing on the SE, S, and E flanks, maintaining lengths of 3.4 km, 2.8 km, and 1.1 km, respectively. Rockfall and PDC events generated by collapses along the lava flow margins and at the summit dome deposited material within 4 km of the crater.
Geologic Background. Symmetrical Mayon, which rises above the Albay Gulf NW of Legazpi City, is the most active volcano of the Philippines. The steep upper slopes are capped by a small summit crater. Recorded eruptions since 1616 CE range from Strombolian to basaltic Plinian, with cyclical activity beginning with basaltic eruptions, followed by longer periods of andesitic lava flows. Eruptions occur predominately from the central conduit and have also produced lava flows that travel far down the flanks. Pyroclastic density currents and mudflows have commonly swept down many of the approximately 40 ravines that radiate from the summit and have often damaged populated lowland areas. A violent eruption in 1814 killed more than 1,200 people and devastated several towns.
Information Contacts: Philippine Institute of Volcanology and Seismology (PHIVOLCS), Department of Science and Technology, University of the Philippines Campus, Diliman, Quezon City, Philippines (URL: http://www.phivolcs.dost.gov.ph/); MIROVA (Middle InfraRed Observation of Volcanic Activity), a collaborative project between the Universities of Turin and Florence (Italy) supported by the Centre for Volcanic Risk of the Italian Civil Protection Department (URL: http://www.mirovaweb.it/); Hawai'i Institute of Geophysics and Planetology (HIGP) - MODVOLC Thermal Alerts System, School of Ocean and Earth Science and Technology (SOEST), Univ. of Hawai'i, 2525 Correa Road, Honolulu, HI 96822, USA (URL: http://modis.higp.hawaii.edu/); Copernicus Browser, Copernicus Data Space Ecosystem, European Space Agency (URL: https://dataspace.copernicus.eu/browser/); William Rogers, Legazpi City, Albay Province, Philippines.
Nishinoshima (Japan) — October 2023 Cite this Report
Nishinoshima
Japan
27.247°N, 140.874°E; summit elev. 100 m
All times are local (unless otherwise noted)
Eruption plumes and gas-and-steam plumes during May-August 2023
Nishinoshima, located about 1,000 km S of Tokyo, is a small island in the Ogasawara Arc in Japan. The island is the summit of a massive submarine volcano that has prominent submarine peaks to the S, W, and NE. Eruptions date back to 1973 and the current eruption period began in October 2022. Recent activity has consisted of small ash plumes and fumarolic activity (BGVN 48:07). This report covers activity during May through August 2023, using information from monthly reports of the Japan Meteorological Agency (JMA) monthly reports and satellite data.
Activity during May through June was relatively low. The Japan Coast Guard (JCG) did overflights on 14 and 22 June and reported white gas-and-steam emissions rising 600 m and 1,200 m from the central crater of the pyroclastic cone, respectively (figure 125). In addition, multiple white gas-and-steam emissions rose from the inner rim of the W side of the crater and from the SE flank of the pyroclastic cone. Discolored brown-to-green water was observed around almost the entire perimeter of the island; on 22 June light green discolored water was observed off the S coast of the island.
Observations from the Himawari meteorological satellite confirmed an eruption on 9 and 10 July. An eruption plume rose 1.6 km above the crater and drifted N around 1300 on 9 July. Satellite images acquired at 1420 and 2020 on 9 July and at 0220 on 10 July showed continuing emissions that rose 1.3-1.6 km above the crater and drifted NE and N. The Tokyo VAAC reported that an ash plume seen by a pilot and identified in a satellite image at 0630 on 21 July rose to 3 km altitude and drifted S.
Aerial observations conducted by JCG on 8 August showed a white-and-gray plume rising from the central crater of the pyroclastic cone, and multiple white gas-and-steam emissions were rising from the inner edge of the western crater and along the NW-SE flanks of the island (figure 126). Brown-to-green discolored water was also noted around the perimeter of the island.
Intermittent low-to-moderate power thermal anomalies were recorded in the MIROVA graph (Middle InfraRed Observation of Volcanic Activity), showing an increase in both frequency and power beginning in July (figure 127). This increase in activity coincides with eruptive activity on 9 and 10 July, characterized by eruption plumes. According to the MODVOLC thermal alert algorithm, one thermal hotspot was recorded on 20 July. Weak thermal anomalies were also detected in infrared satellite imagery, accompanied by strong gas-and-steam plumes (figure 128).
Geologic Background. The small island of Nishinoshima was enlarged when several new islands coalesced during an eruption in 1973-74. Multiple eruptions that began in 2013 completely covered the previous exposed surface and continued to enlarge the island. The island is the summit of a massive submarine volcano that has prominent peaks to the S, W, and NE. The summit of the southern cone rises to within 214 m of the ocean surface 9 km SSE.
Information Contacts: Japan Meteorological Agency (JMA), 1-3-4 Otemachi, Chiyoda-ku, Tokyo 100-8122, Japan (URL: http://www.jma.go.jp/jma/indexe.html); Tokyo Volcanic Ash Advisory Center (VAAC), 1-3-4 Otemachi, Chiyoda-ku, Tokyo 100-8122, Japan (URL: http://ds.data.jma.go.jp/svd/vaac/data/); MIROVA (Middle InfraRed Observation of Volcanic Activity), a collaborative project between the Universities of Turin and Florence (Italy) supported by the Centre for Volcanic Risk of the Italian Civil Protection Department (URL: http://www.mirovaweb.it/); Copernicus Browser, Copernicus Data Space Ecosystem, European Space Agency (URL: https://dataspace.copernicus.eu/browser/).
Krakatau (Indonesia) — October 2023 Cite this Report
Krakatau
Indonesia
6.1009°S, 105.4233°E; summit elev. 285 m
All times are local (unless otherwise noted)
White gas-and-steam plumes and occasional ash plumes during May-August 2023
Krakatau is located in the Sunda Strait between Java and Sumatra, Indonesia. Caldera collapse during the catastrophic 1883 eruption destroyed Danan and Perbuwatan cones and left only a remnant of Rakata. The post-collapse cone of Anak Krakatau (Child of Krakatau) was constructed within the 1883 caldera at a point between the former Danan and Perbuwatan cones; it has been the site of frequent eruptions since 1927. The current eruption period began in May 2021 and has recently consisted of Strombolian eruptions and ash plumes (BGVN 48:07). This report describes lower levels of activity consisting of ash and white gas-and-steam plumes during May through August 2023, based on information provided by the Indonesian Center for Volcanology and Geological Hazard Mitigation, referred to as Pusat Vulkanologi dan Mitigasi Bencana Geologi (PVMBG), MAGMA Indonesia, and satellite data.
Activity was relatively low during May and June. Daily white gas-and-steam emissions rose 25-200 m above the crater and drifted in different directions. Five ash plumes were detected at 0519 on 10 May, 1241 on 11 May, 0920 on 12 May, 2320 on 12 May, and at 0710 on 13 May, and rose 1-2.5 km above the crater and drifted SW. A webcam image taken on 12 May showed ejection of incandescent material above the vent. A total of nine ash plumes were detected during 6-11 June: at 1434 and 00220 on 6 and 7 June the ash plumes rose 500 m above the crater and drifted NW, at 1537 on 8 June the ash plume rose 1 km above the crater and drifted SW, at 0746 and at 0846 on 9 June the ash plumes rose 800 m and 3 km above the crater and drifted SW, respectively, at 0423, 1431, and 1750 on 10 June the ash plumes rose 2 km, 1.5 km, and 3.5 km above the crater and drifted NW, respectively, and at 0030 on 11 June an ash plume rose 2 km above the crater and drifted NW. Webcam images taken on 10 and 11 June at 0455 and 0102, respectively, showed incandescent material ejected above the vent. On 19 June an ash plume at 0822 rose 1.5 km above the crater and drifted SE.
Similar low activity of white gas-and-steam emissions and few ash plumes were reported during July and August. Daily white gas-and-steam emissions rose 25-300 m above the crater and drifted in multiple directions. Three ash plumes were reported at 0843, 0851, and 0852 on 20 July that rose 500-2,000 m above the crater and drifted NW.
The MIROVA (Middle InfraRed Observation of Volcanic Activity) graph of MODIS thermal anomaly data showed intermittent low-to-moderate power thermal anomalies during May through August 2023 (figure 140). Although activity was often obscured by weather clouds, a thermal anomaly was visible in an infrared satellite image of the crater on 12 May, accompanied by an eruption plume that drifted SW (figure 141).
Geologic Background. The renowned Krakatau (frequently mis-named as Krakatoa) volcano lies in the Sunda Strait between Java and Sumatra. Collapse of an older edifice, perhaps in 416 or 535 CE, formed a 7-km-wide caldera. Remnants of that volcano are preserved in Verlaten and Lang Islands; subsequently the Rakata, Danan, and Perbuwatan cones were formed, coalescing to create the pre-1883 Krakatau Island. Caldera collapse during the catastrophic 1883 eruption destroyed Danan and Perbuwatan, and left only a remnant of Rakata. This eruption caused more than 36,000 fatalities, most as a result of tsunamis that swept the adjacent coastlines of Sumatra and Java. Pyroclastic surges traveled 40 km across the Sunda Strait and reached the Sumatra coast. After a quiescence of less than a half century, the post-collapse cone of Anak Krakatau (Child of Krakatau) was constructed within the 1883 caldera at a point between the former Danan and Perbuwatan cones. Anak Krakatau has been the site of frequent eruptions since 1927.
Information Contacts: Pusat Vulkanologi dan Mitigasi Bencana Geologi (PVMBG, also known as Indonesian Center for Volcanology and Geological Hazard Mitigation, CVGHM), Jalan Diponegoro 57, Bandung 40122, Indonesia (URL: http://www.vsi.esdm.go.id/); MAGMA Indonesia, Kementerian Energi dan Sumber Daya Mineral (URL: https://magma.esdm.go.id/v1); MIROVA (Middle InfraRed Observation of Volcanic Activity), a collaborative project between the Universities of Turin and Florence (Italy) supported by the Centre for Volcanic Risk of the Italian Civil Protection Department (URL: http://www.mirovaweb.it/); Copernicus Browser, Copernicus Data Space Ecosystem, European Space Agency (URL: https://dataspace.copernicus.eu/browser/).
Villarrica (Chile) — October 2023 Cite this Report
Villarrica
Chile
39.42°S, 71.93°W; summit elev. 2847 m
All times are local (unless otherwise noted)
Strombolian activity, gas-and-ash emissions, and crater incandescence during April-September 2023
Villarrica, in central Chile, consists of a 2-km-wide caldera that formed about 3,500 years ago and is located at the base of the presently active cone at the NW margin of a 6-km-wide caldera. Historical eruptions eruptions date back to 1558 and have been characterized by mild-to-moderate explosive activity with occasional lava effusions. The current eruption period began in December 2014 and has recently consisted of nighttime crater incandescence, ash emissions, and seismicity (BGVN 48:04). This report covers activity during April through September 2023 and describes occasional Strombolian activity, gas-and-ash emissions, and nighttime crater incandescence. Information for this report primarily comes from the Southern Andes Volcano Observatory (Observatorio Volcanológico de Los Andes del Sur, OVDAS), part of Chile's National Service of Geology and Mining (Servicio Nacional de Geología y Minería, SERNAGEOMIN) and satellite data.
Seismicity during April consisted of long period (LP) events and tremor (TRE); a total of 9,413 LP-type events and 759 TR-type events were detected throughout the month. Nighttime crater incandescence persisted and was visible in the degassing column. Sulfur dioxide data was obtained using Differential Absorption Optical Spectroscopy Equipment (DOAS) that showed an average value of 1,450 ± 198 tons per day (t/d) during 1-15 April and 1,129 ± 201 t/d during 16-30 April, with a maximum daily value of 2,784 t/d on 9 April. Gas-and-steam emissions of variable intensities rose above the active crater as high as 1.3 km above the crater on 13 April. Strombolian explosions were not observed and there was a slight decrease in the lava lake level.
There were 14,123 LP-type events and 727 TR-type events detected during May. According to sulfur dioxide measurements taken with DOAS equipment, the active crater emitted an average value of 1,826 ± 482 t/d during 1-15 May and 912 ± 41 t/d during 16-30 May, with a daily maximum value of 5,155 t/d on 13 May. Surveillance cameras showed continuous white gas-and-steam emissions that rose as high as 430 m above the crater on 27 May. Nighttime incandescence illuminated the gas column less than 300 m above the crater rim was and no pyroclastic emissions were reported. A landslide was identified on 13 May on the E flank of the volcano 50 m from the crater rim and extending 300 m away; SERNAGEOMIN noted that this event may have occurred on 12 May. During the morning of 27 and 28 May minor Strombolian explosions characterized by incandescent ejecta were recorded at the crater rim; the last reported Strombolian explosions had occurred at the end of March.
Seismic activity during June consisted of five volcano-tectonic (VT)-type events, 21,606 LP-type events, and 2,085 TR-type events. The average value of sulfur dioxide flux obtained by DOAS equipment was 1,420 ± 217 t/d during 1-15 June and 2,562 ± 804 t/d, with a maximum daily value of 4,810 t/d on 17 June. White gas-and-steam emissions rose less than 480 m above the crater; frequent nighttime crater incandescence was reflected in the degassing plume. On 12 June an emission rose 100 m above the crater and drifted NNW. On 15 June one or several emissions resulted in ashfall to the NE as far as 5.5 km from the crater, based on a Skysat satellite image. Several Strombolian explosions occurred within the crater; activity on 15 June was higher energy and ejected blocks 200-300 m on the NE slope. Surveillance cameras showed white gas-and-steam emissions rising 480 m above the crater on 16 June. On 19 and 24 June low-intensity Strombolian activity was observed, ejecting material as far as 200 m from the center of the crater to the E.
During July, seismicity included 29,319 LP-type events, 3,736 TR-type events, and two VT-type events. DOAS equipment recorded two days of sulfur dioxide emissions of 4,220 t/d and 1,009 t/d on 1 and 13 July, respectively. Constant nighttime incandescence was also recorded and was particularly noticeable when accompanied by eruptive columns on 12 and 16 July. Minor explosive events were detected in the crater. According to Skysat satellite images taken on 12, 13, and 16 July, ashfall deposits were identified 155 m S of the crater. According to POVI, incandescence was visible from two vents on the crater floor around 0336 on 12 July. Gas-and-ash emissions rose as high as 1.2 km above the crater on 13 July and drifted E and NW. A series of gas-and-steam pulses containing some ash deposited material on the upper E flank around 1551 on 13 July. During 16-31 July, average sulfur dioxide emissions of 1,679 ± 406 t/d were recorded, with a maximum daily value of 2,343 t/d on 28 July. Fine ash emissions were also reported on 16, 17, and 23 July.
Seismicity persisted during August, characterized by 27,011 LP-type events, 3,323 TR-type events, and three VT-type events. The average value of sulfur dioxide measurements taken during 1-15 August was 1,642 ± 270 t/d and 2,207 ± 4,549 t/d during 16-31 August, with a maximum daily value of 3,294 t/d on 27 August. Nighttime crater incandescence remained visible in degassing columns. White gas-and-steam emissions rose 480 m above the crater on 6 August. According to a Skysat satellite image from 6 August, ash accumulation was observed proximal to the crater and was mainly distributed toward the E slope. White gas-and-steam emissions rose 320 m above the crater on 26 August. Nighttime incandescence and Strombolian activity that generated ash emissions were reported on 27 August.
Seismicity during September was characterized by five VT-type events, 12,057 LP-type events, and 2,058 TR-type events. Nighttime incandescence persisted. On 2 September an ash emission rose 180 m above the crater and drifted SE at 1643 (figure 125) and a white gas-and-steam plume rose 320 m above the crater. According to the Buenos Aires VAAC, periods of continuous gas-and-ash emissions were visible in webcam images from 1830 on 2 September to 0110 on 3 September. Strombolian activity was observed on 2 September and during the early morning of 3 September, the latter event of which generated an ash emission that rose 60 m above the crater and drifted 100 m from the center of the crater to the NE and SW. Ashfall was reported to the SE and S as far as 750 m from the crater. The lava lake was active during 3-4 September and lava fountaining was visible for the first time since 26 March 2023, according to POVI. Fountains captured in webcam images at 2133 on 3 September and at 0054 on 4 September rose as high as 60 m above the crater rim and ejected material onto the upper W flank. Sulfur dioxide flux of 1,730 t/d and 1,281 t/d was measured on 3 and 4 September, respectively, according to data obtained by DOAS equipment.
Strong Strombolian activity and larger gas-and-ash plumes were reported during 18-20 September. On 18 September activity was also associated with energetic LP-type events and notable sulfur dioxide fluxes (as high as 4,277 t/d). On 19 September Strombolian activity and incandescence were observed. On 20 September at 0914 ash emissions rose 50 m above the crater and drifted SSE, accompanied by Strombolian activity that ejected material less than 100 m SSE, causing fall deposits on that respective flank. SERNAGEOMIN reported that a Planet Scope satellite image taken on 20 September showed the lava lake in the crater, measuring 32 m x 35 m and an area of 0.001 km2. Several ash emissions were recorded at 0841, 0910, 1251, 1306, 1312, 1315, and 1324 on 23 September and rose less than 150 m above the crater. The sulfur dioxide flux value was 698 t/d on 23 September and 1,097 t/d on 24 September. On 24 September the Volcanic Alert Level (VAL) was raised to Orange (the third level on a four-color scale). SENAPRED maintained the Alert Level at Yellow (the middle level on a three-color scale) for the communities of Villarrica, Pucón (16 km N), Curarrehue, and Panguipulli.
During 24-25 September there was an increase in seismic energy (observed at TR-events) and acoustic signals, characterized by 1 VT-type event, 213 LP-type events, and 124 TR-type events. Mainly white gas-and-steam emissions, in addition to occasional fine ash emissions were recorded. During the early morning of 25 September Strombolian explosions were reported and ejected material 250 m in all directions, though dominantly toward the NW. On 25 September the average value of sulfur dioxide flux was 760 t/d. Seismicity during 25-30 September consisted of five VT-type events, 1,937 LP-type events, and 456 TR-type events.
During 25-29 September moderate Strombolian activity was observed and ejected material as far as the crater rim. In addition, ash pulses lasting roughly 50 minutes were observed around 0700 and dispersed ENE. During 26-27 September a TR episode lasted 6.5 hours and was accompanied by discrete acoustic signals. Satellite images from 26 September showed a spatter cone on the crater floor with one vent that measured 10 x 14 m and a smaller vent about 35 m NE of the cone. SERNAGEOMIN reported an abundant number of bomb-sized blocks up to 150 m from the crater, as well as impact marks on the snow, which indicated explosive activity. A low-altitude ash emission was observed drifting NW around 1140 on 28 September, based on webcam images. Between 0620 and 0850 on 29 September an ash emission rose 60 m above the crater and drifted NW. During an overflight taken around 1000 on 29 September scientists observed molten material in the vent, a large accumulation of pyroclasts inside the crater, and energetic degassing, some of which contained a small amount of ash. Block-sized pyroclasts were deposited on the internal walls and near the crater, and a distal ash deposit was also visible. The average sulfur dioxide flux measured on 28 September was 344 t/d. Satellite images taken on 29 September ashfall was deposited roughly 3 km WNW from the crater and nighttime crater incandescence remained visible. The average sulfur dioxide flux value from 29 September was 199 t/d. On 30 September at 0740 a pulsating ash emission rose 1.1 km above the crater and drifted NNW (figure 126). Deposits on the S flank extended as far as 4.5 km from the crater rim, based on satellite images from 30 September.
Infrared MODIS satellite data processed by MIROVA (Middle InfraRed Observation of Volcanic Activity) showed intermittent thermal activity during April through September, with slightly stronger activity detected during late September (figure 127). Small clusters of thermal activity were detected during mid-June, early July, early August, and late September. According to the MODVOLC thermal alert system, a total of four thermal hotspots were detected on 7 July and 3 and 23 September. This activity was also intermittently captured in infrared satellite imagery on clear weather days (figure 128).
Geologic Background. The glacier-covered Villarrica stratovolcano, in the northern Lakes District of central Chile, is ~15 km south of the city of Pucon. A 2-km-wide caldera that formed about 3,500 years ago is located at the base of the presently active, dominantly basaltic to basaltic andesite cone at the NW margin of a 6-km-wide Pleistocene caldera. More than 30 scoria cones and fissure vents are present on the flanks. Plinian eruptions and pyroclastic flows that have extended up to 20 km from the volcano were produced during the Holocene. Lava flows up to 18 km long have issued from summit and flank vents. Eruptions documented since 1558 CE have consisted largely of mild-to-moderate explosive activity with occasional lava effusion. Glaciers cover 40 km2 of the volcano, and lahars have damaged towns on its flanks.
Information Contacts: Servicio Nacional de Geología y Minería (SERNAGEOMIN), Observatorio Volcanológico de Los Andes del Sur (OVDAS), Avda Sta María No. 0104, Santiago, Chile (URL: http://www.sernageomin.cl/); Proyecto Observación Villarrica Internet (POVI) (URL: http://www.povi.cl/); Sistema y Servicio Nacional de Prevención y Repuesta Ante Desastres (SENAPRED), Av. Beauchef 1671, Santiago, Chile (URL: https://web.senapred.cl/); Buenos Aires Volcanic Ash Advisory Center (VAAC), Servicio Meteorológico Nacional-Fuerza Aérea Argentina, 25 de mayo 658, Buenos Aires, Argentina (URL: http://www.smn.gov.ar/vaac/buenosaires/inicio.php); MIROVA (Middle InfraRed Observation of Volcanic Activity), a collaborative project between the Universities of Turin and Florence (Italy) supported by the Centre for Volcanic Risk of the Italian Civil Protection Department (URL: http://www.mirovaweb.it/); Hawai'i Institute of Geophysics and Planetology (HIGP) - MODVOLC Thermal Alerts System, School of Ocean and Earth Science and Technology (SOEST), Univ. of Hawai'i, 2525 Correa Road, Honolulu, HI 96822, USA (URL: http://modis.higp.hawaii.edu/); Copernicus Browser, Copernicus Data Space Ecosystem, European Space Agency (URL: https://dataspace.copernicus.eu/browser/).
Merapi (Indonesia) — October 2023 Cite this Report
Merapi
Indonesia
7.54°S, 110.446°E; summit elev. 2910 m
All times are local (unless otherwise noted)
Frequent incandescent avalanches during April-September 2023
Merapi, located just north of the major city of Yogyakarta in central Java, Indonesia, has had activity within the last 20 years characterized by pyroclastic flows and lahars accompanying growth and collapse of the steep-sided active summit lava dome. The current eruption period began in late December 2020 and has more recently consisted of ash plumes, intermittent incandescent avalanches of material, and pyroclastic flows (BGVN 48:04). This report covers activity during April through September 2023, based on information from Balai Penyelidikan dan Pengembangan Teknologi Kebencanaan Geologi (BPPTKG), the Center for Research and Development of Geological Disaster Technology, a branch of PVMBG which specifically monitors Merapi. Additional information comes from the Pusat Vulkanologi dan Mitigasi Bencana Geologi (PVMBG, also known as Indonesian Center for Volcanology and Geological Hazard Mitigation, CVGHM), MAGMA Indonesia, the Darwin Volcanic Ash Advisory Centre (VAAC), and various satellite data.
Activity during April through September 2023 primarily consisted of incandescent avalanches of material that mainly affected the SW and W flanks and traveled as far as 2.3 km from the summit (table 25) and white gas-and-steam emissions that rose 10-1,000 m above the crater.
Table 25. Monthly summary of avalanches and avalanche distances recorded at Merapi during April through September 2023. The number of reported avalanches does not include instances where possible avalanches were heard but could not be visually confirmed as a result of inclement weather. Data courtesy of BPPTKG (April-September 2023 daily reports).
| Month |
Average number of avalanches per day |
Distance avalanches traveled (m) |
| Apr 2023 |
19 |
1,200-2,000 |
| May 2023 |
22 |
500-2,000 |
| Jun 2023 |
18 |
1,200-2,000 |
| Jul 2023 |
30 |
300-2,000 |
| Aug 2023 |
25 |
400-2,300 |
| Sep 2023 |
23 |
600-2,000 |
BPPTKG reported that during April and May white gas-and-steam emissions rose 10-750 m above the crater, incandescent avalanches descended 500-2,000 m on the SW and W flanks (figure 135). Cloudy weather often prevented clear views of the summit, and sometimes avalanches could not be confirmed. According to a webcam image, a pyroclastic flow was visible on 17 April at 0531. During the week of 28 April and 4 May a pyroclastic flow was reported on the SW flank, traveling up to 2.5 km. According to a drone overflight taken on 17 May the SW lava dome volume was an estimated 2,372,800 cubic meters and the dome in the main crater was an estimated 2,337,300 cubic meters.
During June and July similar activity persisted with white gas-and-steam emissions rising 10-350 m above the crater and frequent incandescent avalanches that traveled 300-2,000 m down the SW, W, and S flanks (figure 136). Based on an analysis of aerial photos taken on 24 June the volume of the SW lava dome was approximately 2.5 million cubic meters. A pyroclastic flow was observed on 5 July that traveled 2.7 km on the SW flank. According to the Darwin VAAC multiple minor ash plumes were identified in satellite images on 19 July that rose to 3.7 km altitude and drifted S and SW. During 22, 25, and 26 July a total of 17 avalanches descended as far as 1.8 km on the S flank.
Frequent white gas-and-steam emissions continued during August and September, rising 10-450 m above the crater. Incandescent avalanches mainly affected the SW and W flanks and traveled 400-2,300 m from the vent (figure 137). An aerial survey conducted on 10 August was analyzed and reported that estimates of the SW dome volume was 2,764,300 cubic meters and the dome in the main crater was 2,369,800 cubic meters.
Frequent and moderate-power thermal activity continued throughout the reporting period, according to a MIROVA (Middle InfraRed Observation of Volcanic Activity) analysis of MODIS satellite data (figure 138). There was an increase in the number of detected anomalies during mid-May. The MODVOLC thermal algorithm recorded a total of 47 thermal hotspots: six during April, nine during May, eight during June, 15 during July, four during August, and five during September. Some of this activity was captured in infrared satellite imagery on clear weather days, sometimes accompanied by incandescent material on the SW flank (figure 139).
Geologic Background. Merapi, one of Indonesia's most active volcanoes, lies in one of the world's most densely populated areas and dominates the landscape immediately north of the major city of Yogyakarta. It is the youngest and southernmost of a volcanic chain extending NNW to Ungaran volcano. Growth of Old Merapi during the Pleistocene ended with major edifice collapse perhaps about 2,000 years ago, leaving a large arcuate scarp cutting the eroded older Batulawang volcano. Subsequent growth of the steep-sided Young Merapi edifice, its upper part unvegetated due to frequent activity, began SW of the earlier collapse scarp. Pyroclastic flows and lahars accompanying growth and collapse of the steep-sided active summit lava dome have devastated cultivated lands on the western-to-southern flanks and caused many fatalities.
Information Contacts: Balai Penyelidikan dan Pengembangan Teknologi Kebencanaan Geologi (BPPTKG), Center for Research and Development of Geological Disaster Technology (URL: http://merapi.bgl.esdm.go.id/, Twitter: @BPPTKG); MAGMA Indonesia, Kementerian Energi dan Sumber Daya Mineral (URL: https://magma.esdm.go.id/v1); Pusat Vulkanologi dan Mitigasi Bencana Geologi (PVMBG, also known as Indonesian Center for Volcanology and Geological Hazard Mitigation, CVGHM), Jalan Diponegoro 57, Bandung 40122, Indonesia (URL: http://www.vsi.esdm.go.id/); Darwin Volcanic Ash Advisory Centre (VAAC), Bureau of Meteorology, Northern Territory Regional Office, PO Box 40050, Casuarina, NT 0811, Australia (URL: http://www.bom.gov.au/info/vaac/); MIROVA (Middle InfraRed Observation of Volcanic Activity), a collaborative project between the Universities of Turin and Florence (Italy) supported by the Centre for Volcanic Risk of the Italian Civil Protection Department (URL: http://www.mirovaweb.it/); Hawai'i Institute of Geophysics and Planetology (HIGP) - MODVOLC Thermal Alerts System, School of Ocean and Earth Science and Technology (SOEST), Univ. of Hawai'i, 2525 Correa Road, Honolulu, HI 96822, USA (URL: http://modis.higp.hawaii.edu/); Copernicus Browser, Copernicus Data Space Ecosystem, European Space Agency (URL: https://dataspace.copernicus.eu/browser/); Øystein Lund Andersen (URL: https://www.oysteinlundandersen.com/, https://twitter.com/oysteinvolcano).
Ebeko
Russia
50.686°N, 156.014°E; summit elev. 1103 m
All times are local (unless otherwise noted)
Moderate explosive activity with ash plumes continued during June-November 2023
Ebeko, located on the N end of Paramushir Island in Russia’s Kuril Islands just S of the Kamchatka Peninsula, consists of three summit craters along a SSW-NNE line at the northern end of a complex of five volcanic cones. Observed eruptions date back to the late 18th century and have been characterized as small-to-moderate explosions from the summit crater, accompanied by intense fumarolic activity. The current eruptive period began in June 2022, consisting of frequent explosions, ash plumes, and thermal activity (BGVN 47:10, 48:06). This report covers similar activity during June-November 2023, based on information from the Kamchatka Volcanic Eruptions Response Team (KVERT) and satellite data.
Moderate explosive activity continued during June-November 2023 (figures 50 and 51). According to visual data from Severo-Kurilsk, explosions sent ash 2-3.5 km above the summit (3-4.5 km altitude) during most days during June through mid-September. Activity after mid-September was slightly weaker, with ash usually reaching less than 2 km above the summit. According to KVERT the volcano in October and November was, with a few exceptions, either quiet or obscured by clouds that prevented satellite observations. KVERT issued Volcano Observatory Notices for Aviation (VONA) on 8 and 12 June, 13 and 22 July, 3 and 21 August, and 31 October warning of potential aviation hazards from ash plumes drifting 3-15 km from the volcano. Based on satellite data, KVERT reported a persistent thermal anomaly whenever weather clouds permitted viewing.
Geologic Background. The flat-topped summit of the central cone of Ebeko volcano, one of the most active in the Kuril Islands, occupies the northern end of Paramushir Island. Three summit craters located along a SSW-NNE line form Ebeko volcano proper, at the northern end of a complex of five volcanic cones. Blocky lava flows extend west from Ebeko and SE from the neighboring Nezametnyi cone. The eastern part of the southern crater contains strong solfataras and a large boiling spring. The central crater is filled by a lake about 20 m deep whose shores are lined with steaming solfataras; the northern crater lies across a narrow, low barrier from the central crater and contains a small, cold crescentic lake. Historical activity, recorded since the late-18th century, has been restricted to small-to-moderate explosive eruptions from the summit craters. Intense fumarolic activity occurs in the summit craters, on the outer flanks of the cone, and in lateral explosion craters.
Information Contacts: Kamchatka Volcanic Eruptions Response Team (KVERT), Far Eastern Branch, Russian Academy of Sciences, 9 Piip Blvd., Petropavlovsk-Kamchatsky, 683006, Russia (URL: http://www.kscnet.ru/ivs/kvert/).
Search Bulletin Archive by Publication Date
Select a month and year from the drop-downs and click "Show Issue" to have that issue displayed in this tab.
The default month and year is the latest issue available.
Bulletin of the Global Volcanism Network - Volume 28, Number 09 (September 2003)
Managing Editor: Edward Venzke
Ambrym (Vanuatu)
Lava visible in six vents during September; lava lake activity and ash emissions
Anatahan (United States)
Very low seismicity with no ash emissions; geothermal activity in the crater
Arenal (Costa Rica)
Pyroclastic-flow sequence down the N and NE flanks on 5 September
Barva (Costa Rica)
Two crater lakes visited in December 2002
Concepcion (Nicaragua)
Three periods of elevated seismicity between June 2002 and August 2003
Dieng Volcanic Complex (Indonesia)
One shallow volcanic earthquake and a gas plume in early August
Dukono (Indonesia)
Ash explosions in late July through September generate plumes up to 250 m high
Fournaise, Piton de la (France)
Seismic crisis and a new SSW-flank fissure on 30 September
Gamalama (Indonesia)
Several small ash explosions and gas emission through late September
Karangetang (Indonesia)
Ash explosions and lava avalanches in July; overall activity level declines
Kilauea (United States)
Active surface lava flows from June through mid-October
Lamington (Papua New Guinea)
High-frequency earthquakes began in early July
Manam (Papua New Guinea)
Minor ashfall from Main Crater activity during May
Mayon (Philippines)
Elevated sulfur-dioxide flux after mid-September; crater glow in October
Momotombo (Nicaragua)
Some seismic swarms and tornillos; stable fumarole temperatures
Novarupta (United States)
Strong winds resuspend old ash deposits, causing a large plume and distant ashfall
Nyamulagira (DR Congo)
Long-period earthquakes and swarms in July 2003
Nyiragongo (DR Congo)
Continuing lava lake activity through mid-August
Poas (Costa Rica)
Hydrothermally active repose continues through 2002
Rabaul (Papua New Guinea)
Frequent ash plumes from March through early October 2003
Semeru (Indonesia)
Frequent ash explosions continue through September
Tandikat-Singgalang (Indonesia)
Brief episode of increased seismicity during January-February 2002
Tangkoko-Duasudara (Indonesia)
Volcanic earthquakes during October 2002-January 2003
Ulawun (Papua New Guinea)
White vapor emissions from the main crater; offshore effervescence
Witori (Papua New Guinea)
Minor seismicity and vapor emissions; no lava effusion as of 22 May
Ambrym (Vanuatu) — September 2003 Cite this Report
Ambrym
Vanuatu
16.25°S, 168.12°E; summit elev. 1334 m
All times are local (unless otherwise noted)
Lava visible in six vents during September; lava lake activity and ash emissions
John Seach previously reported his observations of the Ambrym caldera made during a visit in December 2002 (BGVN 27:12). This report contains his observations of the caldera during a 7-11 September 2003 visit and flyovers on 6 and 13 September. The level of activity during September 2003, with visible lava in six vents, was higher than that during his previous visit.
Observations of Benbow. During the 6 September flyover, two white plumes were rising 200 m above the crater rim and drifting NW. On the evening of 7 September, orange glows were seen from the caldera edge (3 km SE). A strong glow originated N of the crater and the central crater pit produced a less intense fluctuating glow. During the 13 September flyover, both pits continued to emit white and light-brown plumes to 200 m above the rim.
Observations of Mbogon Niri Mbwelesu. Large white vapor emissions from the collapse pit formed mushroom-shaped clouds on 6 September that drifted W and attained a height of 300 m. A visit to the S rim on 7 September showed a weak orange glow and copious gas emissions. On 8 September, observations from the N rim showed the pit full of swirling brown and white vapor. The NW wall was stained with yellow and red deposits, and pungent sulfurous gases were being emitted. Loud, rhythmic degassing sounds were heard every few seconds. The bottom of the pit was visible on 10 September, allowing views of two glowing red holes 150 m below the rim separated by a small wall a few meters wide. The two vents degassed simultaneously, but the E vent emitted larger amounts of brown ash.
Observations of Niri Mbwelesu. During the 6 September overflight, the pit of Niri Mbwelesu crater was filled with white vapor. The crater was climbed on 8 September and observations from the S rim showed the crater still filled with vapor; no sounds were heard. During that evening, an orange glow was observed. Excellent visibility on 10 September enabled sighting of a 10-m-diameter, crusted lava pond. Red lava was visible through surface cracks, and lava spatter rose 10 m above them at infrequent intervals.
Loud cannon-like explosions about every 20 minutes shook the ground and were accompanied by the sounds of cracking rock. During the evening, glowing projectiles were ejected into the air, although none fell outside the crater. Loud, roaring degassing noises like a jet engine at take-off were also heard. The roar would gain intensity over 30 seconds, cease for 15 seconds and then re-start. During periods of intense roaring, red lava was observed through cracks in the crusted surface.
Both types of intense degassing were accompanied by gentle emissions of brown vapor. A pit, 6 m in diameter, located N of the crusted pond in the crater wall, emitted brown ash. Fumaroles were high on the N inner crater wall. Brown ash was emitted from the S crater floor.
Observations of Mbwelesu. Mbwelesu crater was observed for 3 hours during mid-day on 8 September from a position on the SW rim. At times, the crater was filled with vapor, but observation of the lake surface was only possible about 60% of the time. The lava lake showed remarkable similarities in location, size, and dynamics compared to December 2002. The 50-m-diameter lava lake was contained inside a circular funnel-shaped pit 100-120 m in diameter. Violent agitation of the surface occurred most of the time. Lava splashed onto the pit walls and drained back vertically 25 m into the pit.
Large 10-m-diameter gas bubbles burst in the SE half of the lava lake with up to eight bubbles visible at the same time. Jets of lava were ejected every few seconds, created by wave intersections from the bursting bubbles. During periods of low activity, lasting tens of seconds, lava drained back into the middle of the pit. Surface crusting occurred after as little as one minute during quiet periods. Subsequently, the crust was broken up by a resumption of degassing from the SW side of the pit. On several occasions, up to 80% of the lava lake surface was covered by darker crust.
Acid rain was experienced on the edge of the crater and observers felt minor burning on the face. White, light-brown, and blue-tinged vapors smelling of sulfur were emitted from the crater.
Mbwelesu was scaled again on 10 September and observations of the lava lake (figure 10) were made over eight hours. The crater was clear, enabling detailed observations. At times 80% of the lake surface was deformed by bubbling. The SE portion of the pit contained the most degassing. Violent explosions regularly sprayed orange lava mixed with black crust in all directions. At one point the whole lake surface rotated clockwise and lava drained back into the middle of the pit. This whirlpool was followed by an avalanche on the W side of the pit that threw black material into the lake. A second pit with a diameter of 75 m NE of the lava lake was separated by an unstable 10-m-wide wall from which numerous avalanches occurred during the day; red lava spatter was ejected once.
An afternoon flyover on 13 September enabled excellent views of the active lava lake. The smaller pit NE of the lava lake contained a small lava pond with a diameter of ~ 8-10 m.
Observations of Marum. Two areas of fumarolic activity were seen at the edge of the 1953 crater (between Marum and Mbwelesu). Brown ash was being emitted from the ground at these locations.
Geologic Background. Ambrym, a large basaltic volcano with a 12-km-wide caldera, is one of the most active volcanoes of the New Hebrides Arc. A thick, almost exclusively pyroclastic sequence, initially dacitic then basaltic, overlies lava flows of a pre-caldera shield volcano. The caldera was formed during a major Plinian eruption with dacitic pyroclastic flows about 1,900 years ago. Post-caldera eruptions, primarily from Marum and Benbow cones, have partially filled the caldera floor and produced lava flows that ponded on the floor or overflowed through gaps in the caldera rim. Post-caldera eruptions have also formed a series of scoria cones and maars along a fissure system oriented ENE-WSW. Eruptions have apparently occurred almost yearly during historical time from cones within the caldera or from flank vents. However, from 1850 to 1950, reporting was mostly limited to extra-caldera eruptions that would have affected local populations.
Information Contacts: John Seach, PO Box 4025, Port Vila, Vanuatu (URL: http://www.volcanolive.com/).
Anatahan (United States) — September 2003 Cite this Report
Anatahan
United States
16.35°N, 145.67°E; summit elev. 790 m
All times are local (unless otherwise noted)
Very low seismicity with no ash emissions; geothermal activity in the crater
The first recorded historical eruption at Anatahan, which began on 10 May 2003, continued through that month with nearly continuous ash plumes (BGVN 28:04 and 28:05). Two strong explosions on 14 June removed much of a small lava dome that had been extruded in the crater; dark ash plumes were last reported on 16 June, after which time seismicity decreased significantly (BGVN 28:06). Only steaming without ash emissions was reported by scientists doing fieldwork immediately afterwards (BGVN 28:07) and on overflights in July. Volcanic tremor and other seismicity reported by the Commonwealth of the Northern Mariana Islands (CNMI) Emergency Management Office (EMO) persisted into early August at a relatively low level. This report covers observed activity from 4 August to 5 October 2003.
Seismicity was low throughout the report period and no apparent eruption signals or potential precursory events occurred. Tremor and seismic energy release were at low levels. During 2-6 August, small long-period (LP) events occurred regularly. At the end of that interval, the number of small LP events increased to several hundred in 24 hours, compared to a couple dozen per day earlier in the swarm, but the overall energy release increase was not significant. No LP events were reported again until mid-September. On 5 September, tremor and seismic energy release were reported to be at their lowest levels since early July.
Overflights of the volcano were made by USGS and EMO personnel on 30 August and 8, 9, and 11 September. Observations on these days revealed no ash emissions, and the feeble plume was dominated by steam and lesser amounts of volcanic gases, mainly SO2. Sporadic emissions sometimes rose above the crater rim. The E crater floor was covered by dirty, sediment-laden, steaming water, and an active geothermal system had mud pots, mini-geysers, and steam jets. Steaming water and sulfurous gases were emitted from the crater walls and floor. Observations during an 18 September overflight were similar to those earlier in the month, although the crater floor appeared to be covered by muddy water instead of a shallow lake. A distinct odor of SO2 and blue fume were noted during a helicopter inspection of the E crater lake on 27 September. On 29 September, geysering was seen and the odor of H2S was present in addition to SO2.
By 12 September USGS and EMO had reestablished the original, pre-eruption Anatahan seismic station (ANAT) on the SW caldera rim. On 15 September, several, small-amplitude, LP events lasting up to 15 seconds were visible on the ANAT records with dominant frequencies of 4-5 Hz. Some of the larger events had a short burst of 6-7 Hz energy about 2.5 seconds after the onset. The largest events were barely above background at the E Anatahan station (ANA2) and may have been occurring undetected for the past several weeks. The LP events at the ANAT station continued over the next two days at a rate of several per hour.
Geologic Background. The elongate, 9-km-long island of Anatahan in the central Mariana Islands consists of a large stratovolcano with a 2.3 x 5 km compound summit caldera. The larger western portion of the caldera is 2.3 x 3 km wide, and its western rim forms the island's high point. Ponded lava flows overlain by pyroclastic deposits fill the floor of the western caldera, whose SW side is cut by a fresh-looking smaller crater. The 2-km-wide eastern portion of the caldera contained a steep-walled inner crater whose floor prior to the 2003 eruption was only 68 m above sea level. A submarine cone, named NE Anatahan, rises to within 460 m of the sea surface on the NE flank, and numerous other submarine vents are found on the NE-to-SE flanks. Sparseness of vegetation on the most recent lava flows had indicated that they were of Holocene age, but the first historical eruption did not occur until May 2003, when a large explosive eruption took place forming a new crater inside the eastern caldera.
Information Contacts: Juan Takai Camacho and Ramon Chong, Commonwealth of the Northern Mariana Islands Emergency Management Office, P.O. Box 10007, Saipan, MP 96950 USA (URL: http://www.cnmihsem.gov.mp/); Frank Trusdell, U.S. Geological Survey, Hawaiian Volcano Observatory (HVO), PO Box 51, Hawaii National Park, HI 96718, USA (URL: https://volcanoes.usgs.gov/nmi/activity/).
Arenal (Costa Rica) — September 2003 Cite this Report
Arenal
Costa Rica
10.463°N, 84.703°W; summit elev. 1670 m
All times are local (unless otherwise noted)
Pyroclastic-flow sequence down the N and NE flanks on 5 September
On 5 September the Observatorio Vulcanologico y Sismologico de Costa Rica (OVSICORI-UNA) reported that a new sequence of pyroclastic flows started at 1055 that day (figure 98). At least eight signals related to the collapses were recorded within the next two hours by seismographs at the observatory. Material shed from high-elevation accumulations of lava generated the pyroclastic flows, which descended the N and NE flanks down to 800 m elevation; accompanying ash drifted W and NW. No injuries or deaths occurred, and the main effects were limited to within the National Park boundaries. Patches of vegetation at the flow terminations caught on fire. Similar flows have occurred in recent years (e.g. May 1998, August 2000, and March 2001) affecting the summit and upper areas of the active cone C. No explosive eruptions or extraordinary seismic activity were associated with these latest pyroclastic flows.
Unreported observations from 2002. At the time of the last summary report about Arenal (BGVN 28:08), information from January, February, and April 2002 was not available; those OVSICORI-UNA reports have since been located. Both seismic and volcanic activity were low during those months, without significant pyroclastic flows or energetic eruptions. Pyroclastic flows from other months that had been described in that and other reports all originated from failures along the margins of lava flows, rather than stemming from explosive eruptive processes.
Geologic Background. Conical Volcán Arenal is the youngest stratovolcano in Costa Rica and one of its most active. The 1670-m-high andesitic volcano towers above the eastern shores of Lake Arenal, which has been enlarged by a hydroelectric project. Arenal lies along a volcanic chain that has migrated to the NW from the late-Pleistocene Los Perdidos lava domes through the Pleistocene-to-Holocene Chato volcano, which contains a 500-m-wide, lake-filled summit crater. The earliest known eruptions of Arenal took place about 7000 years ago, and it was active concurrently with Cerro Chato until the activity of Chato ended about 3500 years ago. Growth of Arenal has been characterized by periodic major explosive eruptions at several-hundred-year intervals and periods of lava effusion that armor the cone. An eruptive period that began with a major explosive eruption in 1968 ended in December 2010; continuous explosive activity accompanied by slow lava effusion and the occasional emission of pyroclastic flows characterized the eruption from vents at the summit and on the upper western flank.
Information Contacts: E. Fernández, E. Duarte, E. Malavassi, R. Sáenz, V. Barboza, R. Van der Laat, T. Marino, E. Hernández, and F. Chavarría, Observatorio Vulcanológico y Sismológico de Costa Rica (OVSICORI-UNA), Apartado 86-3000, Heredia, Costa Rica.
Barva (Costa Rica) — September 2003 Cite this Report
Barva
Costa Rica
10.135°N, 84.1°W; summit elev. 2906 m
All times are local (unless otherwise noted)
Two crater lakes visited in December 2002
Geologist Raul Mora, along with Carlos Ramirez and Maritta Alvarado, visited Barva volcano during December 2002 and investigated the Barva and Copey crater lakes. Located in a small crater, the Barva crater lake (figure 1) was very clear; at 5 m from the shore the water had a temperature of 11-12°C with a pH of 4-5. Water in the Copey lake was amber colored and very cloudy, with a temperature at 0.5 m depth of 12.2°C and a pH of 5. Near-surface black lapilli deposits were found that were more than a meter thick near the Barva lake, but became more irregular in thickness around the Copey lake.
Geologic Background. One of three massive volcanoes close to the capital city of San José, Volcán Barva (Barba) is a complex volcano with multiple peaks and flank vents. Three peaks visible from the Central Valley give it the common local name of Las Tres Marías. The voluminous andesitic-to-dacitic Tiribí Tuff, exposed in the Central Valley, was erupted about 322,000 years ago. The summit area is dominated by a 2 x 3 km crater open to the ESE. One of the cones on the upper N flank contains a crater lake. Cones are also found on the S flanks, along with lava flows. The Los Angeles flow, one of the most recent, descends nearly to the city of Heredia. A large Plinian eruption occurred during the early Holocene. Eruptions were reported in 1760 or 1766, 1776? (also a mudflow), and 1867, but later visits to the summit did not provide evidence for recent activity.
Information Contacts: Raul Mora Amador, Red Sismologica Nacional, Laboratorio de Sismologia, Vulcanologia y Exploracion Geofisica, Universidad de Costa Rica, Apartado 214 (2060) UCR, San Jose, Costa Rica (URL: http://rsn.ucr.ac.cr/).
Concepcion (Nicaragua) — September 2003 Cite this Report
Concepcion
Nicaragua
11.538°N, 85.622°W; summit elev. 1700 m
All times are local (unless otherwise noted)
Three periods of elevated seismicity between June 2002 and August 2003
Reports from March 2002 through September 2003 were provided by Instituto Nicaraguense de Estudios Territoriales (INETER). Activity has been generally constant from 2001 through 2003, with tremor and very low magnitude earthquakes, usually detected by the station on the N side of the volcano (CONN). Throughout the summary period, there were occasionally technical difficulties at the Mombacho station, so no activity was registered on those days. Periods of noticeably high seismicity occurred between June and October 2002, in April 2003, and during June-August 2003 (table 2).
Table 2. Monthly count of earthquakes registered at Concepción, February 2002-September 2003. Courtesy of INETER.
| Month |
Number of earthquakes |
Notes |
| Feb 2002 |
24 |
-- |
| Mar 2002 |
9 |
-- |
| Apr 2002 |
1,433 |
Most activity on 5, 9, and 10 April. |
| May 2002 |
346 |
Total of 76 earthquakes on 19 May; technical problems may have lowered number. |
| Jun 2002 |
865 |
-- |
| Jul 2002 |
1,229 |
-- |
| Aug 2002 |
1,219 |
Most activity on 29 and 30 August. |
| Sep 2002 |
1,250 |
Most activity on 26-27 September; no records 1-2 September. |
| Oct 2002 |
1,031 |
Ten days worth of records; most activity on 28 and 31 October. |
| Nov 2002 |
784 |
Most activity on 1 and 2 November. |
| Dec 2002 |
389 |
-- |
| Jan 2003 |
179 |
Missing four days of recordings. |
| Feb 2003 |
108 |
-- |
| Mar 2003 |
700 |
Higher amplitude events recorded between 2 and 18 March. |
| Apr 2003 |
1,400 |
Majority recorded after 11 April. |
| May 2003 |
476 |
-- |
| Jun 2003 |
1,298 |
-- |
| Jul 2003 |
1,100+ |
Missing three days of recordings. |
| Aug 2003 |
1,586 |
-- |
| Sep 2003 |
828 |
Most activity on 12-13 September. |
Seismicity between April 2002 and February 2003. In April 2002 there were 1,433 microearthquakes detected, a significant increase over the total of 33 recorded during February-March; the majority of the seismicity was recorded on 5, 9, and 10 April. The majority of activity was classified as long-period (LP) events with frequencies between 1 and 4 Hz; some events related to rock fracturing had frequencies between 8 and 10 Hz. Activity in May was similar, with low-magnitude earthquakes and tremor. However, due to problems with CONN, only 346 earthquakes were detected. On the day of the highest activity, 19 May, 76 microearthquakes were recorded. One earthquake, only recorded at CONN, occurred on 28 May with an S-P time difference of 0.8 seconds, suggesting the hypocenter was at ~ 6.4 km depth.
June-August activity was consistent with previous months. June recorded 865 microearthquakes, while July recorded 1,229 events, mostly early in the month. CONN registered 1,219 earthquakes in August. Seismicity was heaviest on 29 and 30 August, with 116 and 139 earthquakes, respectively. The earthquakes were classified as mainly LP. On 4 August an earthquake of M 2.7 occurred ~ 15 km S of the volcano at a depth of 12.5 km. On 14 August another seismic station (URBN) was installed around Concepción, this one in the community of Urbaite, on the S flank.
In September activity levels were again generally stable. Reception problems continued but by 2 September the signal was reestablished. There were 1,250 earthquakes recorded, the majority at the end of the month, with highs of 149 on 26 September and 152 on 27 September. In October, technical problems prevented recordings until after 21 October. However, in those ten days 1,031 microearthquakes registered, with 161 and 172 on 28 and 31 October, respectively. Both CONN and URBN detected lahars on the N flank on 28 and 31 October, during a time of moderate rainfall. Activity declined in November, although 784 earthquakes were still recorded. Activity was highest on 1 and 2 November, with 115 and 129 earthquakes respectively.
Activity declined further in December, with 389 microearthquakes, although no recordings were obtained on five days due to technical problems. Similar to the past several months, activity was classified as generally LP or degassing events. Only 179 microearthquakes were recorded in January (data was not received on four days). In February, only 108 microearthquakes were detected. All events ranged between 1.5 and 3.5 Hz frequency and were classified as LP or degassing events.
Seismicity between March and June 2003. Beginning in March 2003 and continuing through April and May, activity increased to unusual levels. Between 2 and 18 March CONN registered a series of 31 earthquakes with considerable amplitude; they were not felt by residents in the area. Because the stations at Urbaite (URBN) and Maderas (MADN) were not working, only CONN recorded the activity. However, the difference in arrival times between the S and P waves indicated a depth of 15-16 km. The seismic signals began at low frequencies, followed by an increase in the spectral frequency content.
On 19 March the volcano entered a new period of increased activity. By the end of March more than 700 events were registered by the seismic station. Although during the first week of April very few earthquakes were recorded, by 11 April the station began to register a series of earthquakes of considerable amplitude, similar to the series in March. More than 1,400 events were recorded, mainly LP events. Only 476 events were recorded in May, also mainly LP events. A total of 1,298 events were recorded in June.
Seismicity between July and September 2003. Unusual seismic activity, including harmonic tremor that began at the end of June, continued in July. Starting 1 July, CONN began to register a series of LP events accompanied by low-frequency harmonic tremor and a saturated seismic signal like the one that occurred in March. Harmonic tremor occurred throughout July, with episodes of 7 minutes on 2 July, 45 minutes on 4 July, and about 60 minutes on 13 July. Long-period earthquakes and harmonic tremor increased between 23 July and the end of the month.
A total of 43 earthquakes with saturated amplitudes were registered only by CONN in July, but it was not possible to determine locations or magnitudes. The time difference in the S-P arrivals implied hypocenters 15-16 km beneath the volcano. They lasted a little over a minute and had a combination of high and low frequencies. The earthquakes with saturated signals had frequencies of 2-4 Hz; some were accompanied by a low-energy high-frequency signal. The majority of these events (7) occurred on 15 and 16 July, and had ceased by 23 July. Taking the spectral content into account, these appear to be LP events; however, it is not very common for LP events to begin with low frequencies followed by high. No data were recorded on 18, 21, and 22 July due to technical problems at Mombacho, but a total of more than 1,100 earthquakes were recorded by seismic stations.
With 1,586 earthquakes registered, seismicity was unusually high in August. Harmonic tremor also increased. Starting 1 August, CONN began to register a series of LP earthquakes accompanied by low-frequency harmonic tremor and earthquakes with saturated signals, as in previous months. Frequency ranged from 1 to 2.5 Hz, with occasionally higher values. On 16 August tremors were registered that lasted for four minutes; on 22 August, after two days with no tremor and few earthquakes, there was more unusual activity consisting of seven hours of intermittent tremor episodes.
Seismicity continued in September with 828 total events, the majority on 12 and 13 September. Seismic tremor was present throughout September, with frequency levels similar to those of the previous months.
Geologic Background. Volcán Concepción is one of Nicaragua's highest and most active volcanoes. The symmetrical basaltic-to-dacitic stratovolcano forms the NW half of the dumbbell-shaped island of Ometepe in Lake Nicaragua and is connected to neighboring Madera volcano by a narrow isthmus. A steep-walled summit crater is 250 m deep and has a higher western rim. N-S-trending fractures on the flanks have produced chains of spatter cones, cinder cones, lava domes, and maars located on the NW, NE, SE, and southern sides extending in some cases down to Lake Nicaragua. Concepción was constructed above a basement of lake sediments, and the modern cone grew above a largely buried caldera, a small remnant of which forms a break in slope about halfway up the N flank. Frequent explosive eruptions during the past half century have increased the height of the summit significantly above that shown on current topographic maps and have kept the upper part of the volcano unvegetated.
Information Contacts: Emilio Talavera, Instituto Nicaraguense de Estudios Territoriales (INETER), Dirección General de Geofísica, Apartado Postal 2110, Managua, Nicaragua (URL: http://www.ineter.gob.ni/ geofisica).
Dieng Volcanic Complex (Indonesia) — September 2003 Cite this Report
Dieng Volcanic Complex
Indonesia
7.2°S, 109.879°E; summit elev. 2565 m
All times are local (unless otherwise noted)
One shallow volcanic earthquake and a gas plume in early August
The Volcanological Survey of Indonesia (VSI) activity report for the week of 4-10 August 2003 noted, for the Sileri crater in the Dieng volcano complex, one shallow volcanic earthquake, a white gas plume rising 25-60 m, and water temperature of 83°C. The hazard status was set at Alert Level 2 (on a scale of 1-4).
Geologic Background. The Dieng plateau in the highlands of central Java is renowned both for the variety of its volcanic scenery and as a sacred area housing Java's oldest Hindu temples, dating back to the 9th century CE. The Dieng Volcanic Complex consists of multiple stratovolcanoes and more than 20 small Pleistocene-to-Holocene craters and cones over a 6 x 14 km area. Prahu stratovolcano was truncated by a large Pleistocene caldera, which was subsequently filled by a series of cones, lava domes, and craters, many containing lakes. Lava flows cover much of the plateau, but observed activity has been restricted to minor phreatic eruptions. Gas emissions are a hazard at several craters and have caused fatalities. There are abundant thermal features and high heat flow across the area.
Information Contacts: Dali Ahmad and Nia Haerani, Volcanological Survey of Indonesia (VSI), Jalan Diponegoro No. 57, Bandung 40122, Indonesia (URL: http://www.vsi.esdm.go.id/).
Dukono (Indonesia) — September 2003 Cite this Report
Dukono
Indonesia
1.6992°N, 127.8783°E; summit elev. 1273 m
All times are local (unless otherwise noted)
Ash explosions in late July through September generate plumes up to 250 m high
Volcanological Survey of Indonesia (VSI) reports for June and July 2003 noted volcanic activity and ash emissions from Dukono. VSI reported an ash explosion commencing on 7 June, with ashfall in the Galela area (~ 7 km from the summit) on 9 June (BGVN 28:06). Explosive events had decreased by 9 June, but as of 10 June the plume was still visible on satellite imagery. No additional activity was reported through the end of June.
Ash explosions were again reported by VSI during 9-23 July, with a maximum plume height of 1,000 m in clear weather on 22 July (BGVN 28:06). No Dukono activity was reported in the report for 21-27 July. Ash explosions were reported again during 28 July-3 August, with a white-gray column, under weak pressure, rising 15-75 m. Some explosions produced dark-gray ash columns reaching 95-450 m high. On 27 and 28 July some blasting sounds were heard in the Galela area and continuous blasting sounds were heard on 25, 26, and 29 July. Minor ash fell around the crater, and ash drifted E, SE, and NE.
Ash explosions continued during 18-31 August, producing a gray ash plume 75 m high and an ash column that rose 200-250 m accompanied by booming sounds. VSI reported that ash explosions during the 1-28 September period produced a gray ash plume 50-200 m high. When there was no explosive activity, white-gray ash emissions were observed rising 50 m from the crater. The hazard status has remained at Alert Level 2 (on a scale of 1-4) since early June.
Geologic Background. The Dukono complex in northern Halmahera is on an edifice with a broad, low profile containing multiple peaks and overlapping craters. Almost continuous explosive eruptions, sometimes accompanied by lava flows, have occurred since 1933. During a major eruption in 1550 CE, a lava flow filled in the strait between Halmahera and the Gunung Mamuya cone, 10 km NE. Malupang Wariang, 1 km SW of the summit crater complex, contains a 700 x 570 m crater that has also had reported eruptions.
Information Contacts: Dali Ahmad and Nia Haerani, Volcanological Survey of Indonesia (VSI), Jalan Diponegoro No. 57, Bandung 40122, Indonesia (URL: http://www.vsi.esdm.go.id/).
Piton de la Fournaise (France) — September 2003 Cite this Report
Piton de la Fournaise
France
21.244°S, 55.708°E; summit elev. 2632 m
All times are local (unless otherwise noted)
Seismic crisis and a new SSW-flank fissure on 30 September
A seismic crisis started at 2225 on 30 September 2003 beneath the SW corner of Dolomieu crater ~ 2 km below the summit. At 2330 eruption tremor appeared and was localized beneath the SSW flank of Piton de la Fournaise. A straight 400-m-long fissure opened at 2,350 m elevation. The eruption tremor reached a maximum at 0100 on 1 October and declined after 0200, disappearing completely at 1300.
Since March 2003, the extensometer network and GPS measurements had indicated inflation of Piton de la Fournaise. A new eruption that began on 30 May within Dolomieu crater proceeded in multiple phases through 7 July, followed by new activity through 27 August (BGVN 28:05, 28:06, and 28:08).
Geologic Background. Piton de la Fournaise is a massive basaltic shield volcano on the French island of Réunion in the western Indian Ocean. Much of its more than 530,000-year history overlapped with eruptions of the deeply dissected Piton des Neiges shield volcano to the NW. Three scarps formed at about 250,000, 65,000, and less than 5,000 years ago by progressive eastward slumping, leaving caldera-sized embayments open to the E and SE. Numerous pyroclastic cones are present on the floor of the scarps and their outer flanks. Most recorded eruptions have originated from the summit and flanks of Dolomieu, a 400-m-high lava shield that has grown within the youngest scarp, which is about 9 km wide and about 13 km from the western wall to the ocean on the E side. More than 150 eruptions, most of which have produced fluid basaltic lava flows, have occurred since the 17th century. Only six eruptions, in 1708, 1774, 1776, 1800, 1977, and 1986, have originated from fissures outside the scarps.
Information Contacts: Thomas Staudacher, Observatoire Volcanologique du Piton de la Fournaise Institut de Physique du Globe de Paris, 97418 La Plaine des Cafres, La Réunion, France (URL: http://www.ipgp.fr/fr/ovpf/observatoire-volcanologique-piton-de-fournaise).
Gamalama (Indonesia) — September 2003 Cite this Report
Gamalama
Indonesia
0.81°N, 127.3322°E; summit elev. 1714 m
All times are local (unless otherwise noted)
Several small ash explosions and gas emission through late September
An eruptive event on 31 July 2003 at Gamalama produced ashfall and pyroclastic flows (BGVN 28:07). The Volcanological Survey of Indonesia (VSI) report for the week of 28 July-3 August noted that the hazard status was downgraded to Alert Level 3 on 2 August. A white gas plume was reported as rising 10-50 m above the summit and the seismograph record was dominated by emission events.
Volcanic activity was low during 18-31 August, with white gas emissions and several small ash explosions. White-gray ash plumes emitted from the crater reached 100 m high. Night glow was seen just above the crater rim. Recorded emission and tectonic earthquakes averaged four events per day. Reduced activity continued during 1-28 September 2003, again with white gas emission and small ash explosions that occurred several times. Seismicity was dominated by tectonic and emission events (table 1). The hazard status since 18 August has been at Alert Level 2 (on a scale of 1-4).
Table 1. Seismicity at Gamalama during 1-28 September 2003. Courtesy of VSI.
| Dates |
Deep Volcanic |
Shallow Volcanic |
Emission |
Tectonic |
| 01-07 Sep 2003 |
1 |
7 |
35 |
64 |
| 08-14 Sep 2003 |
3 |
1 |
16 |
59 |
| 15-21 Sep 2003 |
0 |
1 |
12 |
57 |
| 22-28 Sep 2003 |
0 |
3 |
21 |
49 |
Geologic Background. Gamalama is a near-conical stratovolcano that comprises the entire island of Ternate off the western coast of Halmahera, and is one of Indonesia's most active volcanoes. The island was a major regional center in the Portuguese and Dutch spice trade for several centuries, which contributed to the extensive documentation of activity. Three cones, progressively younger to the north, form the summit. Several maars and vents define a rift zone, parallel to the Halmahera island arc, that cuts the volcano; the S-flank Ngade maar formed after about 14,500–13,000 cal. BP (Faral et al., 2022). Eruptions, recorded frequently since the 16th century, typically originated from the summit craters, although flank eruptions have occurred in 1763, 1770, 1775, and 1962-63.
Information Contacts: Dali Ahmad, Volcanological Survey of Indonesia (VSI), Jalan Diponegoro No. 57, Bandung 40122, Indonesia (URL: http://www.vsi.esdm.go.id/).
Karangetang (Indonesia) — September 2003 Cite this Report
Karangetang
Indonesia
2.781°N, 125.407°E; summit elev. 1797 m
All times are local (unless otherwise noted)
Ash explosions and lava avalanches in July; overall activity level declines
Ash explosions have been frequent at Karangetang during 2003 (BGVN 28:05 and 28:07). A red glow at night and lava avalanches were reported during 9-15 June (BGVN 28:07). Although detailed observations were not provided by the Volcanological Survey of Indonesia (VSI) for the next two weeks, the hazard status remained at Alert Level 2 (on a scale of 1-4).
VSI weekly reports from 30 June through 3 August indicated that white gas plumes from the S crater typically rose 350-500 m above the crater rim, night glow often extended 25 m above the crater, and white gas plumes from the N crater rose as high as 350 m. Seismic data showed that lava avalanches and shallow volcanic earthquakes in early July were significantly reduced compared to the first half of June (table 8).
Table 8. Seismicity at Karangetang during 2 June-28 September 2003. VSI did not issue reports for Karangetang during weeks not included in the table; a dash indicates no data reported. Courtesy of VSI.
| Date |
Deep volcanic (A-type) |
Shallow volcanic (B-type) |
Explosion |
Multiphase |
Emission |
Avalanche |
Tectonic |
| 02 Jun-08 Jun 2003 |
11 |
348 |
-- |
233 |
46 |
110 |
26 |
| 09 Jun-15 Jun 2003 |
32 |
438 |
1 |
228 |
21 |
447 |
20 |
| 30 Jun-06 Jul 2003 |
15 |
93 |
-- |
446 |
11 |
32 |
11 |
| 07 Jul-13 Jul 2003 |
15 |
93 |
-- |
534 |
22 |
35 |
7 |
| 14 Jul-20 Jul 2003 |
21 |
174 |
31 |
672 |
38 |
45 |
22 |
| 21 Jul-27 Jul 2003 |
17 |
112 |
9 |
94 |
131 |
66 |
25 |
| 28 Jul-03 Aug 2003 |
10 |
8 |
-- |
312 |
174 |
94 |
10 |
| 01 Sep-07 Sep 2003 |
8 |
44 |
1 |
80 |
341 |
1 |
20 |
| 08 Sep-14 Sep 2003 |
5 |
14 |
0 |
50 |
266 |
5 |
23 |
| 15 Sep-21 Sep 2003 |
6 |
90 |
0 |
3 |
16 |
0 |
74 |
| 22 Sep-28 Sep 2003 |
9 |
60 |
0 |
75 |
130 |
0 |
37 |
During 18-20 July there were ash-producing explosions and lava avalanches. On 21-22 July an ash explosion produced a 150-m-high ash column and a glowing lava avalanche flowed 350 m toward the Beha river. During the week of 28 July-3 August another glowing lava avalanche flowed 1,500 m toward the Beha river and 350 m toward the Batang river. On 29 July volcanic tremor was recorded with a maximum amplitude of 0.5-2 mm.
Karangetang was not included in August reports, but the report for 1-28 September noted white gas emissions from the S crater rising 150-350 m and red glow at night reaching 25 m over the crater, with the N crater exhibiting white gas emissions to 50-150 m above the crater. There were no lava avalanches during this period. The Alert Level remained at 2.
Geologic Background. Karangetang (Api Siau) volcano lies at the northern end of the island of Siau, about 125 km NNE of the NE-most point of Sulawesi. The stratovolcano contains five summit craters along a N-S line. It is one of Indonesia's most active volcanoes, with more than 40 eruptions recorded since 1675 and many additional small eruptions that were not documented (Neumann van Padang, 1951). Twentieth-century eruptions have included frequent explosive activity sometimes accompanied by pyroclastic flows and lahars. Lava dome growth has occurred in the summit craters; collapse of lava flow fronts have produced pyroclastic flows.
Information Contacts: Dali Ahmad, Hetty Triastuty, and Nia Haerani, Volcanological Survey of Indonesia (VSI), Jalan Diponegoro No. 57, Bandung 40122, Indonesia (URL: http://www.vsi.esdm.go.id/).
Kilauea (United States) — September 2003 Cite this Report
Kilauea
United States
19.421°N, 155.287°W; summit elev. 1222 m
All times are local (unless otherwise noted)
Active surface lava flows from June through mid-October
During 2003, lava from Kīlauea continued to flow down the S flanks and into the ocean at several points. The Mother's Day flow, which began erupting from Pu`u `O`o on 12 May 2003, remained active. Seismicity generally persisted at normal (background) levels. A recent report from the U.S. Geological Survey, edited by Heliker, Swanson, and Takahashi (2003) described the nearly uninterupted Pu`u `O`o-Kupaianaha eruption that started 3 January 1983 and continues today.
Lava flows. Lava entered the sea mainly at the Highcastle ocean entry during 11-17 June and surface lava flows were visible on the coastal flat and Pulama pali during June and July 2003. However, no lava flowed into the sea during the later half of July and into early August.
Deflation that began on 8 August amounted to ~ 1.8 µrad at the Uwekahuna (UWEV) tiltmeter and ~ 4 µrad at the Pu`u `O`o tiltmeter, both located near the Kīlauea summit (figure 159). The deflation was accompanied by a drop in the level of lava in a lava tube, as seen by field workers at midday. Inflation began later that day at 1928, and in ~ 3.5 hours ~ 3.5 µrad of inflation was recorded at Uwekahuna and ~6 µrad at Pu`u `O`o.
A lava breakout occurred on 9 August between 0200 and 0300, ~ 1.3 km SE of the center of the Pu`u `O`o cone. A very large sheet flow emerged from the up-tube side of a rootless shield formed on 21 January. Observers saw a lava stream up to 40 m wide. By 0600 the flow covered ~ 5.2 hectares (0.052 km2).
Later in August and into September, surface lava flows were visible on Kīlauea's coastal flat, in some areas flowing to within 500 m of the sea. On 2 October lava began to flow westward after filling West Gap Pit on the W flank of Pu`u `O`o cone. Fairly vigorous spattering was visible in the pit, but decreased to only sporadic bursts later in the day. The flow appeared to have stopped by 4 October when no glow was observed coming from the pit.
Lava flows have erupted from 1983 through 10 October 2003 from Pu`u `O`o and Kupaianaha. The area of recent lava flows on the W side of the flow-field has been designated the Mother's Day flow, which began erupting on 12 May 2002 and continues to the present (figure 160). Through September and into early October, lava was moving along the E and W sides of the Mother's Day flow. The E-side lava (mentioned previously as the 9 August breakout) came from the 9 August rootless shield, itself fed by the main Mother's Day tube from Pu`u `O`o. The W-side lava, known as the Kohola arm of the Mother's Day flow, branched off the tube system below the rootless shield. In early October, the E-side flow stopped moving, the W-side flow died back to a trickle, and the rootless shield gained prominence. By 16 October, however, the shield had partly collapsed, leaving several drained perched ponds. Upstream from the shield, many hornitos and small flows formed over the Mother's Day tube.
Geophysical activity. During the second half of June and into August 2003, seismicity at the summit was at moderate-to-high levels, with many small, low-frequency earthquakes occurring at shallow depths beneath the summit caldera at a rate of about 1-2 per minute. Little or no volcanic tremor accompanied the swarm at the caldera, however. Volcanic tremor at Pu`u `O`o remained at moderate-to-high levels, as is the norm. A quasi-cyclic tilt pattern ended at Kīlauea's summit and Pu`u `O`o on 13 June after lasting about a week. Small periods of inflation and deflation occurred during July and into August.
During the deflation on 8 August, there was an increase in small, low-frequency earthquakes and changes in their frequency content. Some larger events occurred at depths of a few kilometers, as during the previous several weeks. A magnitude 5.0 earthquake 10 km beneath Kīlauea's central S flank on 26 August at 2024 was the largest since 2 April 2000, which occurred in almost exactly the same spot. No significant damage was done, no cracks or rockfalls were seen, and there was no change in the eruption. Generally, following that event and into September, summit seismicity continued at moderate levels with 1-2 small low-frequency earthquakes per minute occurring at shallow depths beneath the summit caldera. There were some larger events at depths of a few kilometers.
At about 1500 on 20 September 2003, first Uwekahuna and then Pu'u O'o started to deflate. Pu'u O'o lost ~ 1.5 µrad during the deflation, and Uwekahuna lost ~ 0.9 µrad. The deflation ended with a sharp inflation in the early morning on 21 September, which lasted until early on 22 September, when the tilt flattened.
Reference. Heliker, C., Swanson, D.A., and Takahashi, T.J. (eds), 2003, The Pu`u `O`o-Kupaianaha eruption of Kīlauea Volcano, Hawaii: The first 20 years: U.S. Geological Survey Professional Paper 1676, Denver, CO.
Geologic Background. Kilauea overlaps the E flank of the massive Mauna Loa shield volcano in the island of Hawaii. Eruptions are prominent in Polynesian legends; written documentation since 1820 records frequent summit and flank lava flow eruptions interspersed with periods of long-term lava lake activity at Halemaumau crater in the summit caldera until 1924. The 3 x 5 km caldera was formed in several stages about 1,500 years ago and during the 18th century; eruptions have also originated from the lengthy East and Southwest rift zones, which extend to the ocean in both directions. About 90% of the surface of the basaltic shield volcano is formed of lava flows less than about 1,100 years old; 70% of the surface is younger than 600 years. The long-term eruption from the East rift zone between 1983 and 2018 produced lava flows covering more than 100 km2, destroyed hundreds of houses, and added new coastline.
Information Contacts: Hawaiian Volcano Observatory (HVO), U.S. Geological Survey, PO Box 51, Hawaii National Park, HI 96718, USA (URL: https://volcanoes.usgs.gov/observatories/hvo/).
Lamington (Papua New Guinea) — September 2003 Cite this Report
Lamington
Papua New Guinea
8.95°S, 148.15°E; summit elev. 1680 m
All times are local (unless otherwise noted)
High-frequency earthquakes began in early July
The Rabaul Volcanological Observatory reported that Lamington remained quiet over the period 25 June-9 October 2003. Vapor emissions were difficult to observe because of the distance to the observation point, but on a few clear days very small volumes of thin white vapor were seen in the summit area. The report also noted that high-frequency volcano-tectonic-like earthquakes began in early July at a rate of up to five events per day and continued into early October. This is the first time since the seismic station was re-established in 1997 that these types of earthquakes have been recorded in significant numbers over a short period of time.
Geologic Background. Lamington is an andesitic stratovolcano with a 1.3-km-wide breached summit crater containing a lava dome that rises above the coastal plain of the Papuan Peninsula of New Guinea north of the Owen Stanley Range. A summit complex of lava domes and crater remnants tops a low-angle base of volcaniclastic deposits dissected by radial valleys. A prominent broad "avalanche valley" extends northward from the breached crater. Ash layers from two early Holocene eruptions have been identified. In 1951 a powerful explosive eruption produced pyroclastic flows and surges that swept all sides of the volcano, killing nearly 3,000 people. The eruption concluded with growth of a 560-m-high lava dome in the summit crater.
Information Contacts: Ima Itikarai, Rabaul Volcanological Observatory, P.O. Box 386, Rabaul, Papua New Guinea.
Manam (Papua New Guinea) — September 2003 Cite this Report
Manam
Papua New Guinea
4.08°S, 145.037°E; summit elev. 1807 m
All times are local (unless otherwise noted)
Minor ashfall from Main Crater activity during May
Recent activity at Manam has consisted of white vapor emissions from both the Main and Southern craters, and low seismicity (BGVN 28:03). The Rabaul Volcanological Observatory reported that the two vents in the Main crater gently released weak, thin white vapor during 7-12 May, with occasional white-gray emissions on 11 May. Fine ashfall resulting from occasional emissions of thin white gray ash plumes from Main crater was reported on the NW side of the island on 17-19 and 23 May. No audible noise or glow was reported. Southern crater continued to gently release small amounts of thin white vapor. The volcano was quiet over the period 25-30 June, with both craters gently releasing occasional thin white vapor emissions and low seismicity.
Geologic Background. The 10-km-wide island of Manam, lying 13 km off the northern coast of mainland Papua New Guinea, is one of the country's most active volcanoes. Four large radial valleys extend from the unvegetated summit of the conical basaltic-andesitic stratovolcano to its lower flanks. These valleys channel lava flows and pyroclastic avalanches that have sometimes reached the coast. Five small satellitic centers are located near the island's shoreline on the northern, southern, and western sides. Two summit craters are present; both are active, although most observed eruptions have originated from the southern crater, concentrating eruptive products during much of the past century into the SE valley. Frequent eruptions, typically of mild-to-moderate scale, have been recorded since 1616. Occasional larger eruptions have produced pyroclastic flows and lava flows that reached flat-lying coastal areas and entered the sea, sometimes impacting populated areas.
Information Contacts: Ima Itikarai, Rabaul Volcanological Observatory, P.O. Box 386, Rabaul, Papua New Guinea.
Mayon (Philippines) — September 2003 Cite this Report
Mayon
Philippines
13.257°N, 123.685°E; summit elev. 2462 m
All times are local (unless otherwise noted)
Elevated sulfur-dioxide flux after mid-September; crater glow in October
The Philippine Institute of Volcanology and Seismology (PHIVOLCS) reported on 18 September 2003 that earthquake activity at Mayon had been within background levels (< 5 events/day) since 14 August with no volcanic earthquakes over the previous five days and moderate volcanic gas outputs. However, the sulfur dioxide (SO2) flux at 1,237 metric tons per day (t/d) was above baseline levels, having increased from 829 t/d since 5 September. In view of increased SO2 gas emissions, and recent significant earthquake occurrences, PHIVOLCS set the hazard status at Alert Level 1 (on a scale of 0-5).
For the period 29 September-5 October, 16 low-frequency volcanic earthquakes (19.0 mm amplitude), five high-frequency volcanic earthquakes (26.0 mm amplitude), and four high-frequency short-duration volcanic earthquakes (2.5 mm amplitude) were recorded, accompanied by weak to moderate steaming and no visible crater glow. During 6-12 October, 29 low-frequency volcanic earthquakes (14.0 mm amplitude), four high-frequency volcanic earthquakes (6.2 mm amplitude), and two high-frequency short duration volcanic earthquakes (2.0 mm amplitude) were recorded, with moderate steaming and faint crater glow.
PHIVOLCS reported on 9 October that a faint glow had been seen by telescope at the inner E portion of the summit crater between 2330 on 8 October and 0048 on 9 October, and again between 1630 and 1650 on 9 October. Low-frequency volcanic earthquakes occurred four and six times, respectively, during 8 and 9 October. Steam emission remained moderate, with visible plumes barely rising above the crater rim. Mayon's SO2 flux on 9 October rose to 2,386 t/d from 1,616 t/d on 1 October.
On 11 October PHIVOLCS noted persistent and significant incandescence inside the summit crater, apparently from lava in the E portion of the volcano's conduit. Seismicity over the previous 24 hours was relatively low (three low-frequency volcanic earthquakes). The Alert Level was raised to 2, signifying instability that may lead to ash explosions or a magmatic eruption.
Geologic Background. Symmetrical Mayon, which rises above the Albay Gulf NW of Legazpi City, is the most active volcano of the Philippines. The steep upper slopes are capped by a small summit crater. Recorded eruptions since 1616 CE range from Strombolian to basaltic Plinian, with cyclical activity beginning with basaltic eruptions, followed by longer periods of andesitic lava flows. Eruptions occur predominately from the central conduit and have also produced lava flows that travel far down the flanks. Pyroclastic density currents and mudflows have commonly swept down many of the approximately 40 ravines that radiate from the summit and have often damaged populated lowland areas. A violent eruption in 1814 killed more than 1,200 people and devastated several towns.
Information Contacts: Philippine Institute of Volcanology and Seismology (PHIVOLCS), Department of Science and Technology, PHIVOLCS Building, C.P. Garcia Avenue, University of the Philippines Campus, Diliman, Quezon City, Philippines (URL: http://www.phivolcs. dost.gov.ph/).
Momotombo (Nicaragua) — September 2003 Cite this Report
Momotombo
Nicaragua
12.423°N, 86.539°W; summit elev. 1270 m
All times are local (unless otherwise noted)
Some seismic swarms and tornillos; stable fumarole temperatures
Instituto Nicaraguense de Estudios Territoriales (INETER) reports from March 2002 through September 2003 indicate that seismicity has generally been low. Occasional visits to the summit of Momotombo (figure 10) are made to sample gases and take temperature measurements.
The first visit during this time period was on 13 April 2002. Temperature measurements in the crater fumaroles showed little variation from previous measurements, except for fumarole 14, which showed an increase from 434 to 583°C. There were no visits in May; seismic monitoring recorded only one earthquake.
Seismicity increased during the early part of June, with a seismic cluster from 1 to 11 June SW of Momotombo consisting of more than 120 earthquakes. Thirty of these earthquakes occurred on 9 June. An event on 8 June was felt at the geothermal plant W of the volcano. The majority of these events were volcano-tectonic earthquakes with frequencies between 15 and 20 Hz. The unusual tornillos (screw-type events) have continued to occur at Momotombo, usually lasting 2-5 seconds with a dominant frequency of 5 Hz.
Only 16 earthquakes were recorded in July, four of them on 12 July; none were located. Tornillos continued with a frequency of 7.5 Hz in both July and August. Seismicity increased in August with a small seismic cluster and 176 registered earthquakes, mainly volcano-tectonic. The majority of the activity took place on 1 and 2 August, including one event felt by staff at the geothermal plant. Seismicity dropped dramatically in September, October, and November, with 7 and 12 volcano-tectonic events in September and October, respectively, and none in November. Visits were made on 19, 20, 21, and 22 November for gas sampling and temperature measurements. Temperatures were measured in 12 fumaroles and around the seismic stations at the base of the volcano. The highest temperatures were found at fumaroles 3, 4, 5, 8, and 9, with the maximum temperature of 768°C at fumarole 9. Temperatures at the three fumaroles around the seismic station were 89.9°C, 99.1°C, and 90.2°C.
Seismicity increased again in December 2002 and January 2003. A seismic cluster of 88 events was recorded during 24-25 December. Locations determined for 18 of the events put them all very close to the volcano. In January 55 tectonic earthquakes were registered. After January, seismicity dropped considerably. No earthquakes were registered in February, and only one was recorded in March.
Site visits in February included walking around the crater; no morphological changes were observed. The visit also included gas sampling and temperature measurements. Fumaroles 8 and 9 measured 759°C and 762°C, respectively; more monitoring on 8 and 27 March showed that temperatures were staying relatively constant. No visits were made in April, May, or June, but seismic monitoring continued. Although only one volcano-tectonic earthquake registered in April, tornillos continued, with frequencies above 12 Hz. There were 35 volcano-tectonic events in May, including a three-hour-long cluster on 30 May. Six seismic events registered in June.
A visit was made to the volcano on 12 July 2003; temperatures were similar to the previous months, ranging from 243°C at fumarole 13 to 737°C at fumarole 9. Two earthquakes registered in August; seismicity stayed low through September.
Geologic Background. Momotombo is a young stratovolcano that rises prominently above the NW shore of Lake Managua, forming one of Nicaragua's most familiar landmarks. Momotombo began growing about 4500 years ago at the SE end of the Marrabios Range and consists of a somma from an older edifice that is surmounted by a symmetrical younger cone with a 150 x 250 m wide summit crater. Young lava flows extend down the NW flank into the 4-km-wide Monte Galán caldera. The youthful cone of Momotombito forms an island offshore in Lake Managua. Momotombo has a long record of Strombolian eruptions, punctuated by occasional stronger explosive activity. The latest eruption, in 1905, produced a lava flow that traveled from the summit to the lower NE base. A small black plume was seen above the crater after a 10 April 1996 earthquake, but later observations noted no significant changes in the crater. A major geothermal field is located on the south flank.
Information Contacts: Martha Navarro, Emilio Talavera, and Virginia Tenorio, Instituto Nicaraguense de Estudios Territoriales (INETER), Dirección General de Geofísica, Apartado Postal 2110, Managua, Nicaragua (URL: http://www.ineter.gob.ni/).
Novarupta (United States) — September 2003 Cite this Report
Novarupta
United States
58.2655°N, 155.1588°W; summit elev. 841 m
All times are local (unless otherwise noted)
Strong winds resuspend old ash deposits, causing a large plume and distant ashfall
According to the National Weather Service, strong winds in the Katmai area on 21 September 2003 picked up old, loose volcanic ash and carried it E. Reports of minor ashfall were reported from Kodiak Island, ~ 100 km from Katmai. This phenomenon was not the result of volcanic activity and no eruption occurred.
Andrea Steffke of the Geophysical Institute, University of Alaska Fairbanks, reported a relatively large ash cloud observed in satellite images coming from the Katmai area on 21 September 2003. The cloud was first seen in satellite imagery (AVHRR, GOES, and MODIS) extending ~ 69 km to the SE. The maximum temperature difference observed was -1.46°C. Dave Schneider of the Alaska Volcano Observatory reported on 22 September 2003 that at its greatest extent the cloud was detectable for ~ 400 km. It was initially observed by an overflying (high-altitude) jet, and subsequently identified in split-window images from AVHRR, MODIS, and GOES satellites. Additional pilot reports placed the cloud top at ~ 2.1 km altitude.
The Katmai Group of volcanoes are seismically monitored by AVO, so it was possible to quickly confirm that an eruption had not taken place. SIGMETS were issued by the Alaska Aviation Weather Unit (AAWU) for this event and an AVO Information Release was distributed that indicated that this cloud of re-suspended ash was potentially hazardous to aircraft. This event is unusual in its intensity and extent of transport. The Katmai region is characterized by frequent high winds that can be strong enough to re-suspend large (several centimeters in size) pumice fragments, yet these events typically don't produce large, extensive airborne ash clouds.
Geologic Background. Novarupta, the least topographically prominent volcano in the Katmai area, was formed during a major eruption in 1912. This eruption was the world's largest during the 20th century and produced a voluminous rhyolitic airfall tephra and the renowned Valley of Ten Thousand Smokes (VTTS) ash flow. At the end of the eruption a small, 65-m-high, 400-m-wide lava dome grew within the source vent of the VTTS ashflow, a 2-km-wide area of subsidence NW of Trident volcano. The NE side of the Falling Mountain lava dome of the Trident volcanic cluster, as well as Broken Mountain and Baked Mountain, was removed by collapse of the Novarupta depression, which is marked by radial and scalloped arcuate fractures. Much larger collapse took place at Katmai volcano, 10 km E, where a 3 x 4 km caldera formed in response to magma reservoir drainage toward Novarupta.
Information Contacts: Alaska Volcano Observatory (AVO), a cooperative program of the U.S. Geological Survey, 4200 University Drive, Anchorage, AK 99508-4667, USA (URL: http://www.avo.alaska.edu/), the Geophysical Institute, University of Alaska, PO Box 757320, Fairbanks, AK 99775-7320, USA, and the Alaska Division of Geological and Geophysical Surveys, 794 University Ave., Suite 200, Fairbanks, AK 99709, USA.
Nyamulagira (DR Congo) — September 2003 Cite this Report
Nyamulagira
DR Congo
1.408°S, 29.2°E; summit elev. 3058 m
All times are local (unless otherwise noted)
Long-period earthquakes and swarms in July 2003
The last eruption at Nyamuragira occurred during 25 July-27 September 2002 (BGVN 27:07, 27:10, and 28:01). Tectonic and magmatic seismicity continued through June 2003, but there has been no confirmed eruptive activity. This report covers activity from early July to the beginning of August 2003. Seismicity generally consisted of long-period (LP) earthquakes on the NE side of the volcano. In addition, earthquake swarms were occasionally observed.
Between 6 and 12 July, seismicity was dominated by LP earthquakes NE of the volcano and SE along the fracture zone between Nyamuragira and Nyiragongo. Two large swarms occurred on 7 and 8 July, with 161 LP earthquakes and 10 short-period earthquakes. The earthquakes at Nyamuragira have been deep, between 15 and 20 km.
During 13-19 July 2003, LP earthquakes NE of the volcano again dominated seismicity. Compared to the previous week, activity was low, with no swarms and only one high-frequency earthquake. The following week, between 20 and 26 July, LP earthquakes continued in the NE and to a lesser extent along the SE fracture zone. Between 19 and 21 July new sequences of earthquakes occurred, with LP events followed by short-period earthquakes, coupled with high-amplitude tremor episodes.
Between 27 July and 2 August, LP earthquakes continued to dominate seismicity NE of the volcano as well as along the SE fracture zone. Seismicity increased from the previous week, with sequences of LP earthquakes coupled with volcanic tremor episodes between 28 and 31 July. Average seismicity doubled to 200 earthquakes with hypocenters between 3 and 20 km deep.
Geologic Background. Africa's most active volcano, Nyamulagira (also known as Nyamuragira), is a massive high-potassium basaltic shield about 25 km N of Lake Kivu and 13 km NNW of the steep-sided Nyiragongo volcano. The summit is truncated by a small 2 x 2.3 km caldera that has walls up to about 100 m high. Documented eruptions have occurred within the summit caldera, as well as from the numerous flank fissures and cinder cones. A lava lake in the summit crater, active since at least 1921, drained in 1938, at the time of a major flank eruption. Recent lava flows extend down the flanks more than 30 km from the summit as far as Lake Kivu; extensive lava flows from this volcano have covered 1,500 km2 of the western branch of the East African Rift.
Information Contacts: Goma Volcano Observatory, Departement de Geophysique, Centre de Recherche en Sciences Naturelles, Lwiro, D.S. Bukavu, DR Congo.
Nyiragongo (DR Congo) — September 2003 Cite this Report
Nyiragongo
DR Congo
1.52°S, 29.25°E; summit elev. 3470 m
All times are local (unless otherwise noted)
Continuing lava lake activity through mid-August
New reports of activity at Nyiragongo include observations from visits on 12-13 July and 14-15 August 2003. Seismicity was low during the report period, but tremor related to the lava lake continued to characterize volcanic activity. Staff at the Goma observatory have kept the hazard status for Nyiragongo at Yellow (Vigilance).
During 6-12 July two long-period earthquakes were detected. Four tectonic earthquakes registered to the S and beneath Lake Kivu; none of these were felt by area residents. Fracture measurements at Monigi, Mugara, and the Nyiragongo hut did not show any significant change from previous measurements, but at Lemera fracture spacing increased from 7.537 to 7.550 m, and there was an extension of 8 mm at Shaheru. Also during the visit, Pele's hair as long as 10-15 cm was observed between Shaheru and the crater; gas plumes were noted in the S, SW, and W, along with large scoriae. Crater observations indicated the possible formation of a third platform at 650 m depth. Two small vents formed NE of the main lava lake and there was significant degassing along the S base of the internal wall.
Between 13 and 19 July, seismic activity remained low, with four long-period earthquakes beneath the NE flank. No earthquakes were felt and only seven tectonic earthquakes were recorded to the S and beneath Lake Kivu. Volcanic tremor persisted, indicating activity in the lava lake. Fracture spacing measurements were taken at Shaheru and the Nyiragongo hut, but without noticeable changes (14.778 m at Shaheru 1, 29.602 m at Shaheru 2, and 0.942 m at Nyiragongo hut). Observations of fumarole openings had been reported by residents in the Mutwanga district. Also on 18 July investigations at Kiziba revealed a recent tongue of lava infiltrating older lava layers, found in a hole dug as a septic tank.
Volcanic tremors continued between 20 July and 2 August; no earthquakes were reported. Fracture measurements at Busholoza and Kabutembo did not indicate significant changes; temperature and deformation measurements at the top of Nyiragongo, the Nyiragongo hut, Shaheru, Mugara, and Monigi also did not reveal any notable changes. However, local CH4 (methane) was present at concentrations of 35.5%.
Between 1 and 3 August the lava lake appeared very active, with lava fountains up to 10 m high, projecting large but light scoriae into the atmosphere. Pele's hair was observed at Shaheru (2,200 m elevation) and heat radiating from the lake could be felt at the observation camp on the edge of the crater. Because of the considerable projection of volcanic products, pilots were advised to avoid the area.
Following a magnitude 5.2 earthquake in the Virunga region on 5 August, scientists from the Goma observatory visited Nyiragongo on 14-15 August. Measurements included deformation and gas geochemistry in fractures, and the lava lake was monitored. No significant deformation was observed at cracks on the S side of Nyiragongo. Gas measurements at Shaheru showed that local CO2 concentrations had increased by 1.7%, while methane there had doubled. At the top of Nyiragongo, however, measurements on 15 August were half those on 14 August. Late on 14 August a "swirl" of air caused gas to fill the crater, and ~ 2 hours later scientists as well as residents west of Virunga felt an earthquake. Another earthquake was felt in Kibati and at the crater on 15 August.
The lava lake appeared calm on 14 August, and two small vents were visible; only one was visible the next day. The lava lake was measured to be 260 m in diameter, nearly the same as on 2 August. Also during the visit scientists installed a scorimeter: Two hours worth of scoria, weighing 236.2 g per square meter, were sampled.
Geologic Background. The Nyiragongo stratovolcano contained a lava lake in its deep summit crater that was active for half a century before draining catastrophically through its outer flanks in 1977. The steep slopes contrast to the low profile of its neighboring shield volcano, Nyamuragira. Benches in the steep-walled, 1.2-km-wide summit crater mark levels of former lava lakes, which have been observed since the late-19th century. Two older stratovolcanoes, Baruta and Shaheru, are partially overlapped by Nyiragongo on the north and south. About 100 cones are located primarily along radial fissures south of Shaheru, east of the summit, and along a NE-SW zone extending as far as Lake Kivu. Many cones are buried by voluminous lava flows that extend long distances down the flanks, which is characterized by the eruption of foiditic rocks. The extremely fluid 1977 lava flows caused many fatalities, as did lava flows that inundated portions of the major city of Goma in January 2002.
Information Contacts: Goma Volcano Observatory, Departement de Geophysique, Centre de Recherche en Sciences Naturelles, Lwiro, D.S. Bukavu, DR Congo.
Poas (Costa Rica) — September 2003 Cite this Report
Poas
Costa Rica
10.2°N, 84.233°W; summit elev. 2697 m
All times are local (unless otherwise noted)
Hydrothermally active repose continues through 2002
This report concerns Poás during the interval September 2001 through December 2002. It draws on both a set of extensive half-year reports from UCR-ICE (Mora, 2001a, b; 2002) and monthly OVSICORI-UNA reports (available on the web, and sometimes prepared with co-authors Orlando Vaselli and Franco Tassi). OVSICORI-UNA reports were absent for November and December 2001.
Poás was non-eruptive during the reporting interval. The key focus of activity remains the main crater and its fumaroles, and its low-pH, variably colored lake. That lake is sometimes called Laguna Caliente or el Poás, but more frequently in past issues of the Bulletin simply described with terms like the active lake, lake in the active crater, hot lake, etc. During the reporting interval the active lake repeatedly changed pH, color, and temperature. As in the past, Laguna Caliente contained some thermally active zones, sometimes displaying up-welling water, bubbles, and zones of native sulfur. Lake Botos lies in a crater S of the active one. It remained inactive.
The origin and terminology for the main crater's dome or pyroclastic cone remains controversial; both terms are used in this report, congruent with those favored by the authors of summarized reports and included photos. Whatever its name or origin, this feature supports especially active fumaroles, and is frequently masked by steam.
Observers at the crater noted acoustical noise from vigorous degassing. Again, as typical, monthly reports consistently mentioned variable secondary fumarolic activity and occasional mass-wasting along the crater walls. Seismicity, including tremor, continued and is mentioned below, but it will be discussed more comprehensively in a later report.
UCR-ICE observations. Mora (2001b and 2002) included an overview photo of Poás (figure 74). Those reports also included numerous other photos of fumaroles and mass wasting, most of which are not shown here. Some pronounced arcuate cracks associated with mass wasting along the NE side of the lake were thought possibly related to changes in lake level and pore pressure (figure 75). A shot of the steaming dome appears as figure 76.
Mora (2001a, b and 2002) collected and presented considerable data on Laguna Caliente, and we include several available plots. Lake temperature and pH during 2001-2 appears as figure 77; precipitation and lake level for most of 2002, as figure 78.
Mora (2002) reported March-December 2002 precipitation ranging from 33 to 607 mm per month (figure 78). The lake's variable surface heights during March-December 2002 deviated from an established (arbitrary) datum (zero point), from which heights ranged from ~ 400 mm below the datum to ~ 100 mm above it. During this interval the lake's high stand occurred in December; it then covered the border of the lowest N terrace. The lowest stand for the interval occurred during May. During this time interval the variables of precipitation and lake height appeared to lack consistent correlation.
OVSICORI-UNA observations. During late 2001 and through 2002, low-frequency earthquakes continued to dominate the record, with OVSICORI-UNA reporting ~ 500 events per day on 8 September, but more typically 100-300 events per day. In addition during this interval instruments typically recorded several hours of tremor per month. During some months of the reporting interval, medium- and high-frequency earthquakes continued to occur in conjunction with new fumaroles appearing in the active crater.
The OVSICORI-UNA report discussing September 2002 noted that tremor rose slightly, prevailing for ~ 5 hours on each of several days. Long-period earthquakes numbered more than 100 per day, and typically 300-450 per day. Medium-frequency earthquakes occurred much less often, their numbers approaching ~ 20 per day on several days, and more typically fewer than 10 per day.
During the last half of 2002 the lake's water temperature rose above 30°C, attaining 39°C during September-December 2002. Lowered air temperatures in late 2002, particularly in November 2002, led to condensate forming over the lake's surface and rising to accumulate in larger, optically dense clouds (figure 79).
References. Mora, R., 2002, Informe anual de la actividad de la Cordillera Volcánica Central, 2002, Costa Rica (proofed and revised by Alvarado, G., Fernández, M., Mora, M., Paniagua S., and Ramírez, C.): Universidad de Costa Rica, Red Sismológica Nacional, UCR-ICE, Sección de Sismología, Vulcanologíay Exploración Geofísica (published June 2003 as mini-CD Rom with PDF files).
Mora, R., 2001a, Informe semestral de la actividad de la Cordillera Volcánica Central, Enero-Junio 2001, Costa Rica: Universidad de Costa Rica, Red Sismológica Nacional, UCR-ICE, Sección de Sismología, Vulcanologíay Exploración Geofísica (published November 2001 as mini-CD Rom with PDF files).
Mora, R., 2001b, Informe semestral de la actividad de la Cordillera Volcánica Central, Julio-Diciembre 2001, Costa Rica (proofed and revised by Alvarado, G., Fernández, M., Montero, W., and Ramírez, C.): Universidad de Costa Rica, Red Sismológica Nacional, UCR-ICE, Sección de Sismología, Vulcanologíay Exploración Geofísica (published 6 May 2001 as mini-CD Rom with PDF files).
Geologic Background. The broad vegetated edifice of Poás, one of the most active volcanoes of Costa Rica, contains three craters along a N-S line. The frequently visited multi-hued summit crater lakes of the basaltic-to-dacitic volcano are easily accessible by vehicle from the nearby capital city of San José. A N-S-trending fissure cutting the complex stratovolcano extends to the lower N flank, where it has produced the Congo stratovolcano and several lake-filled maars. The southernmost of the two summit crater lakes, Botos, last erupted about 7,500 years ago. The more prominent geothermally heated northern lake, Laguna Caliente, is one of the world's most acidic natural lakes, with a pH of near zero. It has been the site of frequent phreatic and phreatomagmatic eruptions since an eruption was reported in 1828. Eruptions often include geyser-like ejections of crater-lake water.
Information Contacts: R. Mora (Amador), C. Ramírez, and M. Fernández, Universidad de Costa Rica, Laboratorio de Sismologia, Vulcanología y Exploración Geofisica, Aptdo. 560-2300, Curridabat, San José, Costa Rica; E. Fernández, E. Duarte, E. Malavassi, R. Sáenz, V. Barboza, R. Van der Laat, T. Marino, E. Hernández, and F. Chavarría, Observatorio Vulcanológico y Sismológico de Costa Rica (OVSICORI-UNA); Jorge Barquero and Wendy Sáenz, Laboratorio de Química de la Atmósfera (LAQAT), Depto. de Química, Universidad Nacional, Heredia, Costa Rica; María Martínez (at both affiliations above); Orlando Vaselli and Franco Tassi, Department of Earth Sciences, University of Florence, Via La Pira 4, 50121 Florence, Italy.
Rabaul (Papua New Guinea) — September 2003 Cite this Report
Rabaul
Papua New Guinea
4.2459°S, 152.1937°E; summit elev. 688 m
All times are local (unless otherwise noted)
Frequent ash plumes from March through early October 2003
Reports from the Rabaul Volcanological Observatory (RVO) over the period 20 March-9 October show that ash eruptions from the Tavurvur cone at Rabaul are continuing. Activity has been nearly continuous since the major September 1994 eruption (BGVN 19:08).
Eruptions during 20 March-6 April were characterized by discrete, slow, convoluted ash plumes occurring at long irregular intervals rising slowly to several hundred meters over the summit. The ash plumes were mainly light to pale gray, blowing to the SE. Seismicity was generally low, with low- to intermediate-frequency events of 1-5 minute duration associated with the ash emissions, and greater energy expended over the first 10 seconds of the more forceful eruptions. Ground deformation fluctuated without showing any real trends.
Short forceful and slow sub-continuous discrete ash emissions were reported for 7-29 April. Light to pale gray ash-laden plumes rose as high as 1,500 m over the summit, blowing NW and SE on variable winds, with ash accumulation in Rabaul Town to the NW. Seismicity was generally low and reflected the eruptive activity. Most activity involved low-frequency, low-amplitude short- to long-duration sub-continuous volcanic tremors. Some high-frequency earthquakes were recorded NE of Rabaul Town. Deformation measurements showed minor inflation.
Steady ash eruptions continued during 7-12 May. While the ash content in individual plumes was fairly low, the accumulation of ash on the ground became quite significant within 5 km of the volcano. Seismicity was generally low (low-frequency earthquakes with durations of several minutes), reflecting summit activity. This increased to moderate seismicity over 10-12 May. Short-term ground-deformation measurements were ambiguous; long-term trends showed minor inflation.
There was a noticeable decline in ash eruptions and seismicity during 19-30 June, from one every few minutes to less than one per hour and then complete cessation on 29 June. Very occasional low roaring noises were heard early in the period. Tavurvur released only variable amounts of thin white vapor through 9 August. It began to erupt again on 10 August, with slow convoluted emissions of mainly white to pale-gray ash at irregular intervals blowing to the NW, including over the Rabaul Town area. Discrete moderate to large explosions began to occur on 25 August (1-3 per day). Occasional low rumbling noises were heard. Seismic activity was low and there were no significant ground movements.
From 29 August to 11 September the level of eruptive activity was low to moderate, characterized by convoluted ash clouds at short irregular intervals. Moderate explosions (3-6 per day) produced thick columns of pale gray to dark ash clouds rising 2-4 km above the summit. The prevailing SE winds resulted in ashfall to the NW, including in the Rabaul Town area. Seismic activity was low, with some high-frequency earthquakes NE of Rabaul Caldera and no significant ground-deformation movements.
The level of eruptive activity was generally low during 12-25 September (figure 38), with light to pale gray ash clouds rising 500-1,500 m above the summit and light downwind ashfall in the early part of the reporting period. Over 22-25 September the ash cloud emissions became light gray, with high water vapor content. Low to moderate rumbling noises were heard, but seismic activity was low and ground deformation movements were not significant.
Eruptive activity continued at a low level from 26 September to 9 October, with light to pale gray emissions (containing some ash but mostly water vapor) rising 500-1,500 m. The emissions occurred at long, irregular intervals, and many were accompanied by low roaring and rumbling noises. Very fine ash was blown mainly to the N and NW. Seismic activity was low, with no high-frequency earthquakes inside the caldera or NE of the caldera. Ground-deformation measurements showed a long-term inflationary trend between May and September, but the magnitude of change was small.
Geologic Background. The low-lying Rabaul caldera on the tip of the Gazelle Peninsula at the NE end of New Britain forms a broad sheltered harbor utilized by what was the island's largest city prior to a major eruption in 1994. The outer flanks of the asymmetrical shield volcano are formed by thick pyroclastic-flow deposits. The 8 x 14 km caldera is widely breached on the east, where its floor is flooded by Blanche Bay and was formed about 1,400 years ago. An earlier caldera-forming eruption about 7,100 years ago is thought to have originated from Tavui caldera, offshore to the north. Three small stratovolcanoes lie outside the N and NE caldera rims. Post-caldera eruptions built basaltic-to-dacitic pyroclastic cones on the caldera floor near the NE and W caldera walls. Several of these, including Vulcan cone, which was formed during a large eruption in 1878, have produced major explosive activity during historical time. A powerful explosive eruption in 1994 occurred simultaneously from Vulcan and Tavurvur volcanoes and forced the temporary abandonment of Rabaul city.
Information Contacts: Ima Itikarai and Steve Saunders, Rabaul Volcanological Observatory, P.O. Box 386, Rabaul, Papua New Guinea; William Kiene, UCLA, 405 Hilgard Avenue, Box 951361, Los Angeles, CA 90095-1361.
Semeru (Indonesia) — September 2003 Cite this Report
Semeru
Indonesia
8.108°S, 112.922°E; summit elev. 3657 m
All times are local (unless otherwise noted)
Frequent ash explosions continue through September
Volcanic activity at Semeru between 30 June and 28 September remained at high levels. Except for the middle two weeks of July, ash explosions were reported several times every week, producing white-gray plumes that rose 400-500 m above the summit. Recorded seismic data (table 13) reflected this continued activity, with between 447 and 804 explosion events weekly (~ 88 per day on average over this 90-day period). Avalanche events, tremor, tectonic, deep-volcanic, shallow-volcanic, and flood-related seismicity were also recorded. A pilot report from Qantas noted a plume to twice the height of the volcano (~ 7.2 km altitude) on 9 September that was drifting S. The hazard status remained at Alert Level 2 throughout the report period.
Table 13. Seismicity at Semeru, 30 June-28 September 2003. Courtesy of VSI.
| Date |
Explosion |
Avalanche |
Tremor |
Other |
Tectonic |
| 30 Jun-06 Jul 2003 |
611 |
7 |
6 |
-- |
7 |
| 07 Jul-13 Jul 2003 |
615 |
10 |
18 |
2 deep |
9 |
| 14 Jul-20 Jul 2003 |
579 |
19 |
1 |
-- |
8 |
| 21 Jul-27 Jul 2003 |
529 |
11 |
7 |
-- |
10 |
| 28 Jul-03 Aug 2003 |
447 |
21 |
5 |
-- |
6 |
| 04 Aug-10 Aug 2003 |
499 |
20 |
10 |
1 shallow |
5 |
| 11 Aug-17 Aug 2003 |
550 |
8 |
16 |
-- |
6 |
| 18 Aug-24 Aug 2003 |
516 |
13 |
2 |
1 shallow |
10 |
| 25 Aug-31 Aug 2003 |
804 |
11 |
1 |
-- |
7 |
| 01 Sep-07 Sep 2003 |
735 |
12 |
0 |
0 |
6 |
| 08 Sep-14 Sep 2003 |
699 |
30 |
1 |
1 flood |
5 |
| 15 Sep-21 Sep 2003 |
731 |
11 |
5 |
0 |
8 |
| 22 Sep-28 Sep 2003 |
636 |
20 |
9 |
0 |
4 |
Geologic Background. Semeru, the highest volcano on Java, and one of its most active, lies at the southern end of a volcanic massif extending north to the Tengger caldera. The steep-sided volcano, also referred to as Mahameru (Great Mountain), rises above coastal plains to the south. Gunung Semeru was constructed south of the overlapping Ajek-ajek and Jambangan calderas. A line of lake-filled maars was constructed along a N-S trend cutting through the summit, and cinder cones and lava domes occupy the eastern and NE flanks. Summit topography is complicated by the shifting of craters from NW to SE. Frequent 19th and 20th century eruptions were dominated by small-to-moderate explosions from the summit crater, with occasional lava flows and larger explosive eruptions accompanied by pyroclastic flows that have reached the lower flanks of the volcano.
Information Contacts: Dali Ahmad and Nia Haerani, Volcanological Survey of Indonesia (VSI), Jalan Diponegoro No. 57, Bandung 40122, Indonesia (URL: http://www.vsi.esdm.go.id/); Darwin Volcanic Ash Advisory Centre (VAAC), Bureau of Meteorology, Northern Territory Regional Office, PO Box 40050, Casuarina, NT 0811, Australia (URL: http://www.bom.gov.au/info/vaac/).
Tandikat-Singgalang (Indonesia) — September 2003 Cite this Report
Tandikat-Singgalang
Indonesia
0.39°S, 100.331°E; summit elev. 2854 m
All times are local (unless otherwise noted)
Brief episode of increased seismicity during January-February 2002
Volcanic seismicity at Tandikat increased significantly following a felt event (MM III) on 20 January 2002 (table 1). Deep-volcanic earthquakes totaled 149 during the week of 20-26 January, a period when 174 tectonic events were also recorded. Both types of earthquakes decreased significantly the next week, and gradually declined further over the following two weeks. The weekly report for 27 January-2 February noted that visual observations were not possible due to thick fog. The hazard status was set at Alert Level 2 (on a scale of 1-4) on 25 January 2002 and remained at that level through 16 February.
Geologic Background. Tandikat and its twin volcano to the NNE, Singgalang, lie across the Bukittinggi plain from Marapi volcano. Volcanic activity has migrated to the SSW from the higher Singgalang, and only Tandikat has had historical activity. The summit of Tandikat has a partially eroded 1.2-km-wide crater containing a large central cone capped by a 360-m-wide crater with a small crater lake. The only three reported historical eruptions, in the late 19th and early 20th centuries, produced only mild explosive activity.
Information Contacts: Dali Ahmad, Volcanological Survey of Indonesia (VSI), Jalan Diponegoro No. 57, Bandung 40122, Indonesia (URL: http://www.vsi.esdm.go.id/).
Tangkoko-Duasudara (Indonesia) — September 2003 Cite this Report
Tangkoko-Duasudara
Indonesia
1.518°N, 125.185°E; summit elev. 1334 m
All times are local (unless otherwise noted)
Volcanic earthquakes during October 2002-January 2003
The Volcanological Survey of Indonesia (VSI) reported deep volcanic and A-type earthquakes at Tongkoko (also known as Tangkoko) over the period 7 October-24 November 2002 and more deep-volcanic events during 23 December 2002-19 January 2003 (table 1). The earthquakes, which began in May 2002, were recorded following relocation of an observatory post to Wainenet village in the Bitung area. The temperature at Batu Angus hot spring on 10 October 2002 was 70-73°C. While no visible activity has been observed, the hazard status was raised to Alert Level 2 (on a scale of 1-4) on 24 October 2002 as a result of the increased seismicity. The last recorded activity at Tongkoko consisted of flank lava flows and lava dome extrusion in 1880.
Table 1. Earthquakes recorded at Tongkoko, 7 October 2002-19 January 2003. In addition, one shallow volcanic event was recorded during 13-19 January 2003, and single B-type earthquakes each occurred during 21-27 October and 4-10 November 2002. Courtesy of VSI.
| Date |
Deep Volcanic (B-type) |
Shallow volcanic (A-type) |
Tectonic |
| 07 Oct-13 Oct 2002 |
4 |
-- |
-- |
| 14 Oct-20 Oct 2002 |
-- |
12 |
23 |
| 21 Oct-27 Oct 2002 |
-- |
9 |
34 |
| 28 Oct-03 Nov 2002 |
-- |
17 |
19 |
| 04 Nov-10 Nov 2002 |
-- |
9 |
38 |
| 11 Nov-18 Nov 2002 |
-- |
2 |
37 |
| 19 Nov-24 Nov 2002 |
-- |
2 |
25 |
| 23 Dec-29 Dec 2002 |
5 |
-- |
16 |
| 06 Jan-12 Jan 2003 |
11 |
-- |
21 |
| 13 Jan-19 Jan 2003 |
5 |
-- |
28 |
Geologic Background. The eastern peninsula at the far NE end of Sulawesi near the city of Bitung is occupied by a volcanic complex consisting of two major edifices within a nature reserve. To the north is Tangkoko (also known as Tongkoko), with a large caldera (~3 x 1.5 km) elongated towards the SE from the highest rim point; the rim at the opposite end is more than 400 m lower. Eruptions occurred from the summit crater in the 17th century and in 1801, when the caldera also reportedly contained a cone surrounded by a lake. About 1.5 km down the outer E flank is the Batuangus (or Batu Angus) lava dome, formed in 1801, along with an adjacent vent (Baru Batuangus) that has been the source of all subsequent eruptions. The higher twin-peaked Duasudara (also Dua Suadara) stratovolcano is about 4.5 km SW of the Tangkoko summit. A NE-facing open crater appears to have a hummocky debris flow that reaches the base of the Tangkoko edifice.
Information Contacts: Dali Ahmad, Hetty Triastuty, Nia Haerani, and Suswati, Volcanological Survey of Indonesia (VSI), Jalan Diponegoro No. 57, Bandung 40122, Indonesia (URL: http://www.vsi.esdm.go.id/).
Ulawun (Papua New Guinea) — September 2003 Cite this Report
Ulawun
Papua New Guinea
5.05°S, 151.33°E; summit elev. 2334 m
All times are local (unless otherwise noted)
White vapor emissions from the main crater; offshore effervescence
Variable amounts of emergent vapor and minor debris flows at Ulawun were reported during January-March 2003 (BGVN 28:03). Rabaul Volcanological Observatory (RVO) reports, covering much of the period 14 April-5 October 2003, indicated the volcano remained quiet over this time, without emissions from the N-valley vent.
The main summit crater continued to release weak to moderate volumes of white (occasionally white-gray) vapor during 14-29 April, 7-27 May, and 11-18 June. Seismicity was low except for an episode of volcanic tremor between 15 and 19 April. Gas effervescence was reported close offshore of Ulamona Jetty in the second half of April. A slight increase in seismicity was noted between 18 and 23 May.
The period 25 June-22 July was quiet, with no audible noise or night-time glow, and weak to moderate volumes of vapor from the main summit crater. The Volcanic Ash Advisory Center in Darwin reported these plumes as being visible on weather satellite imagery. The plumes appeared white-gray on occasions and were unusually strong bluish white gray over the last three days of the period. Volcanic seismicity was low, with several strongly felt tectonic earthquakes on the night of 3-4 July. A large regional earthquake centered 45 km N of Rabaul affected the area on 16 July, leading to a large tiltmeter offset, which slowly recovered over the following days.
Reports for the period 12 September-5 October indicated that the main summit continued to release weak to moderate volumes of white vapor, with occasional white-gray emissions. Seismicity was low with no significant ground movements.
Geologic Background. The symmetrical basaltic-to-andesitic Ulawun stratovolcano is the highest volcano of the Bismarck arc, and one of Papua New Guinea's most frequently active. The volcano, also known as the Father, rises above the N coast of the island of New Britain across a low saddle NE of Bamus volcano, the South Son. The upper 1,000 m is unvegetated. A prominent E-W escarpment on the south may be the result of large-scale slumping. Satellitic cones occupy the NW and E flanks. A steep-walled valley cuts the NW side, and a flank lava-flow complex lies to the south of this valley. Historical eruptions date back to the beginning of the 18th century. Twentieth-century eruptions were mildly explosive until 1967, but after 1970 several larger eruptions produced lava flows and basaltic pyroclastic flows, greatly modifying the summit crater.
Information Contacts: Ima Itikarai, Rabaul Volcanological Observatory, P.O. Box 386, Rabaul, Papua New Guinea; Darwin Volcanic Ash Advisory Centre (VAAC), Bureau of Meteorology, Northern Territory Regional Office, PO Box 40050, Casuarina, NT 0811, Australia (URL: http://www.bom.gov.au/info/vaac/).
Witori (Papua New Guinea) — September 2003 Cite this Report
Witori
Papua New Guinea
5.5745°S, 150.5161°E; summit elev. 724 m
All times are local (unless otherwise noted)
Minor seismicity and vapor emissions; no lava effusion as of 22 May
The eruption at Pago that began in August 2002 continued during early 2003 with lava effusion through at least 28 February and vapor emissions (BGVN 28:03). The Rabaul Volcanological Observatory (RVO) reports that activity at Pago continued, but remained low, from 14 April through 9 October 2003.
The line of vents on the NW slope of Pago continued to release small amounts of thin white vapor over the whole of the period. Occasional weak audible booming noises were heard (eg. on 20 April) and roaring noises were heard on 24 April, 6 May, and 22 May. Very small traces of blue vapor were seen coming from the lower vents on 8 May.
An aerial inspection on 22 May showed that lava effusion from the NW vent had ceased since the February inspection; there were no indications of fresh lava near the vent, no movement of the N and S lobes, and no change in the height of lava against the caldera wall. It also revealed a new fumarolic area to the E.
Monitoring instruments were restored on 19 May. Leveling measurements showed a few centimeters of inflation compared to December 2002. This was considered by RVO to be very significant when compared to previous measurements, but may have been due to nearby roadwork.
Less than 20 volcano-tectonic earthquakes per day were recorded during 25-30 June. A local tectonic earthquake on 9 August seemed to lead to an increase in energy release and event numbers at one seismic station, but it may have been an instrumentation problem. An airborne spectrophotometer revealed only trace amounts of SO2 in early August. Between two and seven volcano-tectonic earthquakes per day were reported in the 26 September-9 October period.
Geologic Background. The active Pago cone has grown within the Witori caldera (5.5 x 7.5 km) on the northern coast of central New Britain contains the active Pago cone. The gently sloping outer caldera flanks consist primarily of dacitic pyroclastic-flow and airfall deposits produced during a series of five major explosive eruptions from about 5,600 to 1,200 years ago, many of which may have been associated with caldera formation. Pago cone may have formed less than 350 years ago; it has grown to a height above the caldera rim, and a series of ten dacitic lava flows from it covers much of the caldera floor. The youngest of these was erupted during 2002-2003 from vents extending from the summit nearly to the NW caldera wall. The Buru caldera cuts the SW flank.
Information Contacts: Ima Itikarai, Rabaul Volcanological Observatory, P.O. Box 386, Rabaul, Papua New Guinea.