Recently Published Bulletin Reports
Erebus (Antarctica) Lava lake remains active; most thermal alerts recorded since 2019
Rincon de la Vieja (Costa Rica) Frequent phreatic explosions during July-December 2023
Bezymianny (Russia) Explosion on 18 October 2023 sends ash plume 8 km high; lava flows and incandescent avalanches
Kilauea (United States) Low-level lava effusions in the lava lake at Halema’uma’u during July-December 2022
Nyamulagira (DR Congo) Lava flows and thermal activity during May-October 2023
Bagana (Papua New Guinea) Explosions, ash plumes, ashfall, and lava flows during April-September 2023
Mayon (Philippines) Lava flows, pyroclastic flows, ash emissions, and seismicity during April-September 2023
Nishinoshima (Japan) Eruption plumes and gas-and-steam plumes during May-August 2023
Krakatau (Indonesia) White gas-and-steam plumes and occasional ash plumes during May-August 2023
Villarrica (Chile) Strombolian activity, gas-and-ash emissions, and crater incandescence during April-September 2023
Merapi (Indonesia) Frequent incandescent avalanches during April-September 2023
Ebeko (Russia) Moderate explosive activity with ash plumes continued during June-November 2023
Erebus (Antarctica) — January 2024  Cite this Report
Erebus
Antarctica
77.53°S, 167.17°E; summit elev. 3794 m
All times are local (unless otherwise noted)
Lava lake remains active; most thermal alerts recorded since 2019
The lava lake in the summit crater of Erebus has been active since at least 1972. Located in Antarctica overlooking the McMurdo Station on Ross Island, it is the southernmost active volcano on the planet. Because of the remote location, activity is primarily monitored by satellites. This report covers activity during 2023.
The number of thermal alerts recorded by the Hawai'i Institute of Geophysics and Planetology’s MODVOLC Thermal Alerts System increased considerably in 2023 compared to the years 2020-2022 (table 9). In contrast to previous years, the MODIS instruments aboard the Aqua and Terra satellites captured data from Erebus every month during 2023. Consistent with previous years, the lowest number of anomalous pixels were recorded in January, November, and December.
Table 9. Number of monthly MODIS-MODVOLC thermal alert pixels recorded at Erebus during 2017-2023. See BGVN 42:06 for data from 2000 through 2016. The table was compiled using data provided by the HIGP – MODVOLC Thermal Alerts System.
| Year |
Jan |
Feb |
Mar |
Apr |
May |
Jun |
Jul |
Aug |
Sep |
Oct |
Nov |
Dec |
SUM |
| 2017 |
0 |
21 |
9 |
0 |
0 |
1 |
11 |
61 |
76 |
52 |
0 |
3 |
234 |
| 2018 |
0 |
21 |
58 |
182 |
55 |
17 |
137 |
172 |
103 |
29 |
0 |
0 |
774 |
| 2019 |
2 |
21 |
162 |
151 |
55 |
56 |
75 |
53 |
29 |
19 |
1 |
0 |
624 |
| 2020 |
0 |
2 |
16 |
18 |
4 |
4 |
1 |
3 |
18 |
3 |
1 |
6 |
76 |
| 2021 |
0 |
9 |
1 |
0 |
2 |
56 |
46 |
47 |
35 |
52 |
5 |
3 |
256 |
| 2022 |
1 |
13 |
55 |
22 |
15 |
32 |
39 |
19 |
31 |
11 |
0 |
0 |
238 |
| 2023 |
2 |
33 |
49 |
82 |
41 |
32 |
70 |
64 |
42 |
17 |
5 |
11 |
448 |
Sentinel-2 infrared images showed one or two prominent heat sources within the summit crater, accompanied by adjacent smaller sources, similar to recent years (see BGVN 46:01, 47:02, and 48:01). A unique image was obtained on 25 November 2023 by the OLI-2 (Operational Land Imager-2) on Landsat 9, showing the upper part of the volcano surrounded by clouds (figure 32).
Geologic Background. Mount Erebus, the world's southernmost historically active volcano, overlooks the McMurdo research station on Ross Island. It is the largest of three major volcanoes forming the crudely triangular Ross Island. The summit of the dominantly phonolitic volcano has been modified by one or two generations of caldera formation. A summit plateau at about 3,200 m elevation marks the rim of the youngest caldera, which formed during the late-Pleistocene and within which the modern cone was constructed. An elliptical 500 x 600 m wide, 110-m-deep crater truncates the summit and contains an active lava lake within a 250-m-wide, 100-m-deep inner crater; other lava lakes are sometimes present. The glacier-covered volcano was erupting when first sighted by Captain James Ross in 1841. Continuous lava-lake activity with minor explosions, punctuated by occasional larger Strombolian explosions that eject bombs onto the crater rim, has been documented since 1972, but has probably been occurring for much of the volcano's recent history.
Information Contacts: Hawai'i Institute of Geophysics and Planetology (HIGP) - MODVOLC Thermal Alerts System, School of Ocean and Earth Science and Technology (SOEST), Univ. of Hawai'i, 2525 Correa Road, Honolulu, HI 96822, USA (URL: http://modis.higp.hawaii.edu/); Copernicus Browser, Copernicus Data Space Ecosystem, European Space Agency (URL: https://dataspace.copernicus.eu/browser/); NASA Earth Observatory, EOS Project Science Office, NASA Goddard Space Flight Center, Goddard, Maryland, USA (URL: https://earthobservatory.nasa.gov/images/152134/erebus-breaks-through).
Rincon de la Vieja (Costa Rica) — January 2024 Cite this Report
Rincon de la Vieja
Costa Rica
10.83°N, 85.324°W; summit elev. 1916 m
All times are local (unless otherwise noted)
Frequent phreatic explosions during July-December 2023
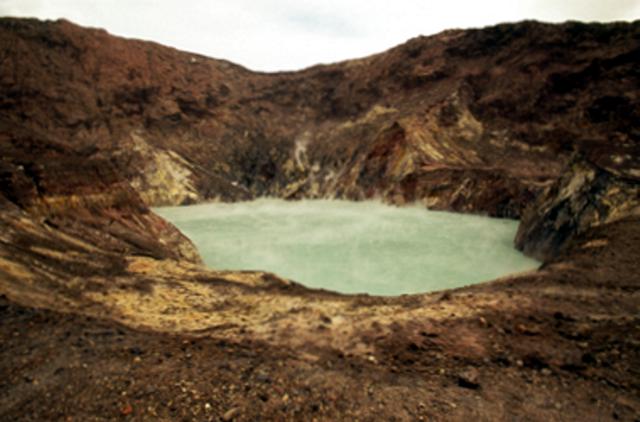
Rincón de la Vieja is a volcanic complex in Costa Rica with a hot convecting acid lake that exhibits frequent weak phreatic explosions, gas-and-steam emissions, and occasional elevated sulfur dioxide levels (BGVN 45:10, 46:03, 46:11). The current eruption period began June 2021. This report covers activity during July-December 2023 and is based on weekly bulletins and occasional daily reports from the Observatorio Vulcanologico Sismologica de Costa Rica-Universidad Nacional (OVSICORI-UNA).
Numerous weak phreatic explosions continued during July-December 2023, along with gas-and-steam emissions and plumes that rose as high as 3 km above the crater rim. Many weekly OVSICORI-UNA bulletins included the previous week's number of explosions and emissions (table 9). For many explosions, the time of explosion was given (table 10). Frequent seismic activity (long-period earthquakes, volcano-tectonic earthquakes, and tremor) accompanied the phreatic activity.
Table 9. Number of reported weekly phreatic explosions and gas-and-steam emissions at Rincón de la Vieja, July-December 2023. Counts are reported for the week before the Weekly Bulletin date; not all reports included these data. Courtesy of OVSICORI-UNA.
| OVSICORI Weekly Bulletin |
Number of explosions |
Number of emissions |
| 28 Jul 2023 |
6 |
14 |
| 4 Aug 2023 |
10 |
12 |
| 1 Sep 2023 |
13 |
11 |
| 22 Sep 2023 |
12 |
13 |
| 29 Sep 2023 |
6 |
11 |
| 6 Oct 2023 |
12 |
5 |
| 13 Oct 2023 |
7 |
9 |
| 20 Oct 2023 |
1 |
15 |
| 27 Oct 2023 |
3 |
23 |
| 3 Nov 2023 |
3 |
10 |
| 17 Nov 2023 |
0 |
Some |
| 24 Nov 2023 |
0 |
14 |
| 8 Dec 2023 |
4 |
16 |
| 22 Dec 2023 |
8 |
18 |
Table 10. Summary of activity at Rincón de la Vieja during July-December 2023. Weak phreatic explosions and gas emissions are noted where the time of explosion was indicated in the weekly or daily bulletins. Height of plumes or emissions are distance above the crater rim. Courtesy of OVSICORI-UNA.
| Date |
Time |
Description of Activity |
| 1 Jul 2023 |
0156 |
Explosion. |
| 2 Jul 2023 |
0305 |
Explosion. |
| 4 Jul 2023 |
0229, 0635 |
Event at 0635 produced a gas-and-steam plume that rose 700 m and drifted W; seen by residents in Liberia (21 km SW). |
| 9 Jul 2023 |
1843 |
Explosion. |
| 21 Jul 2023 |
0705 |
Explosion. |
| 26 Jul 2023 |
1807 |
Explosion. |
| 28 Jul 2023 |
0802 |
Explosion generated a gas-and-steam plume that rose 500 m. |
| 30 Jul 2023 |
1250 |
Explosion. |
| 31 Jul 2023 |
2136 |
Explosion. |
| 11 Aug 2023 |
0828 |
Explosion. |
| 18 Aug 2023 |
1304 |
Explosion. |
| 21 Aug 2023 |
1224 |
Explosion generated gas-and-steam plumes rose 500-600 m. |
| 22 Aug 2023 |
0749 |
Explosion generated gas-and-steam plumes rose 500-600 m. |
| 24 Aug 2023 |
1900 |
Explosion. |
| 25 Aug 2023 |
0828 |
Event produced a steam-and-gas plume that rose 3 km and drifted NW. |
| 27-28 Aug 2023 |
0813 |
Four small events; the event at 0813 on 28 August lasted two minutes and generated a steam-and-gas plume that rose 2.5 km. |
| 1 Sep 2023 |
1526 |
Explosion generated plume that rose 2 km and ejected material onto the flanks. |
| 2-3 Sep 2023 |
- |
Small explosions detected in infrasound data. |
| 4 Sep 2023 |
1251 |
Gas-and-steam plume rose 1 km and drifted W. |
| 7 Nov 2023 |
1113 |
Explosion. |
| 8 Nov 2023 |
0722 |
Explosion. |
| 12 Nov 2023 |
0136 |
Small gas emissions. |
| 14 Nov 2023 |
0415 |
Small gas emissions. |
According to OVSICORI-UNA, during July-October the average weekly sulfur dioxide (SO2) flux ranged from 68 to 240 tonnes/day. However, in mid-November the flux increased to as high as 334 tonnes/day, the highest value measured in recent years. The high SO2 flux in mid-November was also detected by the TROPOMI instrument on the Sentinel-5P satellite (figure 43).
Geologic Background. Rincón de la Vieja, the largest volcano in NW Costa Rica, is a remote volcanic complex in the Guanacaste Range. The volcano consists of an elongated, arcuate NW-SE-trending ridge constructed within the 15-km-wide early Pleistocene Guachipelín caldera, whose rim is exposed on the south side. Sometimes known as the "Colossus of Guanacaste," it has an estimated volume of 130 km3 and contains at least nine major eruptive centers. Activity has migrated to the SE, where the youngest-looking craters are located. The twin cone of Santa María volcano, the highest peak of the complex, is located at the eastern end of a smaller, 5-km-wide caldera and has a 500-m-wide crater. A Plinian eruption producing the 0.25 km3 Río Blanca tephra about 3,500 years ago was the last major magmatic eruption. All subsequent eruptions, including numerous historical eruptions possibly dating back to the 16th century, have been from the prominent active crater containing a 500-m-wide acid lake located ENE of Von Seebach crater.
Information Contacts: Observatorio Vulcanológico Sismológica de Costa Rica-Universidad Nacional (OVSICORI-UNA), Apartado 86-3000, Heredia, Costa Rica (URL: http://www.ovsicori.una.ac.cr/); NASA Global Sulfur Dioxide Monitoring Page, Atmospheric Chemistry and Dynamics Laboratory, NASA Goddard Space Flight Center (NASA/GSFC), 8800 Greenbelt Road, Goddard MD 20771, USA (URL: https://so2.gsfc.nasa.gov/).
Bezymianny (Russia) — November 2023 Cite this Report
Bezymianny
Russia
55.972°N, 160.595°E; summit elev. 2882 m
All times are local (unless otherwise noted)
Explosion on 18 October 2023 sends ash plume 8 km high; lava flows and incandescent avalanches
Bezymianny, located on Russia’s Kamchatka Peninsula, has had eruptions since 1955 characterized by dome growth, explosions, pyroclastic flows, ash plumes, and ashfall. Activity during November 2022-April 2023 included gas-and-steam emissions, lava dome collapses generating avalanches, and persistent thermal activity. Similar eruptive activity continued from May through October 2023, described here based on information from weekly and daily reports of the Kamchatka Volcano Eruptions Response Team (KVERT), notices from Tokyo VAAC (Volcanic Ash Advisory Center), and from satellite data.
Overall activity decreased after the strong period of activity in late March through April 2023, which included ash explosions during 29 March and 7-8 April 2023 that sent plumes as high as 10-12 km altitude, along with dome growth and lava flows (BGVN 48:05). This reduced activity can be seen in the MIROVA thermal detection system graph (figure 56), which was consistent with data from the MODVOLC thermal detection system and with Sentinel-2 satellite images that showed persistent hotspots in the summit crater when conditions allowed observations. A renewed period of strong activity began in mid-October 2023.
Activity increased significantly on 17 October 2023 when large collapses began during 0700-0830 on the E flanks of the lava dome and continued to after 0930 the next day (figure 57). Ash plumes rose to an altitude of 4.5-5 km, extending 220 km NNE by 18 October. A large explosion at 1630 on 18 October produced an ash plume that rose to an altitude of 11 km (8 km above the summit) and drifted NNE and then NW, extending 900 km NW within two days at an altitude of 8 km. Minor ashfall was noted in Kozyrevsk (45 km WNW). At 0820 on 20 October an ash plume was identified in satellite images drifting 100 km ENE at altitudes of 4-4.5 km.
Lava flows and hot avalanches from the dome down the SE flank continued over the next few days, including 23 October when clear conditions allowed good observations (figures 58 and 59). A large thermal anomaly was observed over the volcano through 24 October, and in the summit crater on 30 October (figure 60). Strong fumarolic activity continued, with numerous avalanches and occasional incandescence. By the last week of October, volcanic activity had decreased to a level consistent with that earlier in the reporting period.
Aviation warnings were frequently updated during 17-20 October. KVERT issued a Volcano Observatory Notice for Aviation (VONA) on 17 October at 1419 and 1727 (0219 and 0527 UTC) raising the Aviation Color Code (ACC) from Yellow to Orange (second highest level). The next day, KVERT issued a VONA at 1705 (0505 UTC) raising the ACC to Red (highest level) but lowered it back to Orange at 2117 (0917 UTC). After another decrease to Yellow and back to Orange, the ACC was reduced to Yellow on 20 October at 1204 (0004 UTC). In addition, the Tokyo VAAC issued a series of Volcanic Ash Advisories beginning on 16 October and continuing through 30 October.
Geologic Background. The modern Bezymianny, much smaller than its massive neighbors Kamen and Kliuchevskoi on the Kamchatka Peninsula, was formed about 4,700 years ago over a late-Pleistocene lava-dome complex and an edifice built about 11,000-7,000 years ago. Three periods of intensified activity have occurred during the past 3,000 years. The latest period, which was preceded by a 1,000-year quiescence, began with the dramatic 1955-56 eruption. This eruption, similar to that of St. Helens in 1980, produced a large open crater that was formed by collapse of the summit and an associated lateral blast. Subsequent episodic but ongoing lava-dome growth, accompanied by intermittent explosive activity and pyroclastic flows, has largely filled the 1956 crater.
Information Contacts: Kamchatka Volcanic Eruptions Response Team (KVERT), Far Eastern Branch, Russian Academy of Sciences, 9 Piip Blvd., Petropavlovsk-Kamchatsky, 683006, Russia (URL: http://www.kscnet.ru/ivs/kvert/); Kamchatka Volcanological Station, Kamchatka Branch of Geophysical Survey, (KB GS RAS), Klyuchi, Kamchatka Krai, Russia (URL: http://volkstat.ru/); Tokyo Volcanic Ash Advisory Center (VAAC), 1-3-4 Otemachi, Chiyoda-ku, Tokyo 100-8122, Japan (URL: http://ds.data.jma.go.jp/svd/vaac/data/); Hawai'i Institute of Geophysics and Planetology (HIGP) - MODVOLC Thermal Alerts System, School of Ocean and Earth Science and Technology (SOEST), Univ. of Hawai'i, 2525 Correa Road, Honolulu, HI 96822, USA (URL: http://modis.higp.hawaii.edu/); MIROVA (Middle InfraRed Observation of Volcanic Activity), a collaborative project between the Universities of Turin and Florence (Italy) supported by the Centre for Volcanic Risk of the Italian Civil Protection Department (URL: http://www.mirovaweb.it/); Copernicus Browser, Copernicus Data Space Ecosystem, European Space Agency (URL: https://dataspace.copernicus.eu/browser/).chr
Kilauea (United States) — January 2023 Cite this Report
Kilauea
United States
19.421°N, 155.287°W; summit elev. 1222 m
All times are local (unless otherwise noted)
Low-level lava effusions in the lava lake at Halema’uma’u during July-December 2022
Kīlauea is the southeastern-most volcano in Hawaii and overlaps the E flank of the Mauna Loa volcano. Its East Rift Zone (ERZ) has been intermittently active for at least 2,000 years. An extended eruption period began in January 1983 and was characterized by open lava lakes and lava flows from the summit caldera and the East Rift Zone. During May 2018 magma migrated into the Lower East Rift Zone (LERZ) and opened 24 fissures along a 6-km-long NE-trending fracture zone that produced lava flows traveling in multiple directions. As lava emerged from the fissures, the lava lake at Halema'uma'u drained and explosions sent ash plumes to several kilometers altitude (BGVN 43:10).
The current eruption period started during September 2021 and has recently been characterized by lava effusions, spatter, and sulfur dioxide emissions in the active Halema’uma’u lava lake (BGVN 47:08). Lava effusions, some spatter, and sulfur dioxide emissions have continued during this reporting period of July through December 2022 using daily reports, volcanic activity notices, and abundant photo, map, and video data from the US Geological Survey's (USGS) Hawaiian Volcano Observatory (HVO).
Summary of activity during July-December 2022. Low-level effusions have continued at the western vent of the Halema’uma’u crater during July through early December 2022. Occasional weak ooze-outs (also called lava break outs) would occur along the margins of the crater floor. The overall level of the active lava lake throughout the reporting period gradually increased due to infilling, however it stagnated in mid-September (table 13). During September through November, activity began to decline, though lava effusions persisted at the western vent. By 9 December, the active part of the lava lake had completely crusted over, and incandescence was no longer visible.
Table 13. Summary of measurements taken during overflights at Kīlauea that show a gradual increase in the active lava lake level and the volume of lava effused since 29 September 2021. Lower activity was reported during September-October. Data collected during July-December 2022. Courtesy of HVO.
| Date: |
Level of the active lava lake (m): |
Cumulative volume of lava effused (million cubic meters): |
| 7 Jul 2022 |
130 |
95 |
| 19 Jul 2022 |
133 |
98 |
| 4 Aug 2022 |
136 |
102 |
| 16 Aug 2022 |
137 |
104 |
| 12 Sep 2022 |
143 |
111 |
| 5 Oct 2022 |
143 |
111 |
| 28 Oct 2022 |
143 |
111 |
Activity during July 2022. Lava effusions were reported from the western vent in the Halema’uma’u crater, along with occasional weak ooze-outs along the margins of the crater floor. The height of the lava lake was variable due to deflation-inflation tilt events; for example, the lake level dropped approximately 3-4 m during a summit deflation-inflation event reported on 1 July. Webcam images taken during the night of 6-12 July showed intermittent low-level spattering at the western vent that rose less than 10 m above the vent (figure 519). Measurements made during an overflight on 7 July indicated that the crater floor was infilled about 130 m and that 95 million cubic meters of lava had been effused since 29 September 2021. A single, relatively small lava ooze-out was active to the S of the lava lake. Around midnight on 8 July there were two brief periods of lava overflow onto the lake margins. On 9 July lava ooze-outs were reported near the SE and NE edges of the crater floor and during 10-11 July they occurred near the E, NE, and NW edges. On 16 July crater incandescence was reported, though the ooze-outs and spattering were not visible. On 18 July overnight webcam images showed incandescence in the western vent complex and two ooze-outs were reported around 0000 and 0200 on 19 July. By 0900 there were active ooze-outs along the SW edge of the crater floor. Measurements made from an overflight on 19 July indicated that the crater floor was infilled about 133 m and 98 million cubic meters of lava had erupted since 29 September 2021 (figure 520). On 20 July around 1600 active ooze-outs were visible along the N edge of the crater, which continued through the next day. Extensive ooze-outs occurred along the W margin during 24 July until 1900; on 26 July minor ooze-outs were noted along the N margin. Minor spattering was visible on 29 July along the E margin of the lake. The sulfur dioxide emission rates ranged 650-2,800 tons per day (t/d), the higher of which was measured on 8 July (figure 519).
Activity during August 2022. The eruption continued in the Halema’uma’u crater at the western vent. According to HVO the lava in the active lake remained at the level of the bounding levees. Occasional minor ooze-outs were observed along the margins of the crater floor. Strong nighttime crater incandescence was visible after midnight on 6 August over the western vent cone. During 6-7 August scattered small lava lobes were active along the crater floor and incandescence persisted above the western vent through 9 August. During 7-9 August HVO reported a single lava effusion source was active along the NW margin of the crater floor. Measurements from an overflight on 4 August indicated that the crater floor was infilled about 136 m total and that 102 million cubic meters of lava had been erupted since the start of the eruption. Lava breakouts were reported along the N, NE, E, S, and W margins of the crater during 10-16 August. Another overflight survey conducted on 16 August indicated that the crater floor infilled about 137 m and 104 million cubic meters of lava had been erupted since September 2021. Measured sulfur dioxide emissions rates ranged 1,150-2,450 t/d, the higher of which occurred on 8 August.
Activity during September 2022. During September, lava effusion continued from the western vent into the active lava lake and onto the crater floor. Intermittent minor ooze-outs were reported through the month. A small ooze-out was visible on the W crater floor margin at 0220 on 2 September, which showed decreasing surface activity throughout the day, but remained active through 3 September. On 3 September around 1900 a lava outbreak occurred along the NW margin of the crater floor but had stopped by the evening of 4 September. Field crews monitoring the summit lava lake on 9 September observed spattering on the NE margin of the lake that rose no higher than 10 m, before falling back onto the lava lake crust (figure 521). Overflight measurements on 12 September indicated that the crater floor was infilled a total of 143 m and 111 million cubic meters of lava had been erupted since September 2021. Extensive breakouts in the W and N part of the crater floor were reported at 1600 on 20 September and continued into 26 September. The active part of the lava lake dropped by 10 m while other parts of the crater floor dropped by several meters. Summit tiltmeters recorded a summit seismic swarm of more than 80 earthquakes during 1500-1800 on 21 September, which occurred about 1.5 km below Halema’uma’u; a majority of these were less than Mw 2. By 22 September the active part of the lava lake was infilled about 2 m. On 23 September the western vent areas exhibited several small spatter cones with incandescent openings, along with weak, sporadic spattering (figure 522). The sulfur dioxide emission rate ranged from 930 t/d to 2,000 t/d, the higher of which was measured on 6 September.
Activity during October 2022. Activity during October declined slightly compared to previous months, though lava effusions persisted from the western vent into the active lava lake and onto the crater floor during October (figure 523). Slight variations in the lava lake were noted throughout the month. HVO reported that around 0600 on 3 October the level of the lava lake has lowered slightly. Overflight measurements taken on 5 October indicated that the crater floor was infilled a total of about 143 m and that 111 million cubic meters of lava had been effused since September 2021. During 6-7 October the lake gradually rose 0.5 m. Sulfur dioxide measurements made on 22 October had an emission rate of 700 t/d. Another overflight taken on 28 October showed that there was little to no change in the elevation of the crater floor: the crater floor was infilled a total of 143 m and 111 million cubic meters of lava had erupted since the start of the eruption.
Activity during November 2022. Activity remained low during November, though HVO reported that lava from the western vent continued to effuse into the active lava lake and onto the crater floor throughout the month. The rate of sulfur dioxide emissions during November ranged from 300-600 t/d, the higher amount of which occurred on 9 November.
Activity during December 2022. Similar low activity was reported during December, with lava effusing from the western vent into the active lava lake and onto the crater floor. During 4-5 December the active part of the lava lake was slightly variable in elevation and fluctuated within 1 m. On 9 December HVO reported that lava was no longer erupting from the western vent in the Halema’uma’u crater and that sulfur dioxide emissions had returned to near pre-eruption background levels; during 10-11 December, the lava lake had completely crusted over, and no incandescence was visible (figure 524). Time lapse camera images covering the 4-10 December showed that the crater floor showed weak deflation and no inflation. Some passive events of crustal overturning were reported during 14-15 December, which brought fresh incandescent lava to the lake surface. The sulfur dioxide emission rate was approximately 200 t/d on 14 December. A smaller overturn event on 17 December and another that occurred around 0000 and into the morning of 20 December were also detected. A small seismic swarm was later detected on 30 December.
Geologic Background. Kilauea overlaps the E flank of the massive Mauna Loa shield volcano in the island of Hawaii. Eruptions are prominent in Polynesian legends; written documentation since 1820 records frequent summit and flank lava flow eruptions interspersed with periods of long-term lava lake activity at Halemaumau crater in the summit caldera until 1924. The 3 x 5 km caldera was formed in several stages about 1,500 years ago and during the 18th century; eruptions have also originated from the lengthy East and Southwest rift zones, which extend to the ocean in both directions. About 90% of the surface of the basaltic shield volcano is formed of lava flows less than about 1,100 years old; 70% of the surface is younger than 600 years. The long-term eruption from the East rift zone between 1983 and 2018 produced lava flows covering more than 100 km2, destroyed hundreds of houses, and added new coastline.
Information Contacts: Hawaiian Volcano Observatory (HVO), U.S. Geological Survey, PO Box 51, Hawai'i National Park, HI 96718, USA (URL: http://hvo.wr.usgs.gov/).
Nyamulagira (DR Congo) — November 2023 Cite this Report
Nyamulagira
DR Congo
1.408°S, 29.2°E; summit elev. 3058 m
All times are local (unless otherwise noted)
Lava flows and thermal activity during May-October 2023
Nyamulagira (also known as Nyamuragira) is a shield volcano in the Democratic Republic of Congo with the summit truncated by a small 2 x 2.3 km caldera with walls up to about 100 m high. Documented eruptions have occurred within the summit caldera, as well as from numerous flank fissures and cinder cones. The current eruption period began in April 2018 and has more recently been characterized by summit crater lava flows and thermal activity (BGVN 48:05). This report describes lava flows and variable thermal activity during May through October 2023, based on information from the Observatoire Volcanologique de Goma (OVG) and various satellite data.
Lava lake activity continued during May. The MIROVA (Middle InfraRed Observation of Volcanic Activity) system recorded moderate-to-strong thermal activity throughout the reporting period; activity was more intense during May and October and relatively weaker from June through September (figure 95). The MODVOLC thermal algorithm, detected a total of 209 thermal alerts. There were 143 hotspots detected during May, eight during June, nine during September, and 49 during October. This activity was also reflected in infrared satellite images, where a lava flow was visible in the NW part of the crater on 7 May and strong activity was seen in the center of the crater on 4 October (figure 96). Another infrared satellite image taken on 12 May showed still active lava flows along the NW margin of the crater. According to OVG lava effusions were active during 7-29 May and moved to the N and NW parts of the crater beginning on 9 May. Strong summit crater incandescence was visible from Goma (27 km S) during the nights of 17, 19, and 20 May (figure 97). On 17 May there was an increase in eruptive activity, which peaked at 0100 on 20 May. Notable sulfur dioxide plumes drifted NW and W during 19-20 May (figure 98). Drone footage acquired in partnership with the USGS (United States Geological Survey) on 20 May captured images of narrow lava flows that traveled about 100 m down the W flank (figure 99). Data from the Rumangabo seismic station indicated a decreasing trend in activity during 17-21 May. Although weather clouds prevented clear views of the summit, a strong thermal signature on the NW flank was visible in an infrared satellite image on 22 May, based on an infrared satellite image. On 28 May the lava flows on the upper W flank began to cool and solidify. By 29 May seismicity returned to levels similar to those recorded before the 17 May increase. Lava effusion continued but was confined to the summit crater; periodic crater incandescence was observed.
Low-level activity was noted during June through October. On 1 June OVG reported that seismicity remained at lower levels and that crater incandescence had been absent for three days, though infrared satellite imagery showed continued lava effusion in the summit crater. The lava flows on the flanks covered an estimated 0.6 km2. Satellite imagery continued to show thermal activity confined to the lava lake through October (figure 96), although no lava flows or significant sulfur dioxide emissions were reported.
Geologic Background. Africa's most active volcano, Nyamulagira (also known as Nyamuragira), is a massive high-potassium basaltic shield about 25 km N of Lake Kivu and 13 km NNW of the steep-sided Nyiragongo volcano. The summit is truncated by a small 2 x 2.3 km caldera that has walls up to about 100 m high. Documented eruptions have occurred within the summit caldera, as well as from the numerous flank fissures and cinder cones. A lava lake in the summit crater, active since at least 1921, drained in 1938, at the time of a major flank eruption. Recent lava flows extend down the flanks more than 30 km from the summit as far as Lake Kivu; extensive lava flows from this volcano have covered 1,500 km2 of the western branch of the East African Rift.
Information Contacts: Observatoire Volcanologique de Goma (OVG), Departement de Geophysique, Centre de Recherche en Sciences Naturelles, Lwiro, D.S. Bukavu, DR Congo; Hawai'i Institute of Geophysics and Planetology (HIGP) - MODVOLC Thermal Alerts System, School of Ocean and Earth Science and Technology (SOEST), Univ. of Hawai'i, 2525 Correa Road, Honolulu, HI 96822, USA (URL: http://modis.higp.hawaii.edu/); MIROVA (Middle InfraRed Observation of Volcanic Activity), a collaborative project between the Universities of Turin and Florence (Italy) supported by the Centre for Volcanic Risk of the Italian Civil Protection Department (URL: http://www.mirovaweb.it/); NASA Global Sulfur Dioxide Monitoring Page, Atmospheric Chemistry and Dynamics Laboratory, NASA Goddard Space Flight Center (NASA/GSFC), 8800 Greenbelt Road, Goddard, Maryland, USA (URL: https://so2.gsfc.nasa.gov/); Copernicus Browser, Copernicus Data Space Ecosystem, European Space Agency (URL: https://dataspace.copernicus.eu/browser/); Charles Balagizi, Goma Volcano Observatory, Departement de Geophysique, Centre de Recherche en Sciences Naturelles, Lwiro, D.S. Bukavu, DR Congo.
Bagana (Papua New Guinea) — October 2023 Cite this Report
Bagana
Papua New Guinea
6.137°S, 155.196°E; summit elev. 1855 m
All times are local (unless otherwise noted)
Explosions, ash plumes, ashfall, and lava flows during April-September 2023
The remote volcano of Bagana is located in central Bougainville Island, Papua New Guinea. Recorded eruptions date back to 1842 and activity has consisted of effusive activity that has built a small lava dome in the summit crater and occasional explosions that produced pyroclastic flows. The most recent eruption has been ongoing since February 2000 and has produced occasional explosions, ash plumes, and lava flows. More recently, activity has been characterized by ongoing effusive activity and ash emissions (BGVN 48:04). This report updates activity from April through September 2023 that has consisted of explosions, ash plumes, ashfall, and lava flows, using information from the Darwin Volcanic Ash Advisory Center (VAAC) and satellite data.
An explosive eruption was reported on 7 July that generated a large gas-and-ash plume to high altitudes and caused significant ashfall in local communities; the eruption plume had reached upper tropospheric (16-18 km altitude) altitudes by 2200, according to satellite images. Sulfur dioxide plumes were detected in satellite images on 8 July and indicated that the plume was likely a mixture of gas, ice, and ash. A report issued by the Autonomous Bougainville Government (ABG) (Torokina District, Education Section) on 10 July noted that significant ash began falling during 2000-2100 on 7 July and covered most areas in the Vuakovi, Gotana (9 km SW), Koromaketo, Laruma (25 km W) and Atsilima (27 km NW) villages. Pyroclastic flows also occurred, according to ground-based reports; small deposits confined to one drainage were inspected by RVO during an overflight on 17 July and were confirmed to be from the 7 July event. Ashfall continued until 10 July and covered vegetation, which destroyed bushes and gardens and contaminated rivers and streams.
RVO reported another eruption on 14 July. The Darwin VAAC stated that an explosive event started around 0830 on 15 July and produced an ash plume that rose to 16.5 km altitude by 1000 and drifted N, according to satellite images. The plume continued to drift N and remained visible through 1900, and by 2150 it had dissipated.
Ashfall likely from both the 7 and 15 July events impacted about 8,111 people in Torokina (20 km SW), including Tsito/Vuakovi, Gotana, Koromaketo, Kenaia, Longkogari, Kenbaki, Piva (13 km SW), and Atsinima, and in the Tsitovi district, according to ABG. Significant ashfall was also reported in Ruruvu (22 km N) in the Wakunai District of Central Bougainville, though the thickness of these deposits could not be confirmed. An evacuation was called for the villages in Wakunai, where heavy ashfall had contaminated water sources; the communities of Ruruvu, Togarau, Kakarapaia, Karauturi, Atao, and Kuritaturi were asked to evacuate to a disaster center at the Wakunai District Station, and communities in Torokina were asked to evacuate to the Piva District station. According to a news article, more than 7,000 people needed temporary accommodations, with about 1,000 people in evacuation shelters. Ashfall had deposited over a broad area, contaminating water supplies, affecting crops, and collapsing some roofs and houses in rural areas. Schools were temporarily shut down. Intermittent ash emissions continued through the end of July and drifted NNW, NW, and SW. Fine ashfall was reported on the coast of Torokina, and ash plumes also drifted toward Laruma and Atsilima.
A small explosive eruption occurred at 2130 on 28 July that ejected material from the crater vents, according to reports from Torokina, in addition to a lava flow that contained two lobes. A second explosion was detected at 2157. Incandescence from the lava flow was visible from Piva as it descended the W flank around 2000 on 29 July (figure 47). The Darwin VAAC reported that a strong thermal anomaly was visible in satellite images during 30-31 July and that ash emissions rose to 2.4 km altitude and drifted WSW on 30 July. A ground report from RVO described localized emissions at 0900 on 31 July.
The Darwin VAAC reported that ash plumes were identified in satellite imagery at 0800 and 1220 on 12 August and rose to 2.1 km and 3 km altitude and drifted NW and W, respectively. A news report stated that aid was sent to more than 6,300 people that were adversely affected by the eruption. Photos taken during 17-19 August showed ash emissions rising no higher than 1 km above the summit and drifting SE. A small explosion generated an ash plume during the morning of 19 August. Deposits from small pyroclastic flows were also captured in the photos. Satellite images captured lava flows and pyroclastic flow deposits. Two temporary seismic stations were installed near Bagana on 17 August at distances of 7 km WSW (Vakovi station) and 11 km SW (Kepox station). The Kepox station immediately started to record continuous, low-frequency background seismicity.
Satellite data. Little to no thermal activity was detected during April through mid-July 2023; only one anomaly was recorded during early April and one during early June, according to MIROVA (Middle InfraRed Observation of Volcanic Activity) data (figure 48). Thermal activity increased in both power and frequency during mid-July through September, although there were still some short gaps in detected activity. MODVOLC also detected increased thermal activity during August; thermal hotspots were detected a total of five times on 19, 20, and 27 August. Weak thermal anomalies were also captured in infrared satellite images on clear weather days throughout the reporting period on 7, 12, and 17 April, 27 May, 1, 6, 16, and 31 July, and 19 September (figure 48); a strong thermal anomaly was visible on 31 July. Distinct sulfur dioxide plumes that drifted generally NW were intermittently captured by the TROPOMI instrument on the Sentinel-5P satellite and sometimes exceeded two Dobson Units (DUs) (figure 49).
Geologic Background. Bagana volcano, in a remote portion of central Bougainville Island, is frequently active. This massive symmetrical cone was largely constructed by an accumulation of viscous andesitic lava flows. The entire edifice could have been constructed in about 300 years at its present rate of lava production. Eruptive activity is characterized by non-explosive effusion of viscous lava that maintains a small lava dome in the summit crater, although occasional explosive activity produces pyroclastic flows. Lava flows with tongue-shaped lobes up to 50 m thick and prominent levees descend the flanks on all sides.
Information Contacts: Rabaul Volcano Observatory (RVO), Geohazards Management Division, Department of Mineral Policy and Geohazards Management (DMPGM), PO Box 3386, Kokopo, East New Britain Province, Papua New Guinea; Darwin Volcanic Ash Advisory Centre (VAAC), Bureau of Meteorology, Northern Territory Regional Office, PO Box 40050, Casuarina, NT 0811, Australia (URL: http://www.bom.gov.au/info/vaac/); MIROVA (Middle InfraRed Observation of Volcanic Activity), a collaborative project between the Universities of Turin and Florence (Italy) supported by the Centre for Volcanic Risk of the Italian Civil Protection Department (URL: http://www.mirovaweb.it/); Hawai'i Institute of Geophysics and Planetology (HIGP) - MODVOLC Thermal Alerts System, School of Ocean and Earth Science and Technology (SOEST), Univ. of Hawai'i, 2525 Correa Road, Honolulu, HI 96822, USA (URL: http://modis.higp.hawaii.edu/); NASA Global Sulfur Dioxide Monitoring Page, Atmospheric Chemistry and Dynamics Laboratory, NASA Goddard Space Flight Center (NASA/GSFC), 8800 Greenbelt Road, Goddard, Maryland, USA (URL: https://so2.gsfc.nasa.gov/); Copernicus Browser, Copernicus Data Space Ecosystem, European Space Agency (URL: https://dataspace.copernicus.eu/browser/); Autonomous Bougainville Government, P.O Box 322, Buka, AROB, PNG (URL: https://abg.gov.pg/); Andrew Tupper (Twitter: @andrewcraigtupp); Simon Carn, Geological and Mining Engineering and Sciences, Michigan Technological University, 1400 Townsend Drive, Houghton, MI 49931, USA (URL: http://www.volcarno.com/, Twitter: @simoncarn); Radio NZ (URL: https://www.rnz.co.nz/news/pacific/494464/more-than-7-000-people-in-bougainville-need-temporary-accommodation-after-eruption); USAID, 1300 Pennsylvania Ave, NW, Washington DC 20004, USA (URL: https://www.usaid.gov/pacific-islands/press-releases/aug-08-2023-united-states-provides-immediate-emergency-assistance-support-communities-affected-mount-bagana-volcanic-eruptions).
Mayon (Philippines) — October 2023 Cite this Report
Mayon
Philippines
13.257°N, 123.685°E; summit elev. 2462 m
All times are local (unless otherwise noted)
Lava flows, pyroclastic flows, ash emissions, and seismicity during April-September 2023
Mayon is located in the Philippines and has steep upper slopes capped by a small summit crater. Historical eruptions date back to 1616 CE that have been characterized by Strombolian eruptions, lava flows, pyroclastic flows, and mudflows. Eruptions mostly originated from a central conduit. Pyroclastic flows and mudflows have commonly descended many of the approximately 40 drainages that surround the volcano. The most recent eruption occurred during June through October 2022 and consisted of lava dome growth and gas-and-steam emissions (BGVN 47:12). A new eruption was reported during late April 2023 and has included lava flows, pyroclastic density currents, ash emissions, and seismicity. This report covers activity during April through September 2023 based on daily bulletins from the Philippine Institute of Volcanology and Seismology (PHIVOLCS).
During April through September 2023, PHIVOLCS reported near-daily rockfall events, frequent volcanic earthquakes, and sulfur dioxide measurements. Gas-and-steam emissions rose 100-900 m above the crater and drifted in different directions. Nighttime crater incandescence was often visible during clear weather and was accompanied by incandescent avalanches of material. Activity notably increased during June when lava flows were reported on the S, SE, and E flanks (figure 52). The MIROVA graph (Middle InfraRed Observation of Volcanic Activity) showed strong thermal activity coincident with these lava flows, which remained active through September (figure 53). According to the MODVOLC thermal algorithm, a total of 110 thermal alerts were detected during the reporting period: 17 during June, 40 during July, 27 during August, and 26 during September. During early June, pyroclastic density currents (PDCs) started to occur more frequently.
Low activity was reported during much of April and May; gas-and-steam emissions rose 100-900 m above the crater and generally drifted in different directions. A total of 52 rockfall events and 18 volcanic earthquakes were detected during April and 147 rockfall events and 13 volcanic events during May. Sulfur dioxide flux measurements ranged between 400-576 tons per day (t/d) during April, the latter of which was measured on 29 April and between 162-343 t/d during May, the latter of which was measured on 13 May.
Activity during June increased, characterized by lava flows, pyroclastic density currents (PDCs), crater incandescence and incandescent rockfall events, gas-and-steam emissions, and continued seismicity. Weather clouds often prevented clear views of the summit, but during clear days, moderate gas-and-steam emissions rose 100-2,500 m above the crater and drifted in multiple directions. A total of 6,237 rockfall events and 288 volcanic earthquakes were detected. The rockfall events often deposited material on the S and SE flanks within 700-1,500 m of the summit crater and ash from the events drifted SW, S, SE, NE, and E. Sulfur dioxide emissions ranged between 149-1,205 t/d, the latter of which was measured on 10 June. Short-term observations from EDM and electronic tiltmeter monitoring indicated that the upper slopes were inflating since February 2023. Longer-term ground deformation parameters based on EDM, precise leveling, continuous GPS, and electronic tilt monitoring indicated that the volcano remained inflated, especially on the NW and SE flanks. At 1000 on 5 June the Volcano Alert Level (VAL) was raised to 2 (on a 0-5 scale). PHIVOLCS noted that although low-level volcanic earthquakes, ground deformation, and volcanic gas emissions indicated unrest, the steep increase in rockfall frequency may indicate increased dome activity.
A total of 151 dome-collapse PDCs occurred during 8-9 and 11-30 June, traveled 500-2,000 m, and deposited material on the S flank within 2 km of the summit crater. During 8-9 June the VAL was raised to 3. At approximately 1947 on 11 June lava flow activity was reported; two lobes traveled within 500 m from the crater and deposited material on the S (Mi-isi), SE (Bonga), and E (Basud) flanks. Weak seismicity accompanied the lava flow and slight inflation on the upper flanks. This lava flow remained active through 30 June, moving down the S and SE flank as far as 2.5 km and 1.8 km, respectively and depositing material up to 3.3 km from the crater. During 15-16 June traces of ashfall from the PDCs were reported in Sitio Buga, Nabonton, City of Ligao and Purok, and San Francisco, Municipality of Guinobatan. During 28-29 June there were two PDCs generated by the collapse of the lava flow front, which generated a light-brown ash plume 1 km high. Satellite monitors detected significant concentrations of sulfur dioxide beginning on 29 June. On 30 June PDCs primarily affected the Basud Gully on the E flank, the largest of which occurred at 1301 and lasted eight minutes, based on the seismic record. Four PDCs generated between 1800 and 2000 that lasted approximately four minutes each traveled 3-4 km on the E flank and generated an ash plume that rose 1 km above the crater and drifted N and NW. Ashfall was recorded in Tabaco City.
Similar strong activity continued during July; slow lava effusion remained active on the S and SE flanks and traveled as far as 2.8 km and 2.8 km, respectively and material was deposited as far as 4 km from the crater. There was a total of 6,983 rockfall events and 189 PDCs that affected the S, SE, and E flanks. The volcano network detected a total of 2,124 volcanic earthquakes. Continuous gas-and-steam emissions rose 200-2,000 m above the crater and drifted in multiple directions. Sulfur dioxide emissions averaged 792-4,113 t/d, the latter of which was measured on 28 July. During 2-4 July three PDCs were generated from the collapse of the lava flow and resulting light brown plumes rose 200-300 m above the crater. Continuous tremor pulses were reported beginning at 1547 on 3 July through 7 July at 1200, at 2300 on 8 July and going through 0300 on 10 July, and at 2300 on 16 July, as recorded by the seismic network. During 6-9 July there were 10 lava flow-collapse-related PDCs that generated light brown plumes 300-500 m above the crater. During 10-11 July light ashfall was reported in some areas of Mabinit, Legazpi City, Budiao and Salvacion, Daraga, and Camalig, Albay. By 18 July the lava flow advanced 600 m on the E flank as well.
During 1733 on 18 July and 0434 on 19 July PHIVOLCS reported 30 “ashing” events, which are degassing events accompanied by audible thunder-like sounds and entrained ash at the crater, which produced short, dark plumes that drifted SW. These events each lasted 20-40 seconds, and plume heights ranged from 150-300 m above the crater, as recorded by seismic, infrasound, visual, and thermal monitors. Three more ashing events occurred during 19-20 July. Short-term observations from electronic tilt and GPS monitoring indicate deflation on the E lower flanks in early July and inflation on the NW middle flanks during the third week of July. Longer-term ground deformation parameters from EDM, precise leveling, continuous GPS, and electronic tilt monitoring indicated that the volcano was still generally inflated relative to baseline levels. A short-lived lava pulse lasted 28 seconds at 1956 on 21 July, which was accompanied by seismic and infrasound signals. By 22 July, the only lava flow that remained active was on the SE flank, and continued to extend 3.4 km, while those on the S and E flanks weakened markedly. One ashing event was detected during 30-31 July, whereas there were 57 detected during 31 July-1 August; according to PHIVOLCS beginning at approximately 1800 on 31 July eruptive activity was dominated by phases of intermittent ashing, as well as increased in the apparent rates of lava effusion from the summit crater. The ashing phases consisted of discrete events recorded as low-frequency volcanic earthquakes (LFVQ) typically 30 seconds in duration, based on seismic and infrasound signals. Gray ash plume rose 100 m above the crater and generally drifted NE. Shortly after these ashing events began, new lava began to effuse rapidly from the crater, feeding the established flowed on the SE, E, and E flanks and generating frequent rockfall events.
Intensified unrest persisted during August. There was a total of 4,141 rockfall events, 2,881 volcanic earthquakes, which included volcanic tremor events, 32 ashing events, and 101 PDCs detected throughout the month. On clear weather days, gas-and-steam emissions rose 300-1,500 m above the crater and drifted in different directions (figure 54). Sulfur dioxide emissions averaged 735-4,756 t/d, the higher value of which was measured on 16 August. During 1-2 August the rate of lava effusion decreased, but continued to feed the flows on the SE, S, and E flanks, maintaining their advances to 3.4 km, 2.8 km, and 1.1 km from the crater, respectively (figure 55). Rockfall and PDCs generated by collapses at the lava flow margins and from the summit dome deposited material within 4 km of the crater. During 3-4 August there were 10 tremor events detected that lasted 1-4 minutes. Short-lived lava pulse lasted 35 seconds and was accompanied by seismic and infrasound signals at 0442 on 6 August. Seven collapses were recorded at the front of the lava flow during 12-14 August.
During September, similar activity of slow lava effusion, PDCs, gas-and-steam emissions, and seismicity continued. There was a total of 4,452 rockfall events, 329 volcanic earthquakes, which included volcanic tremor events, two ashing events, and 85 PDCs recorded throughout the month. On clear weather days, gas-and-steam emissions rose 100-1,500 m above the crater and drifted in multiple directions. Sulfur dioxide emissions averaged 609-2,252 t/d, the higher average of which was measured on 6 September. Slow lava effusion continued advancing on the SE, S, and E flanks, maintaining lengths of 3.4 km, 2.8 km, and 1.1 km, respectively. Rockfall and PDC events generated by collapses along the lava flow margins and at the summit dome deposited material within 4 km of the crater.
Geologic Background. Symmetrical Mayon, which rises above the Albay Gulf NW of Legazpi City, is the most active volcano of the Philippines. The steep upper slopes are capped by a small summit crater. Recorded eruptions since 1616 CE range from Strombolian to basaltic Plinian, with cyclical activity beginning with basaltic eruptions, followed by longer periods of andesitic lava flows. Eruptions occur predominately from the central conduit and have also produced lava flows that travel far down the flanks. Pyroclastic density currents and mudflows have commonly swept down many of the approximately 40 ravines that radiate from the summit and have often damaged populated lowland areas. A violent eruption in 1814 killed more than 1,200 people and devastated several towns.
Information Contacts: Philippine Institute of Volcanology and Seismology (PHIVOLCS), Department of Science and Technology, University of the Philippines Campus, Diliman, Quezon City, Philippines (URL: http://www.phivolcs.dost.gov.ph/); MIROVA (Middle InfraRed Observation of Volcanic Activity), a collaborative project between the Universities of Turin and Florence (Italy) supported by the Centre for Volcanic Risk of the Italian Civil Protection Department (URL: http://www.mirovaweb.it/); Hawai'i Institute of Geophysics and Planetology (HIGP) - MODVOLC Thermal Alerts System, School of Ocean and Earth Science and Technology (SOEST), Univ. of Hawai'i, 2525 Correa Road, Honolulu, HI 96822, USA (URL: http://modis.higp.hawaii.edu/); Copernicus Browser, Copernicus Data Space Ecosystem, European Space Agency (URL: https://dataspace.copernicus.eu/browser/); William Rogers, Legazpi City, Albay Province, Philippines.
Nishinoshima (Japan) — October 2023 Cite this Report
Nishinoshima
Japan
27.247°N, 140.874°E; summit elev. 100 m
All times are local (unless otherwise noted)
Eruption plumes and gas-and-steam plumes during May-August 2023
Nishinoshima, located about 1,000 km S of Tokyo, is a small island in the Ogasawara Arc in Japan. The island is the summit of a massive submarine volcano that has prominent submarine peaks to the S, W, and NE. Eruptions date back to 1973 and the current eruption period began in October 2022. Recent activity has consisted of small ash plumes and fumarolic activity (BGVN 48:07). This report covers activity during May through August 2023, using information from monthly reports of the Japan Meteorological Agency (JMA) monthly reports and satellite data.
Activity during May through June was relatively low. The Japan Coast Guard (JCG) did overflights on 14 and 22 June and reported white gas-and-steam emissions rising 600 m and 1,200 m from the central crater of the pyroclastic cone, respectively (figure 125). In addition, multiple white gas-and-steam emissions rose from the inner rim of the W side of the crater and from the SE flank of the pyroclastic cone. Discolored brown-to-green water was observed around almost the entire perimeter of the island; on 22 June light green discolored water was observed off the S coast of the island.
Observations from the Himawari meteorological satellite confirmed an eruption on 9 and 10 July. An eruption plume rose 1.6 km above the crater and drifted N around 1300 on 9 July. Satellite images acquired at 1420 and 2020 on 9 July and at 0220 on 10 July showed continuing emissions that rose 1.3-1.6 km above the crater and drifted NE and N. The Tokyo VAAC reported that an ash plume seen by a pilot and identified in a satellite image at 0630 on 21 July rose to 3 km altitude and drifted S.
Aerial observations conducted by JCG on 8 August showed a white-and-gray plume rising from the central crater of the pyroclastic cone, and multiple white gas-and-steam emissions were rising from the inner edge of the western crater and along the NW-SE flanks of the island (figure 126). Brown-to-green discolored water was also noted around the perimeter of the island.
Intermittent low-to-moderate power thermal anomalies were recorded in the MIROVA graph (Middle InfraRed Observation of Volcanic Activity), showing an increase in both frequency and power beginning in July (figure 127). This increase in activity coincides with eruptive activity on 9 and 10 July, characterized by eruption plumes. According to the MODVOLC thermal alert algorithm, one thermal hotspot was recorded on 20 July. Weak thermal anomalies were also detected in infrared satellite imagery, accompanied by strong gas-and-steam plumes (figure 128).
Geologic Background. The small island of Nishinoshima was enlarged when several new islands coalesced during an eruption in 1973-74. Multiple eruptions that began in 2013 completely covered the previous exposed surface and continued to enlarge the island. The island is the summit of a massive submarine volcano that has prominent peaks to the S, W, and NE. The summit of the southern cone rises to within 214 m of the ocean surface 9 km SSE.
Information Contacts: Japan Meteorological Agency (JMA), 1-3-4 Otemachi, Chiyoda-ku, Tokyo 100-8122, Japan (URL: http://www.jma.go.jp/jma/indexe.html); Tokyo Volcanic Ash Advisory Center (VAAC), 1-3-4 Otemachi, Chiyoda-ku, Tokyo 100-8122, Japan (URL: http://ds.data.jma.go.jp/svd/vaac/data/); MIROVA (Middle InfraRed Observation of Volcanic Activity), a collaborative project between the Universities of Turin and Florence (Italy) supported by the Centre for Volcanic Risk of the Italian Civil Protection Department (URL: http://www.mirovaweb.it/); Copernicus Browser, Copernicus Data Space Ecosystem, European Space Agency (URL: https://dataspace.copernicus.eu/browser/).
Krakatau (Indonesia) — October 2023 Cite this Report
Krakatau
Indonesia
6.1009°S, 105.4233°E; summit elev. 285 m
All times are local (unless otherwise noted)
White gas-and-steam plumes and occasional ash plumes during May-August 2023
Krakatau is located in the Sunda Strait between Java and Sumatra, Indonesia. Caldera collapse during the catastrophic 1883 eruption destroyed Danan and Perbuwatan cones and left only a remnant of Rakata. The post-collapse cone of Anak Krakatau (Child of Krakatau) was constructed within the 1883 caldera at a point between the former Danan and Perbuwatan cones; it has been the site of frequent eruptions since 1927. The current eruption period began in May 2021 and has recently consisted of Strombolian eruptions and ash plumes (BGVN 48:07). This report describes lower levels of activity consisting of ash and white gas-and-steam plumes during May through August 2023, based on information provided by the Indonesian Center for Volcanology and Geological Hazard Mitigation, referred to as Pusat Vulkanologi dan Mitigasi Bencana Geologi (PVMBG), MAGMA Indonesia, and satellite data.
Activity was relatively low during May and June. Daily white gas-and-steam emissions rose 25-200 m above the crater and drifted in different directions. Five ash plumes were detected at 0519 on 10 May, 1241 on 11 May, 0920 on 12 May, 2320 on 12 May, and at 0710 on 13 May, and rose 1-2.5 km above the crater and drifted SW. A webcam image taken on 12 May showed ejection of incandescent material above the vent. A total of nine ash plumes were detected during 6-11 June: at 1434 and 00220 on 6 and 7 June the ash plumes rose 500 m above the crater and drifted NW, at 1537 on 8 June the ash plume rose 1 km above the crater and drifted SW, at 0746 and at 0846 on 9 June the ash plumes rose 800 m and 3 km above the crater and drifted SW, respectively, at 0423, 1431, and 1750 on 10 June the ash plumes rose 2 km, 1.5 km, and 3.5 km above the crater and drifted NW, respectively, and at 0030 on 11 June an ash plume rose 2 km above the crater and drifted NW. Webcam images taken on 10 and 11 June at 0455 and 0102, respectively, showed incandescent material ejected above the vent. On 19 June an ash plume at 0822 rose 1.5 km above the crater and drifted SE.
Similar low activity of white gas-and-steam emissions and few ash plumes were reported during July and August. Daily white gas-and-steam emissions rose 25-300 m above the crater and drifted in multiple directions. Three ash plumes were reported at 0843, 0851, and 0852 on 20 July that rose 500-2,000 m above the crater and drifted NW.
The MIROVA (Middle InfraRed Observation of Volcanic Activity) graph of MODIS thermal anomaly data showed intermittent low-to-moderate power thermal anomalies during May through August 2023 (figure 140). Although activity was often obscured by weather clouds, a thermal anomaly was visible in an infrared satellite image of the crater on 12 May, accompanied by an eruption plume that drifted SW (figure 141).
Geologic Background. The renowned Krakatau (frequently mis-named as Krakatoa) volcano lies in the Sunda Strait between Java and Sumatra. Collapse of an older edifice, perhaps in 416 or 535 CE, formed a 7-km-wide caldera. Remnants of that volcano are preserved in Verlaten and Lang Islands; subsequently the Rakata, Danan, and Perbuwatan cones were formed, coalescing to create the pre-1883 Krakatau Island. Caldera collapse during the catastrophic 1883 eruption destroyed Danan and Perbuwatan, and left only a remnant of Rakata. This eruption caused more than 36,000 fatalities, most as a result of tsunamis that swept the adjacent coastlines of Sumatra and Java. Pyroclastic surges traveled 40 km across the Sunda Strait and reached the Sumatra coast. After a quiescence of less than a half century, the post-collapse cone of Anak Krakatau (Child of Krakatau) was constructed within the 1883 caldera at a point between the former Danan and Perbuwatan cones. Anak Krakatau has been the site of frequent eruptions since 1927.
Information Contacts: Pusat Vulkanologi dan Mitigasi Bencana Geologi (PVMBG, also known as Indonesian Center for Volcanology and Geological Hazard Mitigation, CVGHM), Jalan Diponegoro 57, Bandung 40122, Indonesia (URL: http://www.vsi.esdm.go.id/); MAGMA Indonesia, Kementerian Energi dan Sumber Daya Mineral (URL: https://magma.esdm.go.id/v1); MIROVA (Middle InfraRed Observation of Volcanic Activity), a collaborative project between the Universities of Turin and Florence (Italy) supported by the Centre for Volcanic Risk of the Italian Civil Protection Department (URL: http://www.mirovaweb.it/); Copernicus Browser, Copernicus Data Space Ecosystem, European Space Agency (URL: https://dataspace.copernicus.eu/browser/).
Villarrica (Chile) — October 2023 Cite this Report
Villarrica
Chile
39.42°S, 71.93°W; summit elev. 2847 m
All times are local (unless otherwise noted)
Strombolian activity, gas-and-ash emissions, and crater incandescence during April-September 2023
Villarrica, in central Chile, consists of a 2-km-wide caldera that formed about 3,500 years ago and is located at the base of the presently active cone at the NW margin of a 6-km-wide caldera. Historical eruptions eruptions date back to 1558 and have been characterized by mild-to-moderate explosive activity with occasional lava effusions. The current eruption period began in December 2014 and has recently consisted of nighttime crater incandescence, ash emissions, and seismicity (BGVN 48:04). This report covers activity during April through September 2023 and describes occasional Strombolian activity, gas-and-ash emissions, and nighttime crater incandescence. Information for this report primarily comes from the Southern Andes Volcano Observatory (Observatorio Volcanológico de Los Andes del Sur, OVDAS), part of Chile's National Service of Geology and Mining (Servicio Nacional de Geología y Minería, SERNAGEOMIN) and satellite data.
Seismicity during April consisted of long period (LP) events and tremor (TRE); a total of 9,413 LP-type events and 759 TR-type events were detected throughout the month. Nighttime crater incandescence persisted and was visible in the degassing column. Sulfur dioxide data was obtained using Differential Absorption Optical Spectroscopy Equipment (DOAS) that showed an average value of 1,450 ± 198 tons per day (t/d) during 1-15 April and 1,129 ± 201 t/d during 16-30 April, with a maximum daily value of 2,784 t/d on 9 April. Gas-and-steam emissions of variable intensities rose above the active crater as high as 1.3 km above the crater on 13 April. Strombolian explosions were not observed and there was a slight decrease in the lava lake level.
There were 14,123 LP-type events and 727 TR-type events detected during May. According to sulfur dioxide measurements taken with DOAS equipment, the active crater emitted an average value of 1,826 ± 482 t/d during 1-15 May and 912 ± 41 t/d during 16-30 May, with a daily maximum value of 5,155 t/d on 13 May. Surveillance cameras showed continuous white gas-and-steam emissions that rose as high as 430 m above the crater on 27 May. Nighttime incandescence illuminated the gas column less than 300 m above the crater rim was and no pyroclastic emissions were reported. A landslide was identified on 13 May on the E flank of the volcano 50 m from the crater rim and extending 300 m away; SERNAGEOMIN noted that this event may have occurred on 12 May. During the morning of 27 and 28 May minor Strombolian explosions characterized by incandescent ejecta were recorded at the crater rim; the last reported Strombolian explosions had occurred at the end of March.
Seismic activity during June consisted of five volcano-tectonic (VT)-type events, 21,606 LP-type events, and 2,085 TR-type events. The average value of sulfur dioxide flux obtained by DOAS equipment was 1,420 ± 217 t/d during 1-15 June and 2,562 ± 804 t/d, with a maximum daily value of 4,810 t/d on 17 June. White gas-and-steam emissions rose less than 480 m above the crater; frequent nighttime crater incandescence was reflected in the degassing plume. On 12 June an emission rose 100 m above the crater and drifted NNW. On 15 June one or several emissions resulted in ashfall to the NE as far as 5.5 km from the crater, based on a Skysat satellite image. Several Strombolian explosions occurred within the crater; activity on 15 June was higher energy and ejected blocks 200-300 m on the NE slope. Surveillance cameras showed white gas-and-steam emissions rising 480 m above the crater on 16 June. On 19 and 24 June low-intensity Strombolian activity was observed, ejecting material as far as 200 m from the center of the crater to the E.
During July, seismicity included 29,319 LP-type events, 3,736 TR-type events, and two VT-type events. DOAS equipment recorded two days of sulfur dioxide emissions of 4,220 t/d and 1,009 t/d on 1 and 13 July, respectively. Constant nighttime incandescence was also recorded and was particularly noticeable when accompanied by eruptive columns on 12 and 16 July. Minor explosive events were detected in the crater. According to Skysat satellite images taken on 12, 13, and 16 July, ashfall deposits were identified 155 m S of the crater. According to POVI, incandescence was visible from two vents on the crater floor around 0336 on 12 July. Gas-and-ash emissions rose as high as 1.2 km above the crater on 13 July and drifted E and NW. A series of gas-and-steam pulses containing some ash deposited material on the upper E flank around 1551 on 13 July. During 16-31 July, average sulfur dioxide emissions of 1,679 ± 406 t/d were recorded, with a maximum daily value of 2,343 t/d on 28 July. Fine ash emissions were also reported on 16, 17, and 23 July.
Seismicity persisted during August, characterized by 27,011 LP-type events, 3,323 TR-type events, and three VT-type events. The average value of sulfur dioxide measurements taken during 1-15 August was 1,642 ± 270 t/d and 2,207 ± 4,549 t/d during 16-31 August, with a maximum daily value of 3,294 t/d on 27 August. Nighttime crater incandescence remained visible in degassing columns. White gas-and-steam emissions rose 480 m above the crater on 6 August. According to a Skysat satellite image from 6 August, ash accumulation was observed proximal to the crater and was mainly distributed toward the E slope. White gas-and-steam emissions rose 320 m above the crater on 26 August. Nighttime incandescence and Strombolian activity that generated ash emissions were reported on 27 August.
Seismicity during September was characterized by five VT-type events, 12,057 LP-type events, and 2,058 TR-type events. Nighttime incandescence persisted. On 2 September an ash emission rose 180 m above the crater and drifted SE at 1643 (figure 125) and a white gas-and-steam plume rose 320 m above the crater. According to the Buenos Aires VAAC, periods of continuous gas-and-ash emissions were visible in webcam images from 1830 on 2 September to 0110 on 3 September. Strombolian activity was observed on 2 September and during the early morning of 3 September, the latter event of which generated an ash emission that rose 60 m above the crater and drifted 100 m from the center of the crater to the NE and SW. Ashfall was reported to the SE and S as far as 750 m from the crater. The lava lake was active during 3-4 September and lava fountaining was visible for the first time since 26 March 2023, according to POVI. Fountains captured in webcam images at 2133 on 3 September and at 0054 on 4 September rose as high as 60 m above the crater rim and ejected material onto the upper W flank. Sulfur dioxide flux of 1,730 t/d and 1,281 t/d was measured on 3 and 4 September, respectively, according to data obtained by DOAS equipment.
Strong Strombolian activity and larger gas-and-ash plumes were reported during 18-20 September. On 18 September activity was also associated with energetic LP-type events and notable sulfur dioxide fluxes (as high as 4,277 t/d). On 19 September Strombolian activity and incandescence were observed. On 20 September at 0914 ash emissions rose 50 m above the crater and drifted SSE, accompanied by Strombolian activity that ejected material less than 100 m SSE, causing fall deposits on that respective flank. SERNAGEOMIN reported that a Planet Scope satellite image taken on 20 September showed the lava lake in the crater, measuring 32 m x 35 m and an area of 0.001 km2. Several ash emissions were recorded at 0841, 0910, 1251, 1306, 1312, 1315, and 1324 on 23 September and rose less than 150 m above the crater. The sulfur dioxide flux value was 698 t/d on 23 September and 1,097 t/d on 24 September. On 24 September the Volcanic Alert Level (VAL) was raised to Orange (the third level on a four-color scale). SENAPRED maintained the Alert Level at Yellow (the middle level on a three-color scale) for the communities of Villarrica, Pucón (16 km N), Curarrehue, and Panguipulli.
During 24-25 September there was an increase in seismic energy (observed at TR-events) and acoustic signals, characterized by 1 VT-type event, 213 LP-type events, and 124 TR-type events. Mainly white gas-and-steam emissions, in addition to occasional fine ash emissions were recorded. During the early morning of 25 September Strombolian explosions were reported and ejected material 250 m in all directions, though dominantly toward the NW. On 25 September the average value of sulfur dioxide flux was 760 t/d. Seismicity during 25-30 September consisted of five VT-type events, 1,937 LP-type events, and 456 TR-type events.
During 25-29 September moderate Strombolian activity was observed and ejected material as far as the crater rim. In addition, ash pulses lasting roughly 50 minutes were observed around 0700 and dispersed ENE. During 26-27 September a TR episode lasted 6.5 hours and was accompanied by discrete acoustic signals. Satellite images from 26 September showed a spatter cone on the crater floor with one vent that measured 10 x 14 m and a smaller vent about 35 m NE of the cone. SERNAGEOMIN reported an abundant number of bomb-sized blocks up to 150 m from the crater, as well as impact marks on the snow, which indicated explosive activity. A low-altitude ash emission was observed drifting NW around 1140 on 28 September, based on webcam images. Between 0620 and 0850 on 29 September an ash emission rose 60 m above the crater and drifted NW. During an overflight taken around 1000 on 29 September scientists observed molten material in the vent, a large accumulation of pyroclasts inside the crater, and energetic degassing, some of which contained a small amount of ash. Block-sized pyroclasts were deposited on the internal walls and near the crater, and a distal ash deposit was also visible. The average sulfur dioxide flux measured on 28 September was 344 t/d. Satellite images taken on 29 September ashfall was deposited roughly 3 km WNW from the crater and nighttime crater incandescence remained visible. The average sulfur dioxide flux value from 29 September was 199 t/d. On 30 September at 0740 a pulsating ash emission rose 1.1 km above the crater and drifted NNW (figure 126). Deposits on the S flank extended as far as 4.5 km from the crater rim, based on satellite images from 30 September.
Infrared MODIS satellite data processed by MIROVA (Middle InfraRed Observation of Volcanic Activity) showed intermittent thermal activity during April through September, with slightly stronger activity detected during late September (figure 127). Small clusters of thermal activity were detected during mid-June, early July, early August, and late September. According to the MODVOLC thermal alert system, a total of four thermal hotspots were detected on 7 July and 3 and 23 September. This activity was also intermittently captured in infrared satellite imagery on clear weather days (figure 128).
Geologic Background. The glacier-covered Villarrica stratovolcano, in the northern Lakes District of central Chile, is ~15 km south of the city of Pucon. A 2-km-wide caldera that formed about 3,500 years ago is located at the base of the presently active, dominantly basaltic to basaltic andesite cone at the NW margin of a 6-km-wide Pleistocene caldera. More than 30 scoria cones and fissure vents are present on the flanks. Plinian eruptions and pyroclastic flows that have extended up to 20 km from the volcano were produced during the Holocene. Lava flows up to 18 km long have issued from summit and flank vents. Eruptions documented since 1558 CE have consisted largely of mild-to-moderate explosive activity with occasional lava effusion. Glaciers cover 40 km2 of the volcano, and lahars have damaged towns on its flanks.
Information Contacts: Servicio Nacional de Geología y Minería (SERNAGEOMIN), Observatorio Volcanológico de Los Andes del Sur (OVDAS), Avda Sta María No. 0104, Santiago, Chile (URL: http://www.sernageomin.cl/); Proyecto Observación Villarrica Internet (POVI) (URL: http://www.povi.cl/); Sistema y Servicio Nacional de Prevención y Repuesta Ante Desastres (SENAPRED), Av. Beauchef 1671, Santiago, Chile (URL: https://web.senapred.cl/); Buenos Aires Volcanic Ash Advisory Center (VAAC), Servicio Meteorológico Nacional-Fuerza Aérea Argentina, 25 de mayo 658, Buenos Aires, Argentina (URL: http://www.smn.gov.ar/vaac/buenosaires/inicio.php); MIROVA (Middle InfraRed Observation of Volcanic Activity), a collaborative project between the Universities of Turin and Florence (Italy) supported by the Centre for Volcanic Risk of the Italian Civil Protection Department (URL: http://www.mirovaweb.it/); Hawai'i Institute of Geophysics and Planetology (HIGP) - MODVOLC Thermal Alerts System, School of Ocean and Earth Science and Technology (SOEST), Univ. of Hawai'i, 2525 Correa Road, Honolulu, HI 96822, USA (URL: http://modis.higp.hawaii.edu/); Copernicus Browser, Copernicus Data Space Ecosystem, European Space Agency (URL: https://dataspace.copernicus.eu/browser/).
Merapi (Indonesia) — October 2023 Cite this Report
Merapi
Indonesia
7.54°S, 110.446°E; summit elev. 2910 m
All times are local (unless otherwise noted)
Frequent incandescent avalanches during April-September 2023
Merapi, located just north of the major city of Yogyakarta in central Java, Indonesia, has had activity within the last 20 years characterized by pyroclastic flows and lahars accompanying growth and collapse of the steep-sided active summit lava dome. The current eruption period began in late December 2020 and has more recently consisted of ash plumes, intermittent incandescent avalanches of material, and pyroclastic flows (BGVN 48:04). This report covers activity during April through September 2023, based on information from Balai Penyelidikan dan Pengembangan Teknologi Kebencanaan Geologi (BPPTKG), the Center for Research and Development of Geological Disaster Technology, a branch of PVMBG which specifically monitors Merapi. Additional information comes from the Pusat Vulkanologi dan Mitigasi Bencana Geologi (PVMBG, also known as Indonesian Center for Volcanology and Geological Hazard Mitigation, CVGHM), MAGMA Indonesia, the Darwin Volcanic Ash Advisory Centre (VAAC), and various satellite data.
Activity during April through September 2023 primarily consisted of incandescent avalanches of material that mainly affected the SW and W flanks and traveled as far as 2.3 km from the summit (table 25) and white gas-and-steam emissions that rose 10-1,000 m above the crater.
Table 25. Monthly summary of avalanches and avalanche distances recorded at Merapi during April through September 2023. The number of reported avalanches does not include instances where possible avalanches were heard but could not be visually confirmed as a result of inclement weather. Data courtesy of BPPTKG (April-September 2023 daily reports).
| Month |
Average number of avalanches per day |
Distance avalanches traveled (m) |
| Apr 2023 |
19 |
1,200-2,000 |
| May 2023 |
22 |
500-2,000 |
| Jun 2023 |
18 |
1,200-2,000 |
| Jul 2023 |
30 |
300-2,000 |
| Aug 2023 |
25 |
400-2,300 |
| Sep 2023 |
23 |
600-2,000 |
BPPTKG reported that during April and May white gas-and-steam emissions rose 10-750 m above the crater, incandescent avalanches descended 500-2,000 m on the SW and W flanks (figure 135). Cloudy weather often prevented clear views of the summit, and sometimes avalanches could not be confirmed. According to a webcam image, a pyroclastic flow was visible on 17 April at 0531. During the week of 28 April and 4 May a pyroclastic flow was reported on the SW flank, traveling up to 2.5 km. According to a drone overflight taken on 17 May the SW lava dome volume was an estimated 2,372,800 cubic meters and the dome in the main crater was an estimated 2,337,300 cubic meters.
During June and July similar activity persisted with white gas-and-steam emissions rising 10-350 m above the crater and frequent incandescent avalanches that traveled 300-2,000 m down the SW, W, and S flanks (figure 136). Based on an analysis of aerial photos taken on 24 June the volume of the SW lava dome was approximately 2.5 million cubic meters. A pyroclastic flow was observed on 5 July that traveled 2.7 km on the SW flank. According to the Darwin VAAC multiple minor ash plumes were identified in satellite images on 19 July that rose to 3.7 km altitude and drifted S and SW. During 22, 25, and 26 July a total of 17 avalanches descended as far as 1.8 km on the S flank.
Frequent white gas-and-steam emissions continued during August and September, rising 10-450 m above the crater. Incandescent avalanches mainly affected the SW and W flanks and traveled 400-2,300 m from the vent (figure 137). An aerial survey conducted on 10 August was analyzed and reported that estimates of the SW dome volume was 2,764,300 cubic meters and the dome in the main crater was 2,369,800 cubic meters.
Frequent and moderate-power thermal activity continued throughout the reporting period, according to a MIROVA (Middle InfraRed Observation of Volcanic Activity) analysis of MODIS satellite data (figure 138). There was an increase in the number of detected anomalies during mid-May. The MODVOLC thermal algorithm recorded a total of 47 thermal hotspots: six during April, nine during May, eight during June, 15 during July, four during August, and five during September. Some of this activity was captured in infrared satellite imagery on clear weather days, sometimes accompanied by incandescent material on the SW flank (figure 139).
Geologic Background. Merapi, one of Indonesia's most active volcanoes, lies in one of the world's most densely populated areas and dominates the landscape immediately north of the major city of Yogyakarta. It is the youngest and southernmost of a volcanic chain extending NNW to Ungaran volcano. Growth of Old Merapi during the Pleistocene ended with major edifice collapse perhaps about 2,000 years ago, leaving a large arcuate scarp cutting the eroded older Batulawang volcano. Subsequent growth of the steep-sided Young Merapi edifice, its upper part unvegetated due to frequent activity, began SW of the earlier collapse scarp. Pyroclastic flows and lahars accompanying growth and collapse of the steep-sided active summit lava dome have devastated cultivated lands on the western-to-southern flanks and caused many fatalities.
Information Contacts: Balai Penyelidikan dan Pengembangan Teknologi Kebencanaan Geologi (BPPTKG), Center for Research and Development of Geological Disaster Technology (URL: http://merapi.bgl.esdm.go.id/, Twitter: @BPPTKG); MAGMA Indonesia, Kementerian Energi dan Sumber Daya Mineral (URL: https://magma.esdm.go.id/v1); Pusat Vulkanologi dan Mitigasi Bencana Geologi (PVMBG, also known as Indonesian Center for Volcanology and Geological Hazard Mitigation, CVGHM), Jalan Diponegoro 57, Bandung 40122, Indonesia (URL: http://www.vsi.esdm.go.id/); Darwin Volcanic Ash Advisory Centre (VAAC), Bureau of Meteorology, Northern Territory Regional Office, PO Box 40050, Casuarina, NT 0811, Australia (URL: http://www.bom.gov.au/info/vaac/); MIROVA (Middle InfraRed Observation of Volcanic Activity), a collaborative project between the Universities of Turin and Florence (Italy) supported by the Centre for Volcanic Risk of the Italian Civil Protection Department (URL: http://www.mirovaweb.it/); Hawai'i Institute of Geophysics and Planetology (HIGP) - MODVOLC Thermal Alerts System, School of Ocean and Earth Science and Technology (SOEST), Univ. of Hawai'i, 2525 Correa Road, Honolulu, HI 96822, USA (URL: http://modis.higp.hawaii.edu/); Copernicus Browser, Copernicus Data Space Ecosystem, European Space Agency (URL: https://dataspace.copernicus.eu/browser/); Øystein Lund Andersen (URL: https://www.oysteinlundandersen.com/, https://twitter.com/oysteinvolcano).
Ebeko
Russia
50.686°N, 156.014°E; summit elev. 1103 m
All times are local (unless otherwise noted)
Moderate explosive activity with ash plumes continued during June-November 2023
Ebeko, located on the N end of Paramushir Island in Russia’s Kuril Islands just S of the Kamchatka Peninsula, consists of three summit craters along a SSW-NNE line at the northern end of a complex of five volcanic cones. Observed eruptions date back to the late 18th century and have been characterized as small-to-moderate explosions from the summit crater, accompanied by intense fumarolic activity. The current eruptive period began in June 2022, consisting of frequent explosions, ash plumes, and thermal activity (BGVN 47:10, 48:06). This report covers similar activity during June-November 2023, based on information from the Kamchatka Volcanic Eruptions Response Team (KVERT) and satellite data.
Moderate explosive activity continued during June-November 2023 (figures 50 and 51). According to visual data from Severo-Kurilsk, explosions sent ash 2-3.5 km above the summit (3-4.5 km altitude) during most days during June through mid-September. Activity after mid-September was slightly weaker, with ash usually reaching less than 2 km above the summit. According to KVERT the volcano in October and November was, with a few exceptions, either quiet or obscured by clouds that prevented satellite observations. KVERT issued Volcano Observatory Notices for Aviation (VONA) on 8 and 12 June, 13 and 22 July, 3 and 21 August, and 31 October warning of potential aviation hazards from ash plumes drifting 3-15 km from the volcano. Based on satellite data, KVERT reported a persistent thermal anomaly whenever weather clouds permitted viewing.
Geologic Background. The flat-topped summit of the central cone of Ebeko volcano, one of the most active in the Kuril Islands, occupies the northern end of Paramushir Island. Three summit craters located along a SSW-NNE line form Ebeko volcano proper, at the northern end of a complex of five volcanic cones. Blocky lava flows extend west from Ebeko and SE from the neighboring Nezametnyi cone. The eastern part of the southern crater contains strong solfataras and a large boiling spring. The central crater is filled by a lake about 20 m deep whose shores are lined with steaming solfataras; the northern crater lies across a narrow, low barrier from the central crater and contains a small, cold crescentic lake. Historical activity, recorded since the late-18th century, has been restricted to small-to-moderate explosive eruptions from the summit craters. Intense fumarolic activity occurs in the summit craters, on the outer flanks of the cone, and in lateral explosion craters.
Information Contacts: Kamchatka Volcanic Eruptions Response Team (KVERT), Far Eastern Branch, Russian Academy of Sciences, 9 Piip Blvd., Petropavlovsk-Kamchatsky, 683006, Russia (URL: http://www.kscnet.ru/ivs/kvert/).
Search Bulletin Archive by Publication Date
Select a month and year from the drop-downs and click "Show Issue" to have that issue displayed in this tab.
The default month and year is the latest issue available.
Bulletin of the Global Volcanism Network - Volume 29, Number 03 (March 2004)
Managing Editor: Richard Wunderman
Ambrym (Vanuatu)
Abundant MODIS thermal alerts during March 2003-February 2004
Bagana (Papua New Guinea)
Abundant MODIS thermal alerts during March 2003-February 2004
Bezymianny (Russia)
Eruptions on 25 December 2002 and January 2004
Chillan, Nevados de (Chile)
A small eruption, the first since 1986, during August-September 2003
Egon (Indonesia)
29 January brings sudden eruptive onset, prompting rapid evacuations
Etna (Italy)
Ashfall with juvenile components, emitted gases, and seismic patterns imply magma ascent
Fournaise, Piton de la (France)
December 2003 lavas spread across 40% of Dolomieu crater floor
Karangetang (Indonesia)
Aviation report, stating ash to 7.5 km; seven MODIS alerts in ~ 1 year
NW Rota-1 (United States)
Minor submarine eruption seen at depth; quiet at West Rota caldera
Saunders (United Kingdom)
A MODIS thermal alert on 7 May 2003 (no secondary confirmation)
Sheveluch (Russia)
Lava dome growth and associated unrest
Stromboli (Italy)
Webcams at various wavelengths document increased explosions in February 2004
Suwanosejima (Japan)
Sporadic eruptions in 2003 and in January 2004, one to 2.4 km altitude
Whakaari/White Island (New Zealand)
Eruptions ceased in about 2002; crater lake rising
Yasur (Vanuatu)
500 explosions/day in March 2004; MODIS thermal alerts average about one per month
Ambrym
Vanuatu
16.25°S, 168.12°E; summit elev. 1334 m
All times are local (unless otherwise noted)
Abundant MODIS thermal alerts during March 2003-February 2004
Ambrym was last reported in BGVN 28:09, when details of activity observed during September 2003 visits were published. A daily summary of MODIS thermal alerts for the year ending February 2004 (table 1) suggests, subject to the limitations of thermal imaging (e.g. in times of heavy cloud), regular activity over the course of the year. No corroborative reports of activity have been received from the [Départment de la Géologie, des Mines et des Ressources,] or the Darwin Volcanic Ash Advisory Centre.
Table 1. Nights on which MODIS thermal alerts were recorded for Ambrym, for the year ending February 2004 . Thermal alerts recorded in daylight hours have been omitted for data reliability reasons (four cases). Data courtesy HIGP MODIS Thermal Alert System.
| Month |
Days with Thermal Alerts |
| Mar 2003 |
7, 21, 30 |
| Apr 2003 |
15, 17 |
| May 2003 |
1, 3, 17, 19, 20, 28 |
| Jun 2003 |
9, 15, 16, 29 |
| Jul 2003 |
29 |
| Aug 2003 |
21, 25 |
| Sep 2003 |
13, 15, 24 |
| Oct 2003 |
1, 3, 8, 10, 22, 24, 31 |
| Nov 2003 |
2 |
| Dec 2003 |
25, 27 |
| Jan 2004 |
7, 9, 12, 28 |
| Feb 2004 |
1, 3, 4, 10, 17, 19, 22, 28 |
Geologic Background. Ambrym, a large basaltic volcano with a 12-km-wide caldera, is one of the most active volcanoes of the New Hebrides Arc. A thick, almost exclusively pyroclastic sequence, initially dacitic then basaltic, overlies lava flows of a pre-caldera shield volcano. The caldera was formed during a major Plinian eruption with dacitic pyroclastic flows about 1,900 years ago. Post-caldera eruptions, primarily from Marum and Benbow cones, have partially filled the caldera floor and produced lava flows that ponded on the floor or overflowed through gaps in the caldera rim. Post-caldera eruptions have also formed a series of scoria cones and maars along a fissure system oriented ENE-WSW. Eruptions have apparently occurred almost yearly during historical time from cones within the caldera or from flank vents. However, from 1850 to 1950, reporting was mostly limited to extra-caldera eruptions that would have affected local populations.
Information Contacts: HIGP MODIS Thermal Alert System, Hawaii Institute of Geophysics and Planetology, School of Ocean and Earth Science and Technology, University of Hawaii at Manoa (URL: http://modis.higp.hawaii.edu/).
Bagana (Papua New Guinea) — March 2004 Cite this Report
Bagana
Papua New Guinea
6.137°S, 155.196°E; summit elev. 1855 m
All times are local (unless otherwise noted)
Abundant MODIS thermal alerts during March 2003-February 2004
Continued MODIS thermal alerts during March 2003-February 2004 (table 2) suggests that activity continued over the year ending February 2004. No corroborative reports of activity have been received from the Rabaul Volcano Observatory or the Darwin Volcanic Ash Advisory Centre.
Table 2. Nights on which MODIS thermal alerts were recorded for Bagana, for the year ending February 2004. Thermal alerts recorded in daylight hours have been omitted for data reliability reasons (one case on 23 October 2003). Data courtesy HIGP MODIS Thermal Alert System.
| Month |
Days with Thermal Alerts |
| Mar 2003 |
13, 19, 26, 31 |
| Apr 2003 |
2, 11, 18, 25 |
| May 2003 |
18, 20 |
| Jun 2003 |
19, 26 |
| Jul 2003 |
21, 23, 25 |
| Aug 2003 |
4, 6, 8, 13, 24, 29 |
| Sep 2003 |
16 |
| Oct 2003 |
2, 4, 07, 13, 18, 27 |
| Nov 2003 |
5, 10, 12 |
| Dec 2003 |
3 |
| Jan 2004 |
13, 15, 20, 24, 31 |
| Feb 2004 |
5 |
Geologic Background. Bagana volcano, in a remote portion of central Bougainville Island, is frequently active. This massive symmetrical cone was largely constructed by an accumulation of viscous andesitic lava flows. The entire edifice could have been constructed in about 300 years at its present rate of lava production. Eruptive activity is characterized by non-explosive effusion of viscous lava that maintains a small lava dome in the summit crater, although occasional explosive activity produces pyroclastic flows. Lava flows with tongue-shaped lobes up to 50 m thick and prominent levees descend the flanks on all sides.
Information Contacts: HIGP MODIS Thermal Alert System, Hawaii Institute of Geophysics and Planetology, School of Ocean and Earth Science and Technology, University of Hawaii at Manoa (URL: http://modis.higp.hawaii.edu/).
Bezymianny (Russia) — March 2004 Cite this Report
Bezymianny
Russia
55.972°N, 160.595°E; summit elev. 2882 m
All times are local (unless otherwise noted)
Eruptions on 25 December 2002 and January 2004
Kamchatka Volcanic Eruptions Response Team (KVERT) reports, through the Alaska Volcano Observatory (AVO), indicate that a weak thermal anomaly registered on satellite images following the 26 July 2003 eruption and continuing until an eruption on 14 January 2004.
January 2004 eruption. A shallow earthquake of local magnitude (Ml) 2.2 was reported at Bezymianny on 9 January. The eruption itself began at 1053 on 14 January, sending ash plumes to 6-8 km altitude to the ENE, decreasing to 3.5 km altitude later in the day. KVERT reported that a large pyroclastic flow probably formed on the ESE flank. On 15 January, gas-steam plumes rose to 100 m above the lava dome, increasing to 500 m on 16 January. A 2- to 8-pixel thermal anomaly registered on these days. Satellite images on the morning of 14 January showed ash clouds about 30 km wide extending 150 ENE km, increasing to 250-300 km ENE that afternoon. Meaningful seismic monitoring was thwarted during the eruption period due to high-level volcanic tremor at nearby Kliuchevskoi volcano. The eruption caused the hazard status to temporarily rise to the highest level (red).
KVERT weekly reports for the period from the 14 January eruption to 16 April indicate continuing unrest at Bezymianny. The lava dome was reported to be growing, with no detectable seismicity, gas-steam plumes were rising ~ 3-4 km and dispersing in the wind (generally to the S), and the number of pixels in thermal anomalies reduced from 1-4 early in the period to 1-2 late in the period.
25 December 2002 eruption. A substantial eruption at Bezymianny on 25 December 2002 was not reported in the Bulletin. That eruption followed a 1-pixel thermal anomaly on 23 December that increased to 7-10 pixels on 24-25 December, with seismicity slightly above background levels. Weak intermittent spasmodic tremor occurred on the 25th, when a very hot plume that probably contained ash was visible, and moderate explosive activity began around 1900. Seismic data revealed a large explosive eruption on 26 December at 0715. The resultant ash cloud rose to 5 km altitude. and deposited ash in Kozyrevsk, 55 km NW of Bezymianny. The eruption continued through the 27th, but activity decreased. On 1 January 2003 a weak thermal anomaly was noted over the volcano, probably reflecting a viscous lava flow on the dome.
Geologic Background. The modern Bezymianny, much smaller than its massive neighbors Kamen and Kliuchevskoi on the Kamchatka Peninsula, was formed about 4,700 years ago over a late-Pleistocene lava-dome complex and an edifice built about 11,000-7,000 years ago. Three periods of intensified activity have occurred during the past 3,000 years. The latest period, which was preceded by a 1,000-year quiescence, began with the dramatic 1955-56 eruption. This eruption, similar to that of St. Helens in 1980, produced a large open crater that was formed by collapse of the summit and an associated lateral blast. Subsequent episodic but ongoing lava-dome growth, accompanied by intermittent explosive activity and pyroclastic flows, has largely filled the 1956 crater.
Information Contacts: Olga Girina, Kamchatka Volcanic Eruptions Response Team (KVERT), a cooperative program of the Institute of Volcanic Geology and Geochemistry, Far East Division, Russian Academy of Sciences, Piip Ave. 9, Petropavlovsk-Kamchatsky, 683006, Russia, the Kamchatka Experimental and Methodical Seismological Department (KEMSD), GS RAS (Russia), and the Alaska Volcano Observatory (USA); Alaska Volcano Observatory (AVO), a cooperative program of the U.S. Geological Survey, 4200 University Drive, Anchorage, AK 99508-4667, USA (URL: http://www.avo.alaska.edu/), the Geophysical Institute, University of Alaska, PO Box 757320, Fairbanks, AK 99775-7320, USA, and the Alaska Division of Geological and Geophysical Surveys, 794 University Ave., Suite 200, Fairbanks, AK 99709, USA.
Nevados de Chillan (Chile) — March 2004 Cite this Report
Nevados de Chillan
Chile
36.868°S, 71.378°W; summit elev. 3180 m
All times are local (unless otherwise noted)
A small eruption, the first since 1986, during August-September 2003
Nevados de Chillán was active from 1973 through 1983; after that, phreatomagmatic eruptions were reported to have almost ended. A small (VEI 1) eruption, the first since 1986, was noted by local inhabitants and tourists in August-September 2003. Low magnitude explosive events occurred over the week ending 27 August 2003, sending brown-gray to white gas-and-ash columns up to heights of 500 m for periods of up to 25 minutes. Resulting deposits were ~ 1 cm deep over a sharply defined 2.2 km wide zone to the SSE. Prevailing winds were strong around the time of the eruption (figure 2). Explosions then became more sporadic, occurring at 2-3 day intervals, until ceasing in mid-September.
An inspection of the eruption site on 22 January 2004 by Servicio Nacional de Geoligica y Mineria scientists revealed a new compound, fissure-like, double crater in the saddle between the cones Nuevo (which erupted during 1906-1945) and Arrau (which erupted during 1973-1986) (figure 3). This new ~ 64 m long double crater consisted of a NW situated, 25 x 14 m crater and a SE situated, 39 x 28 m crater. These craters lie to the NW of Arrau cone and become surrounded by an area of intense fumaroles towards Nuevo cone. The fumaroles are water-vapor rich but give off a weak sulfur odor. On Nuevo's E side they had temperatures of up to 88°C (table 1). While no previous measurements were available, this area showed more intense fumarolic activity than seen during a January 1994 visit and 1998 air photographs. During the recent visit the local heat-flow appeared concentrated adjacent to Nuevo cone, rather than Arrau cone. This, and the fissure-like form of the 2003 crater, were taken as evidence for possible future eruptions closer to Nuevo cone.
Table 1. Site names, locations (as UTM coordinates), and fumarole temperatures describing conditions at Nevados de Chillán on 22 January 2004. The fumaroles were located near the 2003 vent. Courtesy of J.A. Naranjo and L.E. Lara, SERNAGEOMIN.
| Site |
UTM N |
UTM W |
Temperature (°C ± 0.5) |
| SW Nuevo flank |
288.086 |
5916.963 |
87.2 |
| E Nuevo rim |
288.138 |
5917.522 |
87.9 |
| Between craters |
288.263 |
5917.547 |
57.4 |
In addition to dispersal and deposition of loose ash, the January inspection noted agglutinates forming a series of 2 m long ridges or 'dunes' (figure 4). The agglutinates consisted of wet black clusters of ash spheres with 0.5- to 1-cm diameters. A large number of dead insects in the agglutinated ash suggested extreme conditions such as the presence of toxic gasses. When dry, the ash was dark gray with a lithic-rich polymodal composition. Particle sizes ranged from dust to 4-5 mm, of which 5-10% was coarse-grained, lithic-rich lapilli composed of black, gray, and red aphyric andesites and ~ 60% was fine- to medium-grained lapilli composed of lithic clasts, quartz, and plagioclase crystals. Below the 1 mm size range, black glassy shards appeared with cleaved vesicle surfaces and blocky or plate-like shapes. The remnant fraction was light-gray fine ash.
Reference. Naranjo, J.A., and Lara, L.E., 2004, August-September 2003 small vulcanian eruption at the Nevados de Chillán Volcanic Complex (36°50'S), Southern Andes (Chile). Revista Geológica de Chile, Vol. 31, No. 2, p. 359-366. DOI: 10.4067/S0716-02082004000200011.
Geologic Background. The compound volcano of Nevados de Chillán is one of the most active of the Central Andes. Three late-Pleistocene to Holocene stratovolcanoes were constructed along a NNW-SSE line within three nested Pleistocene calderas, which produced ignimbrite sheets extending more than 100 km into the Central Depression of Chile. The dominantly andesitic Cerro Blanco (Volcán Nevado) stratovolcano is located at the NW end of the massif. Volcán Viejo (Volcán Chillán), which was the main active vent during the 17th-19th centuries, occupies the SE end. The Volcán Nuevo lava-dome complex formed during 1906-1945 on the NW flank of Viejo. The Volcán Arrau dome complex was then constructed on the SE side of Volcán Nuevo between 1973 and 1986, and eventually exceeded its height. Smaller domes or cones are present in the 5-km valley between the two major edifices.
Information Contacts: Jose A. Naranjo and Luis E. Lara, Servicio Nacional de Geoligica y Mineria (SERNAGEOMIN), Av. Santa Maria 0104, Santiago, Chile.
Egon
Indonesia
8.676°S, 122.455°E; summit elev. 1661 m
All times are local (unless otherwise noted)
29 January brings sudden eruptive onset, prompting rapid evacuations
This first Bulletin report discussing Egon describes the sudden appearance of volcanic activity there in January 2004. Heavy rains fell over Egon and its surrounding area on 28 January. At 0400 on 29 January, local people heard the sound of the E crater wall collapsing inward. That was followed at 1700 by an explosion and a black ash cloud rising ~ 750 m above the summit. On 30-31 January further noise was followed by gray ash clouds and the odor of highly concentrated sulfur every 50-60 minutes. Visual observation on 31 January revealed a new solfatara.
Volcanic earthquakes were detected on 30 January (intensity III on the Modified Mercali (MMI) scale), and a seismometer installed on 31 January recorded a type-A deep-volcanic earthquake at 1610 and two harmonic tremor events (amplitude 0.5 mm) at 1800. At 2227 an explosion was heard and instrumentally recorded for about 70 seconds. On 1 February, instruments recorded two tremor events and one type-A volcanic earthquake. Egon was placed on Alert level 3 (on a 1-4 scale) on that day.
United Nations reports and news reports from around 31 January indicated that up to 6,400 people were being evacuated from near Egon volcano as a precautionary measure due to "smoke," ash, and other possible emissions. The news cited evacuations from the mountain villages of Hale, Hebing, Lere, Natakoli, Pedat, Bau Krengat, and Kelawair, with refugees going to Maumere (the island's main town, 25 km W of the summit). There were reports of 1 or 2 deaths, but it is not entirely clear that they were related to volcanic activity, evacuations, or other causes.
The European Volcanological Society (SVE) posted this report on the UN's Relief Web website: "One person has been reported killed from smoke and ash inhalation from the eruption of Egon volcano. Thick clouds of smoke and a great discharge of hot ash, large chunks of sulfur and volcanic rocks were seen nearby. The eruption caused panic among residents nearby, and they fled the mountain villages . . . . Eyewitnesses said the lower part of the crater was seen bursting and that was believed to be the main outlet for the hot lava that spewed from the volcano.."
Agence France-Presse published a photo (by Romeo Gacad) with a distant aerial view of Egon's summit as it appeared around sunset on 1 February. A thin plume rose gently above the summit. Lower portions of the photo were in cloud.
A 2 February 2004 United Nations (OCHA) report stated that "Volcanologists continue monitoring the activity of Mt. Egon closely. Since the beginning of February, a decrease in seismic activity and emissions has been registered." This and another UN report noted, as of 13 February ~ 5,000 people had been evacuated and had been accommodated in 14 temporary government shelters. The report went on to note "A gradual return of the evacuated population has already begun and is expected to continue if current conditions remain unchanged. As of 4 February some 600 people have already returned to their villages."
Geologic Background. Gunung Egon, also known as Namang, sits within the narrow section of eastern Flores Island. The barren, sparsely vegetated summit region has a 350-m-wide, 200-m-deep crater that sometimes contains a lake. Other small crater lakes occur on the flanks. A lava dome forms the southern summit. Solfataric activity occurs on the crater wall and rim and on the upper S flank. Reports of eruptive activity prior to explosive eruptions beginning in 2004 are unconfirmed. Emissions were often observed above the summit during 1888-1892. Strong emissions in 1907 reported by Sapper (1917) was considered by the Catalog of Active Volcanoes of the World (Neumann van Padang, 1951) to be an historical eruption, but Kemmerling (1929) noted that this was likely confused with an eruption on the same date and time from Lewotobi Lakilaki.
Information Contacts: Dali Ahmad, Hetty Triastuty, Nia Haerani, and Suswati, Directorate of Volcanology and Geological Hazards (formerly VSI), Jalan Diponegoro No 57, Bandung 40122, Indonesia (URL: http://www.vsi.esdm.go.id/); Dan Shackelford, 3124 E. Yorba Linda Blvd., Apt. H-33, Fullerton, CA 92831-2324, USA; United Nations, Office for the Coordination of Humanitarian Affairs (UN OCHA), S-3600, New York, NY 10017, USA (URL: https://reliefweb.int/); Henry Gaudru, Société Volcanologique Européenne (SVE), C.P.1-1211 Geneva 17- Switzerland (URL: http://www.sveurop.org/).
Etna
Italy
37.748°N, 14.999°E; summit elev. 3357 m
All times are local (unless otherwise noted)
Ashfall with juvenile components, emitted gases, and seismic patterns imply magma ascent
Since the cessation of the last eruption of Mount Etna on 28 January 2003, no further eruptive activity has been observed. Summit activity has been limited to pulsating gas emissions from the Northeast Crater (NEC) and from one of the two vents within Bocca Nuova (BN). The other central crater vents and the Southeast Crater (SEC) were essentially blocked and only producing extremely weak gas emissions.
The first significant variation from this very low level of activity was seen between 12 and 14 February 2004, when a weak ash emission was observed within the summit crater plume. A fresh ash sample was collected in Pedara, a village about 10 km SE from the summit. Del Carlo and Andronico (2004) reported that the sample was made up of material with a grain-size less than 0.125 mm. Components comprising the sample consisted of sideromelane (41.5%), tachylite (24.7%), loose crystals of clinopyroxene, olivine, and plagioclase (4%), and lithics (29.7%). The clasts of sideromelane were very vesiculated and made of light-brown, transparent and shiny glass. There were also a few strands of Pele's hair. Tachylites were black or gray, shiny, sub-angular clasts. Lithics comprised fragments of weathered scoria, lavas, or secondary minerals. The high amount of juvenile components within the ash were taken to suggests an uprise of magma into the summit feeder conduit, the first to occur since the end of the 2002-2003 flank eruption.
The INGV-CT Geochemistry group performed regular remote-sensing measurements of volcanic gas flux and chemical composition on Etna using COSPEC and FTIR instruments. Such measurements demonstrated that the upper conduit system of Mt Etna has been weakly supplied with magma since the end of the 2002-2003 eruption, an observation supported both by relatively low fluxes of SO2 and low molar ratios of SO2/HCl. Occasional discrete injections of magma into the upper conduit system have been observed, however, as sharp increases in both SO2 flux and SO2/HCl ratios. These inputs occurred in August 2003, December 2003, and in late January 2004.
The INGV-CT permanent seismic network consisted of ~ 40 stations, 10 of which were installed in October 2003 and have broad-band, 40-second-period sensors. After the end of the 2002-2003 flank eruption, seismicity was mainly concentrated along Etna's E and NE flanks, appearing in two main phases. Until the end of May 2003, earthquakes were localized along the same structures that were activated during the 2002-2003 eruption, suggesting a relaxation phase. During this phase, several swarms occurred mainly between 3 and 7 km depth, showing a progressive decrease in seismic energy. After June 2003, several shallow earthquakes were recorded along the upper eastern part of the volcanic edifice near Zafferana, and along the Pernicana fault on the NE flank. This second phase was characterized by a renewal of seismic activity, with several seismic swarms characterized by progressive release of seismic energy. In particular, during the last two months, the Pernicana Fault has been very active (UFS Weekly Reports, 2003 and 2004).
References. Del Carlo, P., and Andronico, D., 2004, Rapporto cenere Etna del 13-14/02/04: INGV-CT Internal Report, Prot. Int. no. UFVG2004/024, p 1. UFS INGV-CT Weekly Internal Reports, 2003 and 2004.
Geologic Background. Mount Etna, towering above Catania on the island of Sicily, has one of the world's longest documented records of volcanism, dating back to 1500 BCE. Historical lava flows of basaltic composition cover much of the surface of this massive volcano, whose edifice is the highest and most voluminous in Italy. The Mongibello stratovolcano, truncated by several small calderas, was constructed during the late Pleistocene and Holocene over an older shield volcano. The most prominent morphological feature of Etna is the Valle del Bove, a 5 x 10 km caldera open to the east. Two styles of eruptive activity typically occur, sometimes simultaneously. Persistent explosive eruptions, sometimes with minor lava emissions, take place from one or more summit craters. Flank vents, typically with higher effusion rates, are less frequently active and originate from fissures that open progressively downward from near the summit (usually accompanied by Strombolian eruptions at the upper end). Cinder cones are commonly constructed over the vents of lower-flank lava flows. Lava flows extend to the foot of the volcano on all sides and have reached the sea over a broad area on the SE flank.
Information Contacts: Sonia Calvari, Istituto Nazionale di Geofisica e Vulcanologia, Piazza Roma 2, 95123 Catania, Italy (URL: http://www.ct.ingv.it/).
Piton de la Fournaise (France) — March 2004 Cite this Report
Piton de la Fournaise
France
21.244°S, 55.708°E; summit elev. 2632 m
All times are local (unless otherwise noted)
December 2003 lavas spread across 40% of Dolomieu crater floor
BGVN 28:09 reported a seismic crisis and new SSW-flank fissure at Piton de la Fournaise on 30 September 2003. The Volcanological Observatory monitoring Piton de la Fournaise and the local press reported a further seismic crisis that developed on 7 December 2003 at 1429 beneath the summit. Following around an hour of seismicity, an eruption began on 7 December at 1535 in the Dolomieu crater, with lava fountaining to ten's of meters from two fractures on the SE crater floor. Two new fractures were also observed on the S crater rim that did not produce lava. The eruption decreased rapidly over the night of 7-8 December. By 8 December at about 1400 small incandescent lava flows and rock falls on the S crater wall were observed. By the night of 8 December the eruption ceased but strong degassing and fluctuating seismicity continued. New lava covered ~ 40% of the Dolomieu crater floor.
The eruption was preceded by a seismic swarm on 6 November that was followed by ~ 30 cm of steady uplift and 10-20 earthquakes recorded per day. As of 16 December, significant seismic activity continued, and hikers were permitted only limited access. Press reports indicated three quite active cones within the S rampart of the Dolomieu crater, surrounded by ejecta found more than 200 m N, noisy degassing, lava covering the bottom of the crater up to 5 m thick, and zigzag cracks crossing the crater's S exterior.
A further seismic event with significant surface deformation occurred over 7-9 January 2004.
[On 9 January eruption tremor started near Nez Coupé de Sainte Rose. A 300-m-long fissure, cutting the 1931 crater, produced a small ~2-km-long lava flow. The eruption stopped on 10 January around 1200.]
Geologic Background. Piton de la Fournaise is a massive basaltic shield volcano on the French island of Réunion in the western Indian Ocean. Much of its more than 530,000-year history overlapped with eruptions of the deeply dissected Piton des Neiges shield volcano to the NW. Three scarps formed at about 250,000, 65,000, and less than 5,000 years ago by progressive eastward slumping, leaving caldera-sized embayments open to the E and SE. Numerous pyroclastic cones are present on the floor of the scarps and their outer flanks. Most recorded eruptions have originated from the summit and flanks of Dolomieu, a 400-m-high lava shield that has grown within the youngest scarp, which is about 9 km wide and about 13 km from the western wall to the ocean on the E side. More than 150 eruptions, most of which have produced fluid basaltic lava flows, have occurred since the 17th century. Only six eruptions, in 1708, 1774, 1776, 1800, 1977, and 1986, have originated from fissures outside the scarps.
Information Contacts: Thomas Staudacher, Observatoire Volcanologique du Piton de la Fournaise Institut de Physique du Globe de Paris, 97418 La Plaine des Cafres, La Réunion, France (URL: http://www.ipgp.fr/fr/ovpf/observatoire-volcanologique-piton-de-fournaise).
Karangetang (Indonesia) — March 2004 Cite this Report
Karangetang
Indonesia
2.781°N, 125.407°E; summit elev. 1797 m
All times are local (unless otherwise noted)
Aviation report, stating ash to 7.5 km; seven MODIS alerts in ~ 1 year
A Darwin Volcanic Ash Advisory Centre report stated that at 0630 UTC (1430 local time) on 18 July 2003 pilots saw a thick ash plume rising from the volcano to ~ 8.5 km altitude.
HIGP MODIS thermal-alert reports for the year to 13 April 2004 showed, subject to the limitations of thermal imaging (e.g. in times of heavy cloud), thermal activity at the volcano on 26 April, 7 and 30 May, 1 and 6 June, 21 July and 11 August 2003, and 2 April 2004.
Geologic Background. Karangetang (Api Siau) volcano lies at the northern end of the island of Siau, about 125 km NNE of the NE-most point of Sulawesi. The stratovolcano contains five summit craters along a N-S line. It is one of Indonesia's most active volcanoes, with more than 40 eruptions recorded since 1675 and many additional small eruptions that were not documented (Neumann van Padang, 1951). Twentieth-century eruptions have included frequent explosive activity sometimes accompanied by pyroclastic flows and lahars. Lava dome growth has occurred in the summit craters; collapse of lava flow fronts have produced pyroclastic flows.
Information Contacts: HIGP MODIS Thermal Alert System, Hawaii Institute of Geophysics and Planetology, School of Ocean and Earth Science and Technology, University of Hawaii at Manoa (URL: http://modis.higp.hawaii.edu/); Darwin Volcanic Ash Advisory Centre (VAAC), Commonwealth Bureau of Meteorology, Northern Territory Regional Office, PO Box 40050, Casuarina, NT 0811, Australia (URL: http://www.bom.gov.au/info/vacc/).
NW Rota-1 (United States) — March 2004 Cite this Report
NW Rota-1
United States
14.601°N, 144.775°E; summit elev. -517 m
All times are local (unless otherwise noted)
Minor submarine eruption seen at depth; quiet at West Rota caldera
The research vessel Thomas G. Thompson conducted a survey of the Mariana Arc in the Commonwealth of the Northern Mariana Islands from 9 February to 5 March 2003 (Embley and others, 2004). That survey identified a number of hydrothermal systems (plumes) on the arc volcanoes. One volcano, detected in 2003 and named "NW Rota 1," was revisited in 2004 and again found to be actively venting (figure 1). That submarine volcano sits ~ 64 km NW of the island of Rota, with its summit at 14°36.048'N, 144°46.519'E (14.601°N, 144.775°E). Another volcano visited in 2003-2004 was an apparently quiet, non-erupting caldera lacking eruptive age constraints called "West Rota" (discussed at the end of this report). Most of the information gleaned from the 2004 cruise remains preliminary, coming from scientists still at sea.
The ship towed a conductivity-temperature-depth (CTD)/rosette system to map and sample hydrothermal plumes over NW Rota 1. The 2003 tow data detected a vigorous, 200-m-thick layer of hydrothermal plumes above the volcano's summit. Chemical analysis of the 2003 plumes found high concentrations of particulate aluminum, sulfur, iron, and manganese, along with elevated 3He, a helium isotope considered diagnostic of a magmatic source and associated hydrothermal discharge. The active crater's summit depth was ~ 517 m.
[During 27 March-18 April 2004], the RV Thompson revisited the Mariana Arc and found NW Rota 1 still vigorously active. William Chadwick and Robert Embley, National Oceanographic and Atmospheric Agency (NOAA), members of the cruise scientific staff, notified GVN that some video images from NW Rota 1 were taken with a ship-deployed remote vehicle (ROPOS-Remotely Operated Platform for Ocean Science). Videos posted on their web page showed views of the so-called "Brimstone Pit" (figures 2 and 3). Brimstone Pit represents a S-flank vent at a depth of 555 m, a spot ~ 40 m below the summit in rocky terrain. The videos and photos showed ash and sulfur bursts from the crater and a vent whose rim was covered with spatter (but probably not from this specific event). Water samples taken in a plume rising from the vent had temperatures of 30°C. Although incompletely mapped, the vent was roughly 20 m across and elliptical in outline; in the vertical dimension the vent appeared ~ 12 m deep and funnel-shaped.
During the ROPOS dive, the activity at the crater was variable. At the beginning of the dive there was only a wispy plume escaping, allowing the observers to see into the crater. Later in the dive, the crater returned to pulsing activity with bigger, more vigorous plumes and small rocks raining down on the crater rim. Over the summit, which was still at a depth of ~ 517 m below sea level (as it was in 2003), the ROPOS images depicted a lot of diffuse venting of clear fluids. Intense geyser-like discharges flowed from the vents with jets rising to several ten's of meters. Cloudy water rose to form a plume several hundred meters above the summit. The pulsating jets carried sand- to gravel-size particles (a few centimeters across), ejecta that rained down on the crater rim out to a distance of ~ 10 m. Droplets of molten sulfur in the jets gave a yellowish cast to the billowing clouds, suggesting a temperature of at least 100°C (figure 3). The ROPOS came up from the last dive covered in sand and gravel, and in sulfur droplets, which had solidified and adhered to the submersible's body!
In overview, the [30-31 March 2004] dives with ROPOS documented NW Rota 1 in a magmatic phase of activity. The active vent showed time-varying behavior that included precipitation of sulfur droplets from the venting fluids, pulses of ejecta from the vent, and large amounts of fresh, glassy ejecta surrounding the crater. In addition, the study identified a turbid plume extending ~ 0.7-2.0 km from the volcano, reflecting an intensity unseen in 2003, and presumably the result of the vigorous summit activity.
The large amount of sulfur was believed to be forming by interaction of magmatic SO2 with water to form elemental sulfur and sulfurous acids. Bob Embley suggested that this magmatic event was in the early stages, as evidenced by negligible alteration of glassy lavas in spite of incredibly corrosive hot fluids. Team biologists noted that biota had only begun to colonize the impacted area.
Volcanic seismicity may accompany this event, although its detection may require a network of near-source ocean-bottom seismometers. At least from initial looks at their data, geophysicists at the NOAA Vents Program failed to detect any T-phase hydroacoustic signals coming from this vicinity. It should be noted, however, that their real-time hydrophones are located in the NE Pacific at a great distance from the volcano.
In an effort to enlist other seismic and acoustical instruments, Olivier Hyvernaud (Laboratoire de Détection et de Géophysique, CEA/DASE/LDG; with access to the French Polynesian network), and Roderick Stewart (CTBTO, the Preparatory Commission for the comprehensive nuclear-test-ban treaty, with access to Juan Fernandez island data) have been contacted. Thus far it appears that their systems lacked signals clearly attributable to NW Rota 1.
West Rota. During early April 2004 the RV Thompson also visited another newly identified submarine volcano that the 2003 survey group named "West Rota" (~ 56 km W of the island of Rota). It appeared inactive, and lacked a strong hydrothermal plume in the waters above it. However, it contained features indicative of a violent explosive eruption at some unknown time in the (geologically) recent past; namely, felsic volcanic rocks and the formation of a big caldera. The West Rota caldera is comparable in size to Crater Lake, Oregon (figure 4). The cruise scientists suspect that this volcano erupted violently a few thousand, to ten's of thousands, of years ago.
References. Embley, R.W., Baker, E.T., Chadwick, Jr., W.W., Lupton, J.E., Resing, J.A., Massoth, G.J., and Nakamura, K., 2004, Explorations of Mariana Arc volcanoes reveal new hydrothermal systems: EOS-Transactions of the American Geophysical Union, v. 85, no. 4, p. 37 and 40.
Geologic Background. A submarine volcano detected during a 2003 NOAA bathymetric survey of the Mariana Island arc was found to be hydrothermally active and named NW Rota-1. The basaltic to basaltic andesite seamount rises to within 517 m of the ocean surface SW of Esmeralda Bank, 64 km NW of Rota Island and ~100 km N of Guam. When Northwest Rota-1 was revisited in 2004, a minor submarine eruption from a vent named Brimstone Pit on the upper south flank about 40 m below the summit intermittently ejected a plume several hundred meters high containing ash, rock particles, and molten sulfur droplets that adhered to the surface of the remotely operated submersible vehicle. The active vent was funnel-shaped, about 20 m wide and 12 m deep. Prominent structural lineaments about a kilometer apart cut across the summit of the edifice and down the NE and SW flanks.
Information Contacts: William W. Chadwick, Jr., Cooperative Institute for Marine Resources Studies (CIMRS), NOAA Pacific Marine Environmental Laboratory (PMEL), 2115 SE OSU Drive, Newport, OR 97365 USA; Robert W. Embley, NOAA Pacific Marine Environmental Laboratory (PMEL), 2115 SE OSU Drive, Newport, OR 97365 USA (URL: http://oceanexplorer.noaa.gov/explorations/04fire/welcome.html); Douglas Wiens, Department of Earth and Planetary Sciences, Washington University, Campus Box 1169, One Brookings Drive, Saint Louis, MO 63130-4899, USA (URL: http://epsc.wustl.edu/seismology/).
Saunders (United Kingdom) — March 2004 Cite this Report
Saunders
United Kingdom
57.8°S, 26.483°W; summit elev. 843 m
All times are local (unless otherwise noted)
A MODIS thermal alert on 7 May 2003 (no secondary confirmation)
The only previous report on the remote Michael volcano was in BGVN 28:02, which commented on a lava lake detected by satellite imagery over the period 1995-2002. A review of MODIS data for the period from that report (end 2002) to 16 March 2004 (UTC) reveals one thermal alert, on 7 May 2003 (UTC). No corroborative report is available, although previous alerts were interpreted as possibly representing lava lake activity.
Geologic Background. Saunders Island consists of a large central volcanic edifice intersected by two seamount chains, as shown by bathymetric mapping (Leat et al., 2013). The young Mount Michael stratovolcano dominates the glacier-covered island, while two submarine plateaus, Harpers Bank and Saunders Bank, extend north. The symmetrical Michael has a 500-m-wide summit crater and a remnant of a somma rim to the SE. Tephra layers visible in ice cliffs surrounding the island are evidence of recent eruptions. Ash clouds were reported from the summit crater in 1819, and an effusive eruption was inferred to have occurred from a N-flank fissure around the end of the 19th century and beginning of the 20th century. A low ice-free lava platform, Blackstone Plain, is located on the north coast, surrounding a group of former sea stacks. A cluster of cones on the SE flank, the Ashen Hills, appear to have been modified since 1820 (LeMasurier and Thomson, 1990). Analysis of satellite imagery available since 1989 (Gray et al., 2019; MODVOLC) suggests frequent eruptive activity (when weather conditions allow), volcanic clouds, steam plumes, and thermal anomalies indicative of a persistent, or at least frequently active, lava lake in the summit crater. Due to this observational bias, there has been a presumption when defining eruptive periods that activity has been ongoing unless there is no evidence for at least 10 months.
Information Contacts: Rob Wright, Luke Flynn, and Eric Pilger; MODIS Thermal Alert System, Hawaii Institute of Geophysics and Planetology (HIGP), School of Ocean and Earth Science and Technology, University of Hawaii at Manoa (URL: http://modis.higp.hawaii.edu/).
Sheveluch
Russia
56.653°N, 161.36°E; summit elev. 3283 m
All times are local (unless otherwise noted)
Lava dome growth and associated unrest
Unrest at Shiveluch continued from 1 January through 9 April 2004, including above-background seismicity and lava-dome growth with associated pyroclastic flows. Gas-and-steam plumes rising as high as 4.5 km altitude and ash plumes rising to 4-6 km altitude were frequent. Plumes were noted as far as 175 km from the volcano. During the period, US and Russian satellites repeatedly detected thermal anomalies. For viewers on the ground the volcano was obscured by clouds throughout much of the period.
Earthquakes occurred at depths of 0-5 km with local magnitudes (Ml) of 1.25-2.6. About 70 shallow earthquakes with Ml over 1.75 occurred during the week ending 16 January. These were exceeded the following week by 206 earthquakes with Ml of 1.75-2.6 and about 40 ash explosions. Intermittent spasmodic volcanic tremors of 0.5-1.0 µm/s were also recorded that week. These events caused the level of concern to raise from Yellow to Orange, where it remained throughout the remainder of the report period.
Accompanying these events were pyroclastic flows with run-out distances of 1-2 km. Ash plumes rose as high as 6 km, extending in various directions for several kilometers. Gas-and-steam plumes rose to 3.5-4.5 km. One extended 50 km to the SE on 22 January while another, on 26 January, extended over 75 km to the SW.
Events and activities similar to those described above were noted throughout the report period. Shallow earthquakes were recorded almost daily through February, >10/week was typical except for the period in late January noted earlier. However, during late February and through March and April, strong earthquakes occurred, numbering 14-24 per week. Spasmodic volcanic tremor was registered throughout this latter period, attaining a maximum velocity of 0.8 µm/s during 4-6 March.
Gas-and-steam plumes, some containing ash and extending as far as 175 km, were noted throughout the period. During the beginning of April, one ash-gas explosion delivered ash up to 9.0 km while 13 other explosions sent plumes up to 4.0-7.2 km and spasmodic tremor with velocities of 0.2-0.7 µm/s was recorded.
Geologic Background. The high, isolated massif of Sheveluch volcano (also spelled Shiveluch) rises above the lowlands NNE of the Kliuchevskaya volcano group. The 1,300 km3 andesitic volcano is one of Kamchatka's largest and most active volcanic structures, with at least 60 large eruptions during the Holocene. The summit of roughly 65,000-year-old Stary Shiveluch is truncated by a broad 9-km-wide late-Pleistocene caldera breached to the south. Many lava domes occur on its outer flanks. The Molodoy Shiveluch lava dome complex was constructed during the Holocene within the large open caldera; Holocene lava dome extrusion also took place on the flanks of Stary Shiveluch. Widespread tephra layers from these eruptions have provided valuable time markers for dating volcanic events in Kamchatka. Frequent collapses of dome complexes, most recently in 1964, have produced debris avalanches whose deposits cover much of the floor of the breached caldera.
Information Contacts: Olga Girina, Kamchatka Volcanic Eruptions Response Team (KVERT), a cooperative program of the Institute of Volcanic Geology and Geochemistry, Far East Division, Russian Academy of Sciences, Piip Ave. 9, Petropavlovsk-Kamchatsky, 683006, Russia, the Kamchatka Experimental and Methodical Seismological Department (KEMSD), GS RAS (Russia), and the Alaska Volcano Observatory (USA); Alaska Volcano Observatory (AVO), a cooperative program of the U.S. Geological Survey, 4200 University Drive, Anchorage, AK 99508-4667, USA (URL: http://www.avo.alaska.edu/), the Geophysical Institute, University of Alaska, PO Box 757320, Fairbanks, AK 99775-7320, USA, and the Alaska Division of Geological and Geophysical Surveys, 794 University Ave., Suite 200, Fairbanks, AK 99709, USA.
Stromboli
Italy
38.789°N, 15.213°E; summit elev. 924 m
All times are local (unless otherwise noted)
Webcams at various wavelengths document increased explosions in February 2004
Explosive activity at the summit craters of Stromboli volcano resumed in early June 2003, before the end of the effusive eruption that finished between 21 and 22 July 2003. Eruptive activity at this volcano is monitored by Istituto Nazionale di Geofisica e Vulcanologia (INGV-CT). They have installed two web cameras at an elevation of 920 m on Il Pizzo Sopra la Fossa and at an elevation of 400 m along the E margin of the Sciara del Fuoco, the depression on the N flank of the volcano. Additionally, a web thermal camera is located at the 400-m elevation site noted above, and a web infrared camera is positioned at Il Pizzo Sopra la Fossa. The 2 cameras (thermal and video) at the 400-m elevation site give important insights when visibility is insufficient at the more distant cameras. The infrared camera at Il Pizzo provides both a continuous view of the activity at the summit craters and a quantification of the energy released by the explosions at the three summit craters through an automated system called VAMOS (Cristaldi and others, 2004).
According to aviation reports from the U.S. Air Force, the web camera at Stromboli captured shots of light ash emissions on 7 and 11 November 2003. In both cases plumes rose to ~ 2.5 km altitude. According to the Toulouse VAAC the Stromboli Web video camera showed a small explosion on 10 December that produced a plume to a height of ~ 1 km above the volcano. No ash was visible on satellite imagery.
According to the INGV-CT, explosive activity at the three summit craters increased after 10 February 2004, leading to a significant growth of the cinder cones inside the craters. Several powerful explosions, especially from crater 1 (the NE-crater) and crater 3 (the SW-crater) carried scoriae 200 m above the craters. These explosions led to fallout of fresh bombs and lapilli on Il Pizzo Sopra la Fossa (the top of the volcano, ~ 100 m above the crater terrace) in early March. Samples of lapilli and scoriae collected on Stromboli by local guides have been analyzed with the scanning electron microscope and microanalysis instruments of INGV-CT (Corsaro and others, 2004). Measurements of glass compositions indicated that products erupted until 25 February 2004 are related to the black scoriaceous volcanics normally erupted during Strombolian activity. Golden basaltic pumices were absent from available samples; such pumices at this volcano have been generally associated with paroxysmal explosive events (Bertagnini and others, 1999) such as that of 5 April 2003. Analysis of components carried out on several ash samples allowed scientists at INGV-CT to recognize sideromelane and tachylite as the main components, making up ~ 80% of the erupted ash (Andronico and others, 2004). The activity of this volcano as of 8 March 2004 can be described, fittingly, as Strombolian with variations in the number and frequency of explosions within normally observed limits, and intensity of explosions at the higher limit of commonly observed activity.
References. Andronico, D., Caruso, S., Cristaldi, A., and Del Carlo, P., 2004, Caratterizzazione delle ceneri emesse dallo Stromboli nel Gennaio-Febbraio 2004: INGV-CT Internal Report, Prot. int. n° UFVG2004/034.
Corsaro, R.A., Miraglia, L., and Zanon, V., 2004, Caratterizzazione dei vetri presenti nei prodotti emessi dallo Stromboli durante il mese di febbraio: 2004 INGV-CT Internal Report, Prot. int. UFVG2004/033.
Cristaldi, A., Contelli, M., and Mangiagli, S., 2004, Rapporto settimanale sull'attivit eruttiva dello Stromboli: 22-29 Febbraio 2004. INGV-CT Internal Report, Prot. int. n° UFVG2004/031 [download at http://www.ct.ingv.it/].
Bertagnini, A., Coltelli, M., Landi, P., Pompilio, M., and Rosi, M., 1999, Violent explosions yield new insights into dynamics of Stromboli volcano. Eos, American Geophysical Union Transactions, 80, 52: 633-636.
Geologic Background. Spectacular incandescent nighttime explosions at Stromboli have long attracted visitors to the "Lighthouse of the Mediterranean" in the NE Aeolian Islands. This volcano has lent its name to the frequent mild explosive activity that has characterized its eruptions throughout much of historical time. The small island is the emergent summit of a volcano that grew in two main eruptive cycles, the last of which formed the western portion of the island. The Neostromboli eruptive period took place between about 13,000 and 5,000 years ago. The active summit vents are located at the head of the Sciara del Fuoco, a prominent scarp that formed about 5,000 years ago due to a series of slope failures which extends to below sea level. The modern volcano has been constructed within this scarp, which funnels pyroclastic ejecta and lava flows to the NW. Essentially continuous mild Strombolian explosions, sometimes accompanied by lava flows, have been recorded for more than a millennium.
Information Contacts: Sonia Calvari, Istituto Nazionale di Geofisica e Vulcanologia, Piazza Roma 2, 95123 Catania, Italy (URL: http://www.ct.ingv.it/); Charles Holliday, Air Force Weather Agency (AFWA), Satellite Applications Branch, Offutt AFB, NE 68113-4039, USA.
Suwanosejima (Japan) — March 2004 Cite this Report
Suwanosejima
Japan
29.638°N, 129.714°E; summit elev. 796 m
All times are local (unless otherwise noted)
Sporadic eruptions in 2003 and in January 2004, one to 2.4 km altitude
Suwanose-jima volcano was last reported in BGVN 28:04, when activity was noted in September and December 2002, with thermal anomalies continuing into January 2003. HIGP MODIS thermal imagery revealed only one alert in the year to 13 April 2004, that being on 4 July 2003. NASA Terra and Defense Meteorological Satellite Program imagery dated 7-8 November 2003 showed an ash plume rising from Suwanose-jima to an estimated height of 2,400 m (figure 10) on those days.
According to Tokyo VAAC reports, using information from the Japanese Meteorological Agency, explosions also took place at Suwanose-jima on 15 December 2003 at 1946, and 21 December at 1828, each of which produced plumes to an unknown height. The VAAC reported several small emissions on 27 and 28 December, again rising to unknown heights and an eruption on 28 December at 0820 rising to ~ 1.5 km altitude and extending E. On 2, 4 and 21-22 January 2004 small explosions produced ash plumes to unknown heights.
Geologic Background. The 8-km-long island of Suwanosejima in the northern Ryukyu Islands consists of an andesitic stratovolcano with two active summit craters. The summit is truncated by a large breached crater extending to the sea on the E flank that was formed by edifice collapse. One of Japan's most frequently active volcanoes, it was in a state of intermittent Strombolian activity from Otake, the NE summit crater, between 1949 and 1996, after which periods of inactivity lengthened. The largest recorded eruption took place in 1813-14, when thick scoria deposits covered residential areas, and the SW crater produced two lava flows that reached the western coast. At the end of the eruption the summit of Otake collapsed, forming a large debris avalanche and creating an open collapse scarp extending to the eastern coast. The island remained uninhabited for about 70 years after the 1813-1814 eruption. Lava flows reached the eastern coast of the island in 1884. Only about 50 people live on the island.
Information Contacts: Japan Meteorological Agency (JMA), Volcanological Division 1-3-4 Ote-machi, Chiyoda-ku, Tokyo 100, Japan (URL: http://www.jma.go.jp/); HIGP MODIS Thermal Alert System, Hawaii Institute of Geophysics and Planetology, School of Ocean and Earth Science and Technology, University of Hawaii at Manoa (URL: http://modis.higp.hawaii.edu/); Charles Holliday, Air Force Weather Agency (AFWA), Satellite Applications Branch, Offutt AFB, NE 68113-4039, USA.
Whakaari/White Island (New Zealand) — March 2004 Cite this Report
Whakaari/White Island
New Zealand
37.52°S, 177.18°E; summit elev. 294 m
All times are local (unless otherwise noted)
Eruptions ceased in about 2002; crater lake rising
An April 2004 note from New Zealand geothermal geologist Ashley Cody noted that White Island had essentially ceased its eruptive episode since about 2002, when it began to emit only very weak gas (lacking ejecta). Accordingly, compared to several years ago, there has been little to report about it. However, the Institute of Geological & Nuclear Sciences (GNS) still monitors White Island seismically, and with the Geonet web camera (visible real-time on the net). This report contains a summary of their brief reports. An issue of current interest is the continued growth of the crater lake. Crater lake growth was previously reported in February and August 2003 (BGVN 28:02 and 28:08).
GNS reports warned that "should there be no significant eruptive activity within the next 18-24 months and the lake continues to fill, it may reach overflow level. In this situation water may overflow into drainage channels on Peg 12 Flat, S of the 1978/90 Crater Complex, and these channels may further erode . . . ."
Steve O'Meara of Volcano Watch International visited White Island on 8 February 2004 (figure 44) and noted considerably weaker fumarolic activity than during an earlier trip in 2000 (figure 45). Hydrothermal activity, though diminished, was still taking place in the crater and steam often lifted off the lake's surface, which effervesced. Scum was weakly present, especially around the lake's edges, but he did not see as much as during his 2000 visit. Volcanic bombs and explosion debris surrounded the crater. Although O'Meara's professionally-guided tour was conducted skillfully and with genuine regard for safety, he expressed concern about a sudden eruption from the lake catching onlookers off guard.
A 13 February 2004 report from the GNS stated that heavy rainfall on White Island during the past few weeks triggered many small landslides inside the crater rim. They went on to note that the lake continued to fill steadily and last week all of the temporary marker posts were submerged or had washed into the lake. This week, GNS volcanologists had visited the island to install six more survey posts inside the main crater, so changes in the lake's level could continue to be monitored. The lake temperature was 57°C, similar to values measured during the last six months. A 26 March report noted a decrease in the rate of rainfall and consequent drop in the rate of filling of the crater lake. GNS reports on 2 April and 26 March also mentioned minor seismic activity, which was described in more detail in a 19 March report as "including a few very small, discrete earthquakes but no volcanic tremor."
The GNS report for 30 April 2004 stated that "seismic and hydrothermal activity at White Island remain at a low level. The crater lake was then [12-]13.6 m below the level at which it will overflow. White Island also remains at Alert Level 1 (some signs of volcano unrest)." An overview of late 2002-early 2004 GNS data appears on table 11. There were no HIGP-MODIS thermal alert warnings for White Island over the 12 months to April 2004.
Table 11. A summary of the Institute of Geological & Nuclear Sciences (GNS) reports discussing White Island, October 2002 to April 2004. Courtesy of GNS.
| Month |
Seismicity |
Emission levels |
Comment |
| Oct 2002 |
-- |
63 metric tons of SO2 / day (t/d) |
-- |
| Nov 2002 |
Minor weak volcanic tremor |
Weak steam / gas emissions |
-- |
| Dec 2002 |
Minor weak volcanic tremor |
Weak steam / gas emissions; 112 t/d SO2 |
-- |
| Jan 2003 |
Moderate/weak volcanic tremor |
Weak steam / gas emissions |
-- |
| Feb 2003 |
Low / minor volcanic tremor |
Minor weak steam / gas emissions; 269 t/d SO2 |
Increased tremor (with exception of 17 Feb) |
| Mar 2003 |
Low levels of weak tremor |
Low steam / gas emissions; 267 t/d SO2 |
-- |
| Apr 2003 |
Low / negligible |
Weak / very weak steam / gas plumes |
Active vent flooded, reducing emissions and seismicity |
| May 2003 |
Very low |
Unchanged |
-- |
| Jun 2003 |
Intermittent low-level activity |
Minor steam / gas plume |
-- |
| Jul 2003 |
Very low |
Plume no longer visible |
Light green water, 30 m below rim; 58°C. Fumaroles 101-114°C |
| Aug 2003 |
Low |
-- |
Water 53°C, 300 m long lake. Active monitoring of water level begins. |
Geologic Background. The uninhabited Whakaari/White Island is the 2 x 2.4 km emergent summit of a 16 x 18 km submarine volcano in the Bay of Plenty about 50 km offshore of North Island. The island consists of two overlapping andesitic-to-dacitic stratovolcanoes. The SE side of the crater is open at sea level, with the recent activity centered about 1 km from the shore close to the rear crater wall. Volckner Rocks, sea stacks that are remnants of a lava dome, lie 5 km NW. Descriptions of volcanism since 1826 have included intermittent moderate phreatic, phreatomagmatic, and Strombolian eruptions; activity there also forms a prominent part of Maori legends. The formation of many new vents during the 19th and 20th centuries caused rapid changes in crater floor topography. Collapse of the crater wall in 1914 produced a debris avalanche that buried buildings and workers at a sulfur-mining project. Explosive activity in December 2019 took place while tourists were present, resulting in many fatalities. The official government name Whakaari/White Island is a combination of the full Maori name of Te Puia o Whakaari ("The Dramatic Volcano") and White Island (referencing the constant steam plume) given by Captain James Cook in 1769.
Information Contacts: Institute of Geological & Nuclear Sciences (GNS), Private Bag 2000, Wairakwi, New Zealand (URL: http://www.gns/cri.nz); GeoNet, a project sponsored by the New Zealand Government through these agencies: Earthquake Commission (E.C.), Geological & Nuclear Sciences (GNS), and Foundation for Research, Science & Technology (FAST). Geonet can be contacted at the above GNS address (their URL: http://www.geonet.org.nz/contact.htm); Steve and Donna O'Meara, Volcano Watch International, PO Box 218, Volcano, HI 96785.
Yasur
Vanuatu
19.532°S, 169.447°E; summit elev. 361 m
All times are local (unless otherwise noted)
500 explosions/day in March 2004; MODIS thermal alerts average about one per month
Activity from the summit crater at Yasur continued through 2002 (BGVN 28:01). While similar comprehensive reports are not available for 2003, MODIS data (table 2) indicated activity continuing over the year to 16 March 2004. No corroborative reports of activity have been received from the Rabaul Volcano Observatory or the Darwin Volcanic Ash Advisory Centre.
Table 2. Nights on which MODIS thermal alerts were recorded for Yasur during the year ending 16 March 2004. Data courtesy HIGP MODIS Thermal Alert System.
| Month |
Days with Thermal Alerts |
| Mar 2003 |
23 |
| Apr 2003 |
15 |
| May 2003 |
3, 10 |
| Jun 2003 |
4 |
| Sep 2003 |
8, 17 |
| Oct 2003 |
17, 24, 26 |
| Nov 2003 |
5, 10, 12 |
| Mar 2004 |
13 |
John Seach reported continued eruptions at Yasur during March 2004. He suggested that there was an average of about 500 explosions per day, which is typical of the volcano's normal state of activity.
Geologic Background. Yasur has exhibited essentially continuous Strombolian and Vulcanian activity at least since Captain Cook observed ash eruptions in 1774. This style of activity may have continued for the past 800 years. Located at the SE tip of Tanna Island in Vanuatu, this pyroclastic cone has a nearly circular, 400-m-wide summit crater. The active cone is largely contained within the small Yenkahe caldera, and is the youngest of a group of Holocene volcanic centers constructed over the down-dropped NE flank of the Pleistocene Tukosmeru volcano. The Yenkahe horst is located within the Siwi ring fracture, a 4-km-wide open feature associated with eruption of the andesitic Siwi pyroclastic sequence. Active tectonism along the Yenkahe horst accompanying eruptions has raised Port Resolution harbor more than 20 m during the past century.
Information Contacts: HIGP MODIS Thermal Alert System, Hawaii Institute of Geophysics and Planetology, School of Ocean and Earth Science and Technology, University of Hawaii at Manoa (URL: http://modis.higp.hawaii.edu/); John Seach, PO Box 4025, Port Vila, Vanuatu (URL: http://www.volcanolive.com/).